
I’ve been playing around with building some Stock Tracking tools for Excel and I’ve learned a lot about how to query data from Yahoo! Finances API to get it into Excel while it’s all fresh in my memory, I figured I would take some time and document some of the techniques I’ve been using in my spreadsheets.
Breakdown Of The Yahoo! Finance Query URL
The premise behind how you query stock information in your web browser ultimately boils down to the URL address. Here is the standard URL address formula with two inputs (the Ticker Symbol and the Data Type).
https://download.finance.yahoo.com/d/quotes.csv?s= [Ticker Symbol] &f= [Data Type]
A Few Examples
To get this data from a web address into an Excel spreadsheet, we can use the WEBSERVICE() function. I’ll also wrap a NUMBERVALUE() function around to convert the import text from Yahoo! Finance into a numerical value we can use inside Excel.
Example 1: Pull The «Current Stock Price» for Microsoft’s Stock
=NUMBERVALUE(WEBSERVICE(«https://download.finance.yahoo.com/d/quotes.csv?s=MSFT&f=l1«))
Example 2: Pull The «Current Dividend» for Microsoft’s Stock
=NUMBERVALUE(WEBSERVICE(«https://download.finance.yahoo.com/d/quotes.csv?s=MSFT&f=d«))
Example 3: Pull «% change From 52 Week Low» for Microsoft
This one is a little bit trickier because the results from the url have a plus sign or a negative sign in front of the resulting % change which the NUMBERVALUE() function does not like. In the following formula, I am taking the result from Yahoo! finance and removing the first character (ie +/-) from the result.
=NUMBERVALUE(REPLACE(WEBSERVICE(«https://download.finance.yahoo.com/d/quotes.csv?s=MSFT&f=j6«),1,1,»»))
Example 4: Link your Ticker Symbols to a Spreadsheet Cell
If you want to use the same formula for a bunch of different ticker symbols, you can link your formula using a cell reference. Here is the same formula from Example 1, however it is now point to a ticker symbol in cell A2.
=NUMBERVALUE(WEBSERVICE(«https://download.finance.yahoo.com/d/quotes.csv?s=» & A2 & «&f=l1«))
Data Type Tables
Yahoo! has a whole collection of data points you can pull about a specific ticker symbol. Here is a list of the variables and what they pull in:
I’m not sure what the end goal is for this move, maybe they will begin offerring a paid service in the future. Due to this recent event, the below VBA code to pull historical data from Yahoo! finance will not long work unless they bring back the old API method.
Yahoo! Finance has a ton of historical data for stocks and harnessing VBA’s automating power to pull this data in seconds can allow you to perform some unbelievable tailor-made analysis. Let’s take this very simple setup in Excel where we have the Stock Ticker in Cell B2 and the Start/End date range you want to pull in Cell C4 and Cell F4 respectively. Also, the Excel Table is named «StockTable».
See if you can follow along with the VBA as it pulls data directly from Yahoo! Finance and places it into Excel. There is a little extra clean up you need to do since the query is pulled into excel as a CSV (comma separated values) data set.
ALSO NOTE: Through some testing, it seems you will need to have at least one extra column in your table (ie the black section in the image above) in order to retain the Table Object after the VBA performs the TextToColumns function. You can just leave this extra column blank if you do not need to perform any extra calculations.
Sub YahooFinanceQuery()
‘PURPOSE: Pull Historical Stock Data From Yahoo! Finance
‘SOURCE: www.TheSpreadsheetGuru.com
Dim EndDate As Date
Dim StartDate As Date
Dim StockTicker As String
Dim QueryURL As String
Dim QueryDataRange As Range
Dim QueryLocation As Range
Dim tbl As ListObject
‘Optimize Code
Application.ScreenUpdating = False
Application.DisplayAlerts = False
‘Query Parameters
StartDate = Range(«C4»).Value
EndDate = Range(«F4»).Value
StockTicker = Range(«B2»).Value
‘Store Table Object to a Variable
Set tbl = ActiveSheet.ListObjects(«StockTable»)
‘Determine Where To Place Query (Column Prior To Table)
Set QueryLocation = tbl.Range(1, 1).Offset(0, -1)
QueryLocation.EntireColumn.Insert Shift:=xlToRight, CopyOrigin:=xlFormatFromLeftOrAbove
Set QueryLocation = QueryLocation.Offset(0, -1)
‘Delete all table rows except first row
With tbl.DataBodyRange
If .Rows.Count > 1 Then
.Offset(1, 0).Resize(.Rows.Count — 1, .Columns.Count).Rows.Delete
End If
End With
‘Create Web Address To Query Historic Stock Data
QueryURL = «http://ichart.finance.yahoo.com/table.csv?s=» & StockTicker
QueryURL = QueryURL & «&a=» & Month(StartDate) — 1 & «&b=» & Day(StartDate) & _
«&c=» & Year(StartDate) & «&d=» & Month(EndDate) — 1 & «&e=» & _
Day(EndDate) & «&f=» & Year(EndDate) & «&g=» & QueryLocation & «&q=q&y=0&z=» & _
StockTicker & «&x=.csv»
‘Pull Query Into Excel
With ActiveSheet.QueryTables.Add(Connection:=»URL;» & QueryURL, Destination:=QueryLocation)
.BackgroundQuery = True
.TablesOnlyFromHTML = False
.Refresh BackgroundQuery:=False
.SaveData = True
End With
‘Determine Stock Data Range
ActiveSheet.UsedRange
Set QueryDataRange = ActiveSheet.Range(QueryLocation, Cells(ActiveSheet.Cells _
(ActiveSheet.Rows.Count, QueryLocation.Column).End(xlUp).Row — 1, QueryLocation.Column))
‘Sort Data in Ascending Order
ActiveSheet.Sort.SortFields.Clear
ActiveSheet.Sort.SortFields.Add Key:=QueryDataRange, _
SortOn:=xlSortOnValues, Order:=xlAscending, DataOption:=xlSortNormal
With ActiveSheet.Sort
.SetRange QueryDataRange
.Header = xlYes
.MatchCase = False
.Orientation = xlTopToBottom
.SortMethod = xlPinYin
.Apply
End With
‘Delimit Stock Data into Table
QueryDataRange.TextToColumns Destination:=QueryLocation.Offset(0, 2), DataType:=xlDelimited, _
TextQualifier:=xlDoubleQuote, ConsecutiveDelimiter:=False, Tab:=True, _
Semicolon:=False, Comma:=True, Space:=False, other:=False
‘Delete Yahoo! Finance Stock Query
QueryLocation.EntireColumn.Delete
‘Optimize Code
Application.ScreenUpdating = True
Application.DisplayAlerts = True
End Sub
About The Author
Hey there! I’m Chris and I run TheSpreadsheetGuru website in my spare time. By day, I’m actually a finance professional who relies on Microsoft Excel quite heavily in the corporate world. I love taking the things I learn in the “real world” and sharing them with everyone here on this site so that you too can become a spreadsheet guru at your company.
Through my years in the corporate world, I’ve been able to pick up on opportunities to make working with Excel better and have built a variety of Excel add-ins, from inserting tickmark symbols to automating copy/pasting from Excel to PowerPoint. If you’d like to keep up to date with the latest Excel news and directly get emailed the most meaningful Excel tips I’ve learned over the years, you can sign up for my free newsletters. I hope I was able to provide you with some value today and I hope to see you back here soon!
— Chris
Founder, TheSpreadsheetGuru.com
With the success of our first article about Yahoo Finance and Excel VBA, we decided to write another (shorter but more precise) article about this topic. This time, we are going to show you how to easily download stock quotes information in real time from the Yahoo Finance API (quotes.csv) using Excel VBA.

In this article, we are going to reuse the code produced in the previous article. So, if you are interested in how we come up with the “magic” VBA macro called “LoadExternalData” presented below be sure to check out the original article.
You can find the whole source code of this tutorial here on GitHub, or you can download the following Excel file that contains the VBA code together with the Dashboard and a list of stock symbols:

yahoo-stock-quotes.xlsm
Content:
- Yahoo Finance: understanding the URL parameters (Symbols and Tags).
- Main VBA Macro: the code that does the job.
- Dashboard: building a user-friendly, Excel application.
- Extra features: improving user experience.
Yahoo Finance
Yahoo has several online APIs (Application Programming Interface) that provides financial data related to quoted companies: Quotes and Currency Rates, Historical Quotes, Sectors, Industries, and Companies. VBA can be used to import data automatically into Excel files using these APIs. In this article, we use the API for real-time stock quotes and currency rates (quotes.csv). If you are interested in the API for historical quotes (table.csv), please, visit the previous article.

First, we need to understand how to use the URL that provided stock information. It is of course possible to access Yahoo Finance’s stock data using a Web browser. You can therefore copy the following URLs to download stock data.
To make a request to the CSV API, we are going to use a URL with the following form:
http://finance.yahoo.com/d/quotes.csv?s={SYMBOLS}&f={TAGS}
where {SYMBOLS} must be replaced by a list of known stock symbols (such as GOOGL, AAPL, IBM, etc.) separated by “+” characters, and where {TAGS} must be replaced by letters and numbers describing the type of data to download.
Hence, this URL can be divided into two parts that are separated by a question mark “?”: (1) the static part of the URL that stays unchanged [http://finance.yahoo.com/d/quotes.csv], and (2) the dynamic part that can be modified to download all kinds of data about different companies and currency rates [s={SYMBOLS}&f={TAGS}]. If you do not know about URL formatting, head to the more detailed article.
Here is an example of valid URL that can be used to download various stock information, i.e. symbol, names, stock price and data, about some companies, namely IBM, UBS, Microsoft, Apple, and McDonald’s.
http://finance.yahoo.com/d/quotes.csv?s=IBM+UBS+MSFT+AAPL+MCD&f=snl1d1
This request will create a CSV file (quotes.csv) that contains the following data:
"IBM","International Business Machines",161.38,"4/20/2017"
"UBS","UBS Group AG Registered Ordinar",15.585,"4/20/2017"
"MSFT","Microsoft Corporation",65.17,"4/20/2017"
"AAPL","Apple Inc.",141.99,"4/20/2017"
"MCD","McDonald's Corporation Common S",133.11,"4/20/2017"
As you can see this is a comma-separated CSV file and, thus, depending on your Windows Regional Settings, Excel might not correctly interpret that file as illustrated below.

Note: You should have US settings for Excel to correctly parse the CSV file.
As you can see, the returned CSV file does not contain headers (column names) as opposed to other Yahoo Finance API and each line contains information about a specific company. The number of lines contained in the file depends on the given number of stock symbols that you passed as the “s” parameter, while the number of column depends on the number of tags passed in the “f” parameter. This means that the resulting CSV file can potentially have any number of columns and rows depending on the values contained in the URL parameters.
In our example, we have stock symbols for 5 companies defined in parameter “s”:
- IBM: International Business Machines
- UBS: UBS Group AG Registered Ordinar
- MSFT: Microsoft Corporation
- AAPL: Apple Inc.
- MCD: McDonald’s Corporation Common S
A list of stock symbols (aka. tickers) for parameter “s” can be found here or you can directly download the following file that contain the exhaustive list of symbols: yahoo-ticker-symbols-2016.
In our example, we have 4 different types of financial data:
- s: Symbol
- n: Name
- l1: Last Trade (Price Only)
- d1: Last Trade Date
A list tags for parameter “f” can be found here or also here.
Therefore, by respectively concatenating tags and symbols together (where symbols are separated by “+” character), we obtain the following parameters and values for the dynamic part of the URL:
s=IBM+UBS+MSFT+AAPL+MCD&f=snl1d1
which in turn gives the following URL that can be used to download data from Yahoo Finance:
http://finance.yahoo.com/d/quotes.csv?s=IBM+UBS+MSFT+AAPL+MCD&f=snl1d1
Main VBA Macro
To download stock quotes from Yahoo Finance automatically, the key idea is to write a short yet powerful macro based on the QueryTable object for importing text file (which corresponds to the returned CSV file) and using the above URL.
This gives the following “magic” piece of code that can be used to download any type of online CSV file (providing the CSV format is similar):
Sub LoadExternalData()
    Dim url As String
    url = "TEXT;http://finance.yahoo.com/d/quotes.csv?s=IBM+UBS+MSFT+AAPL+MCD&f=snl1d1"

    With ActiveSheet.QueryTables.Add(url, Range("$C$3"))
        .RefreshStyle = xlOverwriteCells
        .BackgroundQuery = False
        .TextFileParseType = xlDelimited
        .TextFileTextQualifier = xlTextQualifierDoubleQuote
        .TextFileCommaDelimiter = True
        .Refresh
    End With
End Sub
In this Macro, we declare a “url” variable that contains the connection string, i.e. the Yahoo Finance’s URL, concatenated with prefix “TEXT;” that indicates the type of data source (here, a text file).
The QueryTable’s properties and values used in the above macro are described in the following table. They basically tell how Excel should treat and import the CSV file.
| Property | Value | Description |
| RefreshStyle | xlOverwriteCells | Replace cell values |
| BackgroundQuery | False | Synchronous query (wait for response) |
| TextFileParseType | xlDelimited | Separate columns with a character |
| TextFileTextQualifier | xlTextQualifierDoubleQuote | Value Delimiter = double-quote (”) |
| TextFileCommaDelimiter | True | Column Separator = comma (,) |
Finally, calling the Refresh method executes the data importation. If you wish to know how we came up with this macro, please, check out the detailed article here.
Not only is this solution elegant, it is also simple and very efficient! Typically, in this scenario, hard-core programmers would use a potentially slow loop to parse the file, while business user will blindly generate a macro and try to modify it in the hope to import the data. As a result, far too often we cross badly designed macros on many forums and websites, which are often produced in haste and without much understanding (e.g. using the WinHttpRequest object). Worse, most people think they know how to code in Excel VBA, while they do not.
Voilà! You have successfully imported external data from one of Yahoo Finance APIs using Excel and VBA. Now, the last step is to provide a dashboard so that users can directly interact with Yahoo Finance without having to modify the connection string contained in the VBA macro.
Dashboard and user interface
In this last chapter, we are going to build an interface in Excel so that end-users can directly interact with Yahoo Finance without having to modify VBA macros. We are therefore going to:
- Read user input from specific Excel cells,
- Use these input values to build a valid Yahoo Finance’s URL,
- Download the appropriate stock data based on the given URL.
In our Excel application, we have three separated Worksheets (called Dashboard, Symbols, Tags) that hold the imported data, stock symbols and Yahoo’s tags, respectively.
The Dashboard sheet is the only sheet with which the user will interact. It holds a single command button called “Refresh” that is used to download some stock details about some given companies.
The Dashboard sheet looks as follow:

In addition to the “Refresh” button, users must select stock symbols representing the companies and tags representing the type of data to download. Companies are selected in the first column, while data types are selected in the row.
To avoid runtime errors, it is crucial to restrict values that users can enter. This can easily be done thanks to Data Validation. We use therefore Data Validation to ensure that symbols and tags are selected from the given lists stored in the two other Worksheets, namely “Symbols” and “Tags”.
The first column must be validated as follow, based on the given list of symbols.


While the first row must be validated as follow, based on the given list of tags.


Additionally, it might be useful to also display the actual names represented by symbols and tags. To this purpose, we add Excel formulae that display the name corresponding to the adjacent symbol or tag. This can be done using the VLOOKUP function.
To look for a symbol, we used the following formula in column B:
=IFERROR(VLOOKUP($A3;Symbols!$A$1:$C$25243;2;FALSE); » »)
To look for a tag, we used the following formula in the second row:
=IFERROR(VLOOKUP(C$1;Tags!$A$1:$C$88;2;FALSE); » »)
Both formulae will display the corresponding name if found; otherwise nothing is displayed.
At this stage the user interface is ready and stock data are imported as a table at cell C3, where each row corresponds to a specific company and each column to a specific data type.
User inputs and URL string
Now that we restricted user inputs, the next step is to correctly read these inputs to build a valid URL.
There are basically two things to read:
- Symbols contained in the first column
- Tags contained in the first row.
Counting the number of rows and columns
The first step is to dynamically determine the number of symbols (rows) and tags (columns): the user can select an arbitrary number of companies and data types. You can easily find the last in-use row and column thanks to the UsedRange property of the Worksheet object as follow:
' Count number of rows and columns
Private Sub ComputeTableSize()
    With ActiveWorkbook.Sheets("Dashboard")
        rowCount = .UsedRange.Rows.Count
        colCount = .UsedRange.Columns.Count
    End With
End Sub
An alternative is to use the End property of the Range object starting from cell A3 and going down to count symbols, and from cell C1 and going right to count tags:
With ActiveWorkbook.Sheets("Dashboard")
    rowCount = .Range("A3").End(xlDown).Row
    colCount = .Range("C1").End(xlToRight).Column
End With
However, as you might see in the final version of our VBA project, UsedRange is probably a more robust solution.
Getting user inputs
The next step is to read symbols and tags entered by the end-user. We are going loop over the first row to read all tags and over the first column to read all symbols. To this extent, we wrote two distinct loops that read and concatenate every non-empty value encountered in those cells.
For tags, we built the following function that returns a string of concatenated tags:
' Concatenate tags.
' @return: string containing tags (with no separation character).
Private Function GetTags() As String
    Dim j As Integer
    Dim t As String
    Dim tags As String

    ' Loops on tags and add them to the list.
    tags = ""
    For j = 3 To colCount
        t = ActiveWorkbook.Sheets("Dashboard").Cells(1, j).Value
        tags = tags & t
    Next j

    GetTags = tags
End Function
And for symbols, we built the following function that returns a string of concatenated symbols separated by “+” characters:
' Concatenate symbols (aka. tickers).
' @return: string containing symbols separated by "+" characters.
Private Function GetSymbols() As String
    Dim i As Integer
    Dim s As String
    Dim symbols As String

    ' Loops on symbols and add them to the list.
    symbols = ""
    For i = 3 To rowCount
        s = ActiveWorkbook.Sheets("Dashboard").Cells(i, 1).Value

        ' concatenates only if there is a symbol.
        If s <> "" Then
            symbols = IIf(symbols = "", s, symbols & "+" & s)
        End If
    Next i

    GetSymbols = symbols
End Function
As you can see these two macros are quite similar, as the first one looks for tags in the first row and the second one looks for symbols in the first column. Note also that tags are concatenated “as is” (i.e. without adding any other character), while symbols are separated by “+” characters.
Values returned by these functions need to be passed as parameter in the URL string before to be sent to Yahoo Finance. To this extent, we built a third function that calls the previous functions in order to build a valid URL.
' Build a valid Yahoo Finance's URL based on the given symbols and tags.
Private Function BuildURL()
    Dim url As String
    Dim symbols As String
    Dim tags As String

    ' Concatenates symbols and tags
    symbols = GetSymbols
    tags = GetTags

    ' Inserts symbol and tag lists as parameters
    url = "http://finance.yahoo.com/d/quotes.csv?s=[s]&f=[f]"
    url = Replace(url, "[s]", symbols)    ' e.g. GOOGL+AAPL+FB+AMZN
    url = Replace(url, "[f]", tags)            ' e.g. s0n0l1d1t1

    BuildURL = url
End Function
Downloading stock quotes
Once the URL for Yahoo Finance is built, we can pass it directly to the macro in charge of downloading online stock data:
Dim url As String
url = BuildURL             ' get symbol and tag list and return valid URL
Call LoadExternalData(url) ' download online data from Yahoo Finance
Finally, we just have to modify our original LoadExternalData macro, so that it takes a URL string as input parameter and downloads the data into cell C3 in the main Worksheet “Dashboard”.
' Download stock quotes from Yahoo Finance.
' @param url: valid URL with parameters, pointing to the Yahoo Finance API.
Private Sub LoadExternalData(url As String)
    Dim q As QueryTable
    Dim s As Worksheet
    Dim r As Range

    ' Set destination sheet and destination range for the returned data
    Set s = ActiveWorkbook.Sheets("Dashboard")
    Set r = s.Range("C3")

    ' Indicates that the result returned by the URL is a text file.
    url = "TEXT;" & url

    ' Creates a QueryTable Object using the destination sheet and range
    Set q = s.QueryTables.Add(url, r)

    ' Configures QueryTable and download online data from Yahoo Finance.
    With q
        .RefreshStyle = xlOverwriteCells ' Replace current cells
        .BackgroundQuery = False  ' Synchronous Query
        .TextFileParseType = xlDelimited  ' Parsing Type (column  separated by  a character)
        .TextFileTextQualifier = xlTextQualifierDoubleQuote  ' Column Name Delimiter ""
        .TextFileCommaDelimiter = True  ' Column Separator
        .Refresh  'Initiates data transfert
    End With

    ' Destroys the QueryTable object (since it is used only once)
    q.Delete
End Sub
Congratulation! You have now mastered the Yahoo Finance API.
Extra Features
A software application is never 100% complete, one can always add new features, improve user experience, etc. We present in this chapter some improvements that we made to ease the life of end-users.
Clearing previous data
Clearing previous data before importing new data is essential if you want to display only consistent data based on the user selection. This macro does the job just right: all data starting from cell C3 will be deleted, while the two first columns and rows are preserved.
' Clear imported data while preserving column and row headers.
Private Sub ClearTable()
    If rowCount > 2 And colCount > 2 Then
        ' Only clear table if there are some values
        With ActiveWorkbook.Sheets("Dashboard")
            .Range(.Cells(3, 3), .Cells(rowCount, colCount)).ClearContents
        End With
    End If
End Sub
Note that it is important to only clear the data without the user inputs as they will be needed to build the URL string later on.
Events for better user experience
We also added some events to ease the use of our dashboard and improve user experience (UX). We added two key events that (1) load online data automatically when the file is open and (2) insert formulae automatically in the second row and column to display the actual tag name and symbol name, respectively.
The event to automatically load data is implemented in ThisWorkbook. It simply calls the primary macro, called “Refresh”, contained in the “StockQuotes” module:
Private Sub Workbook_Open()
    ' Automatically download stock quotes when the Workbook opens.
    StockQuotes.Refresh
End Sub
While the second event that automatically fetch names of tags and symbols is implemented in the main Worksheet called “Dashboard”:
Private Sub Worksheet_Change(ByVal Target As Range)
    Dim cell As String
    Dim r As Range
    Dim c As Range

    ' Check intersection with first row and first column
    Set r = Application.Intersect(Target, Rows(1))
    Set c = Application.Intersect(Target, Columns(1))

    ' Insert formula when first column is changed
    If Not (c Is Nothing) Then
        If c.Row > 2 Then
        cell = c.Address
            c.Offset(0, 1).Formula = "=IFERROR(VLOOKUP(" & cell & ",Symbols!$A$1:$C$25243,2,FALSE),"""")"
        End If
    End If

    ' Insert formula when first row is changed
    If Not (r Is Nothing) Then
        If r.Column > 2 Then
            cell = r.Address
            r.Offset(1, 0).Formula = "=IFERROR(VLOOKUP(" & cell & ",Tags!$A$1:$C$88,2,FALSE),"""")"
        End If
    End If
End Sub
For this second event, another option would be to directly copy the name instead of inserting an Excel formula, but this would make the VBA code more complex. Instead, we prefer to use the build-in Excel formulae to ease the development and maintenance of our software application.
Note also that other improvements have been made in the final Excel file, such as deleting empty headers or resizing columns automatically to fit cell content. However, this is out of scope and can be discussed in another article.
Conclusion
Voilà! This concludes this article about mastering Yahoo Finance using Excel VBA. If you click on the “Refresh” button of the dashboard, you should obtain a similar result:
You can find the [whole source code] of this tutorial on GitHub, or you can download the following Excel file that contains the VBA code together with the Dashboard and the lists of symbols and tags:
yahoo-stock-quotes.xlsm
Please, feel free to write any comment about this article or future subject about Excel VBA that you would like us to cover. We are looking forward to your feedback.
For a more detailed explanation, be sure to check or previous article about this topic.
References
- Related article about Yahoo Finance (ribon.ch)
- The Spreadsheet Guru – Use Yahoo! Finance to Pull Stock Information into Excel
- Use Yahoo Finance as data source
- A List of All Yahoo Finance Stock Tickers (Symbols)
- Yahoo Finance – Stock Quotes API
- Google Code – Yahoo Finance Managed
- How the Free Yahoo Finance API Works (Tags)
- Downloading Yahoo data (Tags)
- QueryTable documentation

-
Hajir H -
September 3, 2013 -
77 Comments
Yahoo Finance API provides a simple way to download stock quotes. The service returns stock data in a CSV. This blog explain how to get stock data from Yahoo Finance using Excel & VBA. If you’re interested in a custom solution for your Excel file, please contact our Excel expert team for a free quote.
In this example, we want to obtain the following Stock info of Google, Facebook and Microsoft.
- Name of company
- Last trade date
- Last trade (price only)
- Dividend Yield
- P/E Ratio
Important Update (2020)
Yahoo Finance API is no longer available. The VBA code, explained in this blog, can no longer connect to Yahoo Finance API and is not working.
Pre-req
Make sure Microsoft WinHTTP Services are enable. To do so , open Visual Basic Editor of your xlsm file. Click Tools >> References. And select Microsoft WinHTTP Services.
Development Process – Step 1
Range A2 to be taken the head cell. Type “GOOG” in range A3, “FB” in A4 and “MSFT” in range A5. Type “n” in range B3, “d1” in range C3, “l1” in D3, “y” in E3 and “r” in F3. A sample shown below.

Step 2
Open Microsoft Visual Basic for Applications on your Excel. Copy the code and paste it on your sheet’s VBA area.
Option Explicit

' Example: Requesting Stock info of GOOG, FB and MSFT.
'
' In this example, we want to obtain the following Stock info
' - Name of company
' - Last trade date
' - Last trade (price only)
' - Dividend Yield
' - P/E Ratio
'
' Range A2 to be taken the head cell. Type "GOOG" in range A3,
' "FB" in A4 and "MSFT" in range A5. Type "n" in range B3, "d1"
' in range C3, "l1" in D3, "y" in E3 and "r" in F3.
'
' We use the following URL for getting Stock Quote from Yahoo
' URL: http://finance.yahoo.com/d/quotes.csv?s=FB+MSFT&f=snd1l1yr
'
' The CSV file data looks like the following
'
' "FB","Facebook, Inc.","9/4/2013",41.7665,N/A,189.46
' "MSFT","Microsoft Corpora","9/4/2013",31.24,2.89,12.36
'
' The columns in CSV file is separated by comma. Split function
' is used to split the data on each line of CSV file at every
' occurrence of comma. However, some commas in the CSV file are
' part of a string, not separating the columns. For example
' consider the following line,
' "FB","Facebook, Inc.","9/4/2013",41.7665,N/A,189.46
' The second comma is not a column separator. But it's part
' of the company's name "Facebook, Inc."
' This program will identify which comma is a column separator
' and which is part of a string

' ************
' Written by http://www.msexcelvancouver.com
' Thanks to http://www.youtube.com/watch?v=iSlBE3CWg5Q

Sub Get_Stock_Quotes_from_Yahoo_Finance_API()

Dim head As Range
Set head = Range("A2")

Dim i As Integer
Dim Symbols As String: Symbols = ""
Dim SpecialTags As String: SpecialTags = ""
Dim Yahoo_Finance_URL As String: Yahoo_Finance_URL = "http://download.finance.yahoo.com/d/quotes.csv?s="
Dim rng As Range
Dim cell As Range

' Get the Stock Symbols
Set rng = Range(head.Offset(1, 0), head.Offset(1, 0).End(xlDown))
For Each cell In rng ' Starting from a cell below the head cell till the last filled cell
Symbols = Symbols & cell.Value & "+"
Next cell
Symbols = Left(Symbols, Len(Symbols) - 1) ' Remove the last '+'

' Get the Special Tags
Set rng = Range(head.Offset(0, 1), head.Offset(0, 1).End(xlToRight))
For Each cell In rng ' Starting from a cell to the right of the head cell till the last filled cell
SpecialTags = SpecialTags & cell.Value
Next

' Put the desciption/name of each tag in the cell above it
Dim SpecialTagsArr() As String: Dim TagNamesArr() As String
Call Get_Special_Tags(SpecialTagsArr, TagNamesArr)
For Each cell In rng
cell.Offset(-1, 0).Value = FindTagName(cell.Value, SpecialTagsArr, TagNamesArr)
Next

Yahoo_Finance_URL = Yahoo_Finance_URL & Symbols & "&f=" & SpecialTags

Call Print_CSV(Yahoo_Finance_URL, head)

End Sub

' Download the CSV file and Print it in the cells
Sub Print_CSV(URL As String, head As Range)

' Get the CSV file from Yahoo Finance
Dim Http As New winhttprequest
Http.Open "GET", URL, False
Http.send

Dim Resp As String: Resp = Http.responsetext
Dim Lines As Variant: Lines = Split(Resp, vbLf)
Dim sLine As Variant
Dim Values As Variant
Dim Value As Variant

Dim i As Integer: i = 1
Dim next_column As Boolean: next_column = True
Dim col As Integer
Dim tmp As String

' Extract CSV file Data to Cells
For Each sLine In Lines
Values = Split(sLine, ",")
col = 1
tmp = ""
For Each Value In Values
' Read the info for this program which explains the lines below
tmp = tmp & Value
If Left(Value, 1) = """" And Right(Value, 1) <> """" Then next_column = False
If Not next_column And Right(Value, 1) = """" Then next_column = True
If next_column Then
head.Offset(i, col).Value = Replace(tmp, Chr(34), "") ' Remove '"'
tmp = ""
col = col + 1
End If
Next Value
i = i + 1
Next sLine
End Sub

' Find the name of the given tag
Function FindTagName(tag As String, SpecialTags() As String, Tag_Name() As String) As String
Dim pos As Integer
Dim tagName As String

On Error GoTo CannotFindTagName

pos = Application.Match(tag, SpecialTags, False) - 1

tagName = Tag_Name(pos)
FindTagName = tagName
Exit Function

CannotFindTagName:
MsgBox tag & " not found! Program terminates."
End
End Function
The following function includes two arrays, one containing the special tags and another containing tag names. You could use these arrays as a reference.
' Yahoo Finance Special Tags & Names
Sub Get_Special_Tags(ByRef SpecialTags() As String, ByRef Tag_Name() As String)

ReDim SpecialTags(0 To 84) As String
ReDim Tag_Name(0 To 84) As String

SpecialTags(0) = "a": Tag_Name(0) = "Ask"
SpecialTags(1) = "a2": Tag_Name(1) = "Average Daily Volume"
SpecialTags(2) = "a5": Tag_Name(2) = "Ask Size"
SpecialTags(3) = "b": Tag_Name(3) = "Bid"
SpecialTags(4) = "b2": Tag_Name(4) = "Ask (Real-time)"
SpecialTags(5) = "b3": Tag_Name(5) = "Bid (Real-time)"
SpecialTags(6) = "b4": Tag_Name(6) = "Book Value"
SpecialTags(7) = "b6": Tag_Name(7) = "Bid Size"
SpecialTags(8) = "c": Tag_Name(8) = "Change & Percent Change"
SpecialTags(9) = "c1": Tag_Name(9) = "Change"
SpecialTags(10) = "c3": Tag_Name(10) = "Commission"
SpecialTags(11) = "c6": Tag_Name(11) = "Change (Real-time)"
SpecialTags(12) = "c8": Tag_Name(12) = "After Hours Change (Real-time)"
SpecialTags(13) = "d": Tag_Name(13) = "Dividend/Share"
SpecialTags(14) = "d1": Tag_Name(14) = "Last Trade Date"
SpecialTags(15) = "d2": Tag_Name(15) = "Trade Date"
SpecialTags(16) = "e": Tag_Name(16) = "Earnings/Share"
SpecialTags(17) = "e1": Tag_Name(17) = "Error Indication (returned for symbol changed / invalid)"
SpecialTags(18) = "e7": Tag_Name(18) = "EPS Estimate Current Year"
SpecialTags(19) = "e8": Tag_Name(19) = "EPS Estimate Next Year"
SpecialTags(20) = "e9": Tag_Name(20) = "EPS Estimate Next Quarter"
SpecialTags(21) = "f6": Tag_Name(21) = "Float Shares"
SpecialTags(22) = "g": Tag_Name(22) = "Day's Low"
SpecialTags(23) = "h": Tag_Name(23) = "Day's High"
SpecialTags(24) = "j": Tag_Name(24) = "52-week Low"
SpecialTags(25) = "k": Tag_Name(25) = "52-week High"
SpecialTags(26) = "g1": Tag_Name(26) = "Holdings Gain Percent"
SpecialTags(27) = "g3": Tag_Name(27) = "Annualized Gain"
SpecialTags(28) = "g4": Tag_Name(28) = "Holdings Gain"
SpecialTags(29) = "g5": Tag_Name(29) = "Holdings Gain Percent (Real-time)"
SpecialTags(30) = "g6": Tag_Name(30) = "Holdings Gain (Real-time)"
SpecialTags(31) = "i": Tag_Name(31) = "More Info"
SpecialTags(32) = "i5": Tag_Name(32) = "Order Book (Real-time)"
SpecialTags(33) = "j1": Tag_Name(33) = "Market Capitalization"
SpecialTags(34) = "j3": Tag_Name(34) = "Market Cap (Real-time)"
SpecialTags(35) = "j4": Tag_Name(35) = "EBITDA"
SpecialTags(36) = "j5": Tag_Name(36) = "Change From 52-week Low"
SpecialTags(37) = "j6": Tag_Name(37) = "Percent Change From 52-week Low"
SpecialTags(38) = "k1": Tag_Name(38) = "Last Trade (Real-time) With Time"
SpecialTags(39) = "k2": Tag_Name(39) = "Change Percent (Real-time)"
SpecialTags(40) = "k3": Tag_Name(40) = "Last Trade Size"
SpecialTags(41) = "k4": Tag_Name(41) = "Change From 52-week High"
SpecialTags(42) = "k5": Tag_Name(42) = "Percebt Change From 52-week High"
SpecialTags(43) = "l": Tag_Name(43) = "Last Trade (With Time)"
SpecialTags(44) = "l1": Tag_Name(44) = "Last Trade (Price Only)"
SpecialTags(45) = "l2": Tag_Name(45) = "High Limit"
SpecialTags(46) = "l3": Tag_Name(46) = "Low Limit"
SpecialTags(47) = "m": Tag_Name(47) = "Day's Range"
SpecialTags(48) = "m2": Tag_Name(48) = "Day's Range (Real-time)"
SpecialTags(49) = "m3": Tag_Name(49) = "50-day Moving Average"
SpecialTags(50) = "m4": Tag_Name(50) = "200-day Moving Average"
SpecialTags(51) = "m5": Tag_Name(51) = "Change From 200-day Moving Average"
SpecialTags(52) = "m6": Tag_Name(52) = "Percent Change From 200-day Moving Average"
SpecialTags(53) = "m7": Tag_Name(53) = "Change From 50-day Moving Average"
SpecialTags(54) = "m8": Tag_Name(54) = "Percent Change From 50-day Moving Average"
SpecialTags(55) = "n": Tag_Name(55) = "Name"
SpecialTags(56) = "n4": Tag_Name(56) = "Notes"
SpecialTags(57) = "o": Tag_Name(57) = "Open"
SpecialTags(58) = "p": Tag_Name(58) = "Previous Close"
SpecialTags(59) = "p1": Tag_Name(59) = "Price Paid"
SpecialTags(60) = "p2": Tag_Name(60) = "Change in Percent"
SpecialTags(61) = "p5": Tag_Name(61) = "Price/Sales"
SpecialTags(62) = "p6": Tag_Name(62) = "Price/Book"
SpecialTags(63) = "q": Tag_Name(63) = "Ex-Dividend Date"
SpecialTags(64) = "r": Tag_Name(64) = "P/E Ratio"
SpecialTags(65) = "r1": Tag_Name(65) = "Dividend Pay Date"
SpecialTags(66) = "r2": Tag_Name(66) = "P/E Ratio (Real-time)"
SpecialTags(67) = "r5": Tag_Name(67) = "PEG Ratio"
SpecialTags(68) = "r6": Tag_Name(68) = "Price/EPS Estimate Current Year"
SpecialTags(69) = "r7": Tag_Name(69) = "Price/EPS Estimate Next Year"
SpecialTags(70) = "s": Tag_Name(70) = "Symbol"
SpecialTags(71) = "s1": Tag_Name(71) = "Shares Owned"
SpecialTags(72) = "s7": Tag_Name(72) = "Short Ratio"
SpecialTags(73) = "t1": Tag_Name(73) = "Last Trade Time"
SpecialTags(74) = "t6": Tag_Name(74) = "Trade Links"
SpecialTags(75) = "t7": Tag_Name(75) = "Ticker Trend"
SpecialTags(76) = "t8": Tag_Name(76) = "1 yr Target Price"
SpecialTags(77) = "v": Tag_Name(77) = "Volume"
SpecialTags(78) = "v1": Tag_Name(78) = "Holdings Value"
SpecialTags(79) = "v7": Tag_Name(79) = "Holdings Value (Real-time)"
SpecialTags(80) = "w": Tag_Name(80) = "52-week Range"
SpecialTags(81) = "w1": Tag_Name(81) = "Day's Value Change"
SpecialTags(82) = "w4": Tag_Name(82) = "Day's Value Change (Real-time)"
SpecialTags(83) = "x": Tag_Name(83) = "Stock Exchange"
SpecialTags(84) = "y": Tag_Name(84) = "Dividend Yield"

End Sub
YouTube Video
We also explained how to use this Excel file, on a YouTube Video.
Need some help?
Please feel free to contact our Excel consultant team if you are looking for some Excel help.
Subscribe to our Newsletter
Share this post with your friends
77 Responses
-
Thanks for putting this together. Since Yahoo finance was recently revamped it is no longer possible to easily retrieve stock / mutual fund prices as a web query withing microsoft excel.
-
Agree! Yahoo is not the best option but it’s a free option.
-
The code does not work in Excel 2016. Could you check it?
-
What error do you get? It works for me.
-
-
-
-
nice job. Do you happen to have a script for getting “historical” data from yahoo? thanks,
L Brown-
Yes, Yahoo could provide historical data and I could develop a custom program for this purpose. Please email me to discuss more.
-
-
Do you have this code in a format that can be copied? Hoping to not retype all of this
-
If you double click the code, you could copy it. I’m not sure how it looks like on your computer.
-
-
hi! thanks for putting this together. Sounds really useful. When i tried to add the code you published into a VBA module, i got an error — seems like VBA doesn’t like the line: “http.send” on line 78. any advice ?
-
Thanks for your feedback. Maybe your excel has some problems with creating objects or HTTP Send. If you have more details about the error, it would be easier to debug the problem.
-
Thank you for your kindly help. I met the similar problem. The error is “Run-time error ‘-2147012889(80072ee7)’: The server name or address could not be resolved. ” However, I am sure the link is correct, since I could open the link on my Chrome. Thank you for letting me know if there is any tips on solving this error.
-
Sorry, it’s not on my knowledge. This sounds to do something with networking or server which is not my field.
-
I ran into this same issue – it’s a result of your VBA references not being selected. To fix – in VBA page – Tools > References. In the popup menu, select ‘Microsoft WinHTTP Services, version 5.1’. Save and rerun and this should work.
-
-
-
-
How do I manipulate the code to extract data from key statistics page?
-
Could you give an example of key static pages? I’m trying to understand the question better.
-
-
Works really well! Thanks a ton!
Quick question – what if I want to extract info on non-US stocks? Say for example Larsen and Toubro traded on NSE, India (Yahoo Code: LT.NS)? When I input the stock code, it doesnt seem to work. Any idea if I should tweak the code before I venture into non-US stocks?
-
Maybe Yahoo Finance supports other countries stock exchange. If I get any chance, I’ll look into it.
-
-
Many thanks for this code, this is very helpful. For specific securities like IE0032769055.IR or IE0030982171.IR I would like to follow, there is no identifier and your macro in VBA does not recognize it, even if I can use this on Yahoo Finance. Can you help?
-
Sorry, I’m not familiar with this.
-
-
Hey how could I change the code so that I can write the tag names “52 wk Rg” etc. on the column headers instead of the shortcut “w”
-
Done! Try the new code
-
-
Very useful. However, this does not work very well for mutual funds. For example, none of the dividend tags work – d, y, etc. Do you happen to know how to retrieve those and other data for mutual funds?
-
I haven’t had the chance to write code for them.
-
-
This did not quite work on my Excel for Mac 2011. I adapted it to a version that does appear to be working, which required using QueryTables in place of the HTTP Get call, which evidently is not supported by Mac Excel 2011.
I’ll paste the code below:
Sub Yahoo_Finance_API_Call_MacExcel2011()
Dim head As Range
Set head = Range(“A1”)Dim wb As Workbook ‘In the event that you’ll use different workbooks
Dim src As Worksheet ‘In the event that you’ll use different a source worksheet
Dim tgt As Worksheet ‘In the event that you’ll use different a target worksheetSet wb = ThisWorkbook
Set src = wb.Sheets(“Sheet1”)
Set tgt = wb.Sheets(“Sheet1”)‘Assemble Symbols for API Call
Set rng = Range(head.Offset(1, 0), head.Offset(1, 0).End(xlDown))
For Each cell In rng ‘ Starting from a cell below the head cell till the last filled cell
Symbols = Symbols & cell.Value & “+”
Next cell
Symbols = Left(Symbols, Len(Symbols) – 1) ‘ Remove the last ‘+’‘Assemble Tags or API Call
Set rng = Range(head.Offset(0, 1), head.Offset(0, 1).End(xlToRight))
For Each cell In rng ‘ Starting from a cell to the right of the head cell till the last filled cell
tags = tags & cell.Value
Next cell‘Build URL
URL = “TEXT;http://finance.yahoo.com/d/quotes.csv?s=” ‘Use TEXT to collect API data below
URL = URL & Symbols & “&f=” & tags‘Range(“A1”).Value = URL ‘This will output the assembled URL in a1 for QA if need be
‘Call API
With tgt.QueryTables.Add(Connection:= _
URL, _
Destination:=Range(head.Offset(1, 1), head.Offset(1, 1).End(xlDown))).RefreshStyle = xlOverwriteCells
.TextFileParseType = xlDelimited
.TextFileCommaDelimiter = True
.BackgroundQuery = True
.TextFileCommaDelimiter = True
.TablesOnlyFromHTML = True
.Refresh BackgroundQuery:=False
.TextFilePromptOnRefresh = False
.TextFileStartRow = 1
.TextFileParseType = xlDelimited
.TextFileTextQualifier = xlTextQualifierDoubleQuote
.TextFileConsecutiveDelimiter = False
.TextFileTabDelimiter = False
.TextFileSemicolonDelimiter = False
.TextFileSpaceDelimiter = False
.TextFileTextQualifier = xlTextQualifierDoubleQuote
.SaveData = False
End WithEnd Sub
-
How do I test if my internet connection is via a proxy server? Can you give the code. Thanks.
-
sorry, I’m not an expert int this area.
-
-
the VBA is very useful. tq Admin.
Anyhow, how to make it update every 1 minute? tq-
You could make a loop and use Application.Wait(Time) function to delay for example a minute. However, Yahoo wants to be a delay between API Requests so it’s not a good idea to do an API request continuously with no delay.
-
-
a5 and b6 not working
both return no data but “N/A”
would you kindly check and modify VBA lines
thanks-
Probably N/A is returned by Yahoo Finance i.e Yahoo doesn’t have value for it.
-
-
You did not define “y” in the Get_Special_Tags().
Should I add this line at the end?
SpecialTags(83) = “y”: Tag_Name(83) = “Dividend Yield”-
Thank you for mention it. It’s been added now.
-
-
Thank you!!! Not being a Visual Basic Programmer, I was at my wits end trying to figure out what I could do to salvage weeks of work on my excel spreadsheet that was made useless after the MSN Money website changed. My query function no longer returned the expected stock data I needed to track and analyze my portfolio. Your subroutine is just what the Dr. ordered to generate a database from which I can extract the necessary information. Thank you again.
-
I’m glad it was helpful.
-
-
It appears something has changed the week of Mar 9, 2015, in the formatting of the data at Yahoo that is causing the excel formatting to show the data in rows instead of columns. Can you confirm this and let me know how to adjust the macro?
-
Try the new code
-
-
I’ve been using this code for about a year now and it’s worked flawlessly. Today, however, all the results (100+ stocks) are being populated across one row instead of the row with the associated symbol. Can you help?
-
I’m glad someone used it for a year! It’s fixed.
-
-
In case anyone comes across the same issue…for some reason this stopped working for me, and was writing all the data to a single row. After some troubleshooting, I discovered that the Resp string was not splitting at each new line. Changing
Dim Lines As Variant: Lines = Split(Resp, vbNewLine) to:
Dim Lines As Variant: Lines = Split(Resp, vbLf)
solved the issue.
-
Thanks for the VBA has been of much use, however, recently it is implemented inadequately, print data of all quotes followed in the first row and not in the row corresponding to each symbol. I can guide grateful to correct this problem.
-
Thank you for the alternative to the Microsoft version. However, the termination character(s) for the “Lines” array may vary. This may be from a change to the Yahoo Finance API, or a side effect of operating system (Mac vs. PC), or of EXCEL version. For my situation, I had to change this line:
>
Dim Lines As Variant: Lines = Split(Resp, vbNewLine)
>
to this:
>
Dim Lines As Variant: Lines = Split(Resp, Chr(10))-
Good Suggestion
-
-
Hi admin great file but everytime i run the macro it pastes it horizontally (all data for all tickers on row 1). How do i get it to transpose correctly?
-
It seems that Yahoo has changed the API response. The return value in Resp is not split into lines anymore using “Lines = Split(Resp, vbNewline)”.
Any solution available?
-
Something changed recently and this code no longer works. When I ran it in the debugger it appears that Http.responsetext in Sub Print_CSV no longer contains newline characters – so the Dim Lines As Variant: Lines = Split(Resp, vbNewLine) no longer produces an array of lines one per stock quote. I am no sure why this is – I looked at the data yahoo is returning and each line is delimited with character 0xa which is the unix style line terminator. I have been hacking away on an alternate line parser using the raw data in Http.responsebody but running into a few snags since I am unfamiliar with visual basic programming. Not sure what happened – either yahoo changed their data format or the http response parsing code changed somehow.
-
Indeed someone changed the API breaking this script as well as many others I suspect. I also had a Perl script broken with this change.
You can fix the script by
changing
Dim Lines As Variant: Lines = Split(Resp, vbNewLine)
to
Dim Lines As Variant: Lines = Split(Resp, vbLf)
This is a very nice implementation and very useful inside of Excell. Good luck
-
Thanks for finding the bug. It’s fixed now.
-
-
It’s been fixed now.
-
-
Here is some less than elegant code that seems to work – This replaces your version of Print_CSV. The only thing I don’t like about it is that I allocate a fixed size array of 300 strings to hold the results of the line parse. I tried experimenting with more dynamic allocation methods but did not get too far.
‘ Download the CSV file and Print it in the cells
Sub Print_CSV(URL As String, head As Range)‘ Get the CSV file from Yahoo! Finance
Dim Http As Object
Set Http = CreateObject(“WinHttp.WinHttpRequest.5.1”)
Http.Open “GET”, URL, False
Http.sendDim Raw As Variant: Raw = Http.responsebody
Dim Raws As Variant
Dim Values As Variant
Dim Value As VariantDim i As Integer
Dim n As Integer: n = 0
Dim next_column As Boolean: next_column = True
Dim col As Integer
Dim tmp As String
Dim mystr As String
Dim myLines(1 To 300) As Stringmystr = “”
For Each Raws In Raw
If Raws = 10 Then
n = n + 1
myLines(n) = mystr
mystr = “”
Else
mystr = mystr & ChrW(Raws)
End If
Next Raws‘ Extract CSV file Data to Cells
For i = 1 To n
Values = Split(myLines(i), “,”)
col = 1
tmp = “”
For Each Value In Values
‘ Read the info for this program which explains the lines below
tmp = tmp & Value
If Left(Value, 1) = “””” And Right(Value, 1) “””” Then next_column = False
If Not next_column And Right(Value, 1) = “””” Then next_column = True
If next_column Then
head.Offset(i, col).Value = Replace(tmp, Chr(34), “”) ‘ Remove ‘”‘
tmp = “”
col = col + 1
End If
Next Value
Next i
End Sub-
You could RedDim Preserve to make your array bigger.
-
-
Thanks for the macro, it’s been a great tool, I’ve been using it quite a while now, when it broke I was happy to see it fixed. I hope you can expand on the mutual fund variables, they would be very useful. Thanks again for this tool.
-
You’re welcome. I’m glad that is useful. I don’t think Yahoo Finance provides a list of mutual funds. I’m not sure if there is any other website offering an API for mutual funds.
-
-
I am running into issues using this version now, has something changed?
-
What error do you get?
-
-
do you know if there is a tag for company description? Thanks.
-
To my knowledge, I don’t think so.
-
-
-
Here is what I have so far, completely lost on next steps… Do we use Yahoo API to get the xml then parse it into Excel?
Sub Key_Statistics_from_Yahoo_Finance_API()
Dim head As Range
Set head = Range(“A3”)
Dim i As Integer
Dim Symbols As String: Symbols = “”
Dim SpecialTags As String: SpecialTags = “”
Dim urlP1 As String: urlP1 = “https://query.yahooapis.com/v1/public/yql?q=select%20*%20from%20yahoo.finance.keystats%20where%20symbol%20in%20(%22”
Dim urlP2 As String: urlP2 = “%22)&diagnostics=true&env=store%3A%2F%2Fdatatables.org%2Falltableswithkeys”
Dim Yahoo_Finance_URL As String
Dim rng As Range
Dim cell As RangeApplication.StatusBar = “Macro running…updating quotes for tickers ……….COWABUNGA!”
‘ Clear old data and copy the ticker list
Sheets(“KeyStats”).Select
Range(“A3:CH1000”).Select
Selection.ClearContentsSheets(“TickerList”).Select
Range(“A2”).Select
Range(Selection, Selection.End(xlDown)).Select
Selection.CopySheets(“KeyStats”).Select
Range(“A3”).Select
Selection.PasteSpecial Paste:=xlPasteValues, Operation:=xlNone, SkipBlanks _
:=False, Transpose:=False‘ Get the Stock Symbols
Set rng = Range(head.Offset(1, 0), head.Offset(1, 0).End(xlDown))
For Each cell In rng ‘ Starting from a cell below the head cell till the last filled cell
Symbols = Symbols & cell.Value & “%22%2C%22”
Next cell
Symbols = Left(Symbols, Len(Symbols) – 9)Debug.Print urlP1 & Symbols & urlP2
Yahoo_Finance_URL = urlP1 & Symbols & urlP2-
Sorry, I didn’t understand your question.
-
-
I need EPS (past) but Yahoo API ‘e’ (SpecialTag 16) – only provides EPS (TTM). I did found out there is EPS (Past) on Analyst estimates page. e.g. https://ca.finance.yahoo.com/q/ae?s=cxw
I am wondering if there is any way to export EPS (data).
Thank you-
Thanks for your comment; however, we aren’t familiar with the finance details of Yahoo API. Hopefully someone would comment on your question.
-
-
Dear,
Thanks a million for the code. I’ve been using it for a while. I have some minor issues and wish if you can guide me to fix them within your code. The issues are:
– When I add new column before the “Head” Column, or new row above the “Head” row, the code doesn’t run, The error message is “Head is not found!”. Is it possible to make the head cell dynamic to be anywhere in the sheet?
– When I add a column in the middle without any yahoo tag to use it for my own calculations, the data gets updated in the columns before the empty one, but the data in the columns after the empty one doesn’t get updated. The same with the rows as well. Any empty row in the middle (without the company’s ticker) will make the data gets updated in the rows above only.Please let me know if this can be fixed.
Kind regards,
Waleed-
Yahoo made some changes. I updated the VBA code. Please use the current VBA code posted on this blog.
-
-
The code run yet?
I’am trying to use it, and i’am having a problem.
When i put to run the code this is what i obtain:
”Document Has Moved
Document Has Moved
<FONT FACE=Helvetica
Description: The document you requested has moved to a new location. The new location is http://download.finance.yahoo.com/d/quotes.csv?s=GGAL.BA+FB+GOOG&f=ap2.”
I don’t know what happen. Could you help me? (i’am sorry for my english, i’am argentinian)
-
Yahoo made some changes. I updated the VBA code.
-
-
It looks like:
Dim Yahoo_Finance_URL As String: Yahoo_Finance_URL = “http://finance.yahoo.com/d/quotes.csv?s=”
needs to be changed to
Dim Yahoo_Finance_URL As String: Yahoo_Finance_URL = “http://download.finance.yahoo.com/d/quotes.csv?s=”
I recently got redirect errors on the first URL.
-
Yes, that’s right. I updated the code.
-
-
Hi there, thank you for the code it works really well.
How do i get the pre market value or would that be the after hours one?
-
To my knowledge, I don’t think they have pre market value. I checked on another blog, they couldn’t find pre market value on Yahoo API.
-
-
Hey thanks for updating the code – much appreciated! It’s been very helpful to me these last couple of years and I was so glad I didn’t have to search for replacement solution.
I made a couple of changes in the Print_CSV Sub one that speeds up the execution, namely turning off the screen updating while it writes the CSV and the other giving a status bar update message just to let you know what’s going on.
Here’s the revised code in case anyone wants to use it:
‘ Download the CSV file and Print it in the cells
Sub Print_CSV(URL As String, head As Range)‘ Get the CSV file from Yahoo Finance
Dim Http As New WinHttpRequest
Application.StatusBar = “Getting Yahoo data…”
Http.Open “GET”, URL, False
Http.Send
Application.StatusBar = “Yahoo data received”Dim Resp As String: Resp = Http.ResponseText
Dim Lines As Variant: Lines = Split(Resp, vbLf)
Dim sLine As Variant
Dim Values As Variant
Dim Value As VariantDim i As Integer: i = 1
Dim next_column As Boolean: next_column = True
Dim col As Integer
Dim tmp As String
Application.ScreenUpdating = False‘ Extract CSV file Data to Cells
For Each sLine In Lines
Values = Split(sLine, “,”)
col = 1
tmp = “”
For Each Value In Values
‘ Read the info for this program which explains the lines below
tmp = tmp & Value
If Left(Value, 1) = “””” And Right(Value, 1) “””” Then next_column = False
If Not next_column And Right(Value, 1) = “””” Then next_column = True
If next_column Then
head.Offset(i, col).Value = Replace(tmp, Chr(34), “”) ‘ Remove ‘”‘
tmp = “”
col = col + 1
End If
Next Value
i = i + 1
Next sLine
Application.ScreenUpdating = True
Application.StatusBar = “Yahoo Finance data update completed at ” & Now
End Sub-
Glad that this helped you. And thank you for optimizing the code.
-
-
This looks to be a great program. Unfortunately I am getting a cannot find tag name error. It runs through the Sub Get_Special_Tags subroutine and does assign the tags to the specialtags array, but after 1 pass it hits to on error statement and stops. It never makes it to the pos=Application.Match statement.
-
Is anyone getting:
“Yahoo! – 999 Unable to process request at this time — error 999”?
-
Yup, I get the same error.
-
-
I recommend you use MarketXLS.
They have regular updates and customer support unlike yahoo.
I heard Yahoo Finance API has been discontinued. -
Thanks for this article. I think Yahoo finance is an outdated method. There are more easier and simpler way to get stock prices directly into your Excel without using any programming language or code. I personally use https://findynamics.com/ixbrlanalyst/
This is because historical data is dated 10 years with 15 days free trial. -
You can fetch historical data easily using iXBRANALYST addin. You can download it from microsoft store. This is the easiest way i can Recommend. Let me know if that was helpful
Leave a Reply
Содержание
- How to pull Yahoo Finance data into spreadsheets (Google Sheets and Excel)
- Creating an Excel Stock Information RTD server using the Yahoo Finance API
- Using the Yahoo Finance web-service
- Creating a new Excel RTD Server
- Integrating the Excel RTD server with the Yahoo API
- Using the RTD Server in Excel
- Available downloads:
- An Excel Blog For The Real World
- Use Yahoo! Finance To Pull Stock Information Into Excel
- WARNING.
- Breakdown Of The Yahoo! Finance Query URL
- A Few Examples
- Data Type Tables
- Refreshing The Formulas
- VBA Macro To Pull Historical Data
- ALERT!
- Get The VBA Example File
- About The Author
How to pull Yahoo Finance data into spreadsheets (Google Sheets and Excel)
Do you prefer using spreadsheets for deeper analysis? If so, you are likely familiar with the problem of pulling high-quality, up-to-date data into a spreadsheet.
So far, Google Sheets has been my go-to app for tracking the performance of various stocks. At first, manually inputting data seemed like a great idea. However, with the growing number of stocks to track, I found that I needed a more efficient method. And here it is.
Yahoo Finance API for automated research on stocks
Yahoo Finance provides great access to metrics for the numerous stock tickers, then allows one to input the information into a spreadsheet. However, the process is still manual, which is exactly what I wanted to avoid.
So, I started researching tools to automate my routine. I found that the data could be scraped out of the Yahoo Finance website. Or, if I wanted to be more sophisticated, I could use the Yahoo Finance API to pull the data into spreadsheets using the IMPORTXML formula or the ImportJSON script. Of course, I could apply my programming skills to solve this issue, but I would rather save my time and use a no-code solution.
After a long search, I discovered the easiest way to pull real-time Yahoo Finance data into my spreadsheets with no code. Apparently, Google Sheets offers a large range of add-ons. The Google Sheets add-on is a customizable application integrated into the spreadsheet to extend its functionality. The add-ons make our beloved spreadsheets infinitely powerful!
No-coding solution for stock research
There were many good add-ons for my problem but this one, called WebDataHub, does exactly what I needed, without any knowledge of coding. It pulls all financial data I need for my research, like real-time quotes, price history, summary details, financial data, key statistics, ESG scores, income statements, cash flow statements, and balance sheet statements.
And thanks to Yahoo Finance, it is not limited to equity stocks. The add-on pulls data for various indices, currency exchange rates, cryptocurrency, ETF, mutual funds, etc. — all real-time, high-quality data in my single spreadsheet!
The WebDataHub add-on can be found and installed from the Google G Suite Marketplace directly through this link.
For those who prefer Excel over Google Sheets, I suggest first loading the data with the add-on into Google Sheets and then downloading XLSX from Google Sheets, as shown in the video.
Thanks for reading this far! I won’t tell you what analysis to perform on this type of data, as you know better than I do. However, in the comments, you can share your ideas regarding analysis using Yahoo Finance data. It would also be great if you could brainstorm ideas of what data sources can be meshed to create unique and profitable insights. For example, I’m wondering whether meshing real estate data from Zillow or Realtor.com, finance data from Yahoo Finance, short rental data from Airbnb, and travel data from Tripadvisor can help one find undervalued properties that are good for investing. Please share your thoughts in the comments.
I recently learned a few ways how the Yahoo Finance data is used for analysis and I would like to share them in the article, since the article gained a lot of attention.
First, the add-on becomes a great engine for a personal stock market portfolio tracker. The next video demonstrates how such a portfolio tracker can be configured in Google Sheets.
Second, cryptocurrencies are taking over the financial world. And as a result more investors started getting crypto data for analysis. The video below shows how to pull historical prices into spreadsheets.
Third, the CALL and PUT options are very advanced financial instruments. And the options data can be also pulled from Yahoo Finance into Google Sheets for analysis. Here is the video about how it can be done.
The comments are always welcome!
This article is for informational purposes only. It should not be considered Financial or Legal Advice. Consult a financial professional before making any major financial decisions.
Источник
Creating an Excel Stock Information RTD server using the Yahoo Finance API
Yahoo’s Query Language or YQL allows you to run SQL-like queries against a variety of web services. The amount of available web services are immense! To get a better idea of all the available services, which services are on offer, and the type of data they return, have a look at the YQL Console.
In today’s article, we’ll write an Excel RTD server that returns the latest stock prices and other information. In case you’re not familiar with Excel RTD servers, it is used to communicate with a real-time data source, such as stock quotes and provide the user with a constant flow of changing data.
Using the Yahoo Finance web-service
To retrieve this information we’ll use the data available in the yahoo.finance.quotes table. First, we’ll need to see the data that resides in this table, by navigating to the YQL Console. In the top left corner, make sure the Show Community Tables checkbox is checked.
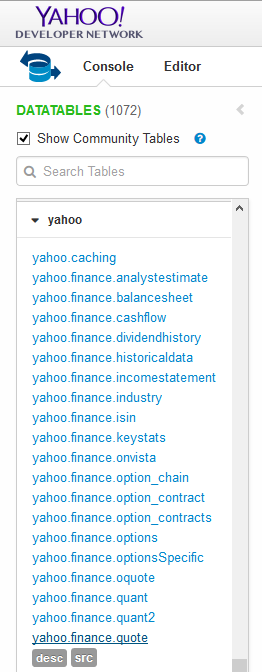
Next, scroll down to the yahoo group and click on yahoo.finance.quotes. The console will open a page with a demonstration on how to use the table, which includes a sample query. You have a choice to return the data in either XML or JSON.
Change the YQL statement to: select * from yahoo.finance.quotes where symbol=”MSFT” and click the Test button. The result should show the stock information for Microsoft:
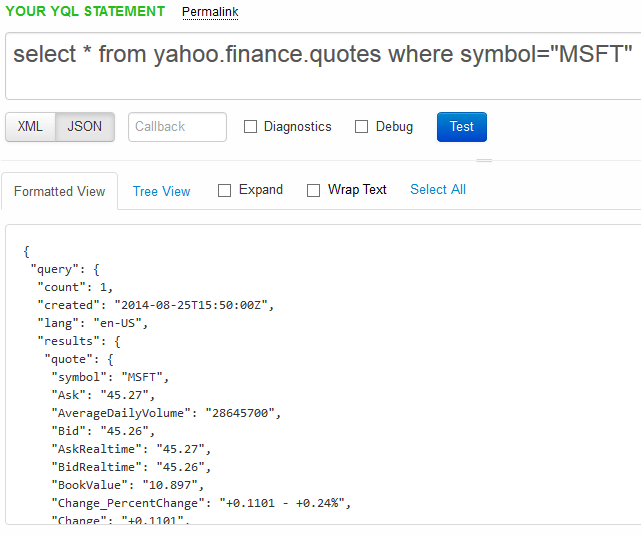
At the bottom of the page you should see the Rest query which you can use to call the web-service by performing a HTTP GET request to the URL shown inside the Rest query textbox. In our example the URL is:
Creating a new Excel RTD Server
Now that we have an idea on the type of data to expect from the YQL finance tables, we can create an Excel RTD server to implement the Yahoo service. First, use Add-in Express for Office and .net to create a new RTD Server project in Visual Studio.
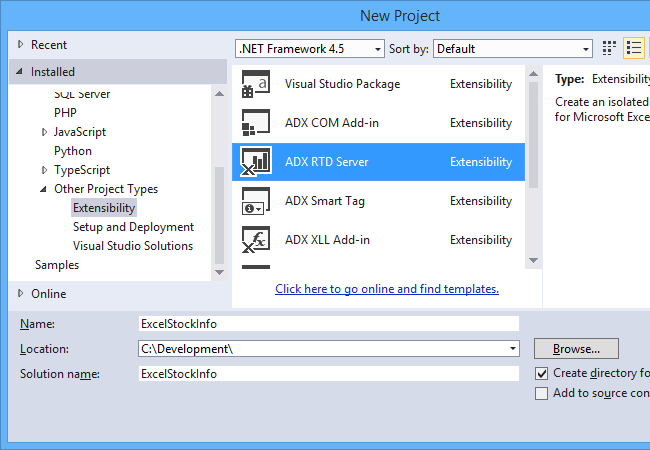
Select your programming language of choice. For this example, we’ll be creating a Visual C# Project, you can also write in VB.NET or Visual C++.
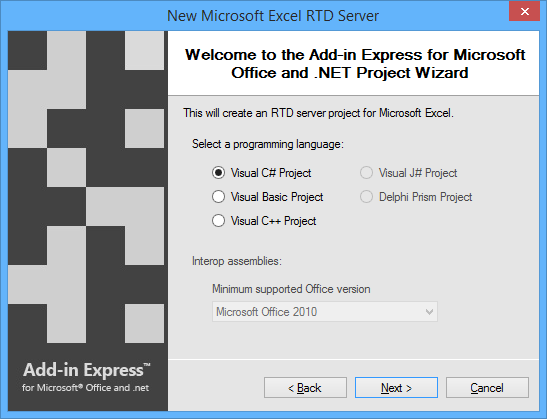
After the “New Microsoft Excel RTD Server” project wizard has completed, double-click on the RTDServerModule.cs class to open its design surface. Set its Interval property to 600000, which will cause the data returned by our RTD server to be updated every 10 minutes.
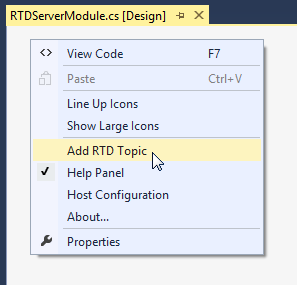
Right-click on the designer surface and select Add RTD Topic from the context-menu.
Select the newly added RTD Topic component and set its properties to the following:
- Name : rtdTopicQuotes
- String01 : *
- String02 : *
- UseStoredValue : True
Next, click on the Events button on the Properties window toolbar, and generate an event handler for the RTD Topic’s RefreshData event by double-clicking next to the event name inside the Properties window.
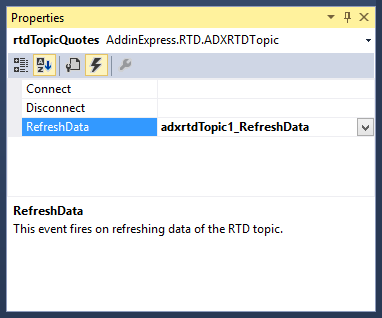
Inside the event handler method for the RTD Topic, add the following code:
Integrating the Excel RTD server with the Yahoo API
The preceding code will retrieve the stock symbol as well as the field name to display from the RTD formula inside Excel and in turn call the GetValue method with the two values. The code for the GetValue method follows below:
The GetValue method receives the stock info data for the passed in symbol in JSON format and uses the Newtonsoft.Json library to convert the data into a dynamic object. We then use the TryGetValue method to get the value of the field name, passed in as a parameter, from the JSON data. Finally, we return the data if the field is valid, but if the field is not valid, we return an error message.
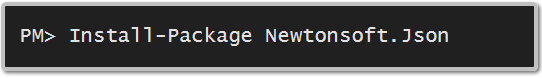
Note: To add the Newtonsoft.Json library to your project, open the Package Manager Console, by selecting it from the Tools > NuGet Package Manager menu. Type the following command in the console:
Finally, we use the HttpGet method to perform an HTTP GET request to the Yahoo Finance API. The code for the HttpGet method is as follows:
Using the RTD Server in Excel
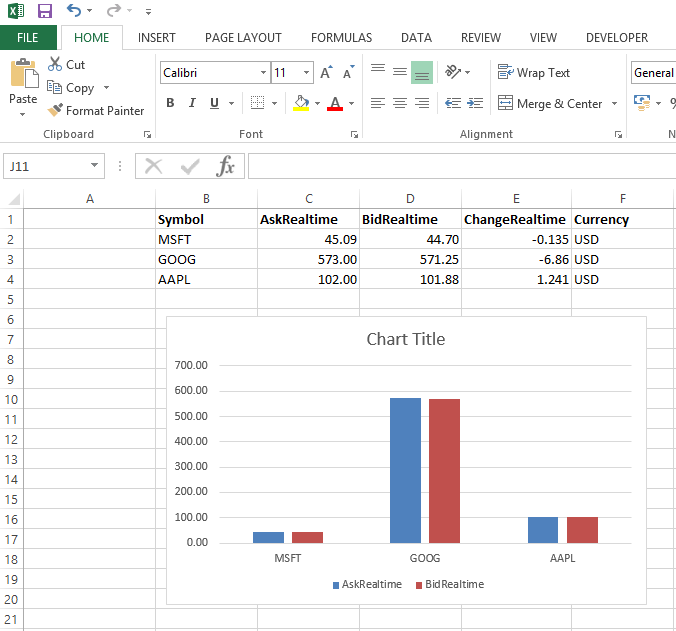
We’re now ready to test our Excel RTD Server and see whether it returns real-time data from Yahoo Finance. Build, register and run your project. Inside Excel, we’ll use the following formula:
The formula above, calls the Excel Real-Time Data server we’ve just created and passes in the symbol, which is stored in the B2 column. We get the field name to return from the value stored in the column of the first row, which in this case is the AskRealtime field.
We also convert the returned value to a number using the NUMBERVALUE Excel formula – this is to enable us to add an Excel graph that uses the values. The final result inside Excel could look similar to the following screenshot:
Thank you for reading. Until next time, keep coding!
Available downloads:
This RTD server was developed using Add-in Express for Office and .net:
Источник
An Excel Blog For The Real World
A blog focused primarily on Microsoft Excel, PowerPoint, & Word with articles aimed to take your data analysis and spreadsheet skills to the next level. Learn anything from creating dashboards to automating tasks with VBA code!
Use Yahoo! Finance To Pull Stock Information Into Excel
WARNING.
As of Q3 2017, the Yahoo! Finance capabilities in Excel have been disabled (by Yahoo!, after Verizon bought them).
Luckily, more recent versions of Excel now have built-in features that can replace the need to pull data from Yahoo! Finance. Check out these articles for more information:
I’ve been playing around with building some Stock Tracking tools for Excel and I’ve learned a lot about how to query data from Yahoo! Finances API to get it into Excel while it’s all fresh in my memory, I figured I would take some time and document some of the techniques I’ve been using in my spreadsheets.
Breakdown Of The Yahoo! Finance Query URL
The premise behind how you query stock information in your web browser ultimately boils down to the URL address. Here is the standard URL address formula with two inputs (the Ticker Symbol and the Data Type).
https://download.finance.yahoo.com/d/quotes.csv?s= [Ticker Symbol] &f= [Data Type]
A Few Examples
To get this data from a web address into an Excel spreadsheet, we can use the WEBSERVICE() function. I’ll also wrap a NUMBERVALUE() function around to convert the import text from Yahoo! Finance into a numerical value we can use inside Excel.
Example 1: Pull The «Current Stock Price» for Microsoft’s Stock
=NUMBERVALUE(WEBSERVICE(«https://download.finance.yahoo.com/d/quotes.csv?s=MSFT&f=l1«))
Example 2: Pull The «Current Dividend» for Microsoft’s Stock
=NUMBERVALUE(WEBSERVICE(«https://download.finance.yahoo.com/d/quotes.csv?s=MSFT&f=d«))
Example 3: Pull «% change From 52 Week Low» for Microsoft
This one is a little bit trickier because the results from the url have a plus sign or a negative sign in front of the resulting % change which the NUMBERVALUE() function does not like. In the following formula, I am taking the result from Yahoo! finance and removing the first character (ie +/-) from the result.
=NUMBERVALUE(REPLACE(WEBSERVICE(«https://download.finance.yahoo.com/d/quotes.csv?s=MSFT&f=j6«),1,1,»»))
Example 4: Link your Ticker Symbols to a Spreadsheet Cell
If you want to use the same formula for a bunch of different ticker symbols, you can link your formula using a cell reference. Here is the same formula from Example 1, however it is now point to a ticker symbol in cell A2.
=NUMBERVALUE(WEBSERVICE(«https://download.finance.yahoo.com/d/quotes.csv?s=» & A2 & «&f=l1«))
Data Type Tables
Yahoo! has a whole collection of data points you can pull about a specific ticker symbol. Here is a list of the variables and what they pull in:
Stock Pricing
Averages
| Variable | Description |
|---|---|
| a | Ask |
| b | Bid |
| b2 | Ask (Real-time) |
| b3 | Bid (Real-time) |
| p | Previous Close |
| o | Open |
| c1 | Change |
| c | Change & Percent Change |
| c6 | Change (Real-time) |
| k2 | Change Percent (Real-time) |
| p2 | Change in Percent |
| d1 | Last Trade Date |
| d2 | Trade Date |
| t1 | Last Trade Time |
Dividends
| Variable | Description |
|---|---|
| y | Dividend Yield |
| d | Dividend per Share |
| r1 | Dividend Pay Date |
| q | Ex-Dividend Date |
| Variable | Description |
|---|---|
| c8 | After Hours Change (Real-time) |
| c3 | Commission |
| g | Day’s Low |
| h | Day’s High |
| k1 | Last Trade (Real-time) With Time |
| l | Last Trade (With Time) |
| l1 | Last Trade (Price Only) |
| t8 | 1-Year Target Price |
| m5 | Change From 200 Day Moving Average |
| m6 | % Change From 200 Day Moving Average |
| m7 | Change From 50 Day Moving Average |
| m8 | % Change From 50 Day Moving Average |
| m3 | 50-Day Moving Average |
| m4 | 200-Day Moving Average |
Volume
| Variable | Description |
|---|---|
| v | Volume |
| a5 | Ask Size |
| b6 | Bid Size |
| k3 | Last Trade Size |
| a2 | Average Daily Volume |
52-Week Pricing
Ticker Related Information
| Variable | Description |
|---|---|
| k | 52-Week High |
| j | 52-Week Low |
| j5 | Change From 52-Week Low |
| k4 | Change From 52-Week High |
| j6 | Percent Change From 52-Week Low |
| k5 | Percent Change From 52-Week High |
| w | 52-Week Range |
| g1 | Holdings Gain Percent |
| g3 | Annualized Gain |
| g4 | Holdings Gain |
| g5 | Holdings Gain Percent (Real-time) |
| g6 | Holdings Gain (Real-time) |
| Variable | Description |
|---|---|
| i | More Info |
| j1 | Market Capitalization |
| j3 | Market Cap (Real-time) |
| f6 | Float Shares |
| n | Name |
| n4 | Notes |
| s | Symbol |
| s1 | Shares Owned |
| x | Stock Exchange |
| j2 | Shares Outstanding |
Financial Ratios
| Variable | Description |
|---|---|
| e | Earnings per Share |
| e7 | EPS Estimate Current Year |
| e8 | EPS Estimate Next Year |
| e9 | EPS Estimate Next Quarter |
| b4 | Book Value |
| j4 | EBITDA |
| p5 | Price / Sales |
| p6 | Price / Book |
| r | P/E Ratio |
| r2 | P/E Ratio (Real-time) |
| r5 | PEG Ratio |
| r6 | Price / EPS Estimate Current Year |
| r7 | Price / EPS Estimate Next Year |
| s7 | Short Ratio |
Miscellaneous
| Variable | Description |
|---|---|
| t7 | Ticker Trend |
| t6 | Trade Links |
| i5 | Order Book (Realtime) |
| l2 | High Limit |
| l3 | Low Limit |
| v1 | Holdings Value |
| v7 | Holdings Value (Realtime) |
| s6 | Revenue |
| w1 | Day’s Value Change |
| w4 | Day’s Value Change (Realtime) |
| p1 | Price Paid |
| m | Day’s Range |
| m2 | Day’s Range (Realtime) |
| c4 | Currency |
Refreshing The Formulas
As you might imagine, if you are pulling realtime data from Yahoo! Finance, Excel is not going to recalculate your WEBSERVICE() formulas every second. Therefore, you will need to manually recalculate your sheet (keyboard shortcut F9) in order to refresh your formulas.
VBA Macro To Pull Historical Data
ALERT!
As of May 2017, it has been reported that Yahoo! has terminated the iChart platform which allowed us to pull historical information into Excel for free. I found this response from a Yahoo employed moderator in their forums:
I’m not sure what the end goal is for this move, maybe they will begin offerring a paid service in the future. Due to this recent event, the below VBA code to pull historical data from Yahoo! finance will not long work unless they bring back the old API method.
Yahoo! Finance has a ton of historical data for stocks and harnessing VBA’s automating power to pull this data in seconds can allow you to perform some unbelievable tailor-made analysis. Let’s take this very simple setup in Excel where we have the Stock Ticker in Cell B2 and the Start/End date range you want to pull in Cell C4 and Cell F4 respectively. Also, the Excel Table is named «StockTable».
See if you can follow along with the VBA as it pulls data directly from Yahoo! Finance and places it into Excel. There is a little extra clean up you need to do since the query is pulled into excel as a CSV (comma separated values) data set.
ALSO NOTE: Through some testing, it seems you will need to have at least one extra column in your table (ie the black section in the image above) in order to retain the Table Object after the VBA performs the TextToColumns function. You can just leave this extra column blank if you do not need to perform any extra calculations.
Sub YahooFinanceQuery()
‘PURPOSE: Pull Historical Stock Data From Yahoo! Finance
‘SOURCE: www.TheSpreadsheetGuru.com
Dim EndDate As Date
Dim StartDate As Date
Dim StockTicker As String
Dim QueryURL As String
Dim QueryDataRange As Range
Dim QueryLocation As Range
Dim tbl As ListObject
‘Optimize Code
Application.ScreenUpdating = False
Application.DisplayAlerts = False
‘Query Parameters
StartDate = Range(«C4»).Value
EndDate = Range(«F4»).Value
StockTicker = Range(«B2»).Value
‘Store Table Object to a Variable
Set tbl = ActiveSheet.ListObjects(«StockTable»)
‘Determine Where To Place Query (Column Prior To Table)
Set QueryLocation = tbl.Range(1, 1).Offset(0, -1)
QueryLocation.EntireColumn.Insert Shift:=xlToRight, CopyOrigin:=xlFormatFromLeftOrAbove
Set QueryLocation = QueryLocation.Offset(0, -1)
‘Delete all table rows except first row
With tbl.DataBodyRange
If .Rows.Count > 1 Then
.Offset(1, 0).Resize(.Rows.Count — 1, .Columns.Count).Rows.Delete
End If
End With
‘Create Web Address To Query Historic Stock Data
QueryURL = «http://ichart.finance.yahoo.com/table.csv?s=» & StockTicker
QueryURL = QueryURL & «&a=» & Month(StartDate) — 1 & «&b=» & Day(StartDate) & _
«&c=» & Year(StartDate) & «&d=» & Month(EndDate) — 1 & «&e=» & _
Day(EndDate) & «&f=» & Year( End Date) & «&g=» & QueryLocation & «&q=q&y=0&z=» & _
StockTicker & «&x=.csv»
‘Pull Query Into Excel
With ActiveSheet.QueryTables.Add(Connection:=»URL;» & QueryURL, Destination:=QueryLocation)
.BackgroundQuery = True
.TablesOnlyFromHTML = False
.Refresh BackgroundQuery:= False
.SaveData = True
End With
‘Determine Stock Data Range
ActiveSheet.UsedRange
Set QueryDataRange = ActiveSheet.Range(QueryLocation, Cells(ActiveSheet.Cells _
(ActiveSheet.Rows.Count, QueryLocation.Column). End (xlUp).Row — 1, QueryLocation.Column))
‘Sort Data in Ascending Order
ActiveSheet.Sort.SortFields.Clear
ActiveSheet.Sort.SortFields.Add Key:=QueryDataRange, _
SortOn:=xlSortOnValues, Order:=xlAscending, DataOption:=xlSortNormal
With ActiveSheet.Sort
.SetRange QueryDataRange
.Header = xlYes
.MatchCase = False
.Orientation = xlTopToBottom
.SortMethod = xlPinYin
.Apply
End With
‘Delimit Stock Data into Table
QueryDataRange.TextToColumns Destination:=QueryLocation.Offset(0, 2), DataType:=xlDelimited, _
TextQualifier:=xlDoubleQuote, ConsecutiveDelimiter:=False, Tab:=True, _
Semicolon:=False, Comma:=True, Space:= False , other:=False
‘Delete Yahoo! Finance Stock Query
QueryLocation.EntireColumn.Delete
‘Optimize Code
Application.ScreenUpdating = True
Application.DisplayAlerts = True
Get The VBA Example File
If you need a little head start or are not comfortable with VBA quite yet, I have put together a great little example Excel file with the examples covered in this article.
If you would like to get a copy of the Excel file I used throughout this article, feel free to directly download the spreadsheet by clicking the download button below.
Hey there! I’m Chris and I run TheSpreadsheetGuru website in my spare time. By day, I’m actually a finance professional who relies on Microsoft Excel quite heavily in the corporate world. I love taking the things I learn in the “real world” and sharing them with everyone here on this site so that you too can become a spreadsheet guru at your company.
Through my years in the corporate world, I’ve been able to pick up on opportunities to make working with Excel better and have built a variety of Excel add-ins, from inserting tickmark symbols to automating copy/pasting from Excel to PowerPoint. If you’d like to keep up to date with the latest Excel news and directly get emailed the most meaningful Excel tips I’ve learned over the years, you can sign up for my free newsletters. I hope I was able to provide you with some value today and I hope to see you back here soon!
Источник

Creating an Excel Stock Information RTD server using the Yahoo Finance API
Posted on Thursday, September 25th, 2014 at 9:39 am by .
Yahoo’s Query Language or YQL allows you to run SQL-like queries against a variety of web services. The amount of available web services are immense! To get a better idea of all the available services, which services are on offer, and the type of data they return, have a look at the YQL Console.
In today’s article, we’ll write an Excel RTD server that returns the latest stock prices and other information. In case you’re not familiar with Excel RTD servers, it is used to communicate with a real-time data source, such as stock quotes and provide the user with a constant flow of changing data.
- Using the Yahoo Finance web-service
- Creating a new Excel RTD Server
- Integrating the Excel RTD server with the Yahoo API
- Using the RTD Server in Excel
Using the Yahoo Finance web-service
To retrieve this information we’ll use the data available in the yahoo.finance.quotes table. First, we’ll need to see the data that resides in this table, by navigating to the YQL Console. In the top left corner, make sure the Show Community Tables checkbox is checked.
Next, scroll down to the yahoo group and click on yahoo.finance.quotes. The console will open a page with a demonstration on how to use the table, which includes a sample query. You have a choice to return the data in either XML or JSON.
Change the YQL statement to: select * from yahoo.finance.quotes where symbol=”MSFT” and click the Test button. The result should show the stock information for Microsoft:
At the bottom of the page you should see the Rest query which you can use to call the web-service by performing a HTTP GET request to the URL shown inside the Rest query textbox. In our example the URL is:
https://query.yahooapis.com/v1/public/yql?q=select%20*%20from%20yahoo.finance.quotes%20where%20symbol%3D%22MSFT%22&format=json&env=store%3A%2F%2Fdatatables.org%2Falltableswithkeys&callback=
Creating a new Excel RTD Server
Now that we have an idea on the type of data to expect from the YQL finance tables, we can create an Excel RTD server to implement the Yahoo service. First, use Add-in Express for Office and .net to create a new RTD Server project in Visual Studio.
Select your programming language of choice. For this example, we’ll be creating a Visual C# Project, you can also write in VB.NET or Visual C++.
After the “New Microsoft Excel RTD Server” project wizard has completed, double-click on the RTDServerModule.cs class to open its design surface. Set its Interval property to 600000, which will cause the data returned by our RTD server to be updated every 10 minutes.
Right-click on the designer surface and select Add RTD Topic from the context-menu.
Select the newly added RTD Topic component and set its properties to the following:
- Name : rtdTopicQuotes
- String01 : *
- String02 : *
- UseStoredValue : True
Next, click on the Events button on the Properties window toolbar, and generate an event handler for the RTD Topic’s RefreshData event by double-clicking next to the event name inside the Properties window.
Inside the event handler method for the RTD Topic, add the following code:
private object adxrtdTopic1_RefreshData(object sender)
{
    if (sender is ADXRTDTopic)
    {
        ADXRTDTopic topic = sender as ADXRTDTopic;
        string symbol = topic.String01;
        string fieldName = topic.String02;
        return GetValue(symbol, fieldName);
    }
    return default(object);
}
Integrating the Excel RTD server with the Yahoo API
The preceding code will retrieve the stock symbol as well as the field name to display from the RTD formula inside Excel and in turn call the GetValue method with the two values. The code for the GetValue method follows below:
private string GetValue(string symbol, string field)
{
    string json = HttpGet(symbol, field);
    dynamic obj = JsonConvert.DeserializeObject(json);
    var quote = obj.query.results.quote;

    JToken returnValue = null;
    quote.TryGetValue(field, out returnValue);
    if (returnValue != null)
        return returnValue.Value();

    return field + " is not a valid field name.";
}
The GetValue method receives the stock info data for the passed in symbol in JSON format and uses the Newtonsoft.Json library to convert the data into a dynamic object. We then use the TryGetValue method to get the value of the field name, passed in as a parameter, from the JSON data. Finally, we return the data if the field is valid, but if the field is not valid, we return an error message.
Note: To add the Newtonsoft.Json library to your project, open the Package Manager Console, by selecting it from the Tools > NuGet Package Manager menu. Type the following command in the console:
Finally, we use the HttpGet method to perform an HTTP GET request to the Yahoo Finance API. The code for the HttpGet method is as follows:
private string HttpGet(string symbol, string field)
{
    string uri = string.Format("https://query.yahooapis.com/v1/public/yql?q=select%20*%20from%20yahoo.finance.quotes%20where%20symbol=%22{0}%22&format=json&env=store%3A%2F%2Fdatatables.org%2Falltableswithkeys", symbol);

    var req = WebRequest.Create(uri);
    var resp = req.GetResponse();
    var sr = new System.IO.StreamReader(resp.GetResponseStream());
    return sr.ReadToEnd().Trim();
}
Using the RTD Server in Excel
We’re now ready to test our Excel RTD Server and see whether it returns real-time data from Yahoo Finance. Build, register and run your project. Inside Excel, we’ll use the following formula:
=NUMBERVALUE(RTD("excelstockinfo.rtdservermodule","",B2, $C$1))
The formula above, calls the Excel Real-Time Data server we’ve just created and passes in the symbol, which is stored in the B2 column. We get the field name to return from the value stored in the column of the first row, which in this case is the AskRealtime field.
We also convert the returned value to a number using the NUMBERVALUE Excel formula – this is to enable us to add an Excel graph that uses the values. The final result inside Excel could look similar to the following screenshot:
Thank you for reading. Until next time, keep coding!
Available downloads:
This RTD server was developed using Add-in Express for Office and .net:
Excel Stock sample RTD server (C#)
You may also be interested in:
Calling Yahoo Weather web-service from an Outlook add-in
I was using Excel to model my retirement portfolio and wanted to get the stock prices from the web. Found a bunch of helpful links, which I will share below, but for a simple close price, I used a VBA function to pull the close price from Yahoo Finance API. Add it to the module, not class module, to use it from any excel sheet.
Option Explicit

Function StockQuote(ByVal ticker As String) As Double
Dim url As String
Dim closePrice As Double
Dim http As Object

    ' Compile the request URL with start date and end date
    url = "http://download.finance.yahoo.com/d/quotes.csv?s=" & ticker & "&f=l1"

    Set http = CreateObject("MSXML2.XMLHTTP")
    http.Open "GET", url, False
    http.Send

    StockQuote = http.responseText
    Set http = Nothing
End Function
You can read up on this API here: http://code.google.com/p/yahoo-finance-managed/wiki/csvQuotesDownload.
How to use
Use a function like any standard Excel function from any cell. Refer to another cell for the ticker value or pass a hardcoded string.

Press enter and…

Links to sources:
- API documentation on google code
- Video Tutorial by DontFretBred
- Using the Yahoo Finance API for CSV
- Detailed API documentation by Clif Ngan
Файлы к уроку:
- Для спонсоров Boosty
- Для спонсоров VK
Ссылки:
- Страница курса
- Плейлист YouTube
- Плейлист ВК
Описание
Вы хотите получить котировки с сайта Yahoo Finance. Как обработать формат JSON?
Мы разберем еще 1 способ получения котировок с сайта Yahoo Finance при помощи Excel. Этот способ будет намного быстрее предыдущего.
Решение
Для решения воспользуемся:
- Text.From
- Number.From
- Date.From
- DateTimeZone.LocalNow
- Table.FromColumns
- Table.ReplaceValue
Сначала мы вычислим сегодняшнюю дату в формате UNIX TIME с помощью формулы:
Text.From((Number.From(Date.From(DateTimeZone.LocalNow()))-Number.From(Date.From("01.01.1970"))) * 86400)После этого мы запросим данные с помощью API:
Json.Document(
      Web.Contents(
         "https://query1.finance.yahoo.com/v8/finance/chart/MCD?interval=1d&period1=1&period2="
            & today
            & ""
      )
   )
Дальше останется только привести данные к надлежащему виду.
Примененные функции
- Json.Document
- Web.Contents
- Record.ToTable
- Table.Transpose
- Table.ExpandListColumn
- Table.Skip
- Table.ExpandRecordColumn
- Table.AddColumn
- Table.FromColumns
- Table.ReplaceValue
- Date.From
- Int64.From
- Replacer.ReplaceValue
- Text.From
- DateTimeZone.LocalNow
- Number.From
Код
let
   query = Json.Document(
      Web.Contents(
         "https://query1.finance.yahoo.com/v8/finance/chart/MCD?interval=1d&period1=1&period2="
            & today
            & ""
      )
   ),
   chart = query[chart],
   result = chart[result],
   result1 = result{0},
   tab_from_record = Record.ToTable(result1),
   get_value = tab_from_record{2}[Value],
   get_tab_1 = Record.ToTable(get_value),
   tab_transpose = Table.Transpose(
      Table.ExpandListColumn(get_tab_1, "Value")
   ),
   rows_skip = Table.Skip(tab_transpose, 1),
   col_expand_1 = Table.ExpandRecordColumn(
      rows_skip,
      "Column1",
      {"open", "close", "volume", "low", "high"},
      {"open", "close", "volume", "low", "high"}
   ),
   col_expand_2 = Table.ExpandRecordColumn(
      col_expand_1,
      "Column2",
      {"adjclose"},
      {"adjclose"}
   ),
   tab_add_col_1 = Table.AddColumn(
      col_expand_2,
      "Пользовательская",
      each Table.FromColumns(
         {
            tab_from_record{[Name = "timestamp"]}[Value],
            [open],
            [high],
            [low],
            [close],
            [adjclose],
            [volume]
         },
         {"Date", "O", "H", "L", "C", "Adj C", "Vol"}
      )
   ),
   get_tab_2 = tab_add_col_1{0}[Пользовательская],
   col_replace_value = Table.ReplaceValue(
      get_tab_2,
      each [Date],
      each Date.From("1.1.1970")
         + #duration(Int64.From([Date] / 60 / 60 / 24) - 1, 0, 0, 0),
      Replacer.ReplaceValue,
      {"Date"}
   )
in
   col_replace_value
Этот урок входит в курс Веб-запросы в Power Query
| Номер урока | Урок | Описание |
|---|---|---|
| 1 | Котировки Yahoo Finance | Вы хотите получить историю котировок акций MCD с 2000 года по текущий день с сайта Yahoo Finance. Вы копируете ссылку на раздел с историческими данными, вставляете ссылку в Power Query и получаете только 100 строк. |
| 2 | HTML, получение данных по облигациям | Мы хотим получить данные по всем облигациям со страницы bonds.finam.ru |
| 3 | Многостраничное извлечение | На разных страницах находятся сайта находятся котировки золота на каждый год. Нужно соединить все данные в одну таблицу. |
| 4 | JSON, Котировки Yahoo Finance 2 | В этом уроке мы разберем еще один способ скачивания котировок с Yahoo Finance. Этот способ намного удобнее и быстрее. Здесь мы научимся обрабатывать формат JSON. |
| 5 | Котировки Московской биржи | В этом уроке мы научимся получать прямо в Excel котировки разных ценных бумаг с сайта Московской биржи. Московская биржа предоставляет возможность скачивать котировки и другую информацию по ценным бумагам при помощи специальных ссылок. Если мы введем такую ссылку в Power Query, создав запрос из интернета, то получим интересующие нас котировки прямо в Excel. |
| 6 | Неразмеченный текст | Вы делаете запрос к Web-странице и сталкиваетесь с неразмеченным текстом. Вы хотите при помощи Power Query этот неразмеченный текст преобразовать в нормальную красивую таблицу. |
| 7 | Текстовый документ, веб-страница, List.Zip | В этом запросе мы научимся получать нужную информацию из текста веб-страницы. |
| 8 | Youtube Data API | В этом уроке мы научимся получать данные из Youtube Data API. Узнаем как получить данные о Youtube канале: список видео и плейлистов, названия, описания, длительность, тэги, количество лайков, дизлайков, просмотров и комментариев. |
| 9 | Личный OneDrive — подключаемся напрямую к файлам и папкам | В этом уроке мы разберем как напрямую подключиться к файлам и папкам на личном OneDrive. |
| 10 | Подключение Google Spreadsheets, Google Drive (Excel.Workbook, Web.Contents) | В этом уроке мы научимся подключаться к xlsx файлам, которые находятся в вашем Google Drive. |
| 11 | Получить все станции метро | Получим таблицу с перечнем станций метрополитена даже с координатами широты и долготы. |
| 12 | Получить ссылки с веб-страницы (Html.Table) | Получить URL с веб-страницы. Сделать запрос к каждому URL, получить таблицы и объединить их всех по вертикали. |
| 13 | Получить все URL с веб-страницы | Получим нужные URL с веб-страницы в Excel. Сделать запрос к каждому URL, получить таблицы и объединить их по вертикали. |
| 14 | Ищем работу через API Head Hunter (hh.ru) | Получим таблицу с перечнем вакансий с сайте HH. Получим вакансии, в названии или описании которых встречаются слова SQL, Pandas, Power Query, Power Pivot, Power BI. |
| 15 | Запрос к XML Sitemap | Сделаем запрос к sitemap.xml, чтобы извлечь список всех веб-страниц сайта. |
There are a few different ways you can pull stock prices into Excel. You can use the new STOCKHISTORY function, pull data from Google Sheets which has a native stock function, or you can also use Power Query. In this post, Power Query is what I am going to focus on and show you how you can pull data right from Yahoo Finance. Of course, if you don’t want to do it yourself, I also have a template that is ready to use and download (at the bottom of the page).
Creating the query
For this example, let’s pull Apple’s stock history for the past month. To do this, we can simply go to the Yahoo Finance page that shows the stock’s recent price history, located here and select any interval, whether it is five days, one month, or three, it doesn’t matter.
To get the complete data set, I’m going to copy the actual CSV download link from that page, not simply the URL. That way, it is possible to pull a much wider range than the default of 100 days.
I’m going to use that link to set up the query. To create it, go into the Data tab, select the From Web button next to Get Data:
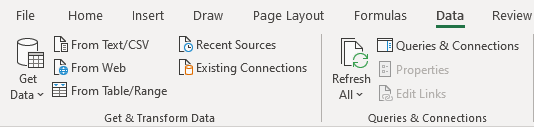
On the next page, you’ll be given a place to enter a URL, and this is where I am going to enter the download link from Yahoo Finance:
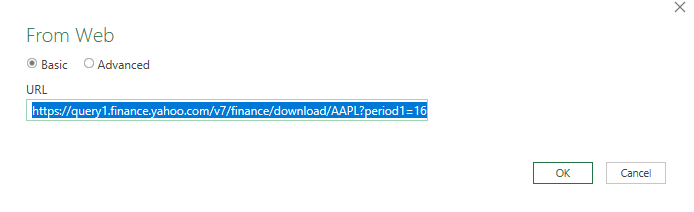
Click on OK and Power Query will connect to the web page. Next, you will see a preview of the data and if it looks okay, you can just click on the Load button:
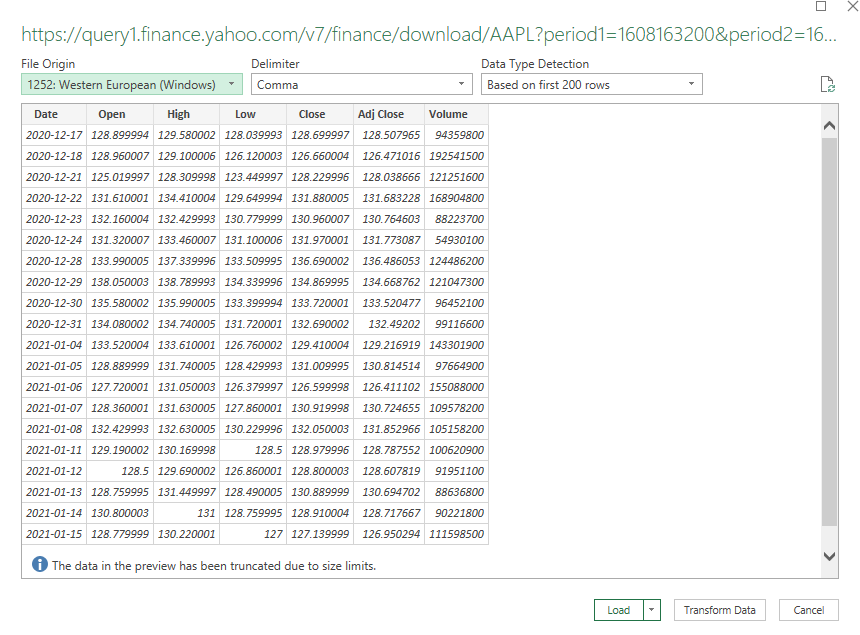
Then, the data will load into your spreadsheet and it should look something like this:
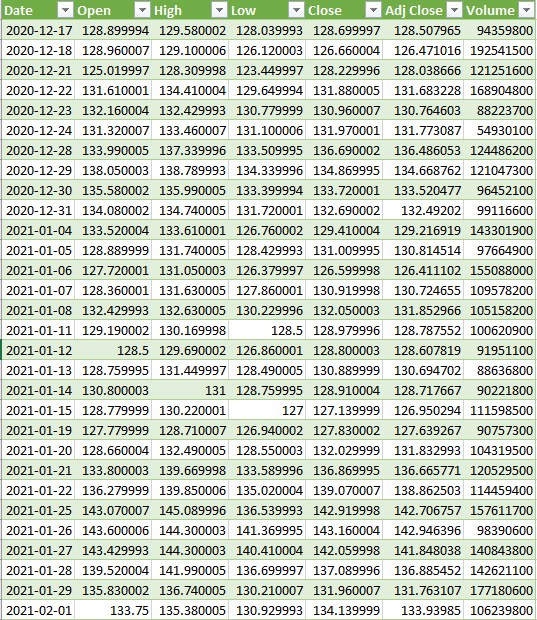
If that’s all you need, you can stop here. The only downside is if you wanted to look at a different ticker or change the date range, you would need to get a new link, and update the query manually, which is not ideal at all. This can be automated and takes a little more effort but it can be done by adding some variables and making some tweaks to the query.
Setting up the variables
In Power Query, you can utilize named ranges. In this case, I’ll set them up for the ticker symbol, as well as the start and end dates. That way, I can pull up a stock’s history for a specific time frame. The three named ranges I’m going to create are called Ticker, StartDate, and EndDate which can be entered all in the same place:

For the dates to work on Yahoo Finance, they need to be converted to a timestamp. This is what that calculation looks like:
=(A1-DATE(1970,1,1))*60*60*24
Where A1 is the date. This is what the dates look like when converted into this format:
Those timestamps are needed for the Yahoo Finance URL to populate properly. These are the values that need to be tied to a named range.
Next, these ranges need to be coded into Power Query. To do this, click anywhere on the table that the query created, and you should now see a section for Query in the Ribbon and click on the Edit button:
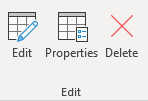
That will launch the editor. From there, you will want to click on the Advanced Editor button:
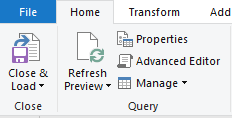
Then, you’ll see how the query is coded:
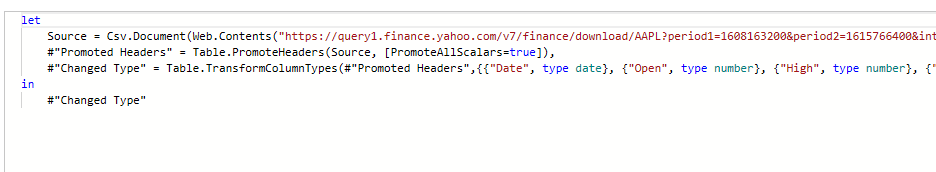
You can see the source variable is where the URL goes. To insert a named range from the Excel document into this code, we need to use the following format:
VariableName = Excel.CurrentWorkbook(){[Name=”namedrange“]}[Content]{0}[Column1]
Creating the ticker variable will look as follows:
Ticker = Excel.CurrentWorkbook(){[Name=”TICKER”]}[Content]{0}[Column1]
To keep things simple, I kept the name of the variable the same as the named range within the Excel file. Here is what the editor looks like after adding in the variables for the ticker, start date, and end date:
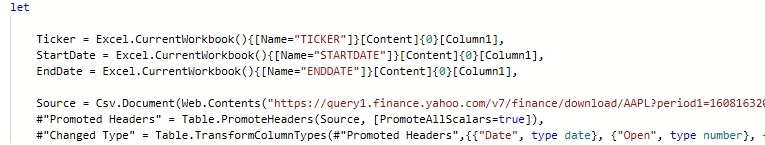
The one thing that I still need to adjust is the source. This is a hardcoded URL and it needs to be more dynamic, utilizing the variables.
In this part, I’ll need to adjust the query carefully to ensure that it is generated correctly. I will put the ticker variable where the ticker should go, and put the start and end dates (in Unix format). This is an excerpt of how the updated source data looks like:
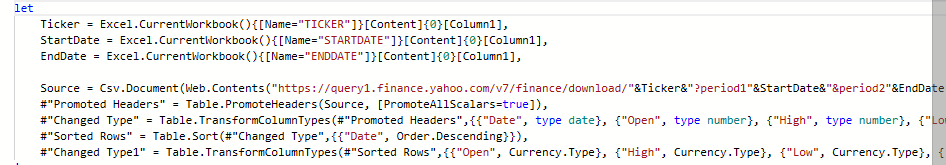
Note that for the start and end date named ranges, I included the = sign to ensure the variable is read as text.
Now that the source is changed, all you need to do is update the variables and click on the Refresh All button on the data tab, and the table will update based on what you have entered.

If you want to download my template, you can do so here.
If you liked this post on how to get stock quotes from Yahoo Finance using Power Query, please give this site a like on Facebook and also be sure to check out some of the many templates that we have available for download. You can also follow us on Twitter and YouTube.