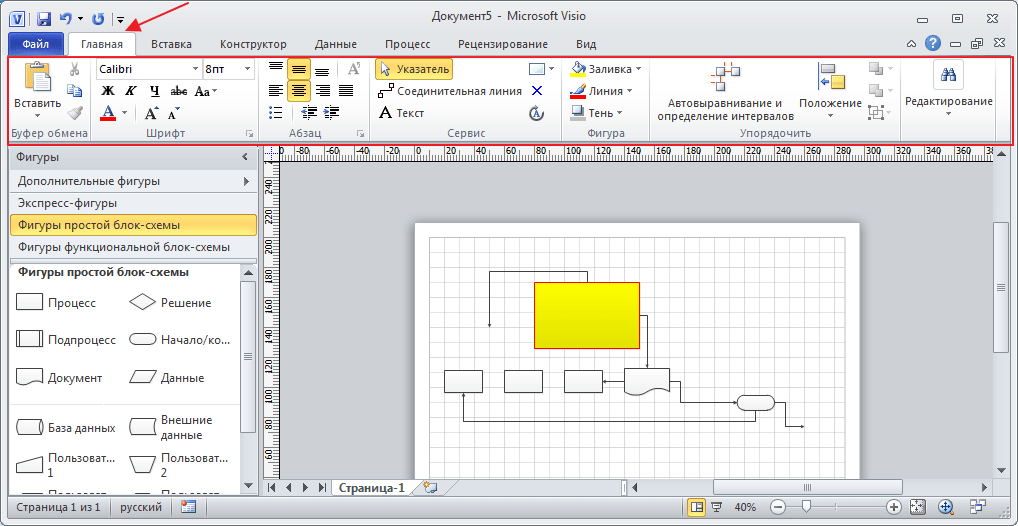
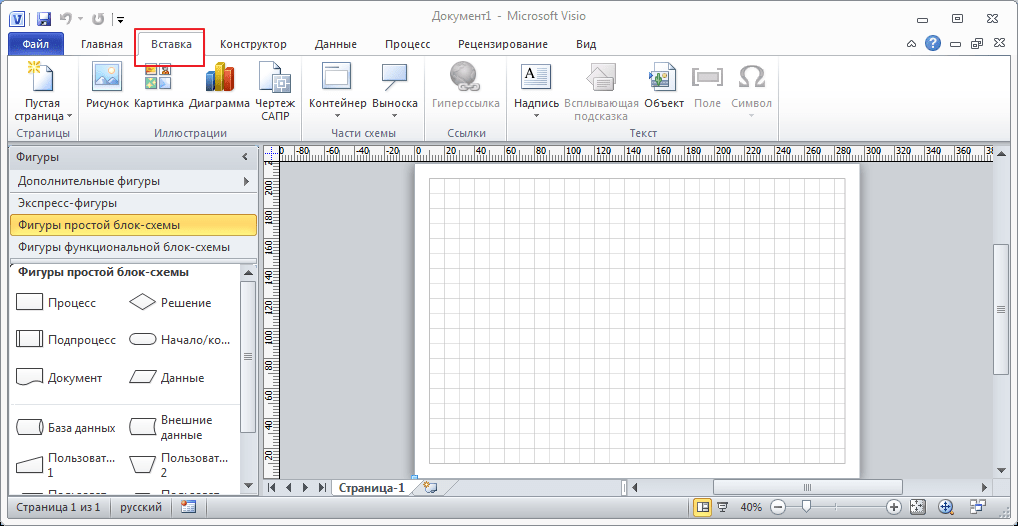
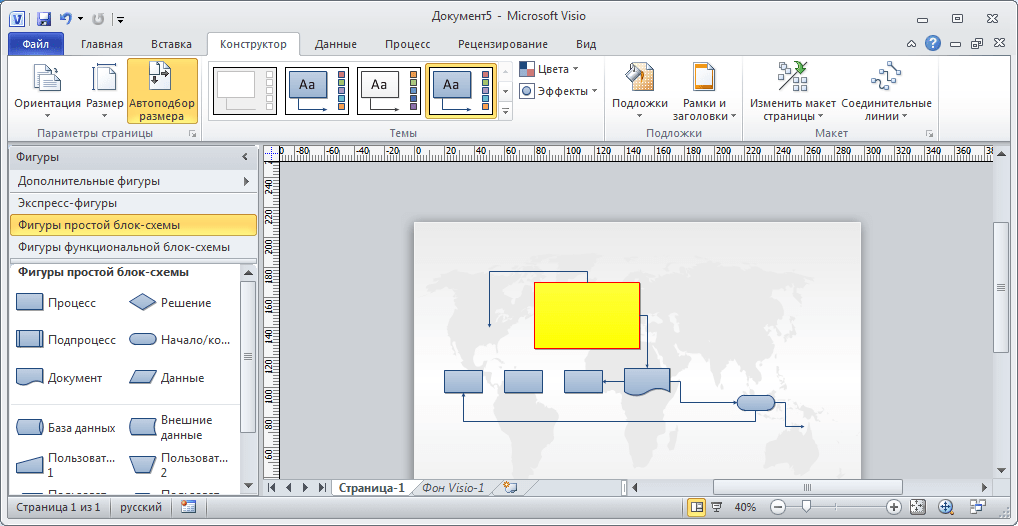
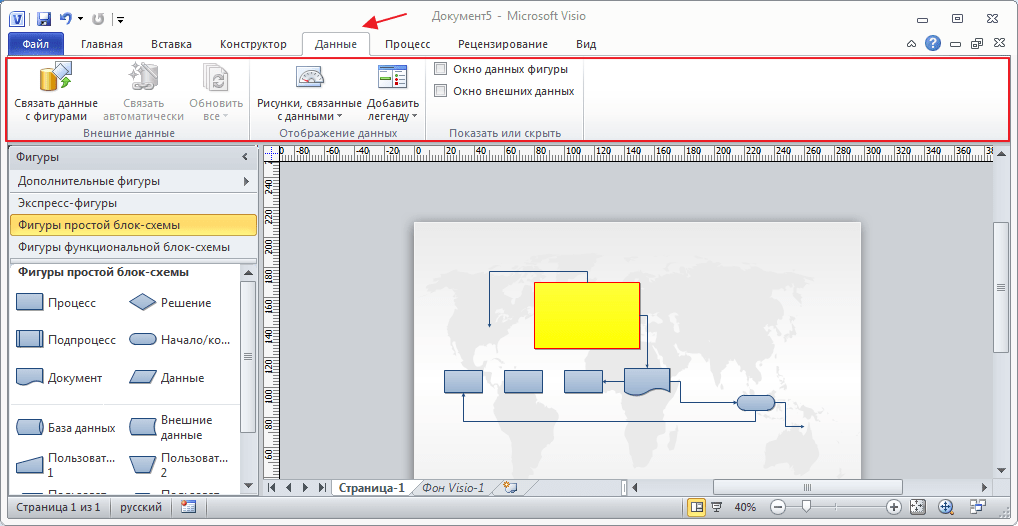
Бесплатные пробные версии доступны только для планов 1 и 2 Visio. Срок их действия составляет 30 дней, и они предлагаются только для рабочих и учебных учетных записей, которые до этого не пользовались пробными версиями. Чтобы начать 30-дневный пробный период, воспользуйтесь соответствующими ссылками для Visio, план 1 и Visio, план 2. В состав Visio, план 1 входит версия Visio для Интернета. В состав Visio, план 2 входят как версия Visio для Интернета, так и классическая версия этой программы. Для Visio стандартный и Visio профессиональный пробные версии недоступны.
Полный перечень коммерческих планов Microsoft 365, в которые входит веб-приложение Visio: Microsoft 365 бизнес базовый, Microsoft 365 бизнес стандарт, Microsoft 365 бизнес премиум, Приложения Microsoft 365 для бизнеса, Office 365 E1, Office 365 E3, Office 365 E5, Office 365 F3, Microsoft 365 F3, Microsoft 365 E3, Microsoft 365 E5, Приложения Microsoft 365 для предприятий, Office 365 A1, Office 365 A3, Office 365 A5, Microsoft 365 A1, Microsoft 365 A3, Microsoft 365 A5.
Обратите внимание: планы для малого и среднего бизнеса не дают доступ к веб-приложению Visio, поскольку не считаются коммерческими. Примеры таких планов: Бизнес базовый и Бизнес стандарт с ИД на основе учетной записи Майкрософт (hotmail.com, outlook.com, live.com, msn.com).
Использовать 32-разрядную и 64-разрядную версии решений Microsoft одновременно нельзя. Чтобы устранить эту проблему, вам потребуется удалить текущую 64-разрядную версию Office и установить вместо нее 32-разрядную. Дальнейшие инструкции см. на этой справочной странице.
Возможность одновременного использования разных версий Office и Visio зависит от того, какая технология применялась для установки этих продуктов. Действует следующее правило совместимости:
- В системе не может быть установлено два продукта одной версии, для установки которых применяются разные технологии.
- В системе не может быть установлено два продукта разных версий, если для установки обоих использовалась технология «нажми и работай» и в этих продуктах есть одинаковые приложения Office.
Дополнительные сведения о совместимости см. на этой справочной странице; подробнее об установке в рамках корпоративного лицензирования можно узнать здесь.
Для установки автономной версии (Visio стандартный или Visio профессиональный) используйте тот же код продукта, который вы указали в текущей версии приложения для скачивания Visio на компьютер. Войдите в свою учетную запись Майкрософт и введите ключ продукта на странице office.com/setup. При использовании ключа ваша учетная запись связывается с приложением Visio. После выполнения описанных выше действий скачайте Visio с помощью этих инструкций. Дополнительные сведения об установке Visio см. на этой справочной странице.
Инструкции по установке Visio, план 1 и Visio, план 2 см. на этой справочной странице.
В состав как Visio, план 1, так и Visio, план 2 входит хранилище OneDrive объемом 2 ГБ для рабочих и учебных учетных записей. Если у вас сейчас нет подписки OneDrive для работы или учебы, вы получите 2 ГБ места в хранилище в рамках своего плана. Если у вас есть действующая подписка OneDrive для работы или учебы, то 2 ГБ места в рамках плана «Visio для Интернета» не будут добавлены к вашему текущему хранилищу и не заменят собой вашу действующую подписку OneDrive.
Все поддерживаемые в данный момент версии Visio работают в Windows 11. Сюда относятся как планы Visio, так и автономные версии Visio 2013, 2016 и 2019.
При переходе на новую версию Visio ваши старые файлы сохранятся и будут нормально работать в новом приложении. Однако Visio автоматически блокирует возможность открытия любых файлов Visio версии до 2013. Чтобы решить эту проблему, воспользуйтесь этими инструкциями.
Да, текущая версия Visio совместима со старыми версиями. Да, файлы, созданные в текущей версии, можно открывать в предыдущей, и наоборот. Обратите внимание, что текущая версия по умолчанию сохраняет документы в VSDX-файлах. В то же время как версия Visio 2003 сохраняет файлы в формате VSD, поэтому для их открытия в файлах предыдущих версий Visio вам потребуется сохранить их в этом формате.
Текущие версии Visio поддерживают функции управления правами на доступ к данным (IRM). В автономной версии Visio выберите Файл > Сведения > Защитить документ > Ограничить доступ.
Настроить IRM из Visio для Интернета нельзя, однако эта версия программы учитывает настройки, заданные для файла в классическом приложении Visio, после его сохранения в Интернете. Дополнительные сведения об IRM в Visio см. на этой справочной странице.
Функция связывания данных доступна только в классическом приложении Visio, но в Visio для Интернета можно просматривать схемы со связанными данными.
В настоящее время Visio поддерживает различные источники данных. Вот некоторые из них:
- Книги Microsoft Excel
- Базы данных Microsoft Access
- Списки Microsoft SharePoint Foundation
- Базы данных Microsoft SQL Server
- Каталоги Microsoft Exchange Server
- Сведения Azure Active Directory
- Другие источники данных OLEDB и ODBC
Что такое Microsoft Visio и как его использовать для создания диаграмм
Теперь, когда в Интернете есть множество инструментов для построения диаграмм, визуализация рабочего процесса, процессов и процедур стала простой и легкой. Microsoft Visio создан как раз для этих целей. Маркетологи и предприятия используют эту программу в различных областях по всему миру. Он завоевал уважение как одна из лучших программ визуализации благодаря впечатляющему набору инструментов.
Кроме того, эта программа также является частью семейства Microsoft Office. Следовательно, интерфейс выглядит так же, как Microsoft Word. Это означает, что если вы давно пользуетесь Word, вам будет легко ориентироваться. Майкрософт Визио. Если вы заинтересованы в этом инструменте и хотите узнать о нем больше, продолжайте читать ниже.
- Часть 1. Альтернатива Microsoft Visio: MindOnMap
- Часть 2. Обзоры Microsoft Visio
- Часть 3. Учебное пособие по Microsoft Visio
- Часть 4. Часто задаваемые вопросы о Microsoft Visio
Часть 1. Альтернатива Microsoft Visio: MindOnMap
Хотя Microsoft Visio — известная программа, это не значит, что она подходит всем. Существует множество альтернатив Microsoft Visio, которые также предоставляют высококачественные диаграммы и помогают эффективно визуализировать процессы и данные. MindOnMap — это хорошая бесплатная замена Microsoft Visio, которая чрезвычайно удобна для начинающих и предлагает отличные инструменты для создания профессиональных диаграмм и моделей.
Пользователи могут быстро рисовать интеллект-карты, организационные диаграммы, схемы структур, древовидные диаграммы, графики, диаграммы «рыбий скелет» и многое другое с улучшенным форматом и темами. Кроме того, вы можете поделиться своей работой с кем угодно, используя ссылку на карте. Это онлайн-альтернатива Microsoft Visio, поэтому вам не нужно ее загружать. Более того, карты мозга, которые вы делаете, хранятся в облаке. При этом он не будет занимать место на диске вашего компьютера.
Часть 2. Обзоры Microsoft Visio
Этот выдающийся инструмент заслуживает подробного обзора из-за его превосходных функций построения диаграмм. В связи с этим давайте больше познакомимся с фантастическим миром Microsoft Visio. Вы узнаете о его введении, функциях, плюсах и минусах, платформах, цене и т. д. Следовательно, обзор — это важный способ улучшить эти аспекты. О них вы узнаете после прыжка.
Краткое введение в Microsoft Visio
Microsoft Visio предлагает самые универсальные функции для создания диаграмм, что делает его ведущим в отрасли инструментом для построения блок-схем и диаграмм. С помощью этого инструмента вы можете выбрать из широкого спектра мощных шаблонов или начать с нуля. Эти шаблоны наверняка пригодятся новичкам для создания профессиональных диаграмм. Более того, он позволяет выполнять расширенные действия.
Инструменты для совместной работы позволяют вам и вашей команде работать над одним документом, как если бы вы работали в одной комнате. Он не знает никаких устройств и сторонних приложений для обмена сообщениями, потому что вы можете общаться здесь одновременно. Кроме того, пользовательский интерфейс полностью интуитивно понятен, что делает его подходящим для начинающих и любителей. Что не менее важно, в нем есть обширная коллекция форм и фигур, подходящих для каждой диаграммы и блок-схемы, которые вы пытаетесь изобразить.
Для чего используется Microsoft Visio
Мы продвигаемся вперед с тем, для чего используется Microsoft Visio. Этот инструмент построения диаграмм лучше всего подходит для визуализации процессов, данных и рабочего процесса. Этот инструмент удобен, когда вы пытаетесь создать иллюстрацию для улучшения рабочего процесса в вашей организации. Кроме того, вы стремитесь понять данные, отношения и поток системы. Следовательно, вы создаете иллюстрацию таким образом, чтобы ее могли понять многие. С помощью этого программного обеспечения вы сможете превратить сложную информацию в простой способ ее понять.
Короче говоря, Microsoft Visio используется для лучшего понимания систем. В первую очередь это касается образования и бизнеса. Таким образом, Microsoft Visio предназначен и для студентов. Независимо от того, пытаетесь ли вы задокументировать или понять процесс, инструмент может справиться с этим за вас.
Плюсы и минусы
В общем, Microsoft Visio предназначен для всех, кто хочет создать исчерпывающую иллюстрацию системы или процесса. Тем не менее, чтобы предотвратить предвзятость и сбалансировать обзор, мы рассмотрим плюсы и минусы этого инструмента построения диаграмм.
ПЛЮСЫ
- Сотрудничайте с другими пользователями независимо от их устройств.
- Шаблоны для создания профессиональных диаграмм и блок-схем.
- Связывайте данные с книгами Excel, базами данных SQL Server, базами данных Access и т. д.
- Поддерживается интеграция приложений, которая связывает проекты с продуктами Microsoft.
- Встроенные трафареты, формы и объекты для работы.
- Он предлагает веб-версию для создания онлайн-диаграмм.
- Импорт изображений для создания брошюр, 3D-схем и т. д.
МИНУСЫ
- Совместное использование карт в разных организациях может быть затруднительным.
- Ему не хватает помощи по телефону или живого чата для технической поддержки.
- Программа дорогая для инструмента построения диаграмм.
Планы и цены
Вы можете спросить, сколько стоит Microsoft Visio. Если вы новый пользователь, у вас есть несколько вариантов. У вас может быть два месячных плана и две постоянные лицензии.
Ежемесячные подписки состоят из Visio Plan 1 и Vision Plan 2. Обе они основаны на модели для каждого пользователя. Они не реализуют контракты с блокировкой, что означает, что вы не обязаны продлевать свой план после его окончания. Visio, план 1, стоит $5.oo на пользователя каждый месяц, если вы оплачиваете план ежегодно. Дополнительно $1.00 с ежемесячными платежами. Включение включает 2 ГБ хранилища OneDrive с возможностью создания простых диаграмм.
План Vision 2 обойдется вам в 15,00 в месяц при ежегодной оплате. При ежемесячных платежах вам нужно будет добавить $3.00, всего $18.00. Он позволяет вам получить доступ к настольному приложению Visio и широкому набору инструментов, подходящих для малого и крупного бизнеса для создания расширенных диаграмм.
С другой стороны, Microsoft Visio поставляется с двумя постоянными лицензиями. Первый — Стандарт, а второй — Профессионал. Стоимость подписки на Visio Standard Visio 2019 составляет $280 с доступом к основным функциям программы. С его помощью вы можете использовать свой рабочий стол и сенсорные устройства для создания диаграмм, не лишаясь необходимых инструментов.
Более дорогая версия Microsoft Visio, Visio Professional 2019, будет стоить вам $530. Эта лицензия предлагает расширенные функции, такие как инструменты для совместной работы. Кроме того, это очень подходит для крупных предприятий. Просто эту лицензию может использовать только один компьютер.
Часть 3. Учебное пособие по Microsoft Visio
Если вы приобрели Microsoft Visio, было бы лучше иметь пошаговое руководство по его использованию. Независимо от размера вашего бизнеса, этот инструмент будет полезен. С другой стороны, вот учебное руководство по Microsoft Visio.
1
Приобретите программу на свой компьютер
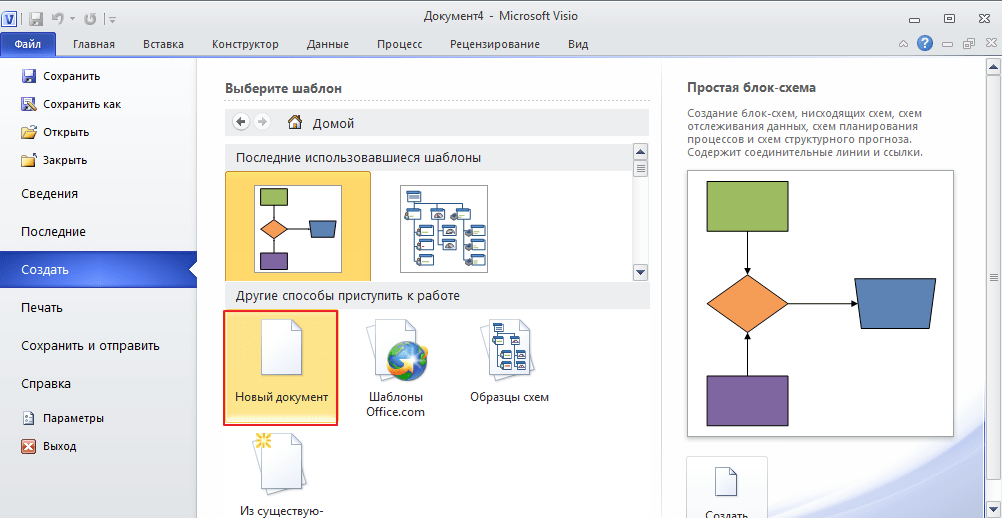
Сначала перейдите на страницу загрузки программы и получите ее установщик. После этого установите и запустите его на своем компьютере. Основной интерфейс должен отображать панель инструментов программы.
2
Выберите шаблон
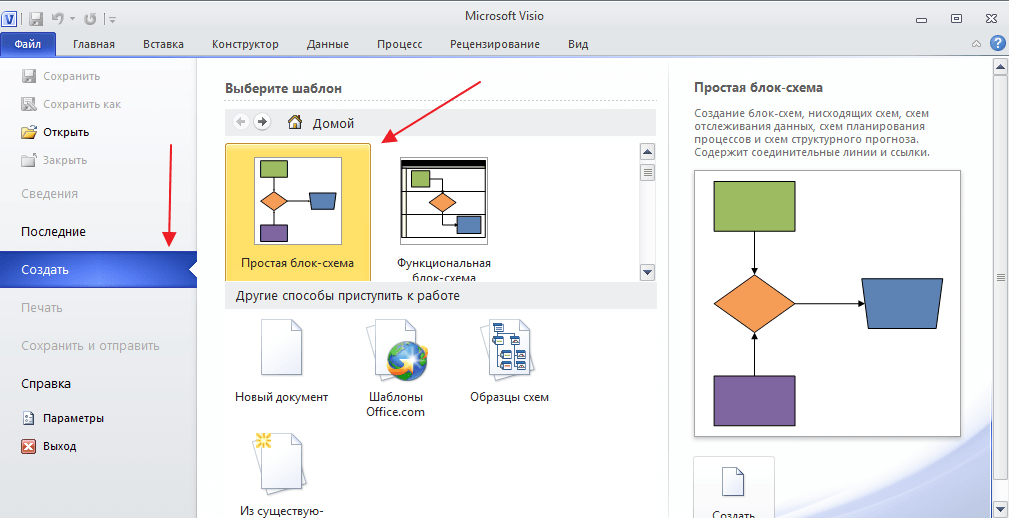
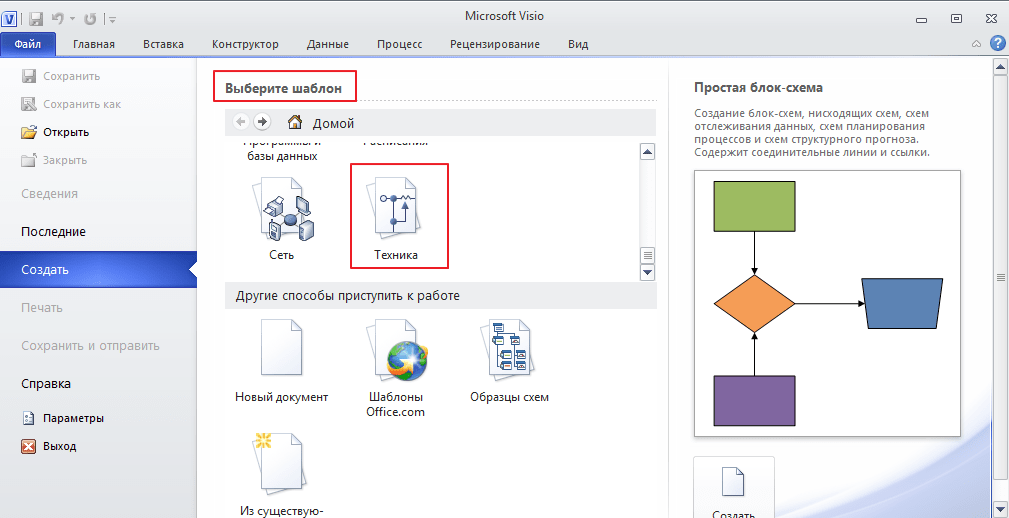
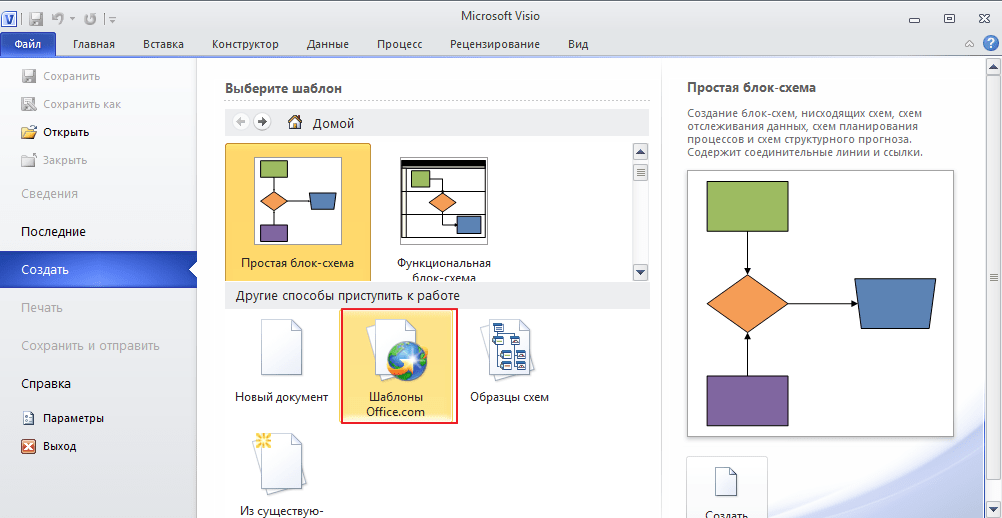
Теперь иди к Файл > Создать. Ты можешь выбрать Базовая диаграмма начать с нуля или просмотреть шаблоны из Категории раздел. Введите термины, которые вы хотите найти для предпочтительного шаблона.
3
Добавляйте и упорядочивайте фигуры
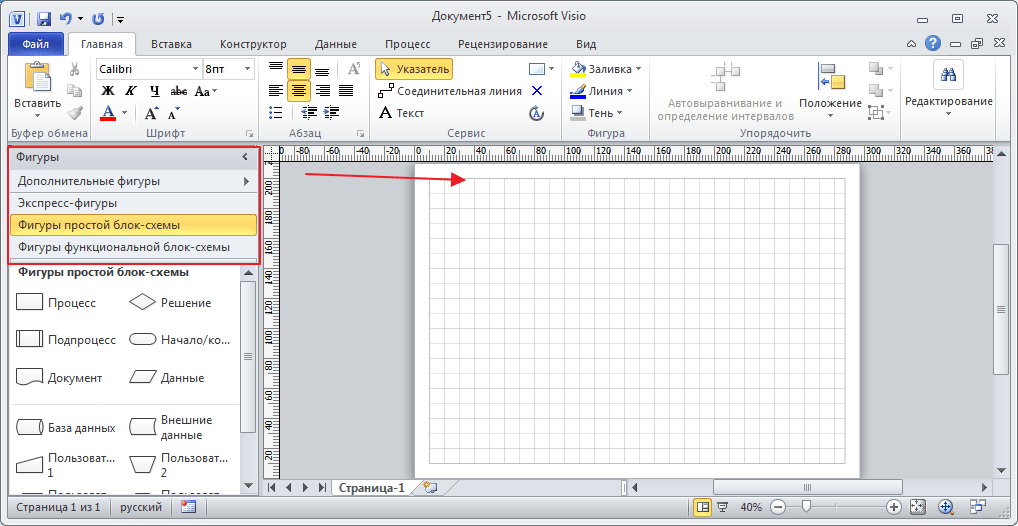
Выберите и перетащите фигуры с трафарета на холст в окне «Фигуры», чтобы создать диаграмму. С Автоподключение стрелки, вы можете легко соединить фигуры. Возможно, вам придется сначала активировать эту функцию из Дом вкладка
Наведите указатель мыши на одну фигуру и выберите фигуру в появившемся меню. Затем он автоматически подключится к выбранной вами стрелке.
4
Обозначьте фигуры и соединители
Чтобы добавить детали к своим фигурам, пометьте фигуры, добавив текст. Дважды щелкните нужные фигуры и введите текст. нажмите Esc кнопку, когда вы закончите.
5
Персонализируйте свою схему Visio
На этот раз настройте схему Visio. Под Дизайн выберите тему для оформления диаграммы.
6
Сохраните диаграмму Microsoft Visio.
Наконец, перейдите к Файл меню и выберите Экспорт вариант. Отсюда вы сможете выбрать подходящий формат.
Дальнейшее чтение
- Учебное пособие по диаграммам последовательности Visio для начинающих и опытных пользователей
- Создание блок-схемы Visio: стандартные и альтернативные способы создания блок-схемы
Часть 4. Часто задаваемые вопросы о Microsoft Visio
Есть ли у Visio версия для Mac?
Microsoft Visio доступен для Windows, но не совместим с macOS. Вы можете использовать веб-версию программы на компьютерах с Windows или Mac.
Является ли Microsoft Visio бесплатным?
К сожалению, у Microsoft Visio нет бесплатной версии. Он предлагает только 30-дневную бесплатную пробную версию. По истечении пробного периода вам нужно решить, продолжать ли покупать план или завершить сеанс его использования.
Кто использует приложение Visio?
Microsoft Visio известен среди бизнес-менеджеров и ИТ-специалистов, работающих с блок-схемами, планами этажей и сайтами.
Вывод
В содержании в основном обсуждается обширный обзор Майкрософт Визио. Нельзя отрицать, что Visio — мощный и надежный инструмент для создания диаграмм и блок-схем. Между тем, вы можете искать альтернативу Microsoft Visio. MindOnMap это рекомендуемая программа, которая предлагает достойные функции бесплатно.
Microsoft Visio — Overview
Computer diagramming is the process of creating scalable diagrams on a PC that can be used in various applications such as layout design, organization charts, timelines, floor plans and even prototype software user interfaces. Diagrams are made of shapes, objects and stencils, which when combined together correctly, can help project a lot of useful information.
Modern computer diagramming relies on using vector-based shapes instead of raster shapes. Raster shapes or bitmaps do not scale well, and their resolution and quality deteriorates with every edit. However, vector shapes are mathematical representations of a shape and hence scale well. Vector shapes are not affected by edits and are the most appropriate to use when precise measurements are required.
Computer diagramming can be shape-based artwork or more complex drafting often seen in CAD (Computer Aided Design) programs. CAD contains a lot more information such as the materials, processes, and specific conventions of the diagram. Shape-based artwork is more commonly used to depict lesser technical information.
Popular Diagramming Software
Microsoft Visio is the most popular diagramming software, however, there are alternatives that are often as good and in some cases, free. For simple diagramming requirements, the following tools should work just fine.
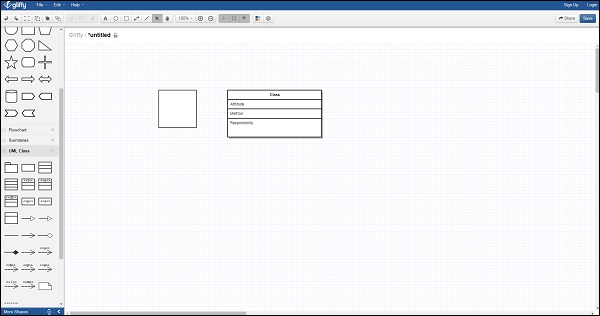
Gliffy
Gliffy is a popular online diagramming tool. Gliffy supports floor plans, venn diagrams, flow charts, network diagrams, etc. and is compatible with most modern web browsers. Gliffy can import Microsoft Visio documents and integrate with Google Drive to enable saving documents in the cloud and easy collaboration.
There are many themes and templates to choose from, making Gliffy a solid online alternative to Visio. Gliffy can be used freely for up to 5 diagrams or 2 MB file size. There are monthly plans that can be purchased depending on the number of diagrams needed.
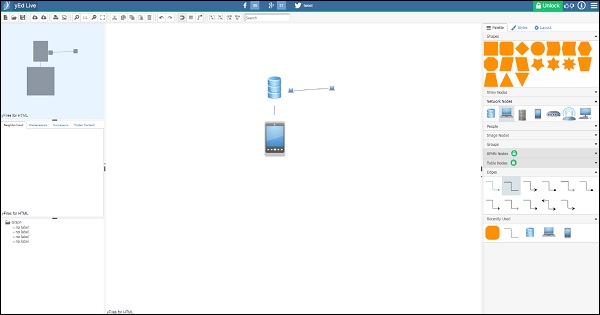
yEd
yEd is an open-source free diagramming tool that runs on virtually any Java enabled platform. It can import Visio documents and work with very complex diagrams such as biological pathways.
yEd has automatic layouts and support for most graphical standards making it a viable alternative to Visio for anyone looking to create diagrams for free. There is also an online version called yEd Live that works in any modern HTML5 compatible web browser.
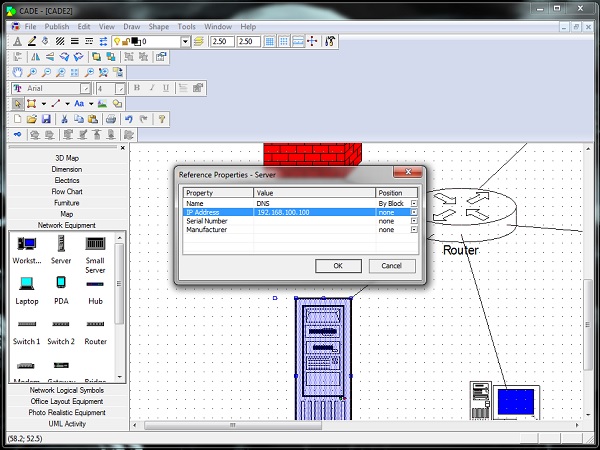
CADE
CADE works great for networking diagrams and as a 2D vector graphics editor for Windows. CADE is free to download and supports most of Visio’s basic functionalities. It is optimized for large CAD drawings and allows easy collaboration and sharing. CADE can be exported to popular formats such as EMF, JPG, PDF and XAML. There are many sample diagrams and templates to help you get started as well.
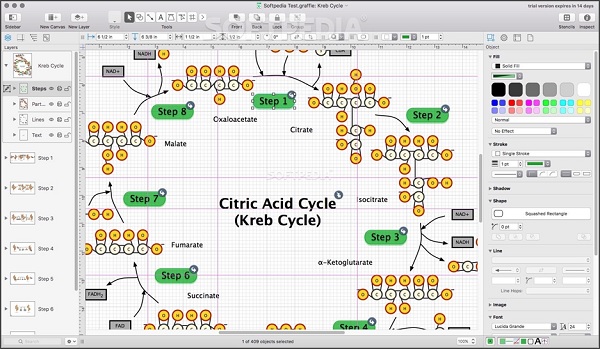
OmniGraffle
Visio is not available for Mac OS leaving OmniGraffle as the only premium alternative for Mac users. OmniGraffle is a comprehensive diagramming software that can create visually appealing designs at a significantly cheaper price than Visio. It supports importing Visio documents and exporting to a ton of popular formats including SVG. There are extensive options for stencils, canvases, templates, and objects allowing to easily create wireframe diagrams, trees, floor plans, and a whole lot more.
The latest version supports scripting in AppleScript or JavaScript to automate almost every aspect of the software. It also supports Touch Bar on the latest MacBooks. The Standard version of OmniGraffle retails for $99.99, while the Pro version retails for $199.99.
Introduction to Microsoft Visio
Microsoft Visio is one of the most popular diagramming software that empowers diagramming, data visualization, and process modelling in a familiar interface. Visio comes with an array of templates and built-in shapes that allow creating virtually any diagram of any complexity. Visio also allows users to define their own shapes and import them into the drawing.
Visio has been more of an enterprise-class software as home users rarely would need to use the advanced diagramming functions in Visio. However, many home users are purchasing the Standard edition of Visio to better visualize simple diagrams such as family trees or floor layout plans.
Visio owes its success in the enterprise due to its tight integration with other Microsoft Office products such as Word, Excel, and Access. Data can be directly imported from these softwares and converted into meaningful diagrams, which change in real-time in accordance with the data. For example, an Excel spreadsheet might have information about current flows through an electrical line. Visio can be used to diagrammatically represent this and whenever the Excel data gets updated, the same will be reflected in the Visio diagram as well.
Newer versions of Visio from Visio 2013 onwards support .vsdx format that allows enhanced compression and many other features compared to the older .vsd format supported by Visio 2010 and earlier versions. Visio can be purchased standalone in two versions — a Standard version, which retails for $299, and a Professional version, which retails for $589.99. The latest version of Visio can also be purchased as part of the Office 365 subscription with access to the online Visio viewer as well. Getting Visio as part of Office 365 is the best choice in order to keep up-to-date with the latest features and enhancements.
MS Visio — New Features
Visio being part of the Office 365 suite, is updated continuously throughout the year. If you have a qualifying Office 365 subscription, you are entitled to regular updates automatically. Users who purchase the standalone versions of Visio do not however, receive feature updates and must upgrade separately to a higher version when released.
The most recent update of Visio 2016 Professional (Office 365 version) has the following new features −
Data Visualizer
Data Visualizer helps in automatically creating process diagrams from Excel data. Premade or custom Excel templates containing information that fit into diagrams can be imported directly into Visio using the Data Visualizer and transformed into a Visio diagram. Any changes made to the original Excel file reflects in the Visio diagram as well.
Visualize Database Structures From Source Data
The latest version of Visio enables reverse engineering of databases to create a visual representation of the database. Visio can connect to various databases such as MySQL, SQL Server, Oracle, etc. and can update the diagrams in sync with the changes in the database.
Templates for Industry Specific Diagrams
The latest update to Visio for Office 365 comes with many new standardized templates catering to industries such as business processes, software development, IT and education. These templates are supplied by both Microsoft and other third parties extending the capabilities of Visio 2016.
Visio Online and Visio on iPad
Visio diagrams stored on SharePoint or OneDrive for business can now be opened for review in any modern web browser with Visio Online available with Office 365 or in the free Visio Viewer app for the iPad.
Microsoft Visio — User Interface
In this chapter, we will learn about the user interface in Visio. It is important to properly understand the user interface to get the most out of this tool.
Start Screen
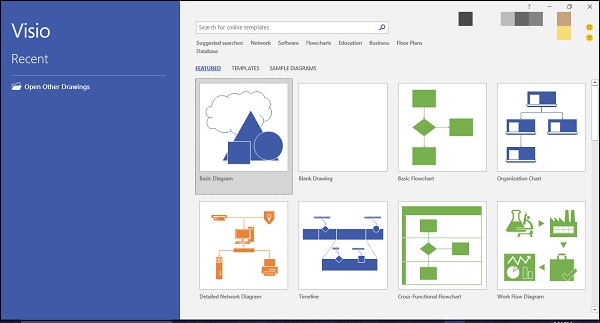
The user interface of Visio is similar to that of other programs in the Office suite. You will be greeted with a Start page that lists some of the recent documents you have opened along with featured templates for creating common diagram types.
You can also search for templates on the Microsoft website right from the Start screen.
The top right corner shows the Microsoft account you are connected to, if you are an Office 365 subscriber.
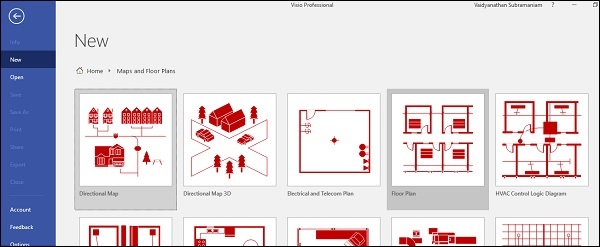
Apart from the featured templates, you can also click Templates to browse through the template categories.
Document Interface
Clicking any of the above templates opens the template document.
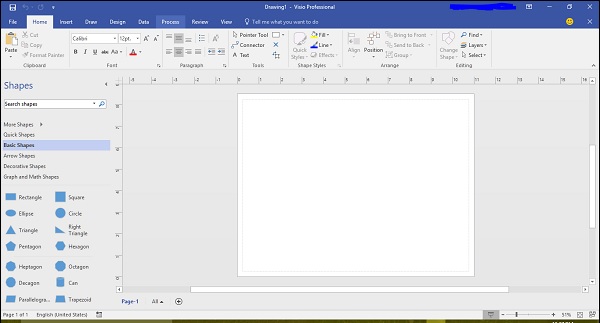
The document interface of Visio is similar to other Office programs such as Word or Excel. On the top, you have the Quick Access toolbar, which contains common commands, such as Save, Undo, and Redo. This can be customized as needed.
Below the Quick Access toolbar is the familiar Office Ribbon. The Home tab lists common commands for working with the document. We will learn more about other tabs as we go along.
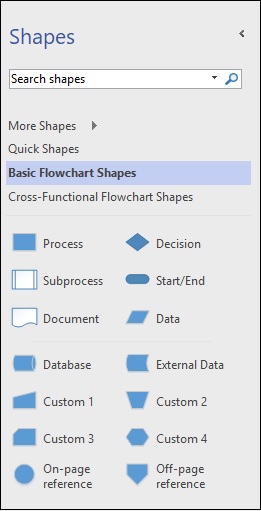
On the left-hand pane, there is Shapes, which lists the common shapes that go well with the template. To insert a shape, just click and drag the shape onto the canvas. There are many shapes available in Visio and we will get more familiar with them as we move ahead.
Of course, you can also search for more shapes, if needed online, using the built-in search tool.
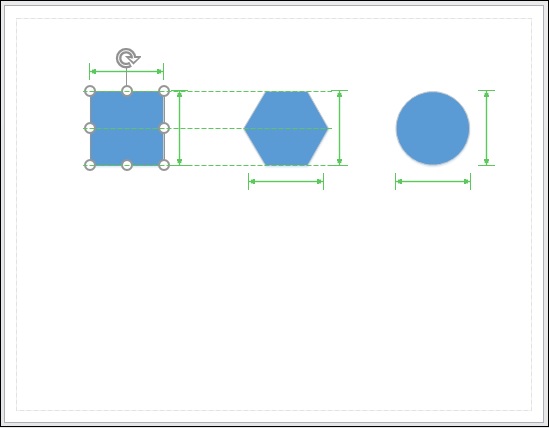
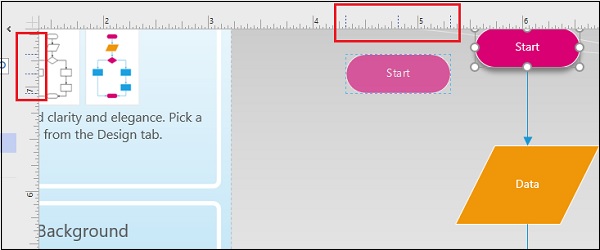
When you place shapes onto the canvas, you will see guides that help you align the shapes with respect to the objects already on the canvas. You also have a ruler on the top and left of the canvas. This gives a sense of perspective and lets you create perfectly aligned diagrams.
Shapes in Visio are basically vector graphics and as such you can enlarge or shrink the size as needed without loss of quality. You also get an idea of the relative dimensions of all the other shapes (indicated by green arrows) when you try to change the dimensions of any shape.
Microsoft Visio — Opening Files
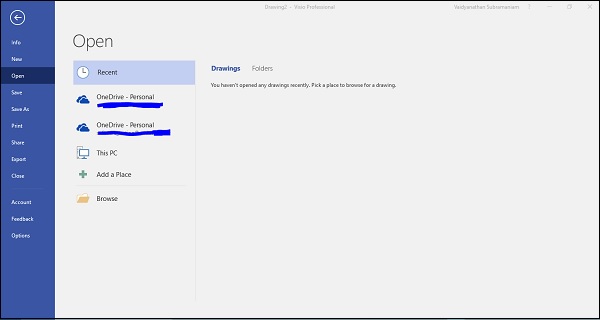
To open a file in Visio, go to the File menu, which opens the backstage view and click Open. The Recent section lets you directly access the recent drawings that you have opened or saved.
Based on your setup, the Open menu lists some of the file locations that you can browse for Visio drawings. Click Add a Place to add Office 365 SharePoint or OneDrive location for quick access. Alternatively, click Browse and select the Visio drawing from a local or network folder. Visio files have the extension .vsdx.
Once you open a Visio drawing, you will see that the user interface changes according to the drawing.
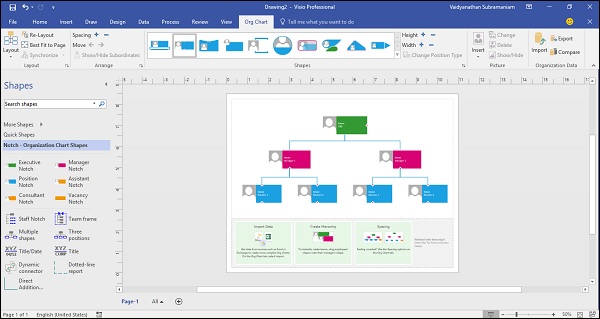
In the following example, we have opened an org chart and you can observe that the shape stencils corresponding to the org chart are now available in the Shapes pane. In case of this file, you will also notice an Org Chart tab in the Ribbon that gives you additional options for working with the shapes in the chart, and also allows linking the shapes to data from external sources such as Excel.
You can adjust the spacing between individual shapes and also change the height and width of all shapes in one click.
You can customize the layout of this Org chart and add additional shapes, if needed.
The Compare command in the Organization Data section of the Org Chart tab lets you compare the contents of this org chart with another org chart or diagram open in Visio. The output is generated as an HTML file, which lists out the similarities and differences between the two diagrams.
Microsoft Visio — Customizing the UI
Visio’s UI is entirely customizable. You can show or hide elements in the UI to whatever suits you best.
The Quick Access Toolbar
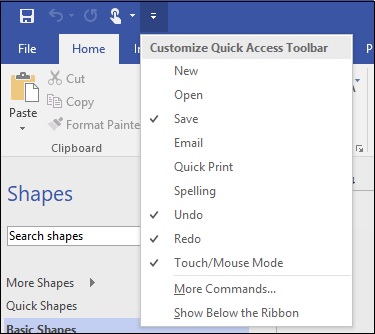
The Quick Access Toolbar allows you to easily add often-used commands so that they are always available within reach. Apart from the standard Undo, Redo, and Save commands, you can add additional buttons, such as a toggle between Touch and Mouse mode depending on your display by clicking the arrow icon in the Quick Access Toolbar. You can also add more commands by clicking the option More Commands…
The Ribbon
The Ribbon can be collapsed to allow more real estate for the canvas. You can reduce or expand the Shapes pane by clicking and dragging the edge of the pane inwards or outwards respectively.
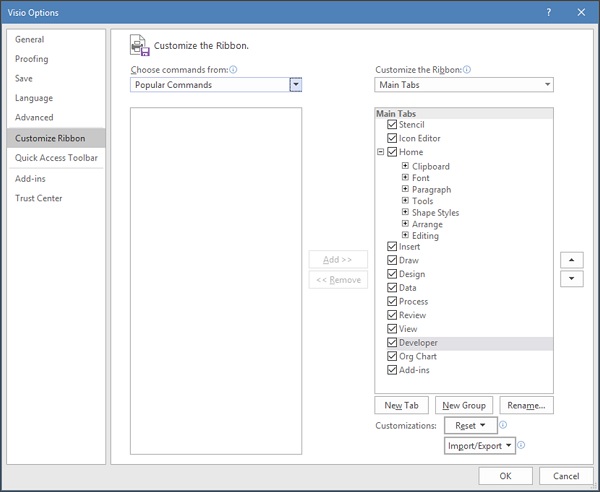
The Ribbon can be customized just like the Quick Access Toolbar but to do so, you need to navigate to the File menu and click Options. Then click Customize Ribbon. You can select the tabs that you wish to display on the workspace. You can also create a new tab or group by clicking New Tab or New Group to accommodate the commands that you use frequently.
You can export these customizations and import them to a new instance of Visio by clicking the Import/Export dropdown menu and selecting Export Customizations.
Microsoft Visio — Changing View Modes
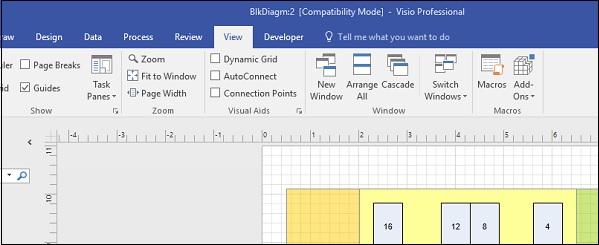
Visio has a few options for changing how you view the drawing. The View tab lists all the possible view options that you can use on the canvas. We will look at some of the commands that are useful in changing view modes.
Slide Snippets
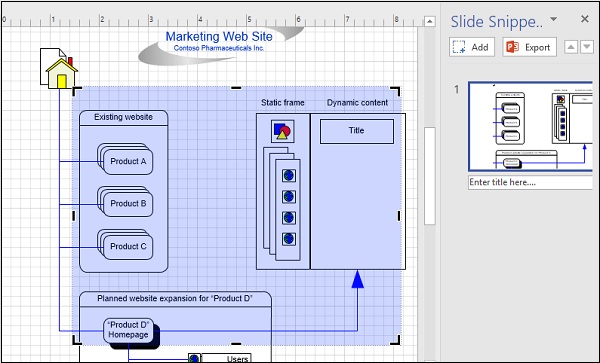
The Slide Snippets Pane is available only in the latest Office 365 version of Visio. Basically, slide snippets allow you to directly export a Visio diagram as a PowerPoint slide.
To take a slide snippet, click the Slide Snippets Pane in the View tab to open it. Then, select an area of the drawing that you want to export to a PowerPoint slide and click the Add button in the Slide Snippets Pane. Add a title in the Enter title here… field and click Export to export the captured drawing to a PowerPoint slide.
Presentation Mode
The Presentation Mode shows a full screen view of the drawing without any distractions. This mode can also be toggled by pressing F5 on the keyboard.
Ruler, Grid and Guides
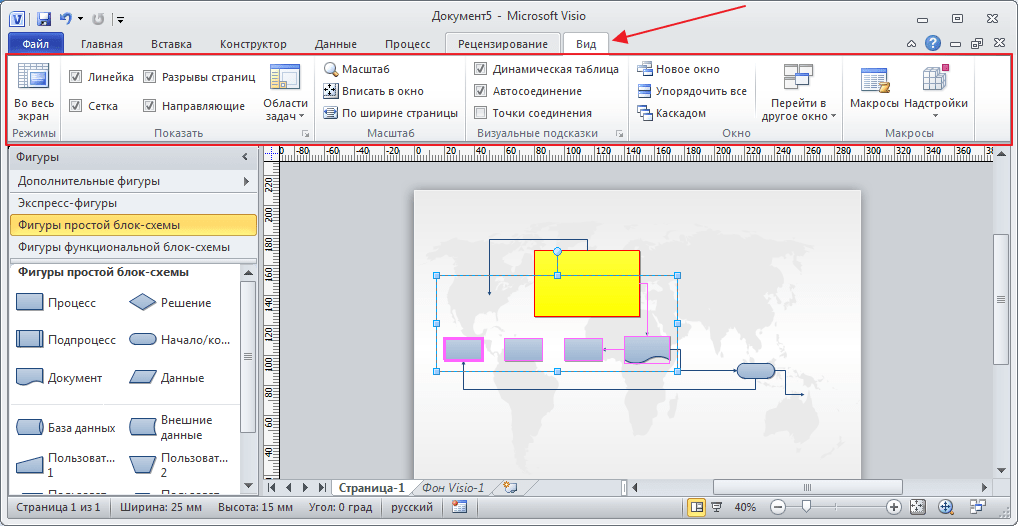
You can toggle between showing the vertical and horizontal rulers, the grid, and the guides by toggling the corresponding checkboxes in the Show area of the View tab. The scaling of the rulers and grid can also be adjusted. The grid allows to easily snap objects so that they are placed correctly on the canvas.
Zoom
The Zoom section comprises of commands that allow you to change the zoom levels of the canvas. You can also fit the contents to window or adjust the contents to fill the page width.
Window
The Window section lists commands that allow to arrange multiple windows on your screen. You can directly open a new window or arrange windows side by side. You can also cascade windows for easy switching between them.
Creating and Arranging Smartshapes
SmartShapes provide contextual shapes which relate to the selected shape. SmartShapes are connected to the original shape and the connector also moves whenever the SmartShape is moved.
Creating a SmartShape
Start with a blank document (in this case a flowchart diagram). You will notice that the Shapes pane has different shapes that are applicable to flowcharts. Click and drag a shape onto the empty canvas. You can resize or rotate the shape as desired. You can even align the shape with the help of the alignment guides.
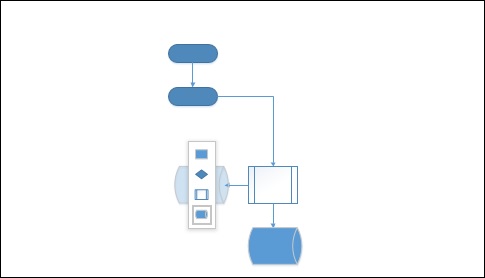
When you drag a shape onto the canvas, you will notice that there are four arrows along the shape. Hovering over any of these arrows will show possible shapes that can be created and linked to this shape.
Click the desired shape to create the shape. You will also notice that the shape is automatically connected to the initial shape. If you were to drag the shape manually, you will need to connect it manually as well. The connections between the shapes are dynamic and they will move in relation to the placement of the shape.
Arranging SmartShapes
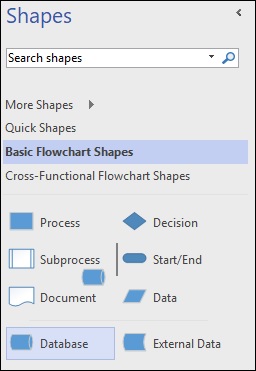
The SmartShape arrow lists the first four shapes for the diagram that are seen in the Shapes pane. You might want to customize which shapes appear in the four SmartShape options depending on your workflow. To set the shapes that you prefer as SmartShapes, first select the desired shape in the Shapes pane and drag it to one of the first four shapes within the pane.
In this example, let us assume that the Database shape needs to be in the first four. Click and drag the Database shape into one of the first four positions.
Now, when you create a SmartShape, you will find that the Database shape is made available.
Microsoft Visio — Connecting Smartshapes
SmartShapes allows to automatically connect shapes. If you want to connect shapes that are not directly related, you can manually connect them.
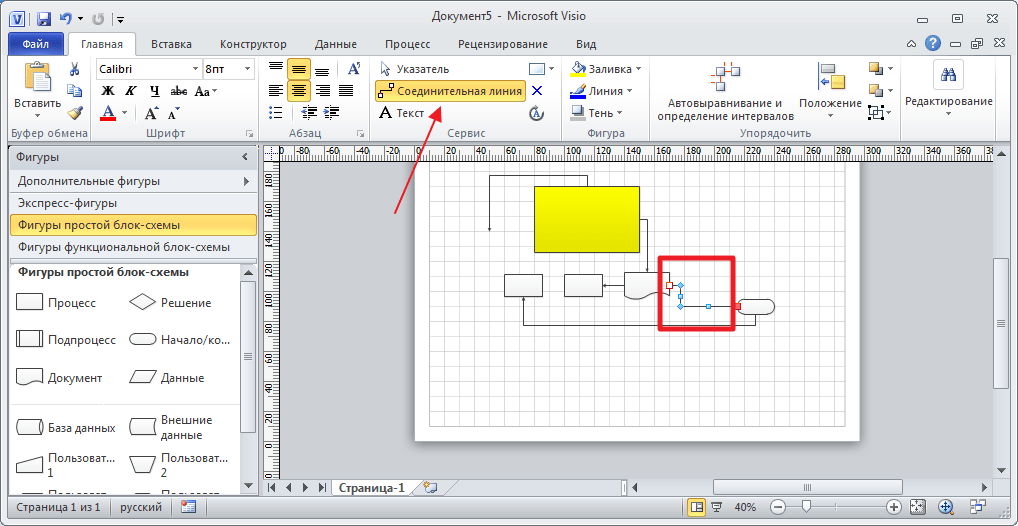
To manually connect shapes, click the Connector tool in the Tools section of the Home tab. The mouse pointer now changes into a connector.
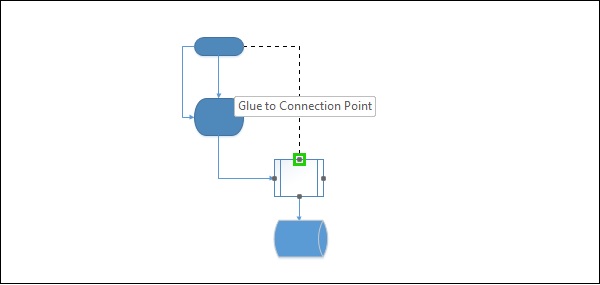
Draw a connecting line from the originating shape to the destination. You will notice a dotted line representing the connector. You can either glue this connector to the connection point or glue it to the destination shape. Gluing it to the shape will enable you to move the shape to a different location on the canvas along with the connector.
Click the Pointer Tool in the Tools section of the Home tab to return the mouse pointer back to normal.
Microsoft Visio — Connected Smartshapes
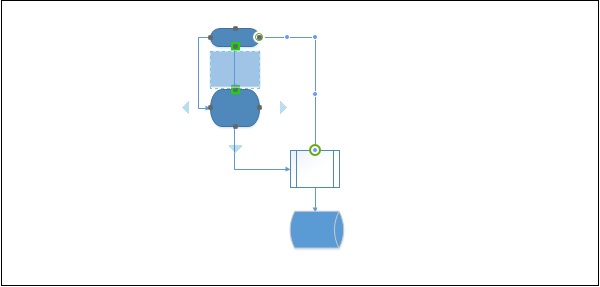
Newer versions of Visio have built-in intelligence to help you place shapes between other shapes. Visio automatically adds the required spacing and connectors to ensure that the new shape is inserted in the correct position.
To insert a shape between two shapes, drag the new shape in between the desired shapes, till you see green squares on the connectors and release the mouse. The new shape will be inserted with equal spacing and appropriate connections.
If you delete the inserted shape, the connector extends all the way till the next shape.
Microsoft Visio — Aligning Smartshapes
Often, inserting and deleting shapes can disturb the alignment of the diagram. It can also make the elements of the diagram space out unevenly. To get around this, Visio provides tools that automatically align and space the shapes in your diagram so that it looks perfect.
Align and Space Shapes
To automatically align and space shapes in a diagram, go to the Position dropdown menu in the Arrange section of the Home tab. Click either Auto Space or Auto Align & Space depending on the requirement. You can also hover the mouse on these commands to preview how the diagram would look after alignment.
After alignment, you can still move the shapes in your diagram, if you’d like a more customized appearance.
Microsoft Visio — Re-layout Page
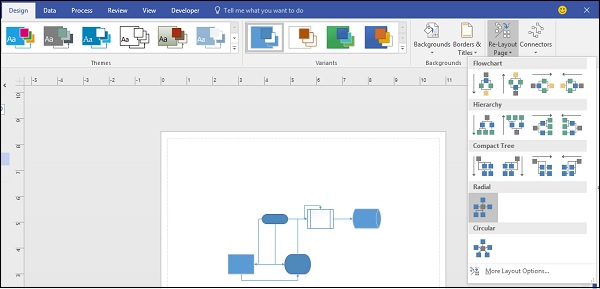
Visio provides options for automatically changing the layout of the diagram with the ReLayout Page command. The Re-Layout Page command provides commonly used layouts. You can also customize some of the aspects of the layout as needed.
Changing the Diagram Layout
Open the diagram and navigate to the Design tab on the Ribbon. Click the Re-Layout Page dropdown menu and select a layout as needed. You will see that the diagram now changes to the selected layout. You can also preview the look before clicking by hovering the mouse over the layout style.
Customizing the Layout
You can further customize the layout by clicking More Layout Options… in the Re-Layout Page dropdown menu. This opens a dialog box in which you can configure the layout properties.
You can change the spacing between the shapes by manually changing the values in the Spacing field.
You can also change the appearance of the connectors to curved by selecting Curved in the Appearance dropdown menu. Remember to select the Apply routing style to connectors checkbox to be able to change the appearance of the connectors.
Microsoft Visio — Inserting Text
Visio allows inserting text either within the shapes or in the document. You also get to do text formatting just like any other text editor.
Inserting Text in a Shape
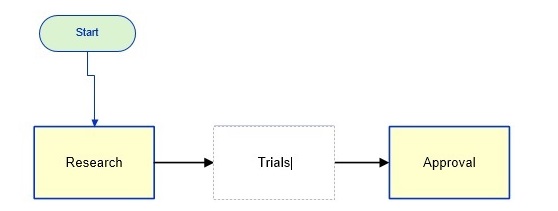
It is easy to insert text within a shape. Just double-click within a shape to type the text. The text automatically wraps according to the shape, however, you can also press hard returns if you’d like to have your own wrapping. Notice that Visio automatically zooms into the shape to enable typing and zooms out when you click outside the shape.
Inserting Text in a Document
To insert a text in a document such as a heading for the chart, click the Text Box dropdown menu in the Insert tab on the Ribbon and select either horizontal or vertical text box.
Then place the cursor on the document and draw a text box to start typing.
Microsoft Visio — Inserting Backgrounds
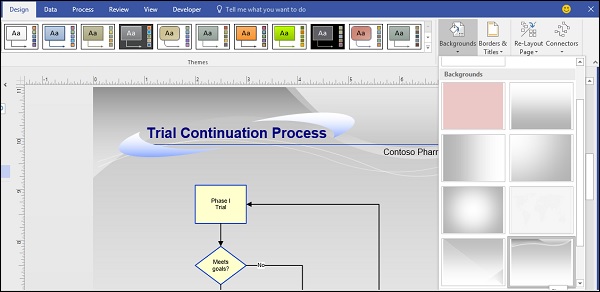
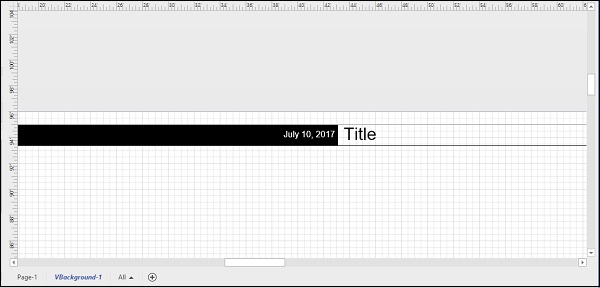
Backgrounds are inserted using pages called background pages. Background pages can contain graphics or text such as copyright info and other information. Background pages are always separate but appear overlaid on the main page.
Inserting a Background Page
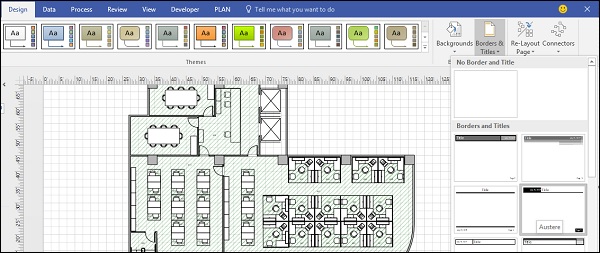
You can change the background of a document by choosing from preset backgrounds or using your own background template. To insert a background, click the Background dropdown menu from the Design tab on the Ribbon and choose a background preset.
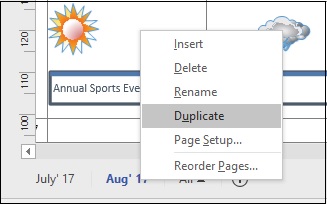
This creates a new page in addition to the diagram page. You can right-click the newly created background page to rename it. The new background will be automatically applied to all newly created pages in the document.
Microsoft Visio — Inserting Graphics
Apart from the shapes that are part of the diagram, you can add your own images to the document. Images can come from any online or offline source. If you add an image to the background page, the image will appear on all the pages in the document.
Adding Graphics to a Document
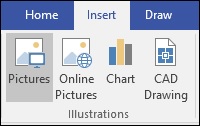
To insert your images or graphics, go to the Insert tab on the Ribbon and select from any of the commands in the Illustrations section. It can be a picture on your local drive, an online source, a chart or even a CAD drawing.
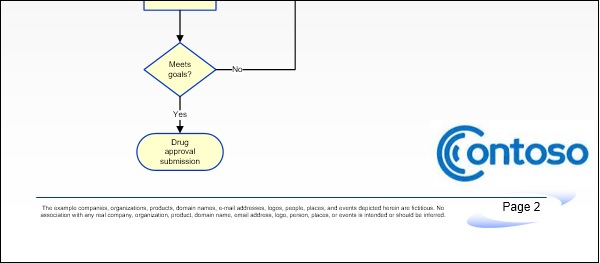
You can also replicate the picture on all the pages by inserting the picture in a background page. To do this, select the background page and insert the picture as described above. Drag and resize the picture as needed.
Now, navigate to the page containing the diagram and you will find that the picture appears on that page and any other subsequent pages that are added.
Inserting Containers and Callouts
Sometimes, you might want to combine two or more elements of the diagram together. You can use containers to group shapes that are dependent on each other. Callouts help in inserting more text outside the shape. Callouts are always connected to the shape and move along with it.
Inserting a Container
First group the shapes together by selecting Group in the Arrange section of the Home tab.
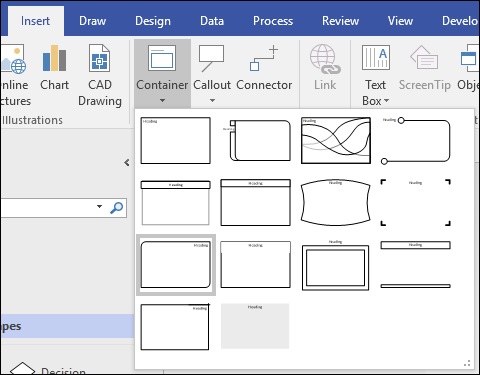
To insert a container, go to the Insert tab on the Ribbon and click the Container dropdown menu in the Diagram Parts section. You will see that there are many designs to choose from for the container.
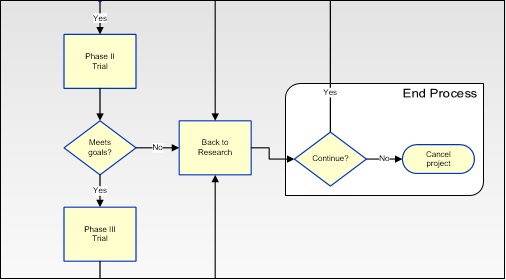
Once you select a design, you can drag the container around the grouped shapes. Release the mouse to lock the container. The container also contains an area for typing text. Double-click the heading area to type the text. In the following example, we have labelled the container as ‘End Process’.
Whenever you drag the container, the contents of the container move together.
Inserting a Callout
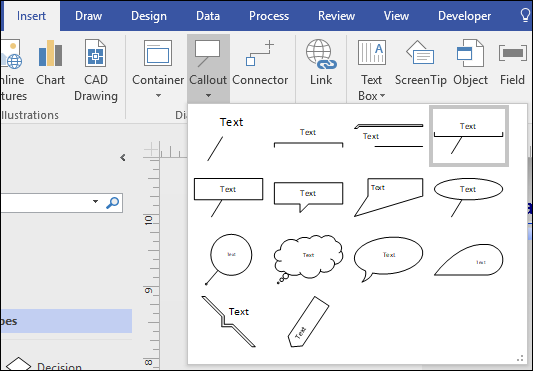
Select the shape for which you want to use the callout. To insert a callout, go to the Insert tab on the Ribbon and click the Callout dropdown menu in the Diagram Parts section. You will see that there are many designs to choose from for the callout.
Select a design appropriate for the callout. The callout will appear connected to the selected shape.
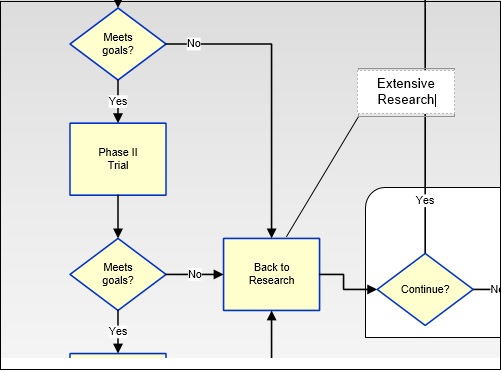
In this example, we have added a callout for the Back to Research process called Extensive Research. The callout is linked to the shape and can be moved about anywhere in the drawing, however it will always stay connected to the shape.
Visio will zoom in when you click the callout to enable typing and will zoom out when clicked outside the callout.
Microsoft Visio — Inserting Hyperlinks
In this chapter, we will learn how to hyperlink websites, files, and pages.
Hyperlinking Websites
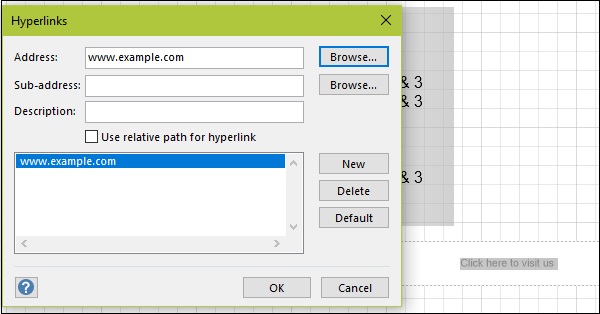
To insert a hyperlink, first create a text box by going to the Insert tab in the Ribbon and drawing a horizontal text box for the text that represents the hyperlink such as ‘Website’ or ‘Click here to visit us’. This text now needs to be converted into a hyperlink.
To do so, select the text in the text box and in the Insert tab again. Click Link to open the Hyperlinks dialog box.
You can specify the links to websites or a local file on your computer. Click OK to convert the selected text into a hyperlink.
Hyperlinking Files
You can directly hyperlink a text or a shape to a file. Double-clicking the text or shape opens the hyperlinked file. The procedure is similar to hyperlinking a website.
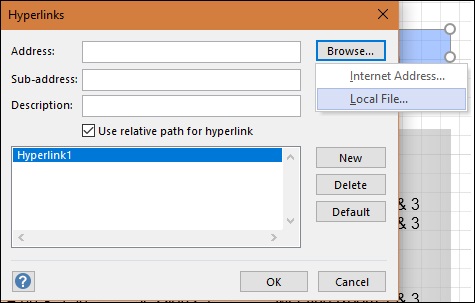
Select the shape or text that you want to create a hyperlink for and click the Link button in the Insert tab of the Ribbon.
In the Hyperlinks dialog box, click Browse… adjacent to the Address field and click Local File… to browse to the location of the file.
Make sure that the Use relative path for hyperlink box is selected to ensure that the file path is updated automatically when you change the file location.
Hyperlinking Pages
Visio also makes it possible to hyperlink pages in a multi-page document so that clicking the link will directly take you to the linked page.
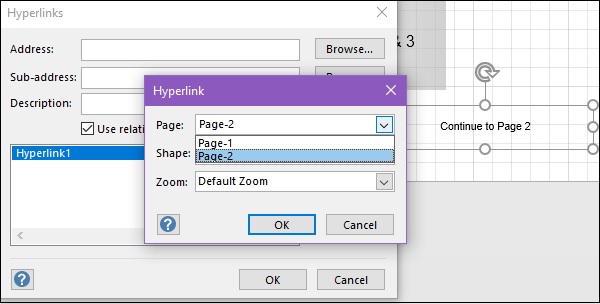
To hyperlink pages, select a text or shape to be linked to and click Links in the Insert tab in the Ribbon. In the Hyperlinks dialog box, make sure to click Browse… adjacent to the Sub-address field. Select the destination page in the Page field. You can also set a default zoom level in the Zoom dropdown menu so that navigating to the linked page opens it at the desired zoom.
Click OK twice to set the hyperlink.
Microsoft Visio — Themes
In this chapter, we will learn how to apply themes in Visio.
Selecting a Theme
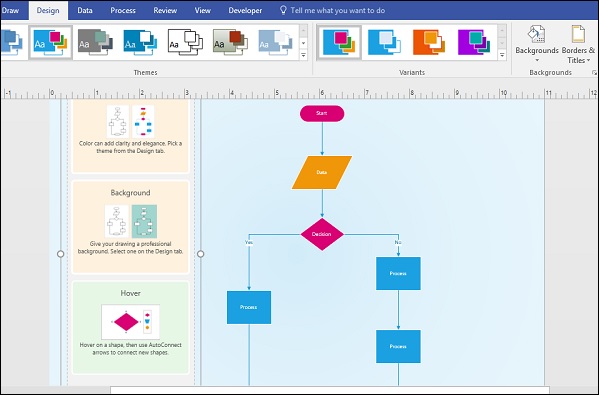
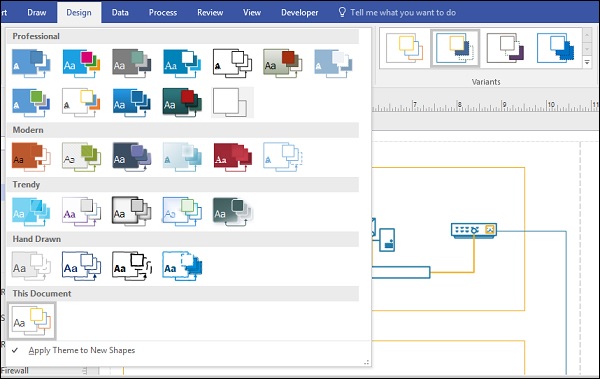
You need not be content with the default theme. Visio allows to customize the theme and overall look of the document. To apply a theme, go to the Design tab and choose from any of the many theme options available. You can choose from a selection of Professional, Hand Drawn, Trendy, and Modern themes.
Once you click any of the available themes, the theme will be applied to the document. You can further personalize it by selecting from one of the many options in the Variants section.
Changing Theme Colors
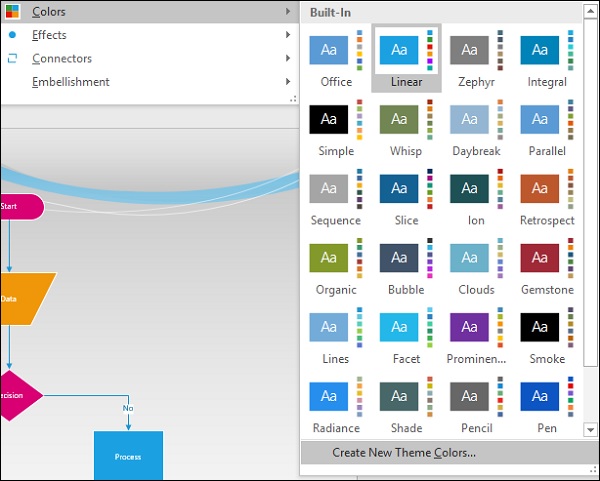
The Variants section allows you to customize theme colors as needed. Clicking the dropdown menu in the Variants section allows to customize the theme colors, effects, and connectors.
To customize a theme color, go to the Colors submenu in the Variants section and click Create New Theme Colors…
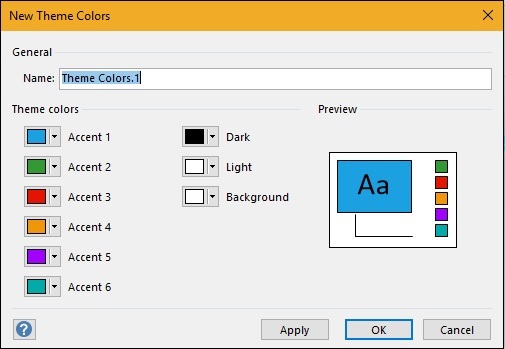
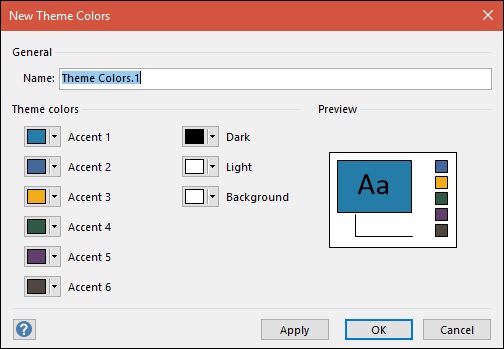
It opens the New Theme Colors dialog box, which allows to customize each of the accents in the theme. Once you’ve decided on the color scheme, name the theme, and click Apply or OK to save the theme color scheme and apply it to the diagram.
Microsoft Visio — Text Formatting
If you are familiar with Microsoft Word, you should be right at home in Visio with respect to formatting text. You can format titles and text within shapes. You can also use the Format Painter command to copy formatting and paste it into another shape or text box.
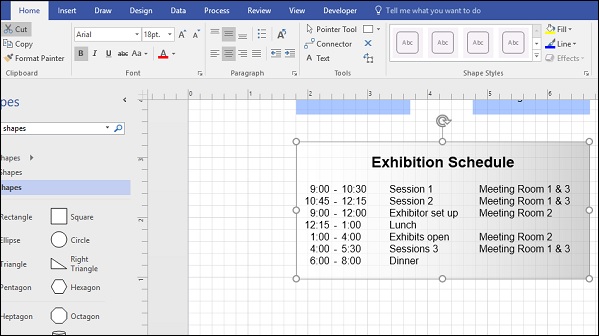
To format the text, select the text box containing the text or highlight the text itself. Then, choose from the options available in the Font and Paragraph sections of the Home tab.
You can change the font, size, color, and paragraph alignment. If you want to change the font styles in a shape, just double-click the shape to select the text within the shape and change the font styles as desired.
Microsoft Visio — Shape Formatting
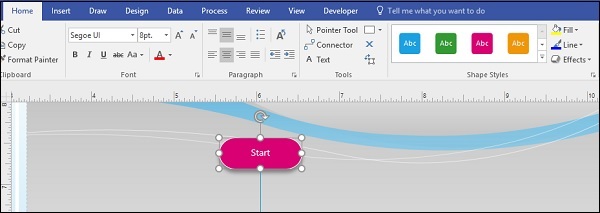
You can also format the shapes to give them a more professional or casual look as desired. To format shapes, select the shape in the diagram and format using the options available in the Shape Styles section.
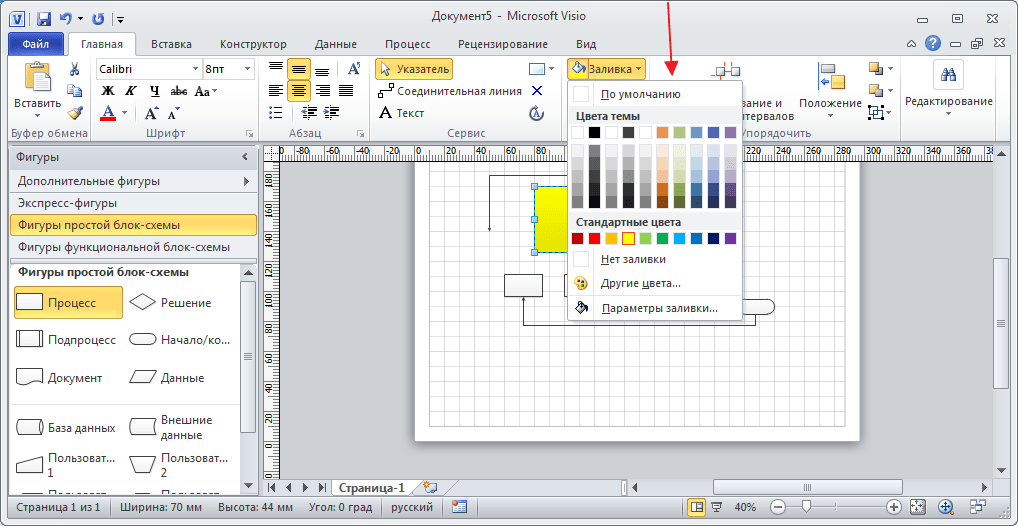
You can select predefined shape styles or you can customize the shape using the Fill dropdown menu. To adjust the color of the shape border, select a color from the Line dropdown menu. The Effects menu allows to add special effects to your shape such as drop shadows or 3D rotations.
Microsoft Visio — Formatting Shape Lines
Visio makes it easy to format the shape outlines and the connectors. You might be looking to format a shape outline to make it stand out from the rest of the shapes or to highlight something important.
Formatting Shape Outlines
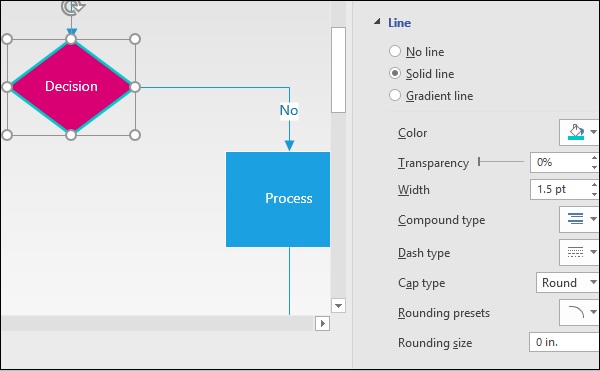
To format a shape outline, click the shape or hold down the Ctrl key on the keyboard and select multiple shapes. Then, from the Shape Styles section of the Home tab, click Line and select Line Options… This will open a Format Shape flyout. In the Line section, select the options you need to customize the shape outline.
You can change the color of the shape outline, increase the width to add more weight, change the rounding, and a whole lot more. You can also create gradients for the line to suit the diagram.
Formatting Connectors
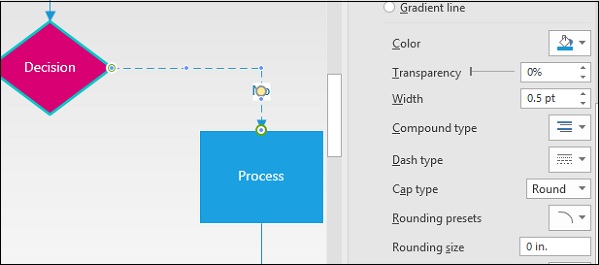
Like shape outlines, connectors can also be formatted as needed. To format a connector, select the connector in the diagram and bring up the Format Shape pane by going to the Line dropdown menu and clicking Line Options…
In the Line section of the Format Shapes pane, select the Dash type of your choice to change the connector pattern. You can also change the color of the connector and adjust the transparency levels as needed.
Microsoft Visio — Rulers,Grids and Guides
Visio comes with visual aids to help align and structure the elements in the diagram so that it appears great both on-screen and in print. The main visual aids available include rulers, grids, and guides.
Rulers
Rulers help in providing perspective to the elements in the diagram. They help orient the shapes to attain a consistent and clean look. Rulers can be switched off or on with a simple checkbox in the Show section of the View tab.
When you move a shape, you will notice that there are 3 dotted lines (shown in the following example in red rectangles) on both the vertical and horizontal rulers. These 3 dotted lines denote the left, middle, and right parts of the diagram. When you drag the shape vertically or horizontally, these 3 dotted lines help position the shape exactly at the place you need.
You can turn of the Ruler checkbox if you need some screen estate.
Guides
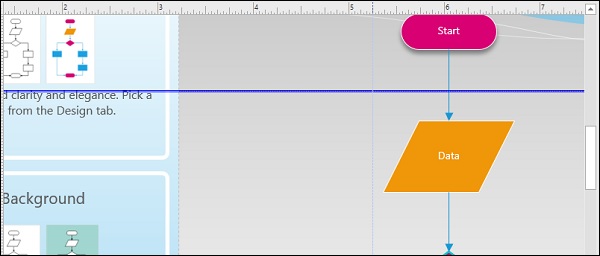
Just like rulers, guides help in orienting different shapes of the diagram properly. You can create any number of guides from both the vertical and horizontal rulers. To create a guide, simply drag a line from either the vertical or horizontal rulers.
Guides are represented by lines, which appear thick when selected. You can delete a guide by simply selecting the guide and pressing the Delete key on the keyboard. Uncheck the Guides checkbox in the View tab to remove all the guides from view.
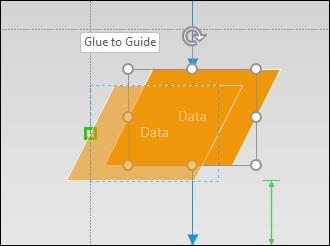
Dragging a shape onto a guide will enable you to snap the shape to the guide. When a shape is snapped to a guide, it moves along with the guide.
Grids not only help to align shapes within the drawing but can also be an important measurement tool. Grids comprise of square boxes of defined area, which can be adjusted. Therefore, grids help you have an estimate of the likely area occupied by the shape, which allows you to size the shapes as needed.
To turn grids on or off, simply check or uncheck the Grid checkbox in the View tab.
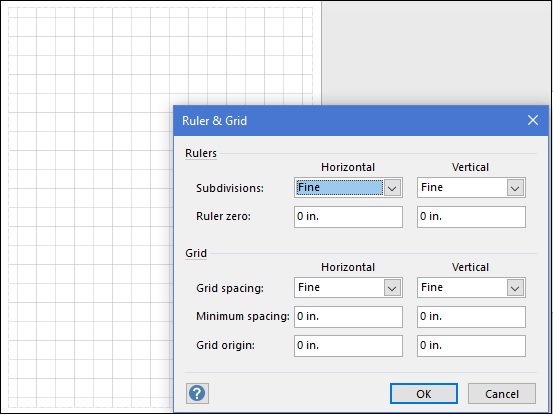
You can also customize the size of each grid by adjusting the spacing between the grids. To do so, click the small downward facing arrow to the bottom-right of the Show section in the View tab.
This opens a Ruler & Grid dialog box where you can adjust parameters such as subdivisions in a grid, the horizontal and vertical spacing, etc.
Microsoft Visio — Using Visual Aids
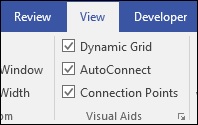
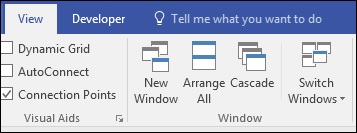
Apart from commonly used visual aids such as the ruler, guides, and grids, Visio also comes with few other visual aids to help you better organize your diagram. These include AutoConnect, Dynamic Grid, and Connection Points.
AutoConnect
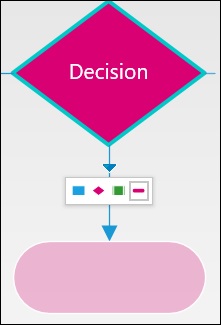
One of the advantages of using SmartShapes is the ability to quickly and easily connect a shape to the top four favorite shapes. AutoConnect helps to quickly select a shape from the top four and instantly establish a connection to the new shape. Sometimes, you might not need this feature. In such cases, you can disable the AutoConnect feature by simply unchecking the AutoConnect checkbox from the Visual Aids section of the View tab.
When the AutoConnect checkbox is unchecked, the SmartShapes and connecting arrows do not appear when a shape is selected.
Dynamic Grid
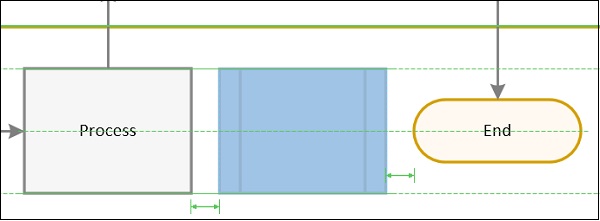
Dynamic grid provides a relative alignment cue when you insert a new shape. When the Dynamic Grid option is turned on, you will see guides and indicators relative to the shape.
Dynamic Grid can be used in conjunction with the actual Grid. The actual Grid is more of an absolute measurement and should be considered when precise measurements are of importance in deciding the placement of the shapes. The Dynamic Grid is more of a relative measurement.
In the above example, we see that turning on the Dynamic Grid allows us to see the relative distance of the new shape with respect to pre-existing shapes.
Connection Points
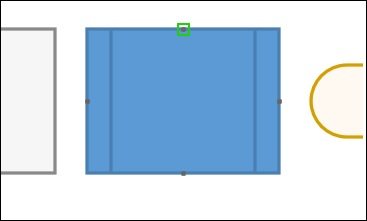
Connection Points help in connecting shapes to specific points along the surface of a shape. For example, a shape can have four Connection Points along its perimeter to which connectors can attach to. Turning on Connection Points help to connect shapes precisely at defined connection points.
Connection Points can be identified by green squares that appear on all sides of the shape. If you want to connect to the shape directly rather than to a connection point on the shape, uncheck the Connection Points checkbox in the View tab of the ribbon.
Microsoft Visio — Task Panes
Task Panes provide additional functionality to the user interface. You can use task panes to customize or add parameters to an object. The Shapes pane which is there by default, is an example of a Task Pane.
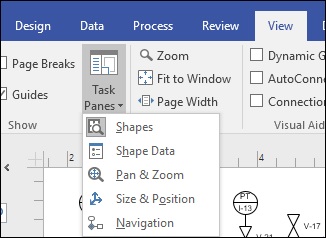
Task Panes can be floating or docked and can be resized as needed. Apart from the Shapes task pane, there are quite a few other panes, which can be accessed from the Task Panes dropdown menu in the View tab of the Ribbon.
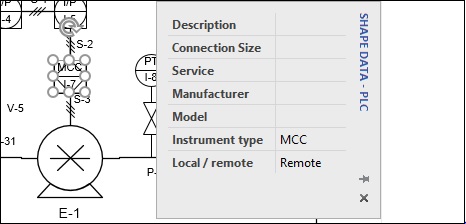
Shape Data Pane
The Shape Data pane allows entry of additional shape metadata. This metadata is contextual and depends on the shape being selected.
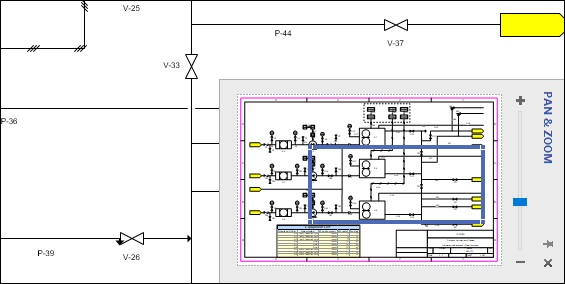
Pan & Zoom Pane
The Pan & Zoom pane allows to navigate and zoom to any part of the drawing easily. Pan & Zoom’s slider makes it easy to exactly zoom into a specific part of the diagram. This is especially useful while working with complex diagrams.
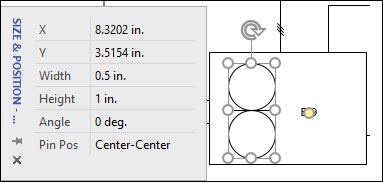
Size & Position Pane
The Size & Position pane allows you to change the dimensions of a selected shape. This allows to set precise measurements of a shape. You can also change the angle of orientation of the shape and the pin position from which the measurements are to be considered.
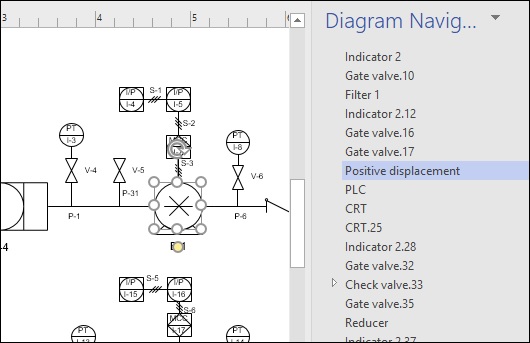
Navigation Pane
The Navigation pane is available only in the Office 365 version of Visio. It basically lists all the elements of the diagram and makes it easy to navigate to each of them. This is especially useful if the diagram has varied shapes and you want to navigate to a specific shape type. Selecting the name of the shape in the Navigation pane selects it in the canvas.
Microsoft Visio — Working With Windows
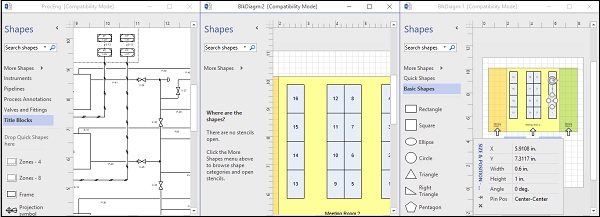
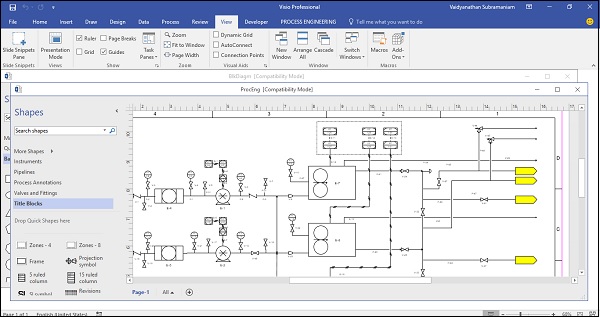
It is easy to work with multiple windows or multiple versions of a document in Visio. You can switch between windows easily or arrange them side by side for a comparative look. The options for window rearrangement can be found in the Window section of the View tab.
New Window
New Window basically allows to create a new copy of the existing window. The new copy will not show the stencils directly, however, they can be selected by clicking the More Shapes arrow in the Shapes pane.
The new window can be identified by the presence of a number in the title bar of the window. In the following example, the original file name was BlkDiagm.vsd. Using the New Window command creates a new window with BlkDiagm: 2 in the title bar.
Arrange All
This function allows you to arrange all windows side by side. This feature is useful for comparing two windows, however, if you have a high-resolution display, you might be able to accommodate more windows beside each other. The Shapes pane and other panes can be minimized to allow more screen real estate.
Cascade
This function allows cascading of windows to give an overall view of the open windows. The active window is in the foreground, while inactive windows are in the background with title bars visible. Cascade view is useful to know which documents are open at a glance.
Microsoft Visio — Printing Diagrams
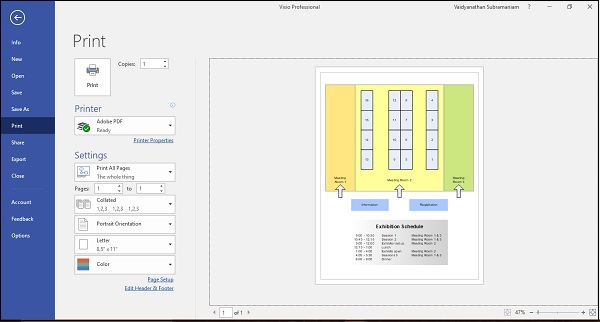
To print a drawing, simply go to the File menu and click Print or press the keyboard shortcut Ctrl+P. The Print menu provides several options to select the layout of the printed page and the printer to which you’d like to send the document for printing.
The right side of the Print menu shows a preview of the output. You can change the orientation of the page, page size, and select only the pages that you need to print.
Depending on your printer, you can also print in color or in greyscale. Remember that printing in black and white might not produce a good output. It is best to print in greyscale, if you wish to save on your printer’s ink.
Microsoft Visio — Publishing to PDF
Visio includes several ways to create a PDF of the drawing, which is extremely useful for sharing with others. You can directly save the document as a PDF, print to PDF, or email the drawing directly as a PDF.
Save as PDF
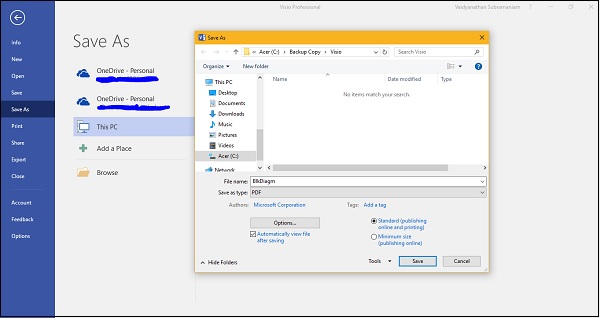
You can save the drawing as a Visio drawing (.vsd or .vsdx) by default or save it as a PDF, which can then be opened by any freely available PDF reader such as Adobe Reader. To save as PDF, go to the File menu, click Save As and then click Browse. This opens the Save As dialog box. Select PDF in the Save As type field to save the document as a PDF.
Print to PDF
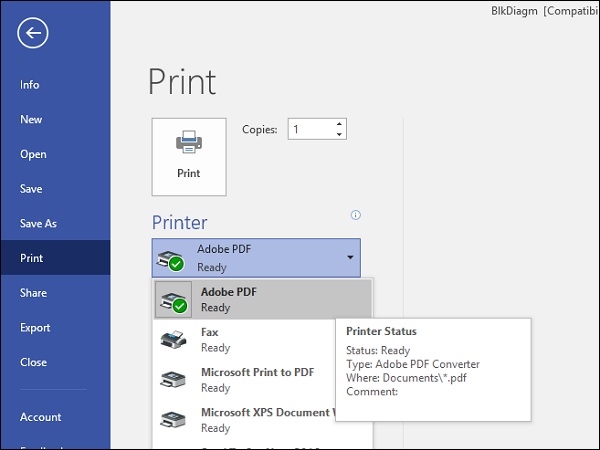
You can also directly print to PDF if you have a compatible software printer such as Adobe PDF or Microsoft Print to PDF installed. You might want to use this if you need to have fine grain control over the PDF document such as PDF version or compatibility properties.
Email PDF
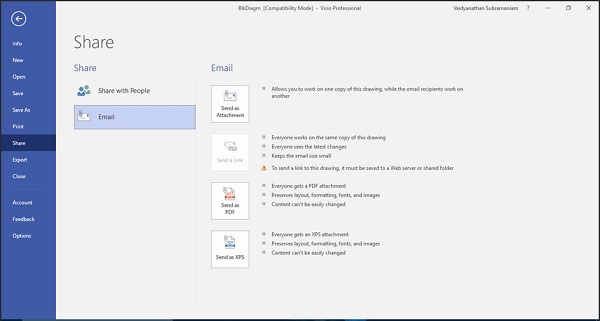
You can also directly email the diagram to a recipient. To do this, go to the File menu, click Share and then click Send as PDF. This creates a new email in your default email client with the PDF file readily attached. Just enter the email address of the recipient to send the attachment.
Export Diagrams to JPG or GIF
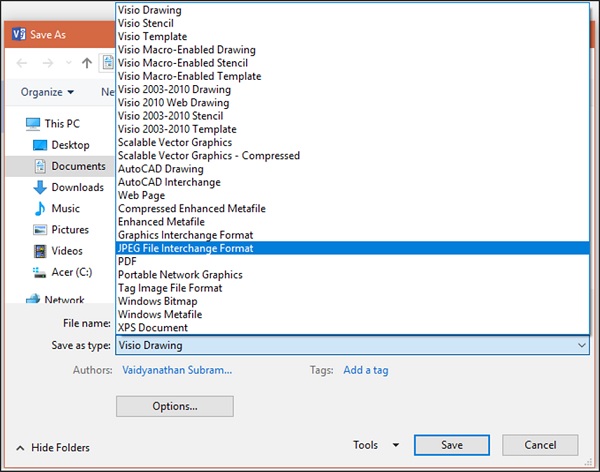
Similar to PDF, Visio can also export image formats such as JPG, GIF, TIFF, PNG and Bitmap. Exporting image formats is useful while sharing the drawing easily with others or to put it up on a web page.
To export a drawing, go to the File menu, click Save As and in the Save As type field, choose from the list of supported formats. You can choose from any of the abovementioned graphics formats.
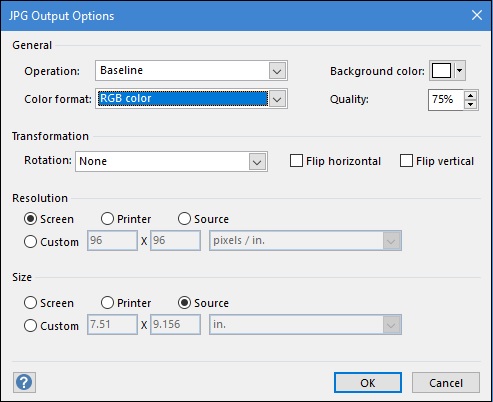
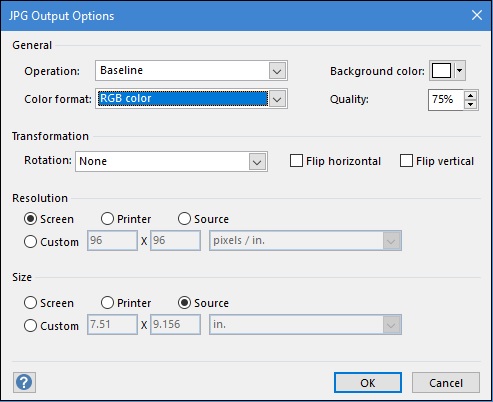
Once you choose a graphics format to export to, you will get some options to choose from depending on the capabilities of the graphic format. In the following example, we see that selecting the JPEG File Interchange Format shows up a lot of options for customizing the output.
The options in the Operation and Color format fields are format specific. You can leave them mostly as default. Set the Background color as white if you have a background for the drawing. Set the Quality as needed. You can also rotate the drawing or flip it horizontally or vertically.
The resolution and size of the output diagram can be matched with the screen, printer, or source. You can also input a custom resolution or size. Click OK.
Exporting to Web Pages Using HTML
You can also export drawings to web pages which can be hosted on a web site. Visio allows customizing what goes into the web page. Go to the Save As dialog box from the File menu and select Web Page in the Save As type field. Then, in the same dialog box, click Publish… to open the HTML publishing options.
You can select which of the components of the diagram that you want to publish and the number of pages to publish. You can also provide a page title.
The HTML file is created in the chosen location along with a folder containing the supporting files. Both the HTML file and the folder are linked together.
Creating Layers with SmartShapes
Adding SmartShapes automatically creates layers. Layers are basically overlays, which can be individually customized and turned on or off. Each shape and connector in the diagram forms a layer whose properties can be customized.
To know the list of layers in the diagram, in the Editing section of the Home tab, click the Layers dropdown menu and click Layer Properties…
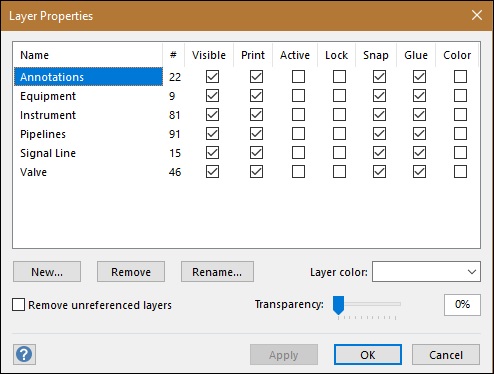
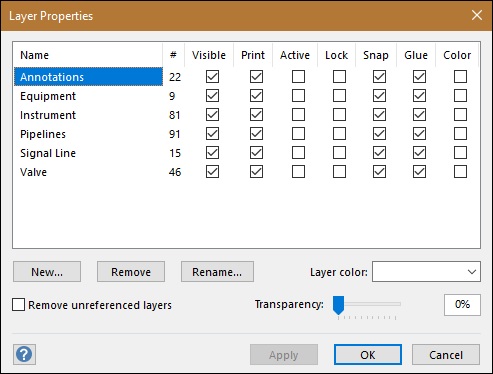
This opens the Layer Properties dialog box, which you can use to customize the different layers in the diagram.
The Layer Properties dialog box lists the different layers in the document and allows changing the individual properties of the layers.
Microsoft Visio — Working with Layers
Layers are automatically assigned to shapes. However, Visio allows to assign layers to shapes as needed. You can also create your own layers. Let us start by creating a new layer and then assign some shapes to the new layer.
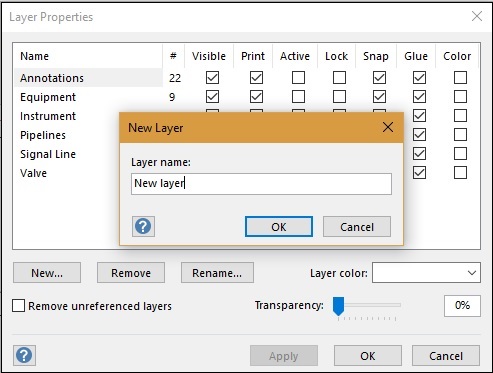
Creating a New Layer
Go to the Layer Properties… dialog box in the Layers dropdown menu from the Editing section of the Home tab and click New… Type a name for the new layer.
The new layer will be created in the Layer Properties dialog box and will initially have zero shapes, as they are yet to be assigned. Click OK.
Assigning Shapes to a Layer
Shapes can be assigned to any layer. To assign a shape to a layer, click the shape or connector in the diagram and then, click Assign to Layer in the Layers dropdown menu from the Editing section of the Home tab.
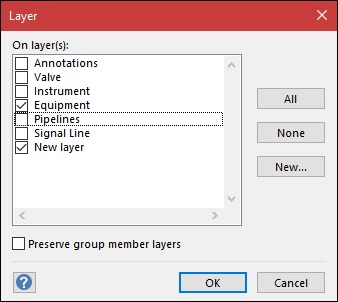
It opens the Layer dialog box from which a shape can be assigned to either an existing or a newly created layer.
Note that the New Layer that was created earlier is now in the list. A shape can be assigned to more than one layer as well. To assign a shape to all the layers in the document, click All and then click OK.
Microsoft Visio — Layer Settings
The Layer Properties dialog box allows to change the properties of individual layers. It comprises of several checkboxes such as Name, #, Visible, Print, Active, Lock, Snap, Glue, and Color.
The Name field lists the type of layer, while the # field lists the number of shapes in that type. In the following example, we see that there are nine equipment shapes in this diagram.
There is a row of checkboxes for each layer type that can be selected or deselected. Unchecking the Visible checkbox makes the shape invisible in the drawing. If the Print checkbox is checked, the shape will be printed along with the others. Unchecking the Print checkbox will not print the shapes in the layer.
Similarly, layers can be made active or locked. Shapes in an active layer can be manipulated without affecting the other shapes or layers. When you lock a shape, Visio prevents any changes from happening to the shape. You cannot drag the shape or change its contents. Snap and Glue will be checked, if the shapes are allowed to snap to a grid. You can also represent a layer by a color for easy recognition.
When you represent a layer by its color, the shapes belonging to that layer will also be colored in the diagram. This is useful if you want to differentiate a set of shapes from another.
Microsoft Visio — Themes and Styles
Themes and Styles are useful to give the diagram a design makeover and make it stand out. Visio provides a standard set of themes and styles, which are customizable.
Themes
Themes apply to the entire diagram. Themes comprise of a set of colors and effects that generally blend well with each other. They are a great way to quickly give the diagram a polished look. Themes also affect other parts of the document such as titles, headings, text, etc.
To apply a theme, go to the Design tab and select a theme from the Themes section. The dropdown arrow provides more choices categorized by theme type. When you click a theme, all the aspects of the diagram and other parts of the document reflect the theme settings.
A theme can have many variants, which can be selected from the Variants section of the Design tab.
Styles
Styles are different from themes such that, they are applicable to a selected shape or a group of shapes. Styles help in customizing the aspects of a particular style.
To change a style of a shape, select the shape and from the Home tab, then select a style from the Shape Styles section. Style can be applied to both shape elements in the diagram as well as to individual text boxes. You can select multiple shapes to apply the style to all of them together.
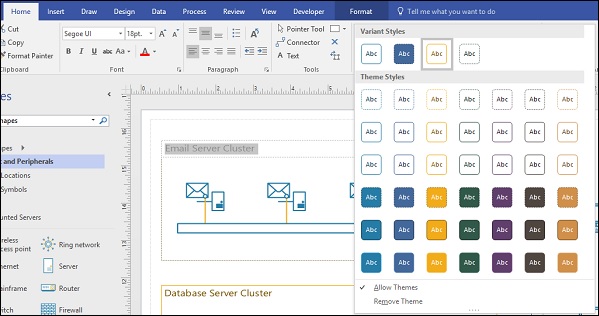
When you change a theme after applying a style to a shape, the shape will take up the characteristics of the theme but will still remain distinct from other shapes. Of course, you can continue to customize the style even after applying a theme.
Applying Theme Colors and Effects
Themes are useful to customize the appearance of the document. Visio goes a step further and allows to customize the themes themselves.
Themes come with variants that can be further customized as needed. Theme variants can be accessed from the Variants section in the Design tab. You can use the stock variants or click the dropdown menu to customize many other aspects.
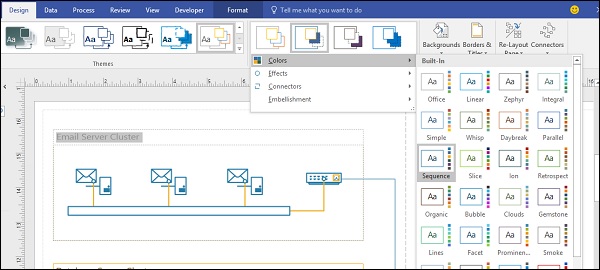
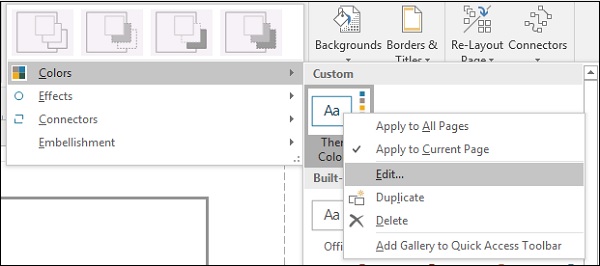
In the Colors menu, you will find that there many color combinations to choose from.
The Effects menu shows some of the effects that can be applied onto the selected shape.
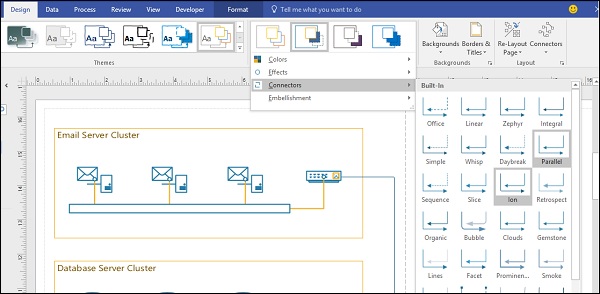
You can also choose from a range of connectors.
Blocking Themes from Affecting Shapes
Sometimes, it becomes necessary to prevent themes from affecting one shape or a group of shapes, especially if they have important information that has to be presented in a particular way. Visio allows to protect a shape, thereby preventing any theme changes from affecting the shape’s intended design.
To enable protection for a shape, click a shape or a group of shapes. Go to the Developer tab in the Ribbon, click Protection in the Shape Design section. (Note − You may need to first enable the Developer tab by customizing the Ribbon).
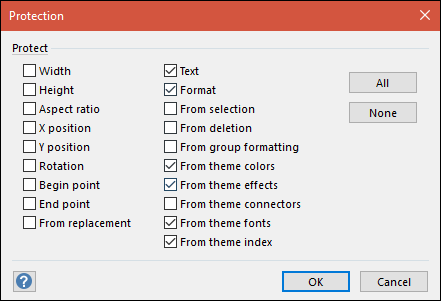
This opens the Protection dialog box that allows to select which components of the shape to protect from being overridden.
We will focus on protecting the theming of the shape for now. So, select the checkboxes for Text, Format, From theme colors, From theme effects, From theme fonts and finally, From theme index. Click OK.
If you now select any theme from the Design tab, you will notice that the shape that is protected is unaffected by the theme change.
To reverse the changes, simply go to the Protection dialog box again, click None and finally click OK.
Custom Color Scheme for Themes
Visio comes with a good selection of themes and variants to suit almost any need. However, sometimes you might have the need to create a specific color scheme that reflects your organization.
To do this, select a theme from the Design tab and choose a variant from the Variants section that closely matches to what you intend to create. Then, in the Colors menu in the Variants section, click Create New Theme Colors…
In the New Theme Colors dialog box, give a name for the theme in the Name field. There are 5 accent colors to customize. Depending on the colors that you want to customize, choose a color for each accent. Click Apply to see a preview of the effect. Once you are satisfied with the color scheme, click OK to save the color scheme.
The new color scheme can be found in the Custom section of the Colors menu. You can always edit this color scheme by right-clicking the custom scheme and clicking Edit.
Microsoft Visio — Working with Org Charts
Organization charts or org charts are a great way to depict hierarchy in an organization. Visio provides ready-made templates to help you get started in creating org charts. In the following series of chapters, we will learn different aspects of creating and working with org charts.
Using the Org Chart Template
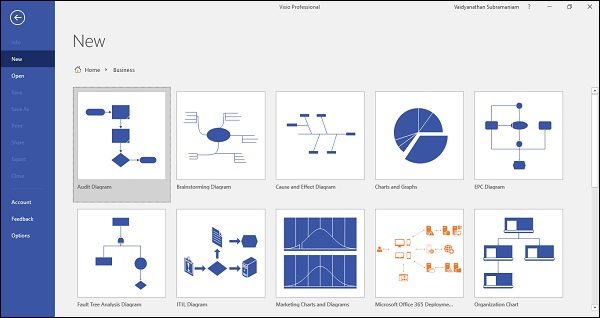
The easiest way to get started is to use an inbuilt org chart template and build upon it. In Visio 2016, the org chart template can be found by going to the New menu. Click the Home button, click New and select the Templates tab. In the Templates tab, go to the Business category and click Organization Chart.
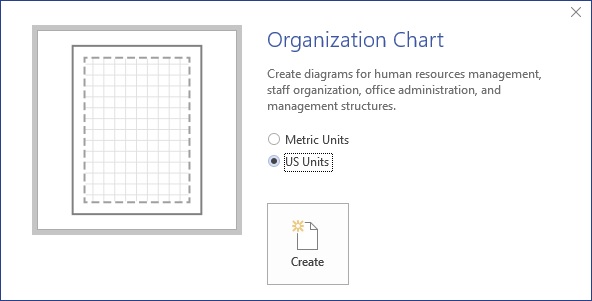
It will open a dialog box in which you can choose the chart to be created in either Metric or US units. Select the units you are comfortable with and click Create to load the org chart shapes in a new diagram.
Inserting a Top-Level Executive Shape
Once the chart is created, you will notice that the Ribbon has a new Org Chart tab that lists the shape styles you can use.
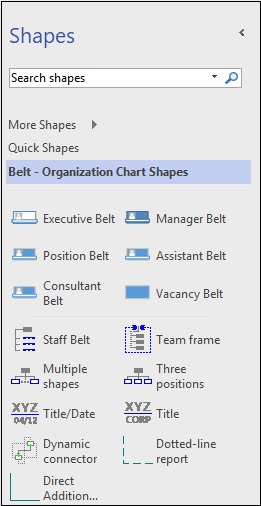
The Shapes pane has all the shapes necessary to use in a org chart. The shapes change based on the shape style selected in the Org Chart tab in the Ribbon. In this example, the currently selected shape style is Belt.
To insert a top-level shape, drag the Executive Belt shape over to the canvas and align it to the center of the page.
Inserting Manager Sub-shapes
Once the top-level executive shape is created, it is easy to create manager sub-shapes. The Executive Belt shape will not offer SmartShapes as this is a hierarchical chart with defined positions.
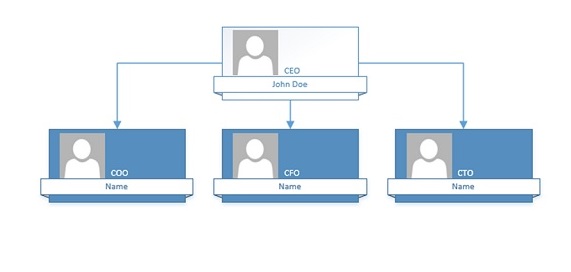
To insert a manager, simply drag the Manager Belt shape onto the Executive Belt shape. You will notice that Visio automatically connects both the shapes. You can add more Manager Belt shapes onto the Executive Belt shape and Visio will automatically connect, space, and align all the shapes.
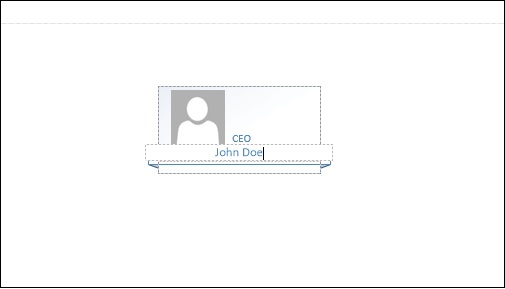
You can then enter details into the shapes by zooming in and double-clicking the shape to activate the text box. Unlike the Executive Belt shape, the manager shapes will offer the choice of using SmartShapes.
Microsoft Visio — Subordinate Layouts
We can continue building on the org chart previously created. Based on the organizational hierarchy, corresponding shapes can be added to the existing shapes. Visio will then automatically create the connection and align the new shape in the diagram.
Adding a Position Belt
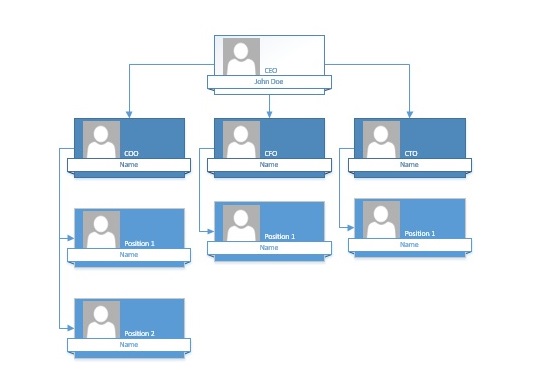
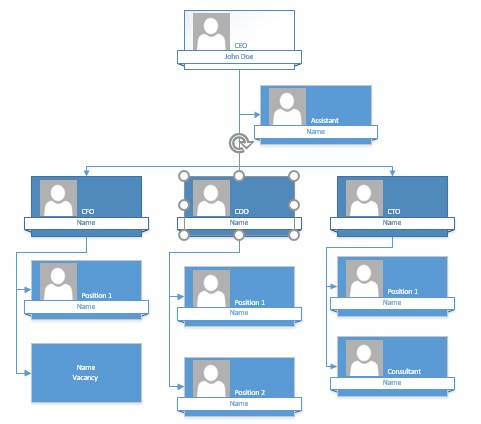
A position belt is used to indicate a position under an executive. In the following example, several position belts have been added to each of the three manager sub-shapes. To add a position shape, simply drag the Position Belt shape from the Shapes pane over any of the manager sub-shape. Visio automatically creates the Position Belt shape and connects it to the manager shape above.
Adding a Vacancy Belt
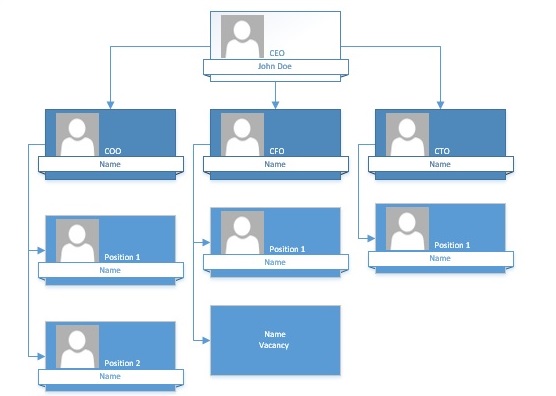
In an organization, not all positions will be always full. There will be a few vacant positions that need to be filled. You can indicate a vacancy by dragging the Vacancy Belt shape onto any of the managerial shapes. A vacancy shape is different from the other shapes and can be easily identified.
Adding Consultant and Secretary Shapes
Similarly, you can also add the consultant and assistant shapes to the org chart. In the following example, a consultant has been added to the CTO and an assistant to the CEO. Drag the Consultant Shape on top of the CTO shape and the Assistant shape on top of the CEO. Visio will automatically adjust the spacing and connections between the shapes.
Microsoft Visio — Team Member Re-ordering
It may be necessary to re-order team members in the org chart. Shapes can be moved to the left and right or to the top and bottom, depending on how you’d like them to be ordered. Since this is an org chart, there will be an Org Chart tab in the Ribbon. Click the tab and in the Arrange section, click either of the arrows in the Move command.
Depending on the position of the shape in the drawing, moving left and right can also mean moving up and down. When you move a shape, all sub-shapes also move along with it. In the following example, the COO shape was moved to the right and with it, all positions below it also move.
Adding Team Frames to a Diagram
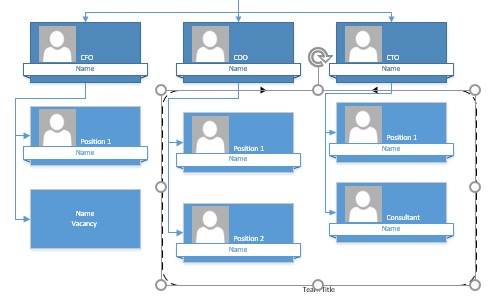
A team frame helps to denote members of different teams who work on a common project. To add a team frame, drag the team frame shape from the Shapes pane onto the teams that you want to include.
The team frame can be adjusted along its handles to accommodate as many members as needed. The team frame border line and the label can be formatted as needed. To format the team frame border, click the team frame and go to the Home tab and in the Shape Styles section, select the shape formatting needed.
Microsoft Visio — Creating Report Indicators
A dotted line report helps in identifying individual team members who report to multiple people. To add a dotted line, drag the Dotted-line Report shape from the Shapes pane onto the canvas.
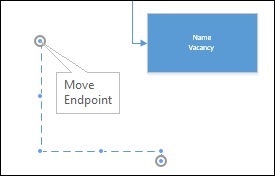
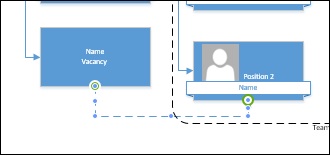
You will see that there are two endpoints to the dotted line. Drag one of the endpoints to the first shape and the other endpoint to another shape to create a dotted line that indicates the team member reports to more than one position.
Creating Three and Multiple-position SmartShapes
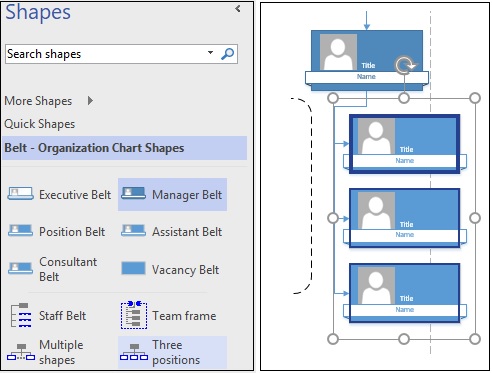
Although you can create individual shapes by dragging the desired shapes from the Shapes pane, Visio facilitates creating multiple shapes at one go. All shapes added together will be automatically connected and aligned.
Creating a Three-Position SmartShape
To create a three-position SmartShape, drag the Three Positions shape onto any of the higher manager shapes.
This creates three shapes directly below the higher shape. You will notice that the shapes can spill over onto the next page. This can be rectified by clicking the Re-Layout button in the Layouts section of the Org Chart tab.
Creating a Multiple-Position SmartShape
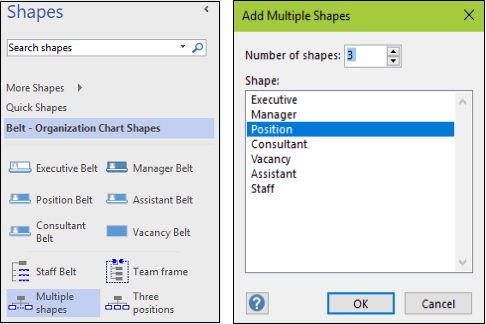
Similar to a three-position SmartShape, Visio also helps to create a multi-position SmartShape in which you can select as many positions as you want. To create a multiposition SmartShape, click and drag the Multiple shapes from the Shapes pane onto a selected shape on the canvas.
It opens an Add Multiple Shapes dialog box in which you can select the type of shapes and the number of shapes to be added. Click OK to add the shapes to the selected shape.
Microsoft Visio — Adding Executive Pictures
You can add pictures to different levels in your org chart to make it more visually appealing. To add executive pictures, double-click the shape to zoom into it and then click the picture field within the shape.
Then click the Insert button to select a picture for adding into a shape. To prevent an image from showing up in a shape, click the Show/Hide button.
After adding an image, you can use the usual picture formatting tools to adjust the brightness and contrast or crop the image.
If you want to automatically import executive pictures into their respective hierarchies, simply make sure the file names of the executive pictures match that of the names in the shapes. Then import the entire folder and Visio will automatically place the executive in his/her corresponding hierarchy.
Breaking Down Structures Using Sync Copies
It might be required to break down the org chart so that each executive gets his/her own page to avoid congesting the chart. Synchronization allows any change made to the executives in other pages to remain in sync with the main page.
To synchronize a shape, click the shape and then the Synchronize button in the Org Chart tab.
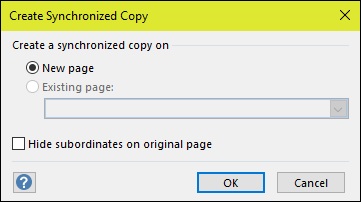
This opens the Create Synchronized Copy dialog box, which allows to create a copy of the shape and its subordinates on a new or an existing page.
Click the Hide subordinates on original page checkbox, if you want to collapse the shape on the main page. Any changes made on the synchronized shape pages will be seen on the main page as well.
Microsoft Visio — Reporting Structure Views
Individual manager shapes can be collapsed and shown as needed. Collapsing shapes is useful to reduce the clutter in the diagram.
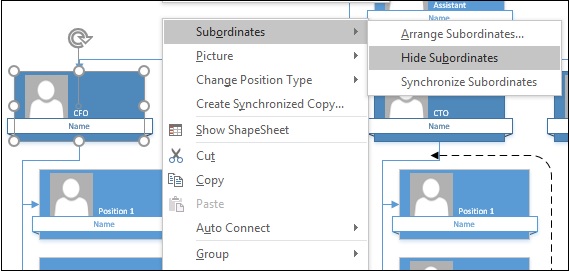
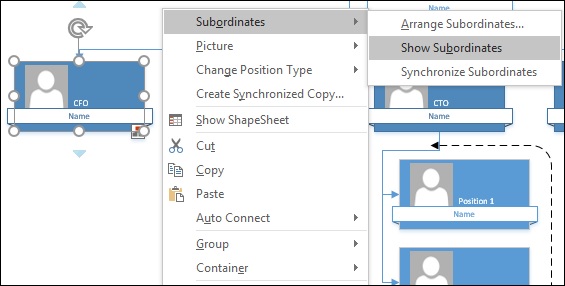
To collapse the hierarchy under a shape, right-click a shape, go to the Subordinates menu and click Hide Subordinates.
The subordinate shapes then collapse under the manager shape. This is indicated by a tree icon under the manager shape.
If the shapes are synchronized, any changes made to them elsewhere will be automatically reflected in the main shape.
To reveal the subordinates again, right-click the manager shape, go to the Subordinates menu and click Show Subordinates.
Microsoft Visio — Using the Org Chart Wizard
Although you can manually create the org chart using different shapes in the Shapes pane, Visio also provides an automated way of importing information about your organization from an external source. In this chapter, we will look into importing data from information in an Excel spreadsheet.
Creating Information in an Excel Spreadsheet
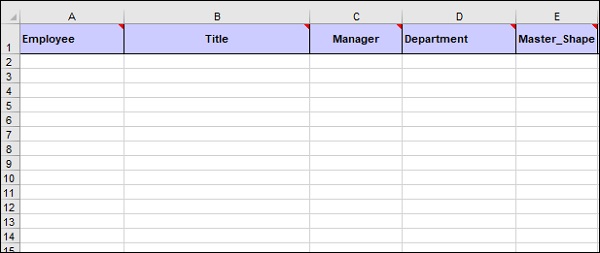
Create an Excel spreadsheet or use an existing one containing some of the important information in the header row that goes into creating an org chart. Important information includes Employee, Title, Manager and Department. The Employee and Manager fields are mandatory and the others are optional.
Additionally, you can also include a field called the Master_Shape, which indicates the exact shape to be used for a particular employee. Note that the name, Master_Shape field needs to be used as is for Visio to designate a specific shape to the employee.
Starting the Organization Chart Wizard
There are two ways of starting the Organization Chart wizard. The first method involves using the Organization Chart Wizard from the Templates section in the New menu.
The other method is to use the Import command in the Organization Data section from the Org Chart tab in the Ribbon, if you have already created an org chart.
The second method is recommended if you need the background formatting to carry over onto all the pages in the org chart. The first method creates all the pages required, but you need to individually format each page, which can get tedious if your organization is large.
Either ways, the Organization Chart Wizard appears in which you can specify the features of your org chart.
Using the Organization Chart Wizard
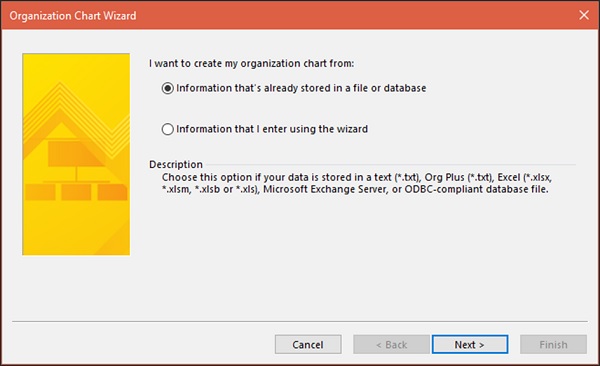
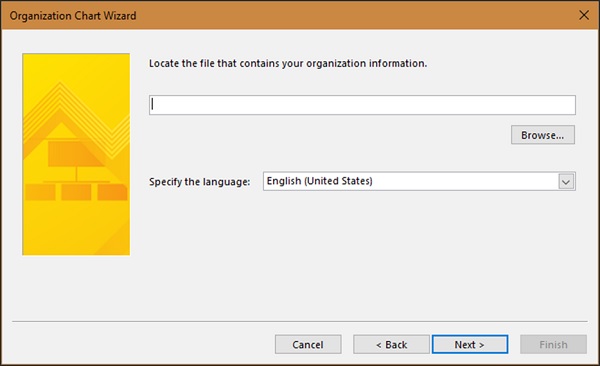
The first screen of the Organization Chart Wizard gives the option of either selecting the existing information from a file or manually entering information. For this example, we will choose the first option. Click Next to proceed to the next screen in the wizard.
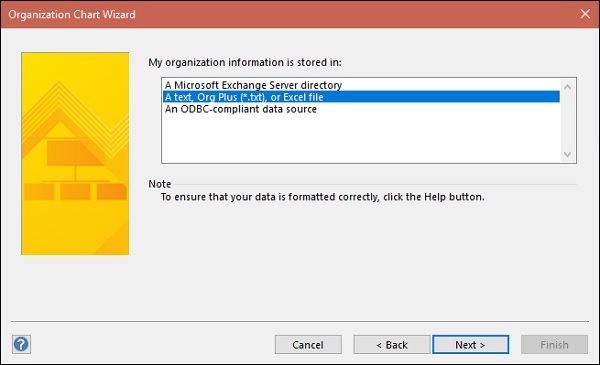
In the following screen, you can choose the source in which the organizational information is stored. It could be a location on a Microsoft Exchange Server, a local text, CSV or Excel file, or an ODBC-compliant data source. Select the second option and click Next.
Now, enter the location or path to the Excel file and click Next.
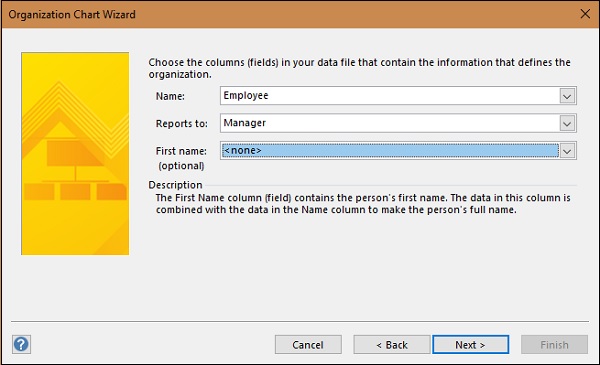
In this screen, in the Name field dropdown, select the field in the Excel spreadsheet that contains the name of the employee. In the Reports to field dropdown, select the field in the Excel spreadsheet that denotes the reporting manager. If the name and first names are in different fields, specify the field containing the first name of the employee in the First name dropdown.
Visio will combine the name and first name fields to generate the full name of the employee. Click Next to continue.
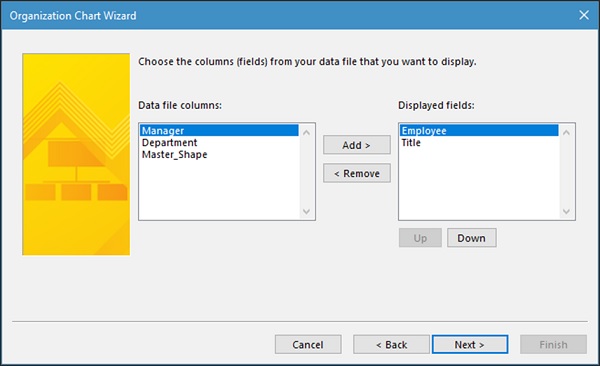
The Data File Columns box lists all the data fields that are present in the header of the Excel file. You can select the fields that you need to be displayed in the Displayed Fields section by selecting the required fields and then click Add. Click Next, once the desired fields are added.
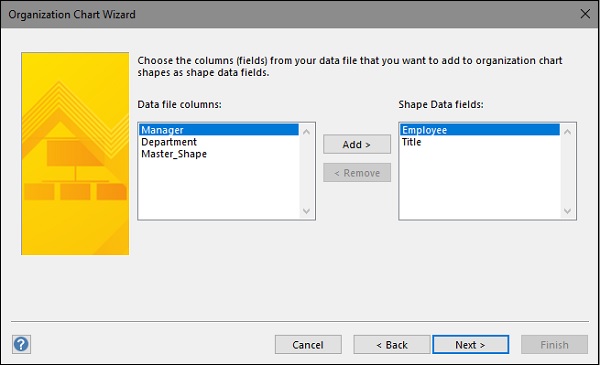
In the next screen, you can choose the fields the shape data should be based on. The shape data fields will be similar to the fields selected in the previous step so in most cases, you can leave it as such. You can also add any additional fields if needed.
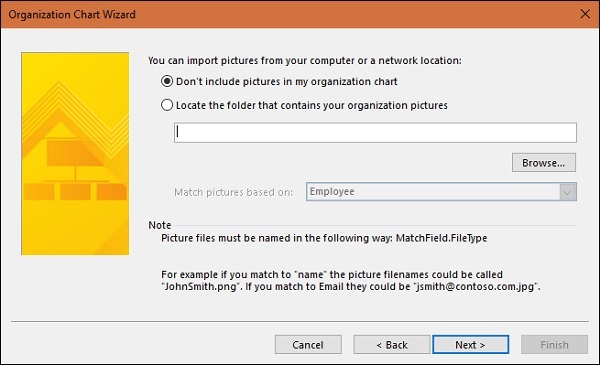
In the following screen, you can choose to include pictures of the employees. If you have labelled pictures in the same format as the employee names, you can point to the location of the folder containing pictures of all the employees. Or you can simply choose not to include any pictures.
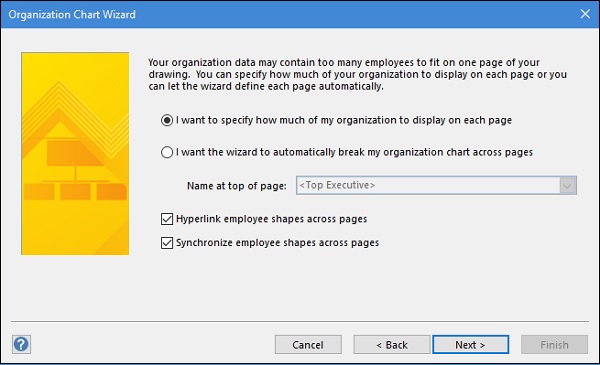
In this screen, you can choose how much of organization info can be displayed on one page, if there are many employees spanning many pages. You can also choose to allow Visio to automatically break the org chart across pages. Make sure that Hyperlink employee shapes across pages and Synchronize employee shapes across pages are selected. Click Finish to finally create the org chart.
After clicking Finish, Visio will start processing information from the Excel spreadsheet and create the org chart based on the parameters specified in the wizard. You will see a progress indicator showing the status of the creation.
Publishing Organizational Charts
The completed org chart can be saved as a PDF or any of the image formats by going to the File menu and clicking Save As. Select from any of the file types in the Save As type field.
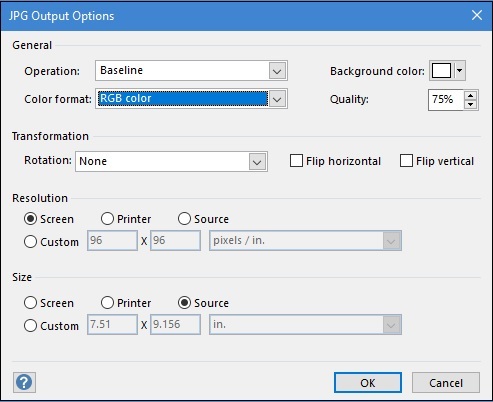
If you save the drawing as a JPG or GIF file, you will get another dialog box, which allows to further specify the output options.
Structure of Brainstorming Diagrams
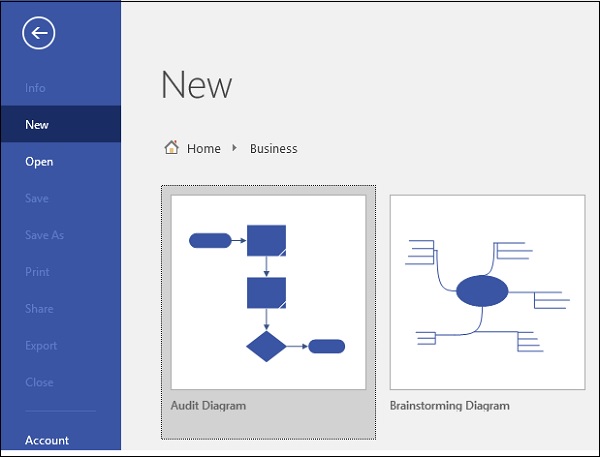
A brainstorming diagram is similar to an org chart but is used more to convey different ideas about a topic. To create a brainstorming diagram, click File and go to the New menu. In the Templates section, select Business, and then in the list of templates, select Brainstorming Diagram, choose the desired units to work with and click Create.
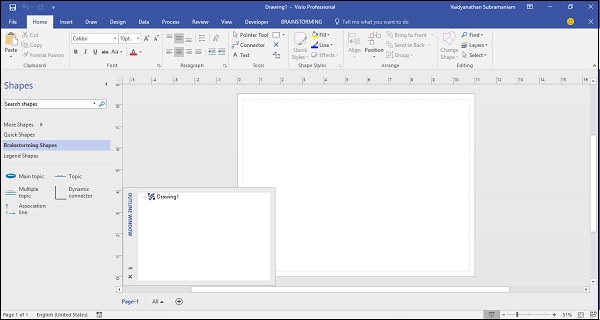
You will notice that the brainstorming diagram document is created and ready to use. This has a few notable differences compared to the org chart. Firstly, the number of shapes are lesser than an org chart. Secondly, there is an Outline Window that appears in the drawing showing the outline of the diagram. Thirdly, there is a Brainstorming tab added to the ribbon, which contains tools required to use the brainstorming diagram.
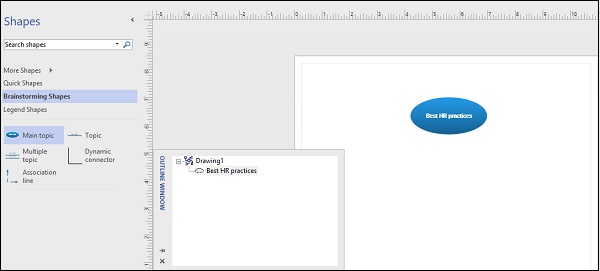
To create the central topic for the brainstorming diagram, drag the Main topic shape onto the canvas. Unlike the org chart where you had to double-click the shape to enter text, you can start typing text in a brainstorming diagram as soon as you drag the shape onto the canvas.
Adding, Editing and Placing Subtopics
In this chapter, we will learn how to add, edit and place subtopics in the brainstorming diagram using Visio.
Adding Subtopics
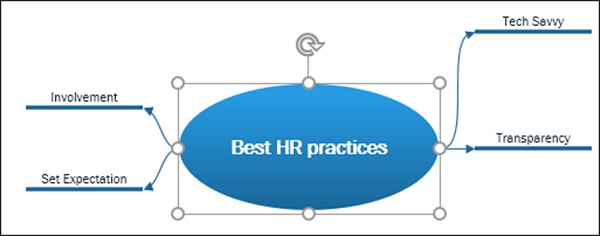
In a brainstorming diagram, sub-shapes are not directly inserted on top of the main shape. A sub-shape is inserted as a subtopic. To insert a subtopic, first click the Main topic shape and then click the Brainstorming tab on the Ribbon. In the Add Topics section, click Subtopic.
It creates a subtopic to the Main topic shape, which is ready to type on.
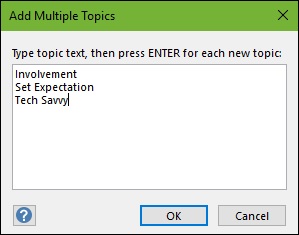
You can also create multiple subtopics at once by clicking the Multiple Subtopics in the Add Topics section. This opens the Add Multiple Topics dialog box, where you can enter the names of each of the subtopics.
Each subtopic is automatically connected to the Main topic shape.
Editing and Placement of Subtopics
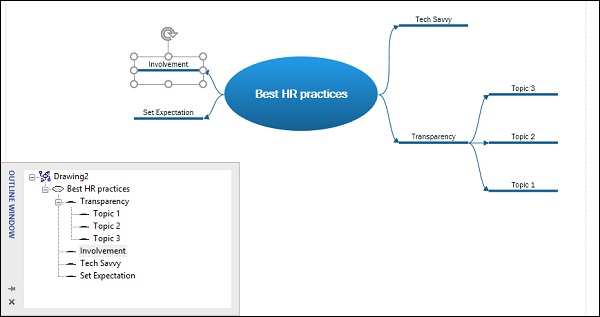
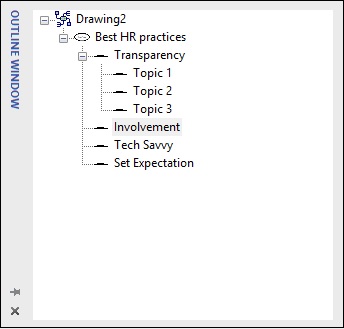
Subtopics can be edited simply by clicking the title of the subtopic and typing over it. You can also edit a subtopic by clicking its name twice in the Outline Window. The Outline Window represents the topic hierarchy of the brainstorm. The subtopics can be dragged by their connectors and placed anywhere on the canvas. They will always be linked to the Main topic shape.
Editing Topics in the Outline Window
The Outline Window makes it easy to edit the order of topics or topic names in the diagram. Any changes made in the Outline Window will be readily reflected in the actual diagram.
The Outline Window can be pinned or unpinned by clicking on the push pin icon to the bottom left of the window. This enables the window to auto-hide when not in use.
Topics can be edited by clicking twice on the topic name within the window and typing. The order of the topics can also be changed by clicking and dragging the topic from one subtopic into another. You can also right-click a topic and Move Up or Move Down to change the order of the topics.
To delete a topic, right-click a topic and then click Delete Topic or simply select a topic and press the Delete key on the keyboard.
Customizing Topic Shape, Style and Layout
You can customize the brainstorming diagram in a similar manner to other types of diagrams by changing the shape, style, and layout.
Customizing the Topic Shape
The shapes of individual topics can be customized into a variety of built-in shapes. Hold down the Shift key, select the topics one by none and in the Brainstorming tab, click Change Topic in the Arrange section.
This opens the Change Shape dialog box, which lists the shape types you can change to. Select a shape type and click OK.
Customizing the Topic Style
The brainstorming diagram can be customized by choosing different themes and theme variants. To choose a theme, go to the Design tab on the Ribbon and select a theme. You can also choose different variants for the theme by selecting a variant in the Variants section. The Variant section has a dropdown using which you can further customize the colors and effects such as drop shadows.
Customizing the Topic Layout
You can also customize the style of the diagram so that it looks more elegant and professional. In the Brainstorming tab, click Diagram Style to open the Brainstorming Style dialog box. You can choose from a variety of brainstorming styles and also a couple of mosaic options, which includes a mix of all the styles. Select a style and click Apply to see the result. Click OK to close the dialog box.
You can also customize the layout by clicking Layout in the Brainstorming tab. Select a layout from the Select a layout section. You can also choose the type of connector in the Connectors section. Select a layout and click Apply to see the result. Click OK to close the dialog box.
Sending Data to Word and Excel
You can send brainstorming data directly to Word and Excel and in fact, to any program that accepts XML input. Data in the Outline Window is exported to a Word or Excel document and is opened as an XML file. Any changes can be saved to this XML file, which can then be imported back into Visio.
To export data as an XML file, in the Manage section of the Brainstorming tab, click Export Data and select either Microsoft Word or Microsoft Excel. Note that these options are available, only if you have the 2016 versions of Word and Excel installed on your computer. For other versions of Word and Excel or for using any other compatible program, select To XML… instead.
For example, when you export the data to Excel, Visio automatically opens Excel once you save the XML file. In Excel, the data is organized into topic levels. For example, T1 represents the main topic, T1.1 represents the first subtopic under the main topic, T1.1.1. represents further subtopics under the subtopic and so on. You can add or remove topic hierarchies here and save the XML file, which can then be reimported back into Visio.
Creating and Configuring Timelines
Similar to org charts and brainstorming diagrams, you can also create timelines in Visio to depict a schedule or a series of events.
Creating a Timeline
To create a timeline, go to the New menu in the File tab and click Templates. Go to the Schedule category, click Timeline and then Create to create the timeline workspace. Since the timeline essentially measures time, units selection is inconsequential.
Configuring a Timeline Shape
Once the Timeline template is created, click and drag the Block timeline shape from the Shapes pane onto the canvas. This opens a Configure Timeline dialog box, where you can select the duration for the timeline and the Timescale. Click Ok.
It creates a timeline block with equal intervals between the selected dates.
Microsoft Visio — Adding Milestones
Milestones represent specific points in time during which an important event has occurred or is scheduled to occur. To add a milestone, click and drag the Line Milestone shape onto a chosen interval on the timeline. It need not be dropped exactly on a specific interval, since you can manually configure the exact date and time of the event.
When you drag the milestone onto the timeline, the Configure Milestone dialog box appears, where you can specify the exact date and time of the milestone along with a description of the event. You can also choose from the standard date formats to better represent the time and date. Click OK to create the milestone on the timeline. The milestone can be dragged along the timeline, and the date and time of the milestone will be updated accordingly.
Microsoft Visio — Dealing with Collisions
When adding many milestones, it is possible that the description text of the milestones will run into each other creating a messy look. It is possible to avoid collisions by changing the position of the milestone text.
If you happen to have a colliding text, simply grab the yellow end of the milestone and drag to a separate position, such as the bottom or higher up. You can also angle the yellow end by simply turning your mouse to a desired angle. The idea is to ensure that the text doesn’t collide and is represented as clearly as possible.
Once the yellow end is dragged and released, the Line milestone shape adjusts itself accordingly. You can also use the guides to glue the yellow ends of multiple milestones so that they are all aligned.
Adding Intervals to a Timeline
An interval denotes a block of time over the course of which an event occurs or is scheduled. To add an interval, drag the Block interval shape onto a location on the timeline. It opens the Configure Interval dialog box.
In the Configure Interval dialog box, you can select the duration of the interval, the date format and add a description. Click OK to add the interval to the timeline. Intervals can overlap milestones or other events. By formatting the interval shape to make it transparent, any other shape behind it can be made visible.
Adding Markers and Indicators to a Timeline
Markers and indicators can be used to denote specific events such as current date or elapsed time. Markers help to gain a perspective of where you currently stand with respect to your objectives in the current timeline.
To add a marker such as today’s date, drag the Today marker shape onto the timeline. You might want to adjust the yellow end to ensure that the marker text does not overlap with your milestone or other information. The Today marker moves as days’ progress, giving you a real-time perspective of your current status.
Another marker or indicator that can be useful is, Elapsed time. The Elapsed time indicator helps in gauging the time elapsed since the beginning of the timeline. It is indicated by a green rectangle along the duration of the elapsed time. Of course, just like any other shape, the color of the Elapsed time shape can be customized.
To show the elapsed time, drag the Elapsed time shape from the Shapes panel onto the timeline.
Microsoft Visio — Expanded Timelines
Expanded timelines are useful to get a zoomed in view of the finer aspects of a time period. For example, the expanded timeline can show many details of events in a particular period, which might not be visible on the main timeline.
To create an expanded timeline, drag the Expanded timeline shape onto the main timeline. This opens the familiar Configure timeline dialog box in which you can specify the start and finish dates. Since this is an expanded timeline, you can choose a lower scale such as weeks instead of months if you have a packed agenda for the week.
The expanded timeline is connected to the main timeline by means of two dotted connectors with yellow ends. The yellow ends can be used to move or change the orientation of the expanded timeline. You can also add milestone events to the expanded timeline. However, any event or interval added to the expanded timeline will not show up in the main timeline.
More expanded timelines can also be added on top of the existing expanded timelines.
Microsoft Visio — Formatting Timelines
You can apply the usual formatting techniques, such as themes and variants to a timeline. You can also select a background so that all successive timelines are created using the background template.
For example, in the Design tab, click Borders & Titles to set a professional looking border that includes a title header so that all pages in this timeline have the same background and header information.
It creates a Background page that is overlaid on all other pages in the document.
You can also change the timeline and other shapes to make it look like a block, cylinder, or a bracket by right-clicking the shape and selecting the corresponding type from the menu.
Microsoft Visio — Sharing Timelines
Timelines can be shared just like other Visio drawings as PDFs, Visio drawings, or graphic files. Visio also allows you to let others edit the drawing, if provided access. This happens via Microsoft OneDrive and you need to be signed in to Visio to access this feature.
To share a drawing for editing or review, go to the File menu and click Share. The document has to be first saved to the cloud, so click Save to Cloud to save the document to your personal or official OneDrive folder.
Once the document is saved to your OneDrive folder, you can invite others by sending them the link to the shared drawing. You can define whether people just get to view it or get to edit it as well. Your collaborators can then open the shared drawing in the cloud and open the drawing directly in their Visio installation.
Note − Visio Online is available to Office 365 customers who have Visio included in their cloud subscription. They can open and review the drawing online in their browsers; however, any changes to the drawing itself requires the users to have a local copy of Visio installed.
Microsoft Visio — Creating Calendars
You can create calendars in Visio to help you better organize and deliver information. To create a calendar, go to the New menu in the File tab and click Templates, then Schedule. In the Schedule category, click Multi week Task Calendar and then Create to create the calendar workspace. Depending on your version of Visio, you might just notice the template as Calendar.
You will see that there is a default calendar created. You can however, create your own calendar by dragging the Month shape onto an empty canvas. This opens the Configure dialog box, where you can specify the calendar month. Days of the month are automatically filled and the weekends are differentiated from the weekdays.
Adding Appointments to a Calendar
In this chapter, we will learn how to add appointments to a calendar.
Adding a Single Day Appointment
To add a single day appointment, click the Appointment shape in the Shapes pane and drag it on to a location in the calendar.
This opens the Configure dialog box, where you can enter the details of the appointment. Click OK to add the appointment on the prescribed date.
Adding a Multi-Day Appointment
Sometimes, appointments can stretch over multiple days. To add a multi-day appointment, click and drag the Multi-day event shape from the Shapes pane onto the calendar. This again opens a Configure dialog box, where you can specify details of the event along with the start and end dates. Once the multi-day appointment is created, you can drag the appointment handle to cover additional dates, if needed.
Microsoft Visio — Customizing the Calender
Calendars can be customized just like any other Visio drawing by applying themes and variants. Calendars can also be customized to show weather conditions or even moon phases.
To add a shape such as weather icons, scroll down the list of shapes in the Shapes pane and drag the desired icon onto a date in the calendar. You can align multiple shapes using the dynamic grids that appear when you try to align shapes next to each other.
You can also change the look and feel of the calendar by selecting themes and variants from the Design tab in the Ribbon.
Microsoft Visio — Adding Additional Months
Adding additional months is simple in Visio. To add an additional month, first create a new page by clicking the Insert Page symbol at the bottom of the screen or by pressing Shift+F11 to add a new page. You can rename the page by double-clicking on the page title.
Once you add a new page, create a new calendar by clicking and dragging the Month shape onto the new page. Configure the calendar for the new month.
To add additional months, simply create new pages by duplicating the current page. To duplicate a page, right-click the name of the page and click Duplicate. This creates duplicate of the current calendar page.
Now, simply reconfigure the calendar on the new page by going to the Calendar menu on the Ribbon and clicking Configure. When you change the month, you get a warning message that all scheduling information will be lost. Click OK to reconfigure the calendar on the new page.
Importing Calendars from Outlook
You can import existing calendars from Outlook directly into Visio. Note − To import Outlook data, you need to have Microsoft Outlook installed and configured with the same Microsoft account.
To import Outlook calendar data, go to the Calendar tab in the Ribbon and click Import Outlook Data.
Follow the steps in the wizard to import the calendar into Visio. You can import into an existing Visio calendar or create a new calendar with the Outlook data.
If you are importing into an existing Visio calendar, make sure to select the correct date range for importing, otherwise the data will not be shown in the Visio calendar.
Microsoft Visio — Creating a Floor Plan
Floor plans help to visualize the layout of a room or a floor in a building. Floor plans help architects to understand the placement of objects on the floor, and the design of doors and windows as well as other rooms.
Visio provides extensive assets for working with all kinds of floor plans and maps. To create a floor plan, go to the File menu and click New. In the Templates section, click Map and Floor Plans. Select Floor Plan from the list of available templates. Select the units of choice and click Create to create the floorplan.
You will notice that the options for floor plans are varied. The rulers now measure in feet instead of inches. The Shapes pane shows different shapes categorized under various headings for each component of the floor plan as shown in the following screenshot.
Scaling & Adding Structural Elements to a Floor Plan
Before adding elements to a floor plan, it is important to set the scale correctly. Setting the correct scale ensures that elements within the floor plan scale well according to the dimensions of the output paper.
To change the dimensions of the scale, click the Design tab and in the Page Setup section, click the downward facing arrow to open the Page Setup dialog box or press Shift+F5.
In the Page Setup dialog box, click the Drawing Scale tab to set a defined scale. You can use a predefined scale or enter a custom value. You can set the Page size (in measurement units) fields to the appropriate page size.
Click Apply to see the changes in the dimensions of the ruler and click OK to close the Page Setup dialog box.
Adding Dimensions to a Floor Plan
In architectural drawings, it is important to know the right measurements. Visio helps you make accurate measurements of the various shapes in your floor plan. For accurate dimensions, it is important to set the scale of the diagram correctly.
To see the dimension shapes, click Dimensioning – Architectural category in the Shapes pane to reveal the measurement tools. In this example, we will measure the vertical dimension of a wall.
Measure the Vertical Dimension of a Wall
To measure the vertical dimension, click and drag the Vertical shape in the Dimensioning – Architectural shape category and release it along the wall to be measured. You will see that the Vertical shape now has two yellow dots and two white dots.
The white dots are used to glue either end of the Vertical shape to the top and bottom length of the wall. The first yellow dot helps to separately visualize the Vertical shape from the actual wall. The second yellow dot helps to visualize the dimension value distinctly.
Glue the white dots to the top and bottom of the wall. Then, drag the yellow dots as needed to properly visualize the dimensions.
If the scaling is done correctly, you will see the exact dimensions of the desired shape.
Adding Furniture to a Floor Plan
You can add objects, such as furniture and office equipment to the floor plan to get a complete perspective. Visio provides a lot of shapes, which can scale according to the dimensions of the floor plan diagram.
To begin, we need to ensure that the required shapes for furniture and office equipment are visible in the Shapes pane. For this, click More Shapes in the Shapes pane and in the menu, go to Maps and Floor Plans, then to Building Plan.
In the submenu, make sure that Office Furniture and if needed, Office Equipment options are checked. You can then select the Office Furniture category in the Shapes pane to reveal a list of commonly used furniture.
You can now select the Office Furniture category in the Shapes pane to reveal a list of commonly used furniture. Drag the desired furniture shape into the floor plan and adjust the position as needed.
Make sure that the Shape Data pane is visible so that you can adjust the length and depth of the shape according to scale.
Adding Titles and Other Information
You can add titles and other text information to a floor plan to convey information, such as the scale of the diagram, title of the designing company, etc.
Adding Text to the Floor Plan
To add text information to the floor plan, select the Text Box from the Insert tab in the Ribbon and draw a text box in an empty area in the diagram.
The text box can be used to then enter information, such as the scale of the diagram, so that the reader gets a perspective of the real object size. The scale information can be derived from the Drawing Scale tab of the Page Setup dialog box in the Design tab.
Adding Page Titles and Backgrounds
You can also add page titles and backgrounds as a background page so that it is reflected across all pages of the diagram. In the following example, we will add a background title information. Go to the Design tab and in the Backgrounds section, click Borders & Titles. In the dropdown list of designs, select one that matches your theme.
It creates a background layer that applies to all pages of the document. Double-click the text area to zoom in and type the title of the document. You can also change the date, if needed and even apply themes and variants to the floor plan for a more sophisticated look.
Prototyping Software Using Wireframes
Wireframe diagrams are typically used by software developers to prototype the design of the software user interface. Wireframes help to visualize the position and behavior of various elements in the UI before the software can be deployed.
Opening the Wireframe Template
Click the File menu and then click New. In the Templates section, click the Software and Database category and scroll down to select the Wireframe Diagram template.
It opens the template for the Wireframe Diagram and the Shapes pane lists all the controls and buttons commonly used in a software UI as shown in the following screenshot.
Creating a Wireframe Dialog Box
In the following example, we will create a wireframe dialog box for the Print command. Click the Dialogs category in the Shapes pane and drag the Dialog form shape onto the canvas. You can resize the default shape as needed. Double-click the header text in the dialog box and type Print. We now have the outer frame for the dialog box.
Adding Elements and Controls to Wireframes
Once you have created an outline for a wireframe dialog box, you can add elements, such as text boxes and dropdown menus. We are creating a wireframe for a print dialog box, so the first dropdown menu should be one in which the user can select the printer from a list of printers.
Adding a Dropdown Menu
First drag the Label shape onto the dialog box. You can use horizontal and vertical guides to help you position the shape. Next, drag the Drop down shape onto the far right of the Label shape so that it glues to it. Double-click the Label shape to type the text. In this case, the name of the printer. Note − This is just a prototype to visualize a dialog box and the menus will not actually work.
Adding Other Buttons and Controls
Now that one dropdown menu is added, you can continue to add another dropdown menu to indicate the printer presets. You can also drag a box into the dialog box to designate a document preview area.
Most print dialog boxes will also have a page setup button to set various attributes of a page and it makes sense to include one here as well. To add a button, click the Controls category in the Shapes pane and from the list of shapes, drag the Button shape onto a suitable area on the page. Double-click the shape to enter text and name it, Page Setup.
You can also add backward and forward arrows as navigation guides under the document preview pane.
You can continue to add as many elements as you wish to get a feel for the prototype. Just remember not to clutter the wireframe with too many buttons.
Listing Shapes Used in Diagrams
Visio has robust auditing and inventory tools built-in that help to quickly review the various components of a diagram. You can extract information such as quantity of each of the shapes used in the diagram, properties of the shapes, text on the shapes, etc. as a table which can help you quickly review and ensure that the document is according to the prescribed specifications. In this example, we will extract a sample report that shows the names of the shapes used and their quantity.
To get an inventory of the document, go to the Review tab on the Ribbon and in the Reports section, click Shape Reports.
It opens the Reports dialog box. You can create a new report definition by clicking New… or modify an existing report style by clicking Modify…
After selecting the required features of the reports, click Run… to start creating the report.
After the report is compiled, the Run Report dialog box opens, which allows to select the format of the report. Generally, it is preferred to export the report as an Excel file to enable easier sorting of data fields but you also have the choice of exporting as HTML, XML, or a Visio shape. Select Copy of report definition in the Save report with section to save a copy of the report within the document and click OK.
Visio creates a report table detailing the features we selected. In this case, the name of the shape and quantity. If you have chosen to save the report as an Excel file in the previous step, clicking the report will open an Excel window within Visio where you can work with the contents of the report.
Представьте ситуацию. Нужно составить график, блок-схему, чертеж или диаграмму. Для этого используется специализированное ПО. Итак, что такое Visio project рассмотрим в сегодняшней статье
Содержание
- Что это за программа
- Особенности
- Что может программа
- Как пользоваться
- Начало работы
- Вывод
Что это за программа
Visio это программа для создания диаграмм, визуализации данных и моделирования процессов. В приложении разработчики добавили шаблоны позволяющие создавать диаграммы любого уровня сложности. Реализована поддержка импорта собственных форм в чертежи. Рассмотрим подробнее, что такое Визио.
Особенности
Программа использует при создании схем векторную графику вместо растровой. Поэтому созданные формы и чертежи не теряют четкость в зависимости от разрешения. Увеличивайте или уменьшайте размеры без потери качества. Это делает Visio удобным инструментом для рисования.
Работать в приложении сможет любой пользователь. Интерфейс Visio простой и понятный. Созданные проекты сохраняются в формате «VSD» разработанным для создания графиков и чертежей на профессиональном уровне. С форматом работают проектировщики, разработчики игр. С 2013 года он изменил расширение на «VSDX». Новый формат обеспечивает лучшее сжатие.
Что может программа
Визио поддерживает все современные стандарты бизнес-моделирования: BPMN (моделирования и управление бизнес-процессами), UML (универсальный язык создания бизнес-процессов).
Основные возможности программы:
- Создавайте чертежи в один клик мышкой, изменяйте визуальное оформление схем, добавляйте эффекты;
- Добавление комментариев к любой части чертежа;
- Импорт и экспорт данных между программами входящими в пакет Office;
- Совместная работа над проектом. При помощи обозревателя настройте общий доступ к просмотру схем. Установив SharePoint Server и Lync 2013, добавится возможность комментирования работы и обмена сообщениями;
- Разработчики добавили правила для проверки правильности введенных данных. При необходимости правила задайте самостоятельно;
- Поддержка таких функций Word и Excel как настройки шрифта и цвета;
- Интеграция с другими продуктами Microsoft, например Project.
Как пользоваться
Итак, программа Visio где скачать? Перейдите ссылке: https://www.microsoft.com/ru-ru/microsoft-365/Visio/microsoft-Visio-plans-and-pricing-compare-Visio-options?market=ru.
Программа платная. При оплате выберите тарифный план. Перед покупкой попробуйте возможности программы в течении бесплатного тридцатидневного тестового периода.
Начало работы
После запуска откроется стартовая страница, где отобразятся недавно открытые документы и избранные шаблоны. Их также можно искать с начального экрана на сайте Microsoft.
Интерфейс шаблона документа напоминает такие программы из пакета Office как Word или Excel.
На левой панели посмотрите какие фигуры добавить в шаблон. Добавление происходит путем перетаскивания. Можно искать другие фигуры онлайн, используя встроенный инструмент поиска.
После добавления фигуры, отобразятся направляющие для выравнивания объекта.
Читайте также:
- Софт для создания дизайна интерьера;
- Создаем блок-схему в Word;
- Как сделать диаграмму в Excel.
Вывод
Visio это удобный инструмент для создания схем, диаграмм, графиков. Работать с программой сможет даже неподготовленный пользователь.
Содержание
- Создание нового документа
- Добавление и редактирование фигуры
- Соединение фигур
- Изменение свойств фигур и текста
- Вставка объектов
- Настройки отображения
- Связка объектов
- Анализ созданной схемы
- Исправление ошибок
- Настройка страницы
- Достоинства
- Недостатки
- Скачать Microsoft Visio
- Вопросы и ответы
Создание схем и диаграмм вручную дело непростое и занимает длительное время. Гораздо проще выполнять эти задачи с помощью специальных программ. Их в интернете сейчас достаточно.
Microsoft Visio — современный векторный редактор для создания диаграмм и схем. Благодаря своей многофункциональности подходит как профессионалам, которые ежедневно создают сложнейшие схемы, так и обычным пользователям. Предлагаю рассмотреть, основные функции инструмента.
Создание нового документа
Созданию нового документа в программе уделяется особое внимание. Делается это несколькими способами:
1. Можно выбрать шаблон, который наиболее подходит пользователю.
2. При помощи категории шаблонов.
3. Можно отыскать необходимые на сайте «Ofice.com». Там они также разбиты по категориям. Здесь же есть возможность воспользоваться поиском и найти конкретный шаблон.
4. Программа Microsoft Visio взаимодействует с другими текстовыми редакторами, поэтому схемы и диаграммы можно выбирать из других документов.
5. И наконец, можно создать совершенно пустой документ без образцов и набора инструментов, которые создаются потом. Этот способ создания документов подходит пользователям, которые уже более-менее знакомы с программой. Новичкам лучше начинать с простых схем.
Добавление и редактирование фигуры
Фигуры являются главной составляющей любой схемы. Добавить их можно простым перетягиванием в рабочую область.
Размер легко меняется мышью. При помощи панели для редактирования, можно изменять различные свойства фигуры, например изменить ее цвет. Эта панель очень похожа на Microsoft Exсel и Word.
Соединение фигур
Различные фигуры можно соединять между собой, делается это в ручном или автоматическом режиме.
Изменение свойств фигур и текста
При помощи специального набора инструментов можно изменять внешний вид фигуры. Выравнивать, менять цвета и обводку. Здесь же добавляется и редактируется текст и его внешний вид.
Вставка объектов
В программе Microsoft Visio помимо стандартных объектов вставляются и другие: рисунки, чертежи, диаграммы и т.д. Для них можно сделать выноску или всплывающую подсказку.
Настройки отображения
Для удобства пользователя или в зависимости от задачи, отображение своего листа, цветовую схему самих объектов, фон можно изменять. Еще можно добавлять различные рамочки.
Связка объектов
Очень удобной функцией является добавление к схемам различных объектов, которые можно связывать с фигурами. Это могут быть документы из внешних источников, рисунки или легенды (пояснения к схемам).
Анализ созданной схемы
При помощи встроенных инструментов созданную схему можно проанализировать на соответствие со всеми требованиями.
Исправление ошибок
Эта функция содержит набор инструментов с помощью которых текст проверяется на ошибки. При необходимости можно воспользоваться встроенными справочниками, переводчиком или изменить язык.
Настройка страницы
Отображение созданных документов также легко изменить. Можно настраивать масштаб, делать разрыв страниц, отобразить окна удобным образом и другое.
После рассмотрения данной программы у меня остались положительные впечатления. Продукт в какой-то степени напоминает другие редакторы Microsoft поэтому никаких особых затруднений в работе не вызывает.
Достоинства
Недостатки
C недавних пор скачать Visio просто так не получится, поскольку Microsoft изменила политику своих продаж на территории некоторых стран. В связи с этим приложение можно либо купить, используя ссылку ниже, либо самостоятельно обратиться к розничному продавцу.
Скачать Microsoft Visio
Загрузить последнюю версию программы с официального сайта
Похожие программы и статьи:
Для чего нужна программа Визио
Рейтинг:
3.35 из 5
(20 голосов)
Система: Windows 7, 8, 8.1, 10, XP, Vista
Категория: Обзоры программ
Размер: 3 MB
Язык: Русский
Версия: 2016
Microsoft Visio — полнофункциональный редактор векторной графики, входящий в состав офисного пакета от компании Microsoft.


