
IELTS Academic Writing Task 1 Vocabulary: Слова и выражения для IELTS графиков: Line graphs, Bar charts, Tables, Pie charts
Слова и выражения для IELTS графиков на балл 7.0-9.0.
Подходят для:
Line graphs
Bar charts
Tables
Pie charts
Зазубривать все слова не нужно. Выбирайте те, которые хотите использовать в своих ответах и те, которые реально можете запомнить. Всё это IELTS Academic Writing Vocabulary.
Супер крутые слова на 8.0-9.0 помечены жирным шрифтом
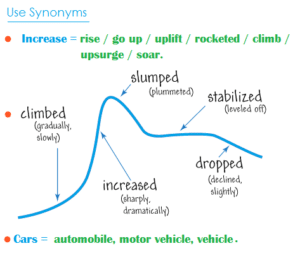
ГЛАГОЛЫ
 |
Drop Show a downward trend Plummet Plunge Halve (уменьшиться в два раза) Dip |
 |
Increase Surge Grow Show an upward trend Double (антоним halve) Triple (вырасти в 3 раза) Rocket Shoot up Soar (=surge) Recover |
|
Fluctuate |
Reach a peak, Peak at …% |


ГЛАГОЛ + НАРЕЧИЕ
Теперь к глаголам добавляем + наречия, т.е.«как?»
- Significantly
- Remarkably
- Dramatically
- Sharply
- Gradually
- Steadily
- Marginally (=slightly)
- Negligibly (=very slightly)
Decrease Considerably
Decline Slightly
Fall Gradually
Drop Steadily
Rise Sharply
Increase Dramatically
ПРИЛАГАТЕЛЬНОЕ + СУЩЕСТВИТЕЛЬНОЕ
a dramatic increase
a sharp fall — There was a sharp rise in the percentage of …
a gradual decline
Как описывать тренды?
ПОДЛЕЖАЩЕЕ + ГЛАГОЛ + НАРЕЧИЕ (КАК?)
Prices rose considerably
The percentage decreased sharply
There is + a + прилагательное + существительное + in the …
There was a negligible rise in the sales …
There will be a considerable fall in the number of people
Полезные выражения на Балл 8 — 9
hit the highest point
hit the lowest point
hit a trough (= a low point/antonym of a peak)
show some fluctuation
remained stable
reached a plateau
the figure levelled off in the last two years
flattened out (выровнялся)
despite the initial rise, the figures …
regarding the percentage of …, it fell to …
despite falling to just under 40%, the figure then rose to…
as opposed to …
… respectively (Cookies and cakes were the second most popular products with nearly 120 and 100 of these snacks sold respectively)
the percentage of …
the proportion of …
the figures for…were fairly similar at …%
the number of…
the amount of…
ПРЕДЛОГИ
By 1978,
Over a twelve-year period
In the last year
Over the next three years,
In the following year,
Over the period in question
At the beginning/end of the period
Throughout the period in question
In the first half of the decade …
An Increase of 30%.
Decreased by 15%.
Rose sharply over a period of 10 years.
Цифры
Ещё крутые слова для перефразирования цифр на 8 – 9.0
2% = a very small proportion of
2-10% = a mere 3 percent OR a mere 5 percent of
16% = a small minority
20% = a fifth
24% = almost a quarter
25% = a quarter
26% = roughly one quarter
32% = nearly one-third
35% = more than a third
49% = just under a half
50% = a half
51% = just over a half
55% = more than half
70% = a large proportion of
72% = a significant majority of
73% = nearly three quarters
76% = just over three-quarters
Добавляем вот эти слова к цифрам
Approximately
Nearly
Roughly
Almost
Just over
Just under
Just around
Just about
Just below
A little more than
A little less than
Например:
Just under 60 percent of people in Canada went to fast food outlets in 2009. (в графике написано 58%, мы округляем и пишем just under 60%).
Сравнения
Какие крутые фразы использовать для сравнения?
IELTS grammar + vocabulary
… by far the most popular item / product / language …
… the least popular product was …
… much more popular
more languages …
fewer students …
the highest percentage of/the lowest proportion of
… as popular as …
… not as popular as …
… not quite/nearly as expensive as …
… did not sell as many computers as …
… is three times higher than …
… twice as many _____ as …
Например:
The number of intermediate students is three times higher than the number of students in elementary classes, at 80 and 77 students respectively.
There were twice as many students in the …as students in the …
Полный курс по IELTS Writing Academic
14 уроков / 7+ часов
- Как писать ВСЕ типы эссе
- Как описывать ВСЕ типы графиков
- Как структурировать текст по абзацам
- Что писать в каждом параграфе
- Какую грамматику использовать
- Какие слова использовать
- Как эффективно связывать свои идеи
- Что нужно делать, чтобы получить высокий балл
Дополнительно: Гайд по подготовке к IELTS Writing Task
Writing Task 1 (Графики) — 64 стр., PDF
Writing Task 2 (Эссе) — 54 стр., PDF

Описание графиков на английском — это первое письменное задание в экзамене IELTS. В этой статье вы найдете нужную английскую лексику для описания графиков и диаграмм с примерами употребления.
Types of graphs — Виды графиков
Line graph — линейный график.
Pie charts — круговые диаграммы.
Maps — карты.
Process diagram — технологическая схема.
Bar chart — столбчатая диаграмма.
Table — таблица.
Diagram — диаграмма.
Introduction — Вступление
The graph (table / pie chart / bar chart / diagram)
gives information about/on … — дает информацию о…
provides information about/on … — предоставляет информацию о…
shows … — показывает…
illustrates … — иллюстрирует…
compares … — сравнивает…
explains why … — объясняет, почему…
describes … — описывает…
draws the conclusion of (a survey) … — заключает / делает вывод (из опроса)…
depicts… — изображает…
summarizes… — резюмирует…
Data introduction — Введение данных
The number of…consisted of… — Число чего-то состояло из…
The amount of…account for… — Сумма/количество чего-то приходится на…
NB! Используйте number of только с исчисляемыми существительными, а amount of — с неисчисляемыми.
The proportion of …totals… — Доля чего-то в совокупности составляет…
The figure for …represented / constitutes / comprise… — Данные чего-то представлены / составляют / включают.
Nouns — Существительные
A rise (of) — рост.
An increase (of) — увеличение.
A growth (of) — рост.
A surge (of) — всплеск.
A fall (in) — падение.
A decrease (in) — уменьшение.
A decline (in) — снижение.
A fluctuation (of) — колебание.
A variation (in) — изменчивость.
Verbs — Глаголы
To rocket — взмывать / резко подниматься.
To soar — взлетать.
To decline — сокращаться.
To dip — опускаться.
To plummet — резко падать.
To vary — меняться.
To fluctuate — колебаться.

NB! Все вышеперечисленные существительные в английском языке используются как глаголы.
Adjectives — Прилагательные
Sharp — острый.
Sudden — внезапный.
Rapid — быстрый.
Abrupt — резкий.
Dramatic — существенный.
Steep — крутой.
Significant — значительный.
Considerable — весомый.
Slight — незначительный.
Gradual — постепенный.
Steady — устойчивый.
Consistent — последовательный.
Marginal — пограничный.
NB! Все вышеуказанные прилагательные можно преобразовать в наречия, добавив -ly. Переходите на эту статью, чтобы узнать, как это сделать по правилам английской грамматики.
Пример описания графика на английском для экзамена IELTS:

The bar chart shows the proportion of UK students and international students achieving second class degrees or higher in seven different subjects at a university in the UK.
На столбчатой диаграмме показана доля британских и иностранных студентов, получивших диплом второй степени или выше по семи различным предметам в университете Великобритании.
The flow chart shows what typically occurs as a consequence of deforestation.
На блок-схеме показано, что обычно происходит в результате вырубки лесов.
Overall, the diagram shows that there is a wide variation in writing systems around the world.
В целом диаграмма показывает, что в мире существует множество разнообразных систем письма.
The average length of the advertisement varied from a low 15 seconds for clothing to a high 46 for public service advertisements.
Средняя продолжительность рекламы варьировалась от 15 секунд для одежды до 46 секунд для рекламы общественных услуг.
According to the graph, economic growth began at a modest 1 per cent, rose gradually, then remained more or less steady at about 2 per cent until 2012.
Согласно диаграмме, экономический рост начался с малого 1%, постепенно повышался, а затем оставался более или менее стабильным на уровне около 2% до 2012 года.
It grew sharply and peaked at nearly 7 per cent in 2017.
Он резко вырос и достиг пика почти на 7% в 2017 г.
Узнайте, где сейчас можно сдать международные экзамены IELTS и TOEFL, перейдя по ссылке. (Информация на 2022 год)
Оставить комментарий
Для комментирования необходимо войти через ![]() Вконтакте
Вконтакте


When it comes to IELTS writing task 1, 25% of your marks are for the range of words you use. That means IELTS graph vocabulary is a very important component to review as you prepare for the Writing Task 1. You can start by checking out this IELTS writing task 1 vocabulary guide. And below, I’ll provide an overview of words and useful phrases to incorporate into your writing so that you can get top marks on the lexical resource category and a high band score overall. Basically, the better your IELTS writing chart vocabulary, the higher score you’ll get. It’s not hard, but there is a clear formula to doing well.
How to Use IELTS Graph Vocabulary in Writing Task 1
Because IELTS writing task 1 involves describing a graph or chart of some type, it will help to have a handle on IELTS writing chart vocabulary — words and phrases that help you write about the information on the chart or graph.
How are graphs described in IELTS? Let’s walk through the best vocabulary for the task, step by step.

1. Start With Introduction Phrases
Often ESL students start their essay with ‘The graph shows…’. While this is fine, the verb ‘shows’ could be replaced by a more exciting and high-level vocabulary word. Here are four different prompts to start your essay:
- The graph illustrates the trends in…
- The graph reveals information about the changes in…
- The graph provides the differences between…
- The graph presents how X has changed over a period of…
- DO NOT write the word below or above in your introduction. i.e. The graph above/below shows…
2. Add Suitable Adverbs
Adverbs help express a relation of place, time, circumstance, manner, cause, and degree, and can greatly add some color and interest to your writing as well as show off your range of vocabulary. Unlike adjectives (which describe nouns), adverbs describe verbs, or actions. Here’s a great list of adverbs to use:
| Adverb | Meaning |
|---|---|
| Approximately | Almost, but not completely exact; roughly |
| Dramatically | By a quick and large amount |
| Erratically | In a way that is uneven or irregular |
| Gradually | By slow degrees |
| Markedly | Noticeably, significantly |
| Significantly | In a way that is worthy of attention; importantly |
| Slightly | To a small degree |
| Slowly | At a slow speed, not quickly |
| Steadily | In a regular or even way |
3. Use Appropriate Synonyms
Again using a variety of nouns and verbs for words like rise and fall will help increase your overall score. Here are some suggestions:
| Rise (Noun) | Rise (Verb) | Fall (Verb) | Fall (Noun) | Fluctuate (Verb) |
|---|---|---|---|---|
| Climb | Increase | Collapse | Decline | Be erratic |
| Increase | Climb | Decline | Decrease | Be fitful |
| Improve | Leap | Decrease | Deterioration | Vary |
| Jump | Pick up | Deteriorate | Dip | Rise and fall |
| Leap | Surge | Dip | Drop | |
| Move upward | Growth | Drive | Plunge | |
| Rocket | Drop | Freefall | ||
| Skyrocket | Go down | Slide | ||
| Soar | Plummet | Slip | ||
| Shoot up | Plunge | Dive | ||
| Pick up | Slide | Reduction | ||
| Surge | Slip (back) | Slump | ||
| Recover | Slump | |||
| Take a nosedive |
4. Add Time Phrases
Below are some excellent time phrases with sentence examples:
| Time Phrase | Example Sentence |
|---|---|
| Between…and | Between 1982 and 1992 there was a steady drop. |
| From…to | From 1992 to 1996 there was a dramatic increase. |
| In the year… | In the year 2020, unemployment spiked. |
| During/over the period | During the 1980s, trends stayed consistent. |
| over the latter half of the year/century/decade/period | Over the latter half of the century, more women entered the workforce. |
| over the next/past/previous… | Over the previous year, work-from-home rates sharply increased. |
| days/weeks/months/years/decades | For several weeks, stock prices have remained stable. |
| by… | By 1997, market growth had stabilized. |
Using IELTS Graph Vocabulary in a Model Essay
Look at the sample IELTS writing Task 1 graphs on the British Council website. Below is my model answer with useful words in bold:
The bar charts illustrate the trends in computer ownership, with a further classification by level of education, from 2002 to 2010.
Over the period, it can be observed that there was a significant surge in the percentage of the population that owned a computer. In the year 2002, only about 58% of the population owned a computer, whereas by 2010, this gradually increased to where over three-quarters of individuals had a home computer.
Looking at the information by level of education reveals that higher levels of education correspond to higher levels of computer ownership in both of those years. In 2002, a significantly low percentage of the population who did not finish high school had a computer, but this figure skyrocketed by 2010, going from 15% to over 40%. There were also dramatic climbs, of approximately 30 percentage points, for those with a high school diploma or an unfinished college education (reaching 65% and 85%, respectively, in 2010).
To conclude, during the last decade, there has been a substantial growth in computer ownership across all educational levels.
Other IELTS Graph Vocabulary Resources
Keep in mind that IELTS writing task 1 may contain one of several different types of infographic: a bar chart, pie chart, line graph, diagram, etc. Regardless of the type, you’ll want to have a good handle on IELTS writing chart vocabulary.
For more specific guides to the different kinds of graphs, charts, and graphics you may find on IELTS writing task 1, check out the following resources:
- How to Describe a Bar Chart
- How to Describe a Pie Chart
- How to Describe a Map
- How to Describe a Process Diagram
You can also check out Magoosh’s IELTS linking words PDF for transitions between ideas. Hopefully you’ll start to incorporate some of these key words and phrases, as well as the above suggestions, in your IELTS Task 1 Writing. If you still don’t feel comfortable doing so, consider dedicating more time to your IELTS studies with Magoosh’s fun, engaging IELTS prep for extra practice.
-

Eliot Friesen-Meyers is the Senior Curriculum Manager for Magoosh IELTS and TOEFL. He attended Goshen College (B.A.), New York University (M.A.), and Harvard University (M.T.S.), gaining experience and skills in curriculum development, ESOL instruction, online teaching and learning, and IELTS and TOEFL test prep education. Eliot’s teaching career started with Literacy Americorps in Pittsburgh, Pennsylvania, and later, taught ESL programs at Northeastern University, University of California-Irvine, and Harold Washington College. Eliot was also a speaker at the 2019 TESOL International Conference. With over 10 years of experience, he understands the challenges students face and loves helping them overcome those challenges. Come join Eliot on Youtube, Facebook, and Instagram.
Recent blog posts
Complete Guide to IELTS Writing Task 1
Complete Guide to IELTS Writing Task 2View all posts
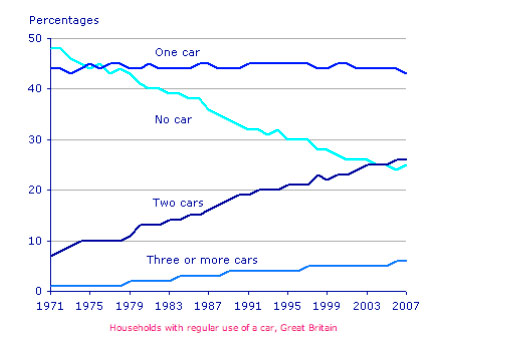
Essential vocabulary to describe an IELTS writing task 1 line graph. To get a good band score you must show the examiner a range of different words to show upward and downward trends as well as key features. IELTS line graphs show change over a period of time and you must vary your language and vocabulary when you write your report.
This page contains:
- Verbs & Nouns
- Practice Exercise
- Adverbs & Adjectives
- Time Phrases
- Useful link to model answers and more tips for line graphs
1. IELTS Line Graph Verbs & Nouns
Below are lists of verbs and nouns that can be used to describe a line graph in IELTS writing task 1.
Upward trend
- rise / a rise
- increase / an increase
- climb / a climb
- grow / a growth
- go up
Downward trend
- decrease / a decrease
- drop / a drop
- fall / a fall
- decline / a decline
Other vocabulary
- fluctuate / a fluctuation
- dip / a dip
- remain steady
- remain stable
- remain unchanged
- level off
- peak at
- reach a peak of
- hit a high of
- hit a low of
- bottom out
- plateau
Mistakes when using words will affect your band score. This includes spelling.
- Band 6 = some vocabulary errors.
- Band 7 = few vocabulary errors.
2. Practice with Nouns and Verbs
Fill in the gaps using the vocabulary above. Make sure you adapt the words to make the sentences grammatically correct. The completed paragraph below is an example of a body paragraph for a line graph.

- Source: IELTS Liz
- Notice: It is uncommon to be given only one line as a task unless it is combined with another chart or table. The above graph is for practising vocabulary.
Questions 1-5
Fill in the gaps with the correct vocabulary. You should use no more than two words for each gap.
The number of reported cases of influenza began at 40 in 1985 after which the figure (1). …………………… steadily to reach about 55 in 1987. In 1988, there was a (2) …………. in the number to below 50 before (3) ……………. to reach a (4) ………… (5) ……….. approximately 75 in 1991. After that date, the figure dropped to about 55 in the final year.
Answers
Click below to reveal the answers:
Answers
- rose / increased / climbed / grew / went up
- a fall / a decline / a drop / a dip / a decrease
- climbing / increasing / rising / going up / growing
- peak
- of
3. Line Graph Adverbs & Adjectives
Below are useful adverbs and adjectives to describe change.
Adverbs: steadily, gradually, sharply, rapidly, steeply, slightly, dramatically, significantly, considerably
Adjectives: steady, gradual, sharp, rapid, steep, slight, dramatic, significant, considerable
Sentences:
- The number of cases of influenza increased steadily from 40 to 55 in the first three years.
- There was a steady rise in the number of cases of influenza to reach 55 in 1987 from 40 in the first year.
4. Time Expressions
IELTS line graphs show change over a period of time. Below are some expressions to help you describe the passing of time without too much repetition.
Time phrases:
- over the next three days
- three days later
- in the following three days
- the next three days show
- over the period
- from…to… / between … and…
- the last year
- the final year
- the first year
- at the beginning of the period
- at the end of the period
5. Recommended Links for more IELTS Writing Task 1
IELTS Writing Task 1: Tips, Model Answers and More
Full Model Answer and Guidelines for IELTS Line Graph
All other free materials are found on the RED BAR at the top of this site.
All the best
Liz
Subscribe for Free to get New Post by Email
Из чего состоит статья:
1. Виды графиков Academic IELTS Writing Task 1.
2. Какие выражения, грамматические обороты нужно знать для описания графиков.
3. Алгоритм написания графика IELTS Writing Task 1.
4. Составляющие описания графика.
У кандидата 20 минут на то, чтобы взглянуть на график, понять там, самое основное, описать это и проверить. Объем 170-200 слов.
Времени, на самом деле очень мало, поэтому студент следует четкому алгоритму, где, что писать, на что обращать внимание.
Первое с чем, нужно познакомиться при подготовке к Academic IELTS Task 1 — это виды графиков.
Виды графиков:
1. Line graph
2. Tables
3. Bar chart
4. Pie charts
5. Process
6. Life cycle
7. Mixed type:
7.1. line graph + table
7.2. pie chart and line graph
8. Maps
Из чего состоит описание графика IELTS Writing Task 1
Первый параграф — Introduction
Кандидат описывает, что это за график, указывает период, единицы исчисления.
Какая лексика используется Introductory Verbs
The graph indicates
This graph shows
The graph compares changes
This graph provides data about
Совет:
Вступление — это перефразированное задание. Фактически, самое главное во вступлении — уметь переписать другими словами задание.
Пример Introduction
The graphs provide information about the amount of money British parents spent on their children’s sports over the period from 2010 to 2015 as well as the number of children who took part in four particular sports over the same time span.
Второй параграф — Overall
Обычно вступления достаточно даже на 6.5 баллов. Но если студент хочет высокий бал 7- 8, тогда рекомендуется добавить основные тенденции по графику, не вникая в детали.
Пример Overall
Overall, the 7 pm show usually received the most views, although the 10.30 pm show was watched more in October. Furthermore, during October the 7 pm show plummeted in viewer numbers, passing the 2 pm show to become the least-watched version of the news.
Ставя основную идею в начало, тем самым мы ясно даем читателю понять, о чем будет все остальное.
Переходим к деталям по основным элементам или тенденциям и каждой уделяем по параграфу.
Третий и четвертый параграф — Body Paragraphs
В Body Paragraphs описываются детали по каждой выбранной составляющей графика. На это уходит чаще всего 2 параграфа, иногда 3.
Лучше посвятить параграф только про какой-то одной составляющей, описывать детали, когда что выросло, когда что упало и т.д.
Начинаем с самой «яркой» составляющей, того, что больше всего бросается в глаза.
Пример Body Paragraph
At the beginning of the year, the 7 pm show received almost 4 million viewers, which was the highest number for any show throughout the period. After that, viewer numbers fluttered with an overall downward trend, and they reached a low in October of around 1.8 million. At this time, the 10.30 pm news hit its peak of just over 5 m viewers after only having around 300000 when it began at the start of April. However, while the 7 pm news ended the period at its October level, the 10.30 pm news dropped sharply to slightly over 1 m viewers.
Важно выучить слова для описания графиков, а также базу синонимов.
Какие слова нужно знать для описания графиков
1. Изучить какие глаголы используется.
Например
increase, rise, go up, etc.
2. Научиться соединять глаголы с наречиями.
Например
Rise rapidly,
Drop suddenly
Increase dramatically
Decrease steadily
etc.
3. Научиться сочетать глагол и существительное.
Например
Еmployment figures dropped…
The number of smartphones in use has risen…
4. Научить употреблять существительное c прилагательным
Например: rise, increase, growth, surge, fall, dip, etc.
There was a significant rise…
There was a dramatic fall…
Советы по лексике для описания графиков IELTS Writing Task 1
1. Использовать синонимы, слова не должны повторяться, особенно это касается прилагательных и глаголов.
the number of — in the number of — figure
rise — increase — go up
steady – gradually
consumer – customer
information – data
valued — estimated
2. Использовать high-level лексику, если задача получить 8 или 9 баллов.
great changes occurred
with … numbers quadruple
to put in more precise terms
3. Использовать при описании тенденций не только глаголы, но интересные прилагательные и наречия.
negligible
virtually
staggeringly
СОВЕТ
Кроме лексики, важно использовать более сложную грамматику, если задача получить высокий бал.
4. Использовать слова связки для описания графиков IELTS Writing Task 1.
Чтобы структурировать свое высказывание, сделать его более логичным используются вводные выражения.
Начать можно со слов:
According to the chart/data/information.
Чтобы логически выстроить текст, желательно применять слова:
Firstly, secondly, finally, etc.
Добавляя информацию, можно применить выражения:
Apart from
Also
As well as
Along with
Moreover
Если показатели значительно отличаются, можно использовать:
As apposed to
In contrast to
Unlike
However
Contrary
5. Использовать наречия с периодами.
over the period…
Также важно использовать сложную грамматику и пунктуацию, но об этом будет рассказано в другой статье.
Алгоритм описания графика IELTS Writing Task 1
Самое важное — выбрать два три основных компонента из графика. Не следует описывать все составляющие графика.
Чтобы развить определенную скорость и уложиться в отведенное время, необходимо наработать навык рассматривая любой графики, видеть основной сюжет.
Очень часто за графиком отображает какую-то «историю», тут что-то повышается, тут что-то понижается, а что-то осталось почти на том же уровне. Вот именно на это студент нацеливает свои основные усилия.
СОВЕТ
Лучше не описывать сразу графики, а изучить описание 15-20 графиков, изучить, какие основные 2-3 составляющие рассматриваются в каждом графике, какая основная «история», «сюжет» происходящего на графике. И только потом приступать к самостоятельному описанию.
Взять пример, показать основные тренды
На самом экзамене IELTS для анализа и формирования идеи, о чем писать уйдет 5-6 минут. Но это основные 5-6 минут из данных 20. Если запороть эту часть, вся дальнейшая работа будет практически напрасной в плане получения хорошего бала за описание графика IELTS Test.
Еще раз повторюсь, у студента задача, успеть все выполнить, включить все необходимые на хороший бал составляющие. Поэтому должен быть четкий алгоритм.
Обязательно следует изучить лексику и набивать руку, писать, писать графики, это единственный способ научиться это делать.
Данное задание тестирует студента на то, сможет ли он посмотреть на какую-либо инфо графику и перенести ее в слова так, чтоб не видя график вообще экзаменатор смог понять, о чем он был.

Репетитор Английского языка