
Data from SAP to MS Office Applications

Using the connection SAP with MS Office, users spreads data from SAP application to right within Microsoft Office desktop applications, including Excel, Outlook, Word and Power point.
With the SAP-MS Office connectivity, end-users can interact with SAP transactions directly within their Excel spreadsheet, their Outlook e-mail screen, and their Word documents and on their Power point presentations.
Here we have a simple application to connect SAP with MS-office tool’s Excel.
But before that……Why? How? And Use!
Why Data from SAP to MS Office Applications

In spite of large moneys in SAP, most business users continue to be unsatisfied with it because data from SAP is not easily accessible in their favorite desktop productivity tools — Microsoft Excel, Microsoft Outlook and Microsoft Word. Since Microsoft Office Applications are not connected to SAP, users are forced to
- Use error-prone cut-copy-paste to populate their Excel spreadsheets.
- Switch screens from Outlook to gather data and take decisions as they respond to e-mails.
- Manually update data from Excel Spreadsheets to enterprise applications.
Benefits of Data from SAP to Microsoft Office Applications
SAP-MS Office Connectivity extends data from SAP to Microsoft Excel, Microsoft Outlook and Microsoft Word using a SOA based Information Delivery Server and Microsoft Office Add-ins, and provides the following benefits
- Eliminates cut-and-paste based data collecting mechanism from SAP to Microsoft Excel.
- Enables users to get real-time data from SAP within Excel with a single-click Refresh.
- Enables users to query and update SAP transactions from within Outlook screens.
- Allows the users to update SAP from within Excel, Outlook and Word.
- Avoids any data-integrity issues with copying and reduces compliance issues.
Who Benefits
- Production and Logistics Managers who want to create Excel reports from latest SAP data.
- Managers who want to track projects and status automatically as they receive status e-mails.
- Analysts who want to combine data from SAP and other enterprise data stores for budgeting purposes.
Example:

Here is the main part comes up. We shall take simple scenario for SAP with MS Excel connectivity. So let’s begin!!
Just before start, I would like to give little overview on what we are actually going to do. So, here are the scenarios!!
Excel File Scenarios
- Create a MS excel file for user input.
- Create user interface in excel sheet to input data for the customer master and output cells.
- Apply VB code to make connection with SAP.
- Read the input data for customer master from the excel file sheet.
- Fetch data from SAP using connection code from SAP.
- Display output within excel sheet itself.
SAP Scenarios
- Create a function module in ABAP that is “Remote Enabled”.
- Create IMPORT, EXPORT and TABLES parameters as per requirement from MS excel.
- Write logic to display customer master details based on input from Excel file.
- Activate the function module.
Well……………“A picture says thousand words”. So, let’s begin!
MS Excel – User Interface
First of all, lets create MS excel file with customer master input. We shall create simple selection screen for user input.

Well……filling cell values are simple here but how to add buttons (Get Address and Reset Output) here? This was also new in my case since new version of MS office.
Just follow following steps for this:
Click MS office button and select “Excel Options” button from the menu.

You will see here a new tab named “Developer”

Click on “Insert” and then select “Button” from the form control. Later on you can double click on the button and set its properties (Caption, Color, etc.)
Congratulations! Our input screen is finished here. Let’s design our output screen now.

I have created my output screen just after the input screen. You can create anywhere in the excel file. Here terms ‘anywhere’ descries to other worksheet also.
The output screen is simple as you see. Nothing much to do here. I just simple colored the cells for better look.
Great! Looks like we finished user interface here. (Did we miss something…’Naah’ for now!)
SAP – Select Data
Since we are taking simple example to fetch detail from customer master, let’s create a function module for it.
Create a function module.

Enter function group and Short text.

Make sure your function module is “Remote Enabled”.

Now let’s create “Tables” parameters:

Here we have two “Tables” parameters
- ET_KUNNR (Input) : Customer numbers pass in to the function module
- ET_CUST_LIST (Output): Data will be fetched in function module and display on the excel sheet.
- Note: We have created a Z structure (ZNM_CUST_LIST) for the output list. Here are the fields for the structure:

We are all set with input and output structures.
Now, let’s fetch the data. Here is the only coding part came up in SAP. Look at below screen.

Here, we are selecting all the customer details from the KNA1 (customer master) table from the input table (ET_KUNNR) from excel file and return to the table (ET_CUST_LIST).
Now we have all the records in the table ET_CUST_LIST.
So, again congratulation friends! You have completed most of the things. The remaining step now is to display the list in the excel file.
Let’s now connect the SAP and MS Excel.
Go to the ‘Developer’ tab and click on “Visual Basic” icon.

The VB editor will be opened and we are going to write the code for connection of excel and SAP with sending and receiving data.
Here is the variable declaration list. These are the global variables. Let’s understand each of them.

|
Variable |
Description |
|
objBAPIControl |
For creating object to access SAP functions. |
|
objgetaddress |
To make BAPI function call via objBAPIControl. |
|
vLastRow |
Last row of output list |
|
vRows |
Total number of records returned from the SAP |
|
vcount_add |
Variable for increment records |
|
Index_add |
Variable for next record (Index) |
|
objaddress |
Object for SAP table (for customer master output) |
|
objkunnr |
Object for SAP table (for customer master input) |
|
Variable |
Description |
|
LogonControl |
Logon control is to make login in SAP. |
|
R3Connection |
Ro make connection to SAP R/3 using logon control. |
|
retcd |
Return Code |
|
SilentLogon |
If ‘True’ no popup will ask to enter SAP login details |
Here are the properties for the “Get Address” button.

Let’s code when “Get Address” button is clicked.
Setup the local variables
Private Sub GetAddress_Click()
Now let’s setup the connection with SAP R/3 using following code.

Let’s do SAP Login here.

Perfect!! We have made the connection with SAP R/3. Now we are able to send and receive the data from MS Excel to SAP R/3 and vice versa.
But how to send my customer details and receive? Hmmm…..we need to use internal tables those are created in SAP function module. (Do you remember?….NO?… checkout Tables parameters in function ZNM_GET_CUSTOMER_DETAILS). So, let’s do this.

Here, ZNM_GET_CUSTOMER_DETAILS is our function module created in SAP.
ET_KUNNR: Customer details input details
ET_CUST_LIST: Customer output details.

We are reading here each cell from excel worksheet for input.

Here we have called the FM and passed the input details to process.
Result:

vcount_add returns total number of records from the SAP. And we have already set the loop to display records in the cells.
Here, R3Connection.Logoff is to sign off from your SAP account.
Here is the output screen:

Wow!! We have output result. Good job!! But what is the use of another button “Reset Output” here? Yes…good question.
The “Reset Output” button will clear all the data and messages from the screen. Look at below code:
———————————————————————————————————————–
Now we have completed the entire example here. N’ joy.
Here is the entire code:
SHEET1:
Option Explicit
Private LogonControl As SAPLogonCtrl.SAPLogonControl
Private R3Connection As SAPLogonCtrl.Connection
Private TableFactory As SAPTableFactory
Public Functions As SAPFunctionsOCX.SAPFunctions
Dim objBAPIControl, objgetaddress As Object
Dim vLastRow, vRows As Integer
Dim vcount_add, index_add As Integer
Dim rng As Range
Public objaddress, objkunnr As SAPTableFactoryCtrl.Table
MODULE:
Sub GetAddress_click()
Dim retcd As Boolean
Dim SilentLogon As Boolean
‘ Set Connection
Set LogonControl = CreateObject(“SAP.LogonControl.1”)
Set objBAPIControl = CreateObject(“SAP.Functions”)
Set R3Connection = LogonControl.NewConnection
R3Connection.Client = “700”
R3Connection.ApplicationServer = “”
R3Connection.Language = “EN”
R3Connection.User = “”
R3Connection.Password = “”
R3Connection.System = “”
R3Connection.SystemNumber = “”
R3Connection.UseSAPLogonIni = False
SilentLogon = False
retcd = R3Connection.Logon(0, SilentLogon)
If retcd <> True Then MsgBox “Logon failed”: Exit Sub
objBAPIControl.Connection = R3Connection
Set objgetaddress = objBAPIControl.Add(“ZNM_GET_EMPLOYEE_DETAILS”)
Set objkunnr = objgetaddress.Tables(“ET_KUNNR”)
Set objaddress = objgetaddress.Tables(“ET_CUST_LIST”)
Dim sht As Worksheet
Set sht = ThisWorkbook.ActiveSheet
‘ Changes for the Loop
‘Dim int1 As Integer
‘Do While sht.Cells(int1, 2).Value <> ” “
‘ Changes for the Loop End
If sht.Cells(6, 2).Value <> ” ” Then
‘If ThisWorkbook.ActiveSheet.Cells(6, “B”).Value <> ” ” Then
‘objkunnr.Rows.Add objkunnr.Value(1, “SIGN”) = ThisWorkbook.ActiveSheet.Cells(6, 2).Value
objkunnr.Rows.Add
objkunnr.Value(1, “SIGN”) = sht.Cells(6, 2).Value
‘objkunnr.Value(1, “OPTION”) = ThisWorkbook.ActiveSheet.Cells(6, 3).Value
objkunnr.Value(1, “OPTION”) = sht.Cells(6, 3).Value
‘objkunnr.Value(1, “LOW”) = ThisWorkbook.ActiveSheet.Cells(6, 4).Value
objkunnr.Value(1, “LOW”) = sht.Cells(6, 4).Value
‘objkunnr.Value(1, “HIGH”) = ThisWorkbook.ActiveSheet.Cells(6, 5).Value
objkunnr.Value(1, “HIGH”) = sht.Cells(6, 5).Value
‘End If
End If
returnfunc = objgetaddress.call
If returnfunc = True Then
vcount_add = objaddress.Rows.Count
For index_add = 1 To vcount_add
vRows = 11 + index_add
sht.Cells(vRows, 2) = objaddress.Value(index_add, “KUNNR”)
sht.Cells(vRows, 3) = objaddress.Value(index_add, “LAND1”)
sht.Cells(vRows, 4) = objaddress.Value(index_add, “NAME1”)
sht.Cells(vRows, 5) = objaddress.Value(index_add, “ORT01”)
sht.Cells(vRows, 6) = objaddress.Value(index_add, “PSTLZ”)
sht.Cells(vRows, 7) = objaddress.Value(index_add, “REGIO”)
sht.Cells(vRows,  = objaddress.Value(index_add, “KTOKD”)
sht.Cells(vRows, 9) = objaddress.Value(index_add, “TELF1”)
sht.Cells(vRows, 10) = objaddress.Value(index_add, “TELFX”)
Next index_add
End If
‘ If address not exist then Show error
If vcount_add = “” Then
sht.Cells(10, 11) = “Invalid Input”
Else
‘ ActiveSheet.Cells(10, 12) = “BAPI Call is Successfull”
‘ ActiveSheet.Cells(11, 12) = vcount_add & “rows are entered”
sht.Cells(10, 12) = “BAPI Call is Successfull”
sht.Cells(11, 12) = vcount_add & ” rows are entered”
End If
R3Connection.Logoff
End Sub
COMMON ERROR: User defined Type not defined

So…let’s try to remove the one. As our friends have posted solutions, here are the steps to avoid the error.
1. Go to your VBA Project and Select Tool –> References.

2. “References” window will be opened as below.

3. Select “Browse…” and select .OCX files for Active X control from below path. (SAP GUI 7.3 already installed on my machine)

4. Select wdtaocxU.ocx, wdtfuncU.ocx, wdtlogU.ocx files from the
location.Add wdobapiU.ocx if you are needed.

5. Make your references are selected. Press OK. And save.

6. That’s it.
Время на прочтение
5 мин
Количество просмотров 1.4K
Привет, Хабр! Меня зовут Дарья Чувашова, я — руководитель группы отделения SAP-разработки. В процессе моей проектной деятельности мне приходилось сталкиваться с задачами выгрузки документов в .doc формат и делать это нужно было быстро. При этом эти документы могли быть с совершенно разным форматированием, кучей таблиц, реквизитов и т. д. В SAP для выгрузки в форматы pdf и excel есть удобные инструменты, возможность работать с формулярами и графическими редакторами форм. Для работы с форматом.doc инструментов меньше. В этой статье я расскажу о быстром и самом простом способе выгрузить документ любой сложности.

Почему я решила написать этот «how‑to»? Как я упомянула, задачи по выгрузке файлов в.doc мне приходилось выполнять часто. В какой‑то момент я собрала все лайфхаки и советы по ускорению работы в один материал, а сейчас хочу поделиться им с хабровской аудиторией. Надеюсь, для коллег записи будут полезными. Описанный вариант решения имеет свои особенности, поэтому я постараюсь на примерах продемонстрировать некоторые «узкие» моменты.
Пошаговая инструкция решения вопроса
Шаг 1
В первую очередь нам нужно подготовить шаблон в MS Word в нужном формате. Важно заполнить все реквизиты тестовыми данными для примера, это значительно упростит нам жизнь в последующих действиях.
В качестве примера рассмотрим вот такой документ «Счёт‑фактура» в MS Word:

Шаблон необходимо заполнить тестовыми примерами, чтобы проверить, что при заполнении ничего не съезжает, и все реквизиты остаются на месте:

Шаг 2
Сохраним наш документ в формате XML: Файл — Сохранить как. Выбираем расширение .xml


Примечание: для большинства задач вполне достаточно формата.doc, он поддерживает ограничения редактирования, элементы управления и т. п.
Для того чтобы открыть данный файл, мне удобно использовать программу Altova XML Spy. Скорее всего нам потребуется проанализировать содержимое, а в данной программе выполнять анализ файла очень удобно за счёт подсветки синтаксиса. Вы, конечно, можете использовать любой другой редактор.
Открываем свой XML, видим примерно такую картину:

После применения команды PrettyPrinter:

Шаг 3
Переходим в SAP. В своём пакете разработки создадим Преобразование:

Выберем трансформацию XSLT:

Видим следующую картину:

Для того, чтобы наша трансформация верно работала, необходимо указать следующий код между тегами <xsl:template match=»/»> </xsl:template>:
<xsl:processing-instruction name="mso-application" progid="Word.Document">
      <xsl:text progid="Word.Document"/>
  </xsl:processing-instruction>
Теперь можно смело вставить весь XML‑код ниже из нашего документа:

Визуально просматриваю данный XML‑код, обнаруживаю, что часть тегов подсвечивается, как текст:

Вижу, что это произошло из‑за кавычек в наименовании компании (Company), смело их удаляю:

Теперь пытаемся активировать трансформацию. В 90% случаях активация пройдёт успешно.
Но если у вас появятся подобные ошибки,

Предлагаю стереть данные коды, так как они не имеют никакого смысла для генерации документа из SAP.

Удаляем:

После удаления всех кодов трансформация успешно активируется.
Шаг 4
Переходим в программу. Для вызова трансформации и выгрузки файла привожу для примера такой код:

Данный код максимально облегчён для простоты восприятия и предельной наглядности.
После запуска программы в папке C:TEMP сохранится файл точно в таком же виде, как наш подготовленный шаблон:

При открытии файла может возникнуть следующая ошибка:

Для того, чтобы от неё избавиться, переходим в трансформацию и ищем /word/settings.xml

Избавиться от ошибки мне помогло удаление всего блока <pkg:part … </pkg:part>. Это не повлияло на работоспособность, и файл стал открываться нормально. Без подсветки синтаксиса тяжело искать закрывающий тег, поэтому имеет смысл снова воспользоваться программой Altova XML Spy (в данной программе вы можете удалить лишний код, а затем вставить новую версию в нашу трансформацию).

Удаляем и активируем, проверяем, что ошибка ушла и с файлом всё в порядке.

Шаг 5
Переходим к выгрузке данных из контекста. Начнём с самого простого: выгрузим данные в поле «Продавец»:

Контекст представляет собой структуру c данными, например, вот такую:

Её мы заполняем и подаём в трансформацию как контекст. Далее копируем из файла, заполненного в качестве примера, текст из реквизита «Продавец» и ищем это место в нашей XML:

Вместо данного текста вставляем:

Не забываем указать нужную структуру контекста и сделать выборку данных. Для примера прописываю хардкодом наименование продавца:

Результат трансформации:

Остальные реквизиты заполняем аналогично.
Как видим, заполненный на Шаге 1 пример нам помогает выполнять быструю навигацию по XML и искать нужные места для доработки.
Отдельную сложность может представлять собой заполнение табличных данных. В структуре контекста имеем вложенную таблицу с данными T_INVOICE. Для вывода данных используем цикл for each. Начнём с 1 строки 1 столбца. Ищем поиском пример «Яблоки» и вставляем код, приведённый чуть ниже.
Теги описания таблицы довольно понятны: <w:tc> </w:tc> — стоблец, <w:tr </w:tr> — соответственно строка, ну и сам текст <w:t> </w:t>.
Если мы хотим каждую строку таблицы из контекста выводить в новую строку таблицы, то цикл ставим перед тегом строки и закрываем после окончания описания строки:

Конец цикла будет обозначен тут:

Так как таблица большая, окончание цикла будет через 400 строк, поэтому удобно воспользоваться опять же программой с подсветкой тегов, таким образом выводим все необходимые элементы таблицы.
Результат:

Видим, что строка автоматически добавилась. Так как нам не нужны старые данные из примера, удалим эти строки из таблицы. Ищем так же по тегам.

В идеале можно было бы в самом шаблоне оставить лишь одну строку для заполнения, тогда лишних действий по удалению колонок не пришлось бы делать. Но я хочу показать неидеальный случай.
Если необходимо вывести данные из таблицы контекста не в каждой строке таблицы, а текстом с переносом, то можем воспользоваться тегом переноса строки <w:br/>, например,

Получим вот такой результат:

Ещё немного полезных рекомендаций
Мы разобрали основные шаги, как сделать выгрузку любого реквизита и заполнить таблицу. При этом необязательно думать о размере шрифта или форматировании, достаточно изначально выстроить необходимые настройки и правки в исходном документе.
Что ещё записано в моих заметках?
Как поменять шрифт быстро, если он перестал подходить? Допустим, мы желаем заменить Arial на Calibri. Для этого в трансформации выполняем поиск Arial — «Заменить все» и вставляем название нового шрифта Calibri.
Для этого нужно в исходном файле на 1 шаге настроить защиту листа, тогда кодирующие эту операцию теги будут отражены в нашей трансформации.
Примеры исходного кода из статьи можно увидеть в репозитории github.
Данной информации должно быть достаточно, чтобы сделать выгрузку практически любого документа быстро и эффективно.
SAP ABAP предоставляет стандартный класс CL_DOCX_DOCUMENT, который обеспечивает локальные операции чтения и записи текстовых документов Microsoft Office, заканчивающихся на «.docx».
В этой статье описывается простое использование класса ABAP CL_DOCX_DOCUMENT.

Office OpenXML
Начиная с Microsoft Office 2007, когда мы создали новый текстовый документ, его расширение изменилось с «.doc» на «.docx», что основано на спецификации открытого исходного кода: формат Office openXML.
Например, на рисунке ниже я создал простой текстовый документ, который содержит область заголовка, абзац, состоящий из трех строк цветного текста, и изображение.

Мы сохраняем этот документ локально, меняем его расширение с .docx на .zip, а затем дважды щелкаем, чтобы открыть его с помощью программы распаковки, такой как winrar.
Итак, я обнаружил, что этот простейший документ Word на самом деле состоит из очень многих XML и папок.

Используйте CL_DOCX_DOCUMENT для чтения содержимого файла слова
Пример кода выглядит следующим образом:
DATA: lv_content TYPE xstring,

lo_document TYPE REF TO cl_docx_document.

PERFORM get_doc_binary USING 'C:Usersi042416Desktop est.docx' CHANGING lv_content.

lo_document = cl_docx_document=>load_document( lv_content ).

CHECK lo_document IS NOT INITIAL.

DATA(lo_core_part) = lo_document->get_corepropertiespart( ).

DATA(lv_core_data) = lo_core_part->get_data( ).

DATA(lo_main_part) = lo_document->get_maindocumentpart( ).

DATA(lo_image_parts) = lo_main_part->get_imageparts( ).

DATA(lv_image_count) = lo_image_parts->get_count( ).

DO lv_image_count TIMES.

DATA(lo_image_part) = lo_image_parts->get_part( sy-index - 1 ).

DATA(lv_image_data) = lo_image_part->get_data( ).

ENDDO.

DATA(lo_header_parts) = lo_main_part->get_headerparts( ).

DATA(lv_header_count) = lo_header_parts->get_count( ).

DO lv_header_count TIMES.

DATA(lo_header_part) = lo_header_parts->get_part( sy-index - 1 ).

DATA(lv_header_data) = lo_header_part->get_data( ).

ENDDO.
Краткое описание приведенного выше кода
1. Передайте двоичное содержимое документа word в метод cl_docx_document => load_document, чтобы получить ссылку на объект документа, и затем вы можете использовать ссылку на объект для вызова различных методов.
2. Создатель слова document, время создания, время последней модификации и другая информация хранятся в так называемой «Базовой части свойства», вы можете получить ссылку на «Базовую часть свойства» через метод lo_document-> get_corepropertiespart, а затем использовать эту ссылку для вызова метода. get_data получает фактический контент.
На следующем рисунке показан пример содержимого, возвращаемого get_data, который можно увидеть в формате xml.

3. Теперь мы готовы прочитать текст слова документа. Используйте метод lo_document-> get_maindocumentpart, чтобы получить текст документа word, также включены тип шрифта и цвет текста. Как показано ниже:


4. Конечно, двоичное содержимое картинок, вставленных в документ Word, также можно прочитать. Использование: lo_image_parts-> get_part возвращает.
Исходя из этой же идеи, другие форматы офисных документов после Microsoft Office 2007, такие как Powerpoint и Excel, следуют стандарту Office OpenXML, поэтому вы также можете увидеть множество xml и папок после изменения имени суффикса на .zip. ABAP также предоставляет стандартные коды для чтения и записи этих документов Office, такие как CL_PPTX_DOCUMENT, CL_XLSX_DOCUMENT и т. Д., Как показано ниже.

Чтобы узнать больше о технических статьях Джерри, пожалуйста, обратите внимание на публичный номер «Wang Zixi» или отсканируйте QR-код ниже:


Unfortunately, at the end of every IT project there is little budget left for training. After a new tool has been introduced, the users are left alone to figure out how to work with it.
These 18 helpful SAP Analysis for Microsoft Office tricks will make your work easier:
- Free characteristics
- Filtering
- Unhide columns
- Repeat members
- Display keys
- Hide or show totals
- Sort
- Change prompt values
- Use value help
- Add line in prompt
- Add lines using filter by member
- Explicit selection
- Copy prompt selections from Excel
- Show master data in the value help
- Save variant
- To previous saved state
- To previous consistent client state
- Disable reset
Some are basic, others more sophisticated—but they all are meant to kickstart your SAP Analysis for Microsoft Office usage. With them, you can make the most of your reports and get the insights required to succeed in your job.
1 Free Characteristics
To this day, I am surprised most users are not taught this basic feature. Free characteristics enable you to enhance your analysis, go into more detail, and get new insights from your data.
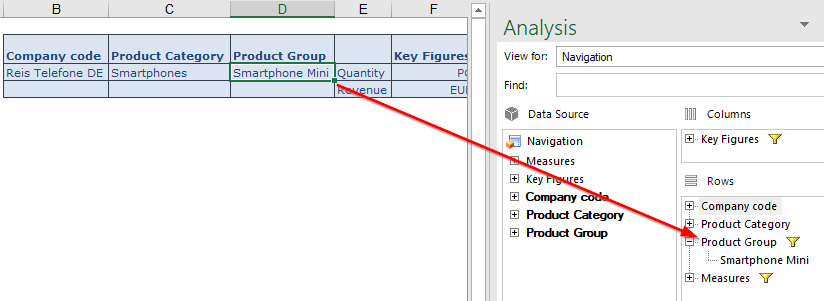
Let’s consider the following example. The initial drilldown of the report displays company codes and product categories.
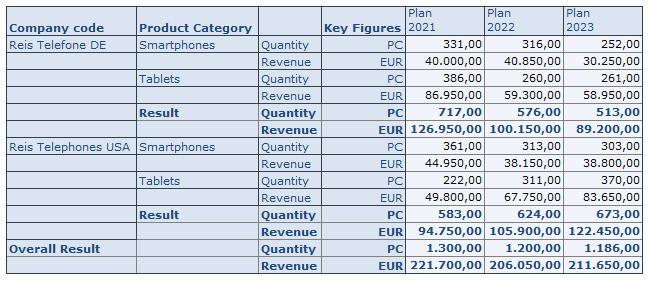
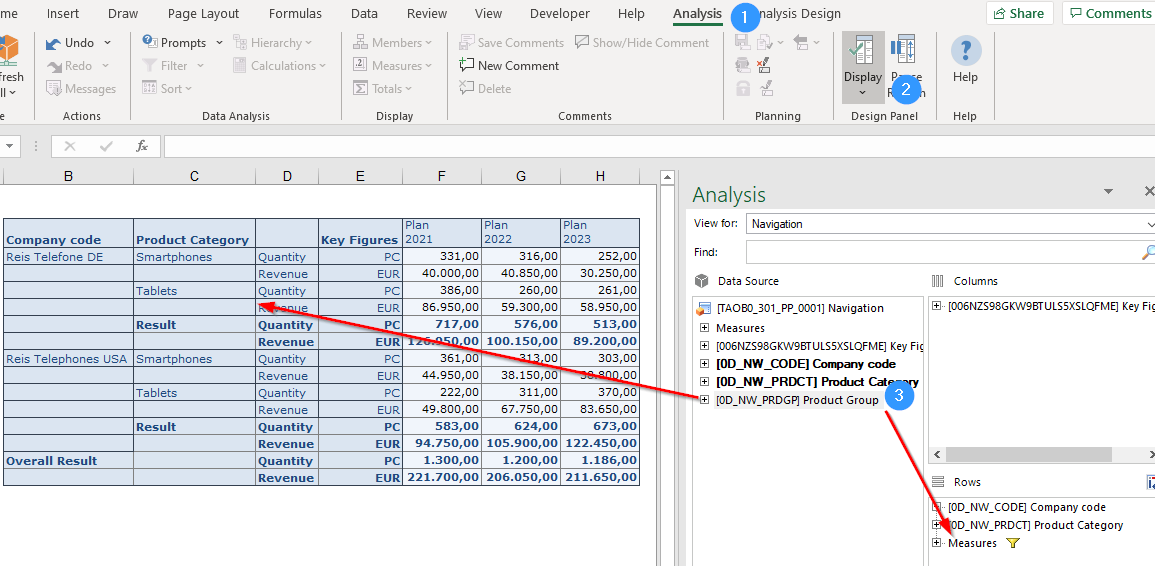
In order to see the values on a more granular level (for example, product group), you can use free characteristics. Go to the Analysis ribbon (1 on the figure below), select Display (2), and the Design Panel will appear. Now you can choose the required characteristic and drag and drop it into rows or columns. Another option is to drag them straight into the crosstab (3).
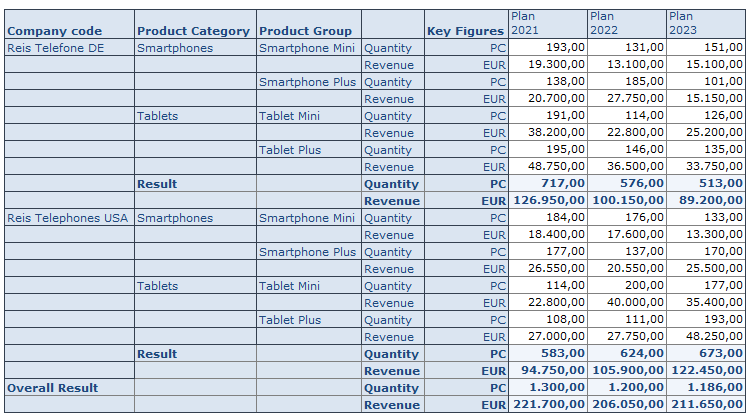
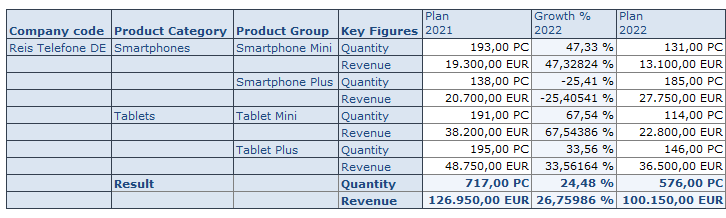
The report will also show data on the product group level and you can analyze the individual product groups. For example, revenue on Smartphone Mini vs. Smartphone Plus.
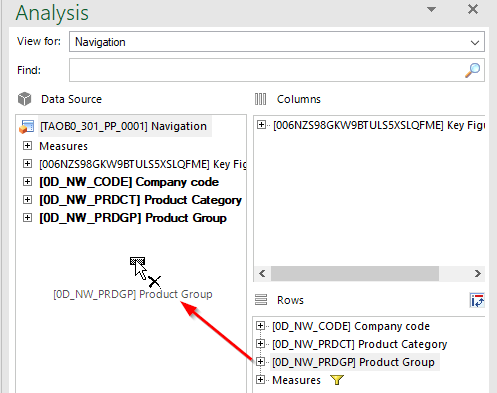
You can also remove characteristics from the drilldown in order to show the data on a more aggregated level. To do so, just drag and drop the characteristic from rows or columns to the list of free characteristics.
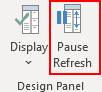
One more tip: if you want to add several characteristics to the drilldown, one after the other, or remove some characteristics from the drilldown at the same time, it is recommended to pause the refresh. This is because every time you change the drilldown of your crosstab, the display is updated and the values are recalculated. This can take some time if there are a lot of values.
The Pause Refresh option allows you to disable the automatic update and create a new view of your data without interruptions. You can insert new characteristics in rows or columns, adjust key figures, or set up background filters. If you select the Pause Refresh option again, the update will be reactivated. All previously defined navigation steps are executed at once.
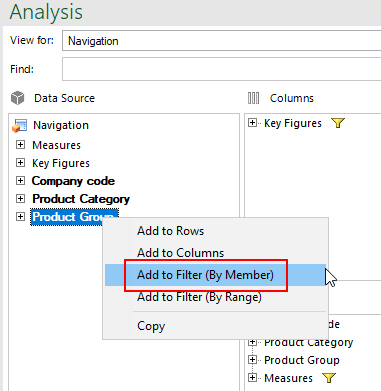
2 Filtering
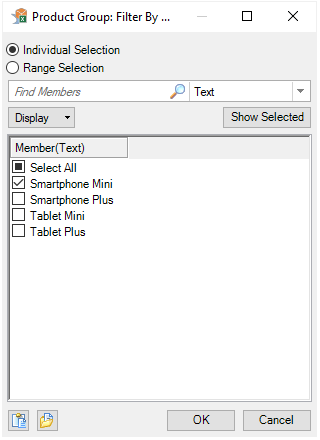
There are multiple ways to filter on desired values. In the Design Panel, you can right-click on the characteristic to be filtered and select Add to Filter (By Member).
Afterwards, the values to be filtered can be selected.
You can also achieve the same result by right clicking on the characteristic in the report and selecting Filter by Member from the context menu.
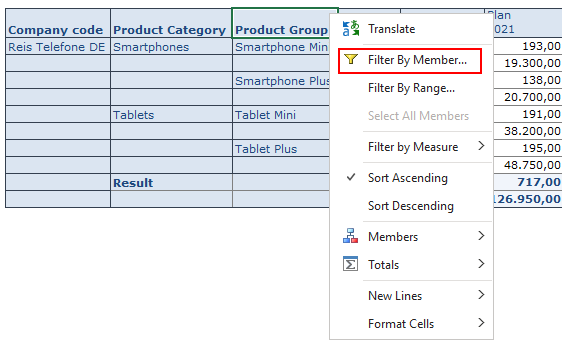
However, the fastest and the easiest way is to double-click on the specific value. This way, the filter will be automatically set to this value.
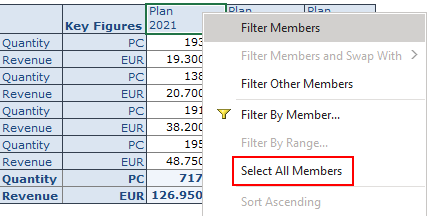
3 Unhide Columns
Reports may contain additional information, like growth between periods in absolute values and percentage. These columns might be initially hidden so the report is not overloaded. In order to display this information, right-click on any column and select Filter by Member from the context menu.
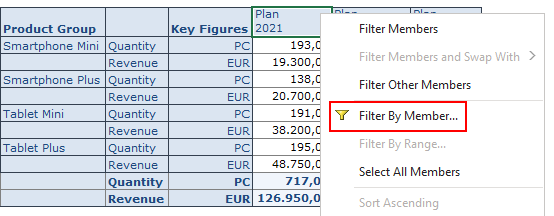
Afterwards, you can select the columns to be displayed. For example, Growth % 2022.
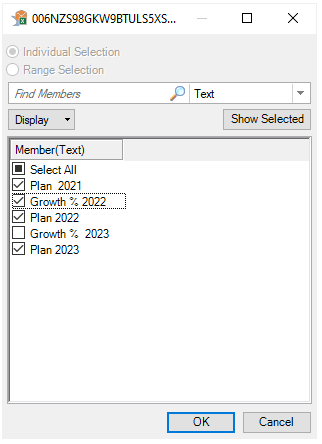
After you click on OK, the additional column is shown in the report.
In order to display all available columns, click on Select All Members in the context menu.
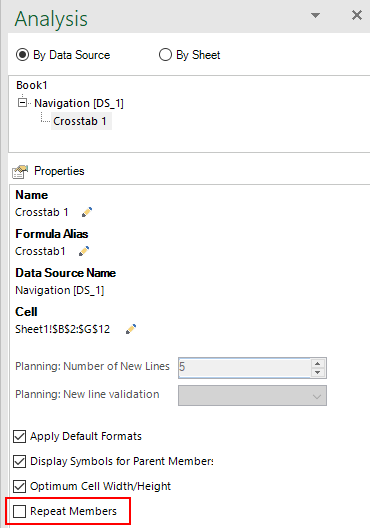
4 Repeat Members
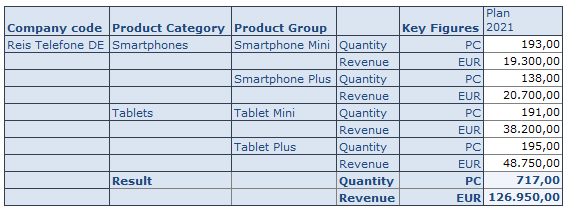
By default, the description of characteristics is shown only in the first line. For instance, the description of the company code is displayed in the first line, followed by blank cells.
If you want to display the description in every cell, go to the Analysis Design tab. Open the Crosstab menu in the Format group and select the Repeat Members setting.
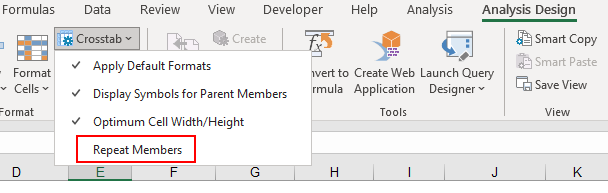
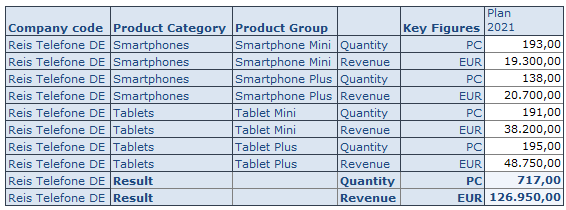
After that, the descriptions are shown in every cell.
If you want to save this setting with the workbook, you have to display the Design Panel and select the Components tab. Select your query (Data Source), unfold, and select the correct crosstab. Under properties, tick the box Repeat Members.
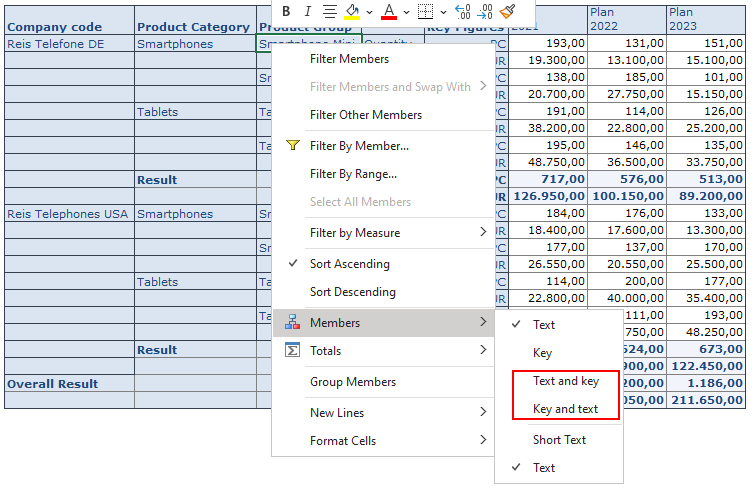
5 Display Keys
Some reports may show members as text only per default. There might be two entries with the same description, which is misleading, whereas the technical keys are always unique. In order to display the technical key, you can right click on a characteristic and change the display by going to Members and choosing Key and text or Text and key setting.
6 Hide or Show Totals
You can hide or show totals by right-clicking on a characteristic and choosing the Totals menu entry.
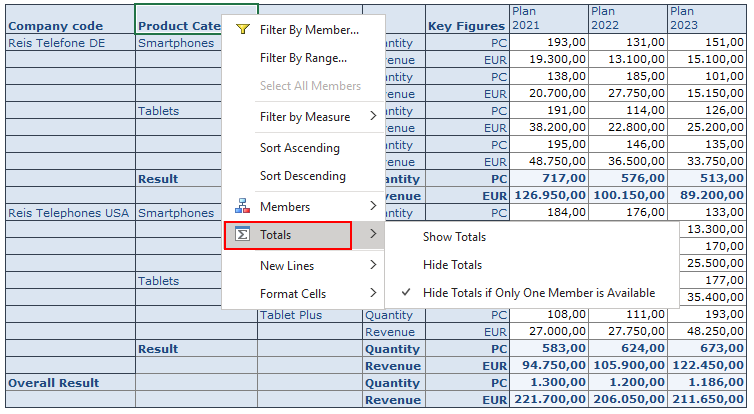
You can hide the totals row completely (Hide Totals) or always display it (Show Totals). You can also display totals only if there is more than one value to be calculated (Hide Totals if Only One Member is Available). Results that consist of only one element are then hidden.
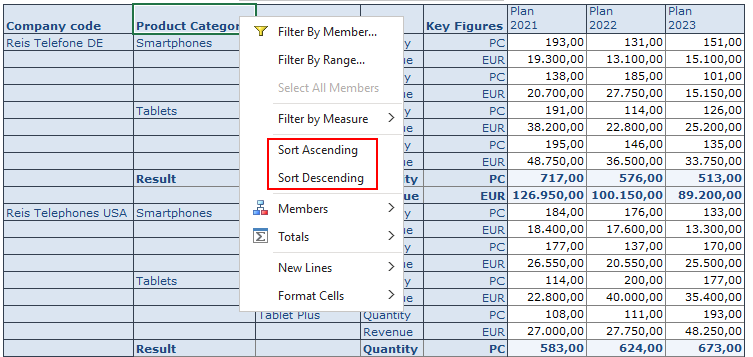
7 Sort
You can easily change the sort order in the query. To do so, right click on the characteristic and select Sort Ascending or Sort Descending from the context menu.
8 Change Prompt Values
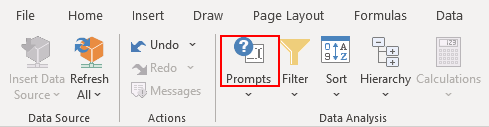
Sometimes the report you use may come with predefined values and won’t show prompts by default. By clicking on Prompts you can change your variable selection.
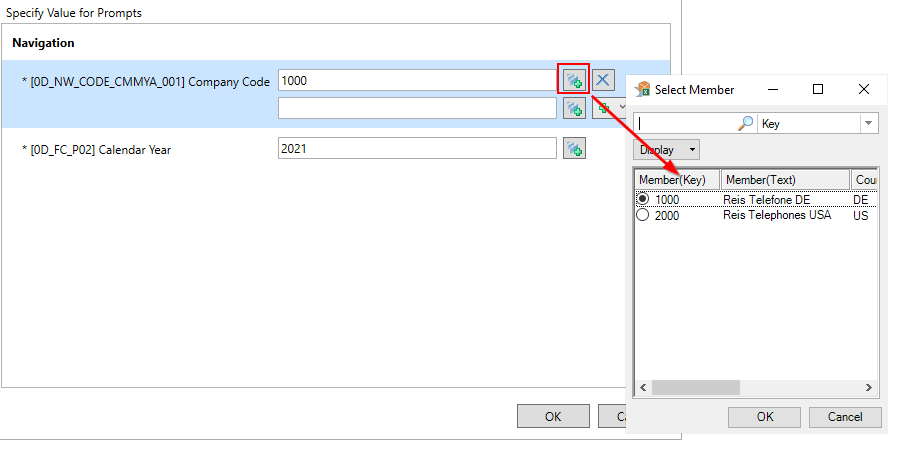
9 Use Value Help
You have to enter the key of the characteristic’s value in the prompt. If you don’t know the key for your selection, you can use the value help to find out.
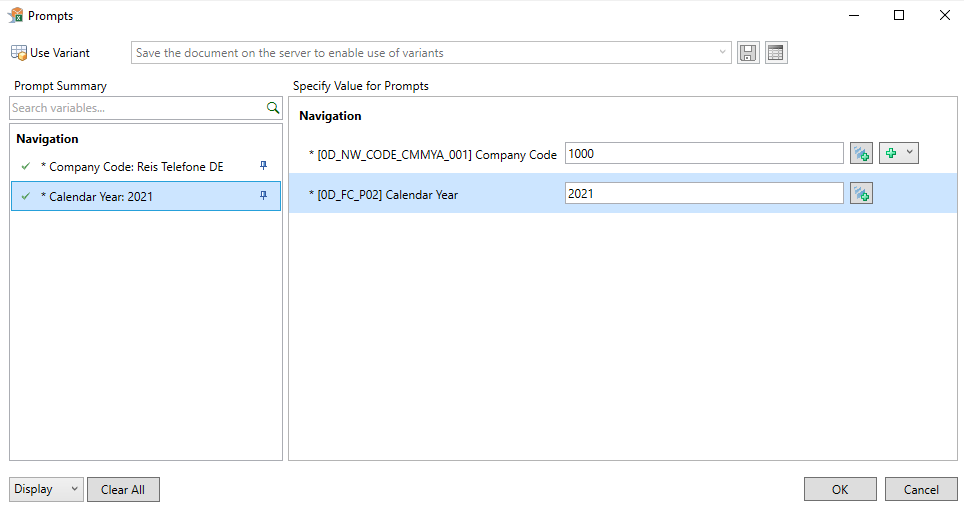
10 Add Line in Prompt
It is possible to select multiple values in the prompts. In order to add a new line, click on the green plus icon. You can add as many lines as necessary.
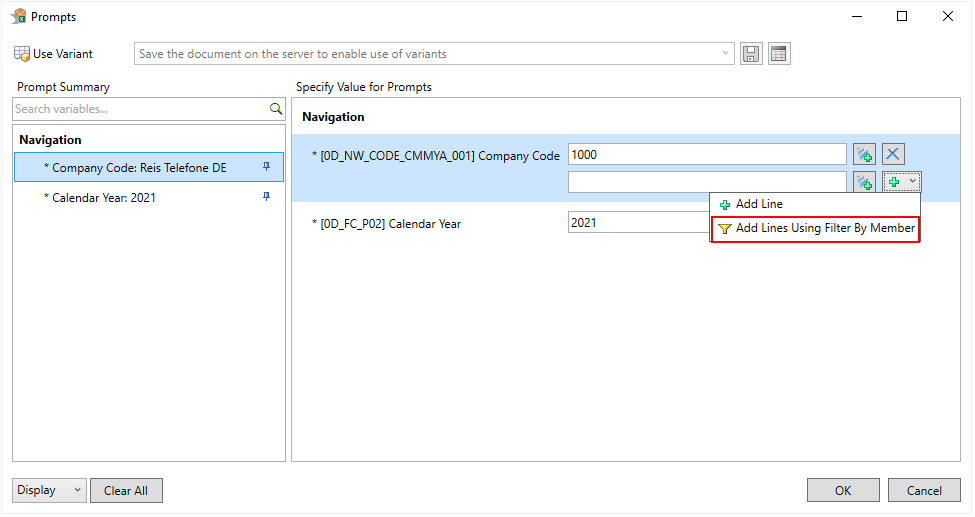
11 Add Lines Using Filter By Member
Another, easier, way to select multiple values is to use the filter feature in the prompts. Click on the drop down menu next to the green plus icon. Afterwards, select Add Lines Using Filter by Member entry. Select the desired members and confirm your selection by pressing OK.
12 Explicit Selection
If you select all values in the filter or use the Select All checkbox, nothing will happen at first because this dialog box functions like a filter. If the selection is restricted to all values, no restriction exists for any of the values. If you want to select all values at once, you can use the Explicit Selection setting.
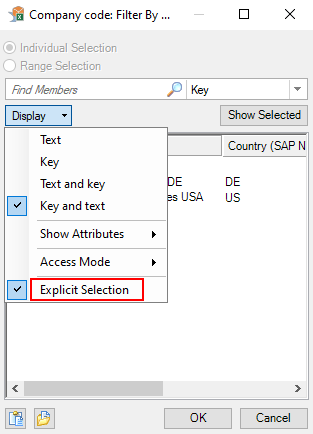
When the Explicit Selection setting is active, values are selected individually. If you click on Select All, the two company codes are selected one by one. You can now click the OK button to add them to the prompt.
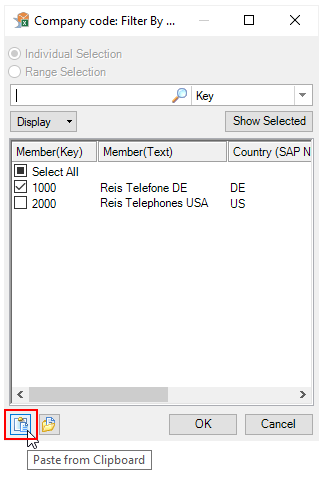
13 Copy Prompt Selections from Excel
Another easy way to select prompt values is to copy them from clipboard. You can copy your selections from Excel, select the drop down menu in the prompt, and click on Add Lines Using Filter by Member. Then, click on the Paste From Clipboard icon at the bottom.
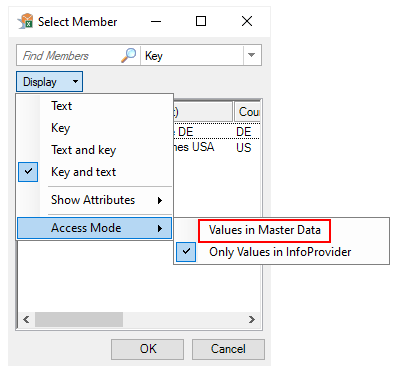
14 Show Master Data in the Value Help
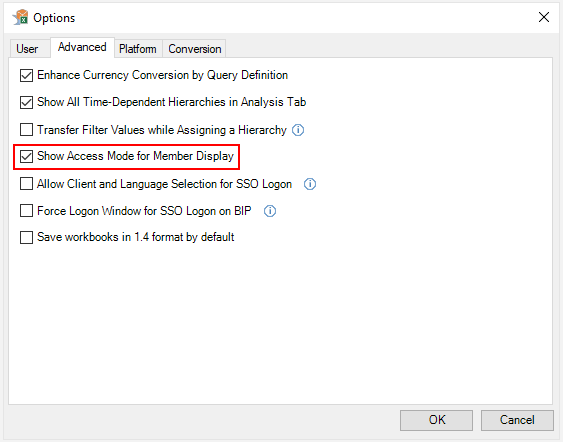
In planning scenarios, you might need to select values for which no transactional data is available yet. To do so, go to value help and select Display. Afterwards, select Values in Master Data as an Access Mode.
The Access Mode option is only available if you activate the Show Access Mode for Member Display setting in the Advanced options. It is deactivated by default.
15 Save Variant
You can save your selections as a variant to save time in the future. After you have entered your selections, enter a name for the variant. Then save the variant.
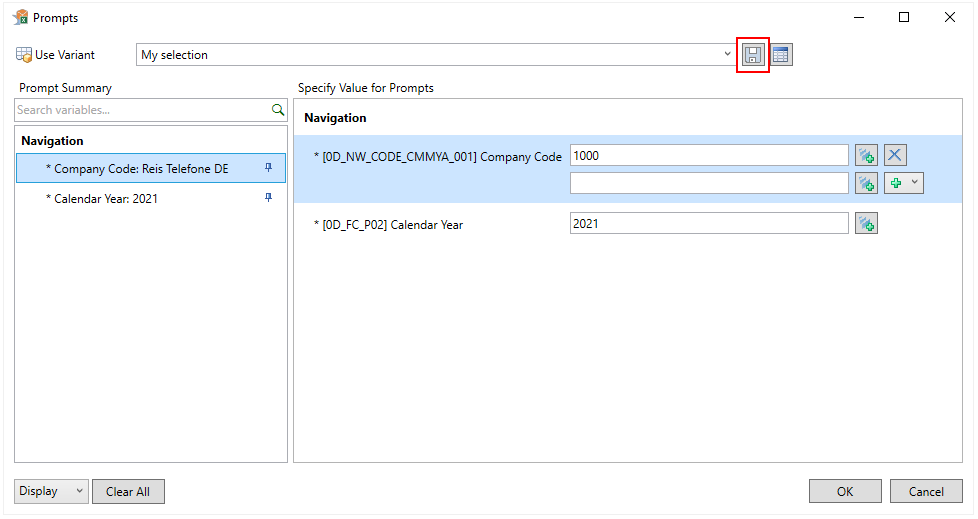
Next time you open the workbook the variant can be selected from the dropdown menu.
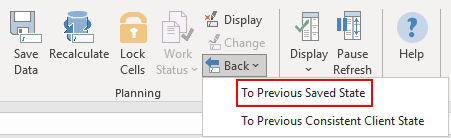
16 To Previous Saved State
When using SAP Analysis for Microsoft Office in a planning context, you might want to reset your changes. Go to Analysis tab and select Back > To Previous Saved State. Changed values will return to the previous saved state.
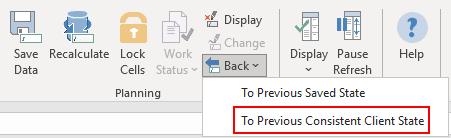
17 To Previous Consistent Client State
There is also the possibility to return to the previous consistent client state by selecting To Previous Consistent Client State option. This option reverses all changes to your data since the last successful recalculation. This feature is useful to return to an original plan when you entered values on an empty cell and disaggregation is not possible.
18 Disable Reset
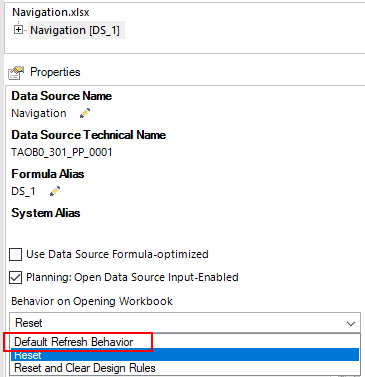
SAP Analysis for Microsoft Office workbooks are usually set up to reset to query settings on opening. This way, your IT department can guarantee you see the latest version of the query. The downside of this approach is that you cannot save your navigation state with the workbook.
If you want to save your favorite drilldown locally, display the Design Panel and choose the Components tab. Select the query (Data Source) and change the Behavior on Opening Workbook setting to Default Refresh Behavior.
Summary
I hope you enjoyed this little collection of useful hints and learned something new. You can learn more useful tips to facilitate your work with SAP Analysis for Microsoft Office in my book SAP Analysis for Microsoft Office — Practical Guide.

In this article we will discuss issue we faced after Office 365 migration while using applications MS Excel Word within SAPGUI.
Symptoms:
- After Office 365 migration,documents within SAP which use Microsoft Excel and Microsoft Word do not open in Embedded SAPGUI window. (within SAP).
- Instead they open separately (Outside SAP window) while executing SAP transactions that has MS Word /MS Excel to be opened in place.
- This is also a case with transactions with SAP long text.
Cause:
Issue is caused due to DPI settings. (dots-per-inch resolution).
How To Correct This Issue:
1) For Microsoft Word
- Open the Microsoft Word application and Goto File –>Options

- From File Menu–>Open Options.

- Choose General->When using multiple displays -> and select option Optimize for Compatibility

Restart MS Word Application.
- Open the Microsoft Excel application and Goto File –>Options

- From File Menu select –>Open Options.

Choose General->When using multiple displays -> and select option Optimize for Compatibility

Restart MS Excel Application.
- EMBEDDED
- EXCEL
- Office 365
- SAP GUI
- SEPARATE WINDOW
- WORD