Время на прочтение
4 мин
Количество просмотров 3.4K

Всем привет! Хочу продемонстрировать вам, как я использовал библиотеку WordCloud для создания подарка для друга/подруги. Я решил составить облако слов по переписке с человеком, чтобы выделить основные темы, которые мы обсуждаем.
Выгружаем переписку
Для начала нам нужно будет выгрузить переписку из ВК. Как это сделать? Очень просто! Я пользовался расширением для браузера «VkOpt». Скачиваем его и устанавливаем. Теперь заходим в диалог с человеком, переписку с которым хотим скачать.
Наводим на три точки и выбираем «сохранить переписку». Далее будет окно с выбором типа файла. Я предпочитаю json.
Обработка переписки
Импортируем json и открываем наш файл с перепиской.
import json
vk = open('vk2.json', 'r', encoding='utf8')
vk = json.load(vk)
Теперь давайте выведем его и посмотрим как он выглядит.
Ну в общем всё ясно, массив таких вот сообщений. Каждый элемент соответствует одному облако-сообщению.
Давайте теперь вытащим из каждого сообщения его текст и разделим этот текст на слова.
mas = []
for i in range(len(vk)):
    mas.append(vk[i]['body'].split())

data = []
for i in mas:
    for j in range(len(i)):
        data.append(i[j].lower())
Теперь у нас есть массив data, в котором каждый элемент — это одно слово. Далее создадим большую строку, в которую просто запишем через пробел все наши слова.
big_string=''
for i in range(len(data)):
    big_string+=(data[i]+' ')
WordCloud
Почти всё готово, теперь давайте воспользуемся библиотекой WordCloud и построим наше облако слов.
pip install wordcloud

import matplotlib.pyplot as plt
%matplotlib inline

from wordcloud import WordCloud, STOPWORDS
wordCloud = WordCloud(width = 10000, height = 10000, random_state=1, background_color='black', colormap='Set2', collocations=False).generate(big_string)

plt.figure(figsize=(5,5))
plt.imshow(wordCloud)
Убираем стоп-слова
Так, и что же это? Не очень похоже на оригинальный подарок. Естественно всё не так просто. Дело в том, что в нашей речи и сообщениях встречается куча стоп-слов. Собственно, эти слова вы и видите на картинке. Они встречались в диалоге чаще всего, поэтому алгоритм выделил их крупным шрифтом.
Теперь наша задача: почистить строку от ненужный слов. Для этого скачаем словарик стоп-слов русского языка(https://snipp.ru/seo/stop-ru-words). Он представлен как обычный txt-шник, а значит прочитаем его и разделим по переносу строки.
stop_words = open('stop-ru.txt', 'r', encoding='utf8')
stop_words = stop_words.read()
stop_words = stop_words.split('n')
Далее создадим массив clear_data, куда будем заносить слова из массива data, которые не содержатся в списке стоп-слов(т. е. нормальные слова).
clear_data=[]
for i in data:
    if(i not in stop_words):
        clear_data.append(i)
А теперь формируем нашу большую строку, только теперь из нового массива и заново строим WordCloud.
big_string=''
for i in range(len(clear_data)):
    big_string+=(clear_data[i]+' ')

wordCloud = WordCloud(width = 10000, height = 10000, random_state=1, background_color='black', colormap='Set2', collocations=False).generate(big_string)
plt.figure(figsize=(5,5))
plt.imshow(wordCloud)
Результат на лицо. Начинает проявляться оттенок переписки с тем или иным человеком. Ну и, естественно, куда же мы русского могучего, он тоже начинает проявляться на изображении, приходится его замазывать 
Переходим на ручное управление
Так, вроде стоп-слова убрали, но картинка всё равно не выглядит привлекательной. В выборке остались различные выражения, которые мы часто используем в переписке. Например, мои слова паразиты: «ок», «ща», «крч». Что делать? Все просто. Открываем наш текстовик с русскими стоп-слова и просто вписываем туда слова, которые не должны присутствовать в новом облаке слов(не забудьте сохранить текстовик, перед повторным чтением).
P.S. На самом деле есть и второй вариант удалить слова паразиты. Создадим массив, который заполним словами паразитами, и подадим его как параметр в WordCloud. Тоже хороший вариант, но мне больше нравится с текстовиком.
stopw = ['а', 'ок', 'крч'] #массив слов, которые хотим удалить
#подадим массив stopw в WordCloud как параметр stopwords
wordCloud = WordCloud(width = 1000, height = 1000, random_state=1,
                      background_color='black', colormap='Set2',
                      collocations=False, stopwords=stopw).generate(big_string)
Таким образом, мы всё глубже и глубже погружаемся в чертоги нашей переписки. Обычно появляются слова, соответствующие темам, которые вы и ваш друг часто обсуждаете.
Форма облака слов
Теперь давайте воспользуемся одной фишкой WordCloud. Оформим наше облако слов в виде какой-то картинки. Я выберу банальное сердечко)
from PIL import Image
original_image = Image.open('путь до картинки')
image = original_image.resize([2000,2000], Image.ANTIALIAS)
image = np.array(image)
Подадим в функцию нашу картинку как параметр mask.
wordCloud = WordCloud(width = 1000, height = 1000, random_state=1,
                      background_color='black', colormap='Set2',
                      collocations=False, stopwords=stopw, mask=image).generate(big_string)
Вот такая штука у меня получилась.
По-хорошему, нужно удалить ещё около десятка слов, для более-менее приятной картины, но я уверен ту вы справитесь сами)
P.S. Выбирайте черно-белые изображения предметов. Лучше всего, если они выглядят как силуэты. С .png у меня не прошло, поэтому я сохранял в .jpg, может быть у вас получится.
Итог
Я нарисовал облако слов, которое отражает тональность переписки с тем или иным человеком. Дополнительно, в облаке содержатся слова, которые соответствуют тем темам, которые вы часто обсуждали в диалоге. Как вариант, можно сохранить эту картинку, распечатать, поставить в рамочку и вручить как подарок вашему собеседнику. Ему будет очень приятно, ведь всегда интересно посмотреть на то, как оценивает вашу переписку алгоритм)
Variety and novelty in English lessons encourage learners to be more engaged. On the contrary, monotonous tasks, no matter how useful they are, cause boredom. How to bring variety without too many changes in the process of learning vocabulary? Use word clouds.
Word clouds are a graphical representation of words and words combinations. They can be used for:
- vocabulary revision
- presenting lexis
- practicing new words
- student’s projects.
It is just a more visually appealing way to teach vocabulary. Instead of using lists, which students are probably fed up with, make clouds. You can utilize them for word searches, making monologues and dialogues, word games, writing tasks, etc.
Here are some examples of the tasks.
Task 1
Make a story about a detective investigating a case using all the words and tell your partner (the teacher).
Task 2
Work in pairs. Ask and answer five questions using the words.
Task 3
Give a definition of one of the words. Can your partner guess the word? Swap roles.
There are some services for creating word clouds:
Word Art
Wordle
Word clouds
I personally prefer to use Word art because it’s possible to create clouds containing collocations. As we know teaching collocations is more effective for learners. Other services just break the word pairs into single words.
Let’s see how to create word clouds using Word art. It’s quick and easy, no registration is required. So click ‘Create’ and make your cloud.
Step 1
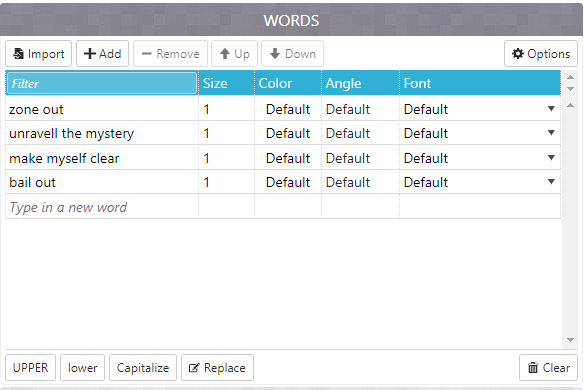
Fill in the words or word combinations. You can type as many words as you need, even 30 or even 50. It’s possible to Capitalize letters, use the UPPER or lower case. Click ‘Options’ and opt for repetition of the words as you see in one of the pictures above or choose no repetition.
Step 2
Choose the shape of your cloud: animals, nature, people or some holidays themes. If you want to see the changes, click the red button ‘Visualize’.
For example, this charming ladybird will definitely catch kids’ interest.
 Step 3
Choose a font which you like. There are more than 50 fonts to select.
Step 4
Pick out a layout: horizontal, vertical, crossing words, dancing words, slopes and random. The layout will depend on the task and the learners. Teens prefer something less ordinal and more creative. For adults, I usually make more conservative things like a horizontal layout.
Step 5
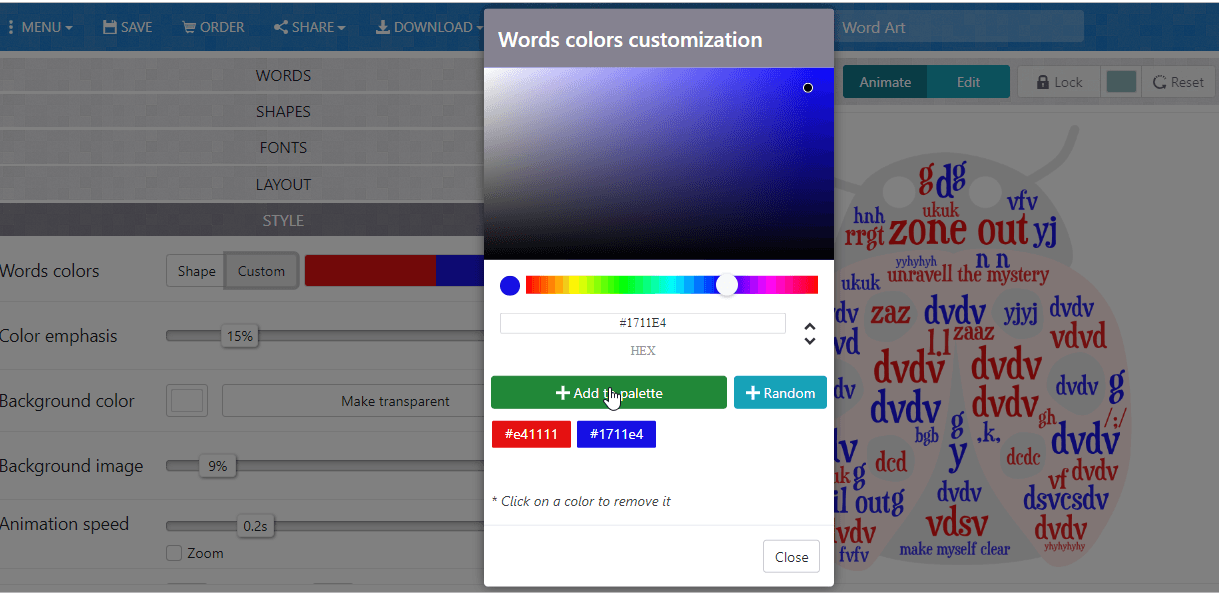
Choose a style: colours of the words and the background. If you want to change a colour of the words, click ‘Words colours’ and ‘Custom’ and add more colours to the pallette.
Step 6
To apply all the changes, press ‘Print’ or ‘Download’ your cloud and enjoy it in your lessons.
If you haven’t tried ProWritingAid’s Word Cloud Gallery, get ready to have your mind blown.
Looking to learn more about how ProWritingAid works? Our new eBook gives you all the information you need to start editing like a pro with ProWritingAid.
Download to learn how to customize your settings, use each of our 20+ in-depth reports, install our many integrations, and how you can get the most out of your ProWritingAid subscription.
What is a Word Cloud?
Google says a word cloud is “an image composed of words used in a particular text or subject, in which the size of each word indicates its frequency or importance.”
So, the more often a specific word appears in your text, the bigger and bolder it appears in your word cloud.
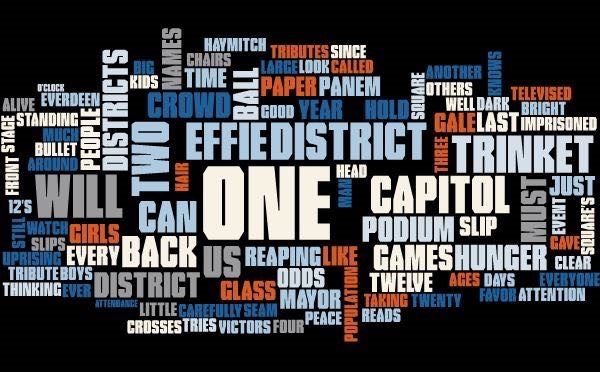
ProWritingAid has a Word Cloud Gallery that makes it easy to create word clouds based on the text you paste into the tool. Here’s what a word cloud based on the reaping scene in the first chapter of The Hunger Games looks like:
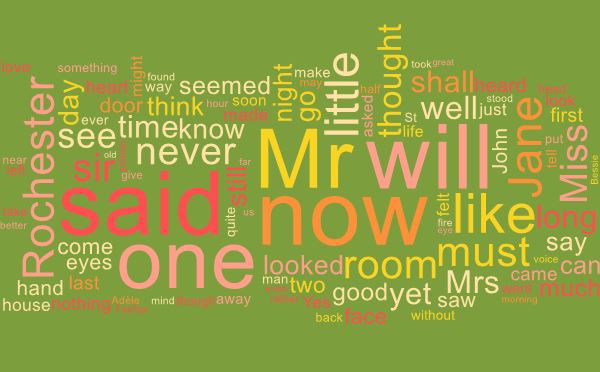
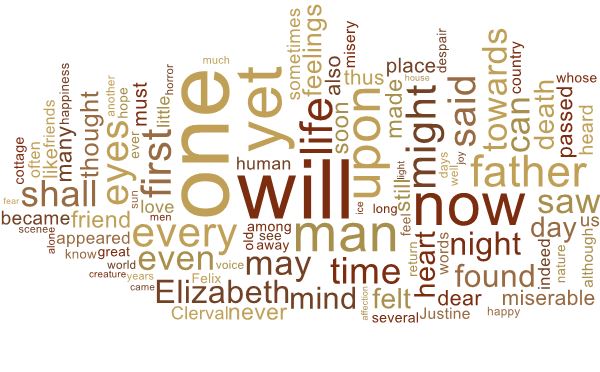
Below are a couple other word clouds. Can you recognise the novels from their word clouds?
Or, if you are up for a challenge, try our Word Cloud Game. Guess 10 classic novels from the word clouds that they generate.
Word Clouds For Fiction Writers
Every writer has words they like to use over and over. When we edit our own words, it’s hard to see what our overused words are. But when we use them too often, our writing sounds redundant. A word cloud can help you identify your overused words. The most commonly used words are the biggest. It’s easy to see if the big words are the words you want to use the most.
Do you have too many dialogue tags? If so, «said» will show up as a larger word. You can then go find places in your writing to add action or emotion beats. Do your characters smirk or shrug all the time? A word cloud can help you find the actions you repeat too often.
A word cloud can also make sure you are focusing on the right characters, themes, and plot points. If your book is about Jane, but Jack’s name is three times bigger, you might need to re-evaluate your manuscript. If your book is about a war, but the words «war» and «battle» are tiny on your word cloud, you’ll need to develop that plot more.
Word Clouds For Copywriters And Bloggers
Search engine optimization. It can be the bane of copywriters and bloggers everywhere. The algorithms are always changing. But it doesn’t have to be a mystery. The most important part of SEO is keywords.
Run your copy or blog post through a word cloud generator. Are your target keywords huge or tiny? What words have you inadvertently turned into SEO keywords? This will help you figure out exactly what edits you need to make to reach those high search engine rankings.
When To Use Word Clouds
For fiction, you can use word clouds of different scenes to compare how your characters feel about the inciting action. A word cloud will help you notice right away if your characters’ reactions are similar in both scenes. You’ll be able to identify where you should have a new reaction or a new emotion.
For business purposes, word clouds can help you find your customers’ pain points. If you collect feedback from your customers, you can generate a word cloud using customers’ language to help identify what is most important to them. Imagine if “long wait time” cropped up as major emphasis words in customer feedback. That should ring a warning bell.
If you are in the business-to-consumer writing industry, a word cloud will highlight overuse of technical jargon. You can make sure your language is accessible to consumers with a quick visual model.
When Not To Use Word Clouds
Simply dumping a scene from your current work in progress into a word cloud generator might show you that you used “said” a lot, but won’t give you the insights you want. But using word clouds to compare your scenes against each other can show you where they’re too similar, use too many of the same unimportant word choices, or simply aren’t consistent between scenes when they need to be.
Likewise, in copywriting for business, you wouldn’t use a word cloud when your content isn’t optimized for keywords. A word cloud on a blog post that’s not SEO enhanced won’t tell you much about your keyword density.
No matter what you’re writing, word clouds are something to use as a last step in your writing process. Word choice falls under «line edits.» If you have an unedited first draft, word clouds won’t help you much. You’ll likely need to make major structural changes before you use a word cloud.
How ProWritingAid’s Word Cloud Gallery Works
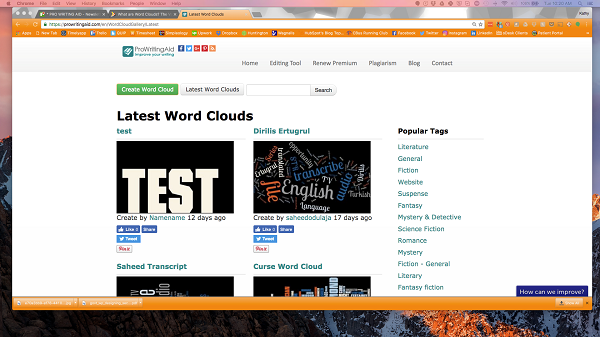
At the bottom of every page on ProWritingAid.com is a link under “Resources” called Word Cloud Gallery. When you click on that link, you get something that looks like this:
Notice at the top, you have options to “Create a Word Cloud” or search for the “Latest Word Clouds” by keyword. A sidebar on the right side contains popular tags to help you narrow your focus on already-generated word clouds.
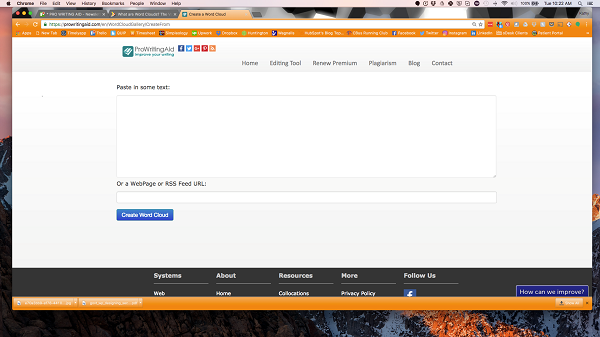
When you click on “Create Word Cloud,” it brings up the following screen:
Simply copy and paste your text into the box or enter your url, and click on “Create Word Cloud.”
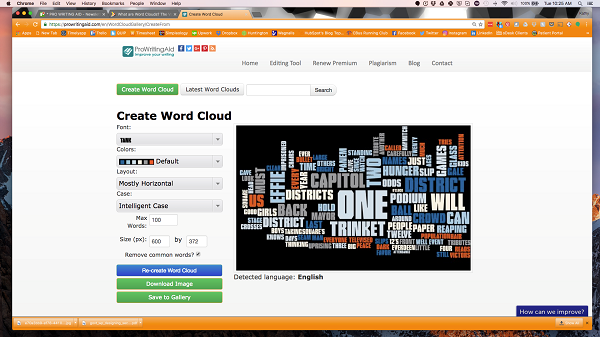
Here’s what your new word cloud looks like:
Notice you have an interesting graphical representation of the words in your text, which you can customize by choosing a font, color, and layout. You can also re-create the word cloud with new text, download the image to your computer, or save it to the ProWritingAid gallery so that others can see and use your word cloud.
Final Thoughts
Word clouds are fun to use as a visual aid with blog posts to underscore the keywords on which you’re focusing. Your readers will notice the larger, bold words and understand their importance to your post.
And for fiction writers, word clouds are great to make sure you’re focusing on the right words in your prose. It’s also interesting to see some of the word clouds in the ProWritingAid gallery that other writers have created, especially those in the genre-specific popular tags in the sidebar on the right.
Play our Word Cloud Game here.
How do you see word clouds helping your writing? Let us know if you’re a fiction writer or copywriter and how you might use a word cloud.
Or if you’ve already created a word cloud on ProWritingAid.com, let us know what insights you gained from it.
In the meantime, happy writing!
Find everything you need to know about using ProWritingAid in our Ultimate Guide. Download the free eBook now:
How to Use ProWritingAid
Join over 1.5 million authors, editors, copywriters, students and business professionals who already use ProWritingAid to improve their writing.

They say that a picture is worth a thousand words.
Guess what?
A Word Cloud Chart with a hundred words is enough. We’re sure you’ve seen these charts everywhere, including the business settings. A Word Cloud is a form of visualization for textual data. You only need texts to create this chart.
This blog will show some examples about how to create a Word Cloud. So keep reading to avoid missing valuable tips.
A picture is worth a thousand words. But when that image consists of a hundred or so words, it becomes super-effective. You can use Word Cloud visualizations to create a compelling data story for your audience. And this is because they are amazingly easy to read and understand.
You can use a Word Cloud Chart to visualize all sorts of data, from customer and employee surveys to keyword analysis.
In this blog, we’ve rounded up valuable tips and strategies you can use to create easy-to-read Word Cloud Charts for your data story. Besides, you’ll also uncover how you can leverage this visualization to stay ahead of your competitors. We will discuss following things in this blog:
- What is a Word Cloud Chart?
- How to Create a Word Cloud Chart? Step by Step Guide with Example
- What are the Uses of a Word Cloud?
- Why Create a Word Cloud?
- What is the Best Word Cloud Generator?
- How to Install ChartExpo In Google Sheets To Access the Word Cloud Chart For Free
- Practical uses of Word Cloud Chart
- What are the Benefits of Using Word Cloud Chart?
These tips and strategies are tested and proven by thousands of seasoned data visualization experts across the world.
So you won’t be wasting your valuable time reading this blog in its entirety.
What is a Word Cloud Chart?
Definition: A Word Cloud also known as tag clouds or text clouds, is a cluster of words in different sizes, colors, and orientations.
So how can you read this chart?
The more often a word occurs in the source text, the larger and more important the word appears. You can use Word Cloud images in multiple scenarios. For instance, if you’re a content writer, you need to create a Word Cloud to identify the search terms overused by competition to bump your SEO rankings.
This visualization chart breaks down bulky text data into high-level insights. Essentially, the larger a word’s size in the cloud, the more regularly it is used.
A Word Cloud Chart is a proven visualization that can engage, educate, and quickly capture your audience’s attention. Besides, it can empower audiences to assess swiftly which text is the most popular.
One of the most appealing characteristics of Word Cloud Chart is that they provide insights effortlessly from a large amount of data. So you don’t have to waste your time counting or poring textual notes for answers.
Now that you’re familiar with the Word Cloud: let’s check out its benefits. Why does this visualization matter to you?
How to Create a Word Cloud Chart? Step by Step Guide with Example
Examples are the best way to learn about ways to create a chart. Following Word Cloud example will help you learn how to create this chart in few clicks without any coding.
Let’s assume you’ve hired a transcriber to decode the audio interviews into a written narrative. Let’s use the tabular data below for our scenario.
The count is the frequency a particular word was mentioned by the hotel guests in a particular context.
| Tag | Count |
| Staff | 1240 |
| Restaurant | 576 |
| Well | 1133 |
| Crowded | 571 |
| Comfortable | 756 |
| Information | 897 |
| Carpets | 1052 |
| Distance | 1254 |
| Reception | 859 |
| Clean | 377 |
| Unfriendly | 493 |
| Wi-Fi | 1769 |
| Parking | 984 |
| best | 426 |
| Dirty | 1055 |
| Line | 718 |
| Polite | 545 |
| Hall | 1163 |
| Responding | 775 |
| Bars | 1296 |
| Grand | 819 |
| Recipe | 648 |
| Cafe | 602 |
| Kitchen | 1045 |
| Party | 784 |
| Eating | 2060 |
| Plate | 1193 |
| Modern | 733 |
| Flower | 399 |
| Lifestyle | 840 |
| Knife | 1952 |
| Chef | 1722 |
| Shop | 1877 |
| Gourmet | 1070 |
| Occupation | 271 |
| Traditional | 1360 |
| Romance | 679 |
| Menu | 196 |
| Chair | 498 |
| Interior | 1616 |
| Dish | 1583 |
| Furniture | 2116 |
| Crystal | 1688 |
| Lunch | 380 |
| Meal | 1216 |
| Luxury | 83 |
| Drink | 1719 |
| Grinder | 1393 |
| Table | 1615 |
| Romantic | 282 |
| Decoration | 2055 |
| Seafood | 592 |
| Decoration | 589 |
| Vacation | 1534 |
| Glass | 1981 |
| Business | 474 |
| Wine | 812 |
| Customer | 1117 |
| Light | 1633 |
| Cocktail | 863 |
| Beautiful | 773 |
| Sitting | 1139 |
| Order | 915 |
| Dinning | 458 |
| Dinner | 518 |
| Food | 986 |
| Cutlery | 2230 |
| Fork | 1091 |
| Eat | 815 |
| Coffee | 717 |
| Set | 1921 |
| Couple | 2063 |
| Elegant | 109 |
| Dating | 1055 |
Now prepare the data in the sheet and select Word Cloud Chart from the list.
- Now Select Sheet Name (sheet holding your data).
- Click Add new metric and select the column with a numerical value (Count).
- Click Add New Dimension button and select the column with textual data (Tag)
- Click on Create Chart
Check out the resulting Word Cloud Chart.
Insights
-
- The issue of hygiene should be dealt with to avoid customer churning. You need to figure out to know why customers are using the words Dirty and Carpets to describe the poor hygiene levels of the hotel brand.
-
- Parking problems need to be sorted out by hiring more valets to ease congestion and reduce waiting times of the guests.
- The reception and staff professionalism of the hotel seems to satisfy the hotel guests. Besides, guests find the employees informational. There’s a need to build on this strength further.
There seem to be feedback about Cutlery and Decoration of the hall, which might be positive and liked by the guests.
What are the Uses of a Word Cloud?
Following are few uses of a word cloud.
-
Survey Results Visualization
You can use a Word Cloud Chart to visualize the recurring words from survey data. In other words, it’s one of the quickest ways of getting high-level insights from survey results.
For instance, you can use this chart to visualize the words that your target market uses to describe your brand. Recurring negative opinions and sentiments associated with your brand are a bad sign.
Besides, this is a cue that you need to take action before things get out of hand.
Next time you’re conducting a survey to create a data story, use a Word Cloud Chart. You’ll be surprised by the high-level insights you’ll uncover using this cutting-edge visualization.
-
Competitor Keyword Research
One of the smartest ways of using a Word Cloud is spying on the SEO game of your competitors. All you need is to copy all the textual information from their websites and visualize it using a Word Cloud Chart.
Ideally, the most recurring words are the keywords you should consider depending on their performance.
If keywords already work for your rivals, why don’t you leverage them as well?
There are tools with a Word Cloud chart that’s designed to separate noise from your data, such as emojis, punctuations, etc. Next time you think of conducting surveillance on your close competition’s search engine optimization (SEO) game, use a Word Cloud.
-
Content Creation
Every content writer has words they like to use repeatedly.
When you edit your words, it’s immensely difficult to see terms you’ve used repeatedly. Remember, overusing certain words can cause your whole content to sound redundant.
This is where a Word Cloud Chart comes in to help you identify the redundant words in your content. This chart shows you the most overused words by highlighting them by size and color. It’s incredibly easy to spot recurring words in your content without wasting time or breaking a sweat.
Do you have too many dialogue tags in your writing?
If so, the term “said” will show up as a larger word. Do your personas smirk or shrug all the time? A Word Cloud Chart can help you find the actions you repeat too often.
Use this chart to ensure you’re focusing on the right characters, themes, and plot points.
For instance, if your content is about Jane, but Jack’s name is three times bigger, you might need to re-evaluate everything. If you’re curating content about war, but the words “war” and “battle” are tiny on your Word Cloud: you’ll need to develop that plot more.
The Word Cloud Chart has a special place for copywriters and bloggers. Why?
Search engine optimization (SEO) is really a bane of copywriters and bloggers everywhere. And this is because algorithms are constantly changing. But with a Word Cloud Chart, SEO doesn’t have to be a mystery. Remember, the most essential part of SEO is keywords.
Yes, the words people input in search engines when they want to sort out a need or want. Run your copy or blog post through a Word Cloud tool.
Are your target keywords huge or tiny?
What words have you inadvertently turned into SEO keywords? This chart can help you figure out precisely what edits you need to make to bump up your search engine rankings and resonate more with the target market.
Bonus! You can use a Word Cloud Chart generator to preview how your content appears to Google crawlers. While it won’t reveal the more technical elements of SEO, such as headers, backlinks, and alt tags, it does help you see the general message that your page conveys.
This is important because when Google “looks” at your page, it does so by scanning its content and code. You might think you’re getting the right points across.
But do your keywords really dominate?
The Word Cloud Chart can reveal if you’re giving enough attention to the keywords that matter.
-
Employee Sentiment
When you ask employees to share their feedback and opinions about the workplace, what do you do with those responses?
Remember, it’s difficult to turn this kind of unstructured data into meaningful action if you don’t know where to start.
This is where the Word Cloud Chart comes in.
If you can see which points your employees are discussing frequently, you can make valuable and meaningful changes that can:
- Boost morale
- Strengthen company culture
- Improve performance
-
Spotting Technical Jargons
How can you present highly technical researching findings to a non-technical audience, such as a board of directors?
You guessed right.
You should use a data story that’s free of technical jargon. How can you spot and remove jargon from your data story or presentation? Use a Word Cloud chart to separate jargon words that may confuse your audience and render your data narrative ineffective.
Why Create a Word Cloud?
Data visualizations (like charts, graphs, infographics, and more) give you a valuable medium to communicate important information at a glance.
But what if your raw data is text-based?
If you want a stunning visualization format to highlight significant textual data points, use a Word Cloud Chart. It can make dull data sizzle and immediately convey crucial insights.
If you’ve stared blankly at lengthy data or long pages of text, you can relate.
With so many insights to comprehend, how do you know where to begin?
Word Cloud Chart can help simplify this process. If you’ve ever looked at a jumble of disparate words that seem to not correlate until you investigate further: You know the benefit of this chart.
Let’s check out how you can best deploy this visualization to uncover in-depth insights from your data.
-
Uncover Patterns in Textual Data
Charts, graphs, and other data visualizations can help you identify key patterns. However, pulling these same insights from qualitative data can prove cumbersome at best and impossible at worst.
A Word Cloud generator makes this process easy peasy. The words you see overpowering the others in this chart are your salient points and overlapping themes.
-
Supercharge your Content Creation Strategy
This chart can help you spot redundant words that spoil the flow and impact of your writing. Besides, you can easily know whether your content is aligned with your target themes, topics, and most importantly, relevant keywords.
-
Uncover Your Target market’s Pain Points with Ease
Word Cloud Charts can help you find your customers’ pain points. If you collect feedback from your customers, generate a Word Cloud using their language to identify what matters the most to them.
For instance, if “long wait time” is highlighted by a Word Cloud, then this is your target market’s pain.
-
Eliminate Jargon in Your Texts for Smooth and Engaging Communication
If you’re a business-to-consumer content marketer, this chart can help you fine-tune your sales messages by highlighting technical jargon. Use this chart to ensure your language is accessible, understandable, and resonates with your target market.
Essentially, if you want visualization that lends clarity to your data story effortlessly, use the Word Cloud Chart.
So far, you’ve learned about Word Cloud, its application, and most importantly, why you should use it for your data story.
Now let’s head to the practical part of the blog: the actual tools for generating this chart.
What is the Best Word Cloud Generator?
Let’s talk about Google Sheets because it’s one of the most used tools for data analysis and visualizing data besides Excel.
This spreadsheet app is top-rated because it’s easy to use. Besides, it has been there for years, making it familiar to almost anyone who works with data.
So how can you use Google Sheets to create Word Cloud Charts that are easy to read and interpret?
Remember, for a data story to be compelling to your target audience, it should have charts that lend clarity. You don’t want critical insights to be obscured by unnecessary stuff, such as heavy colors.
Well, Google Sheets has no templates for Word Cloud. We understand that this is very disappointing, but it’s the reality. So if you have bulks of textual information from a survey or a rival’s blog, Google Sheets is not the go-to tool.
So What’s The Solution?
The solution is not to ditch Google Sheets. No, we’re not advocating you to do away with the spreadsheet tool you’ve known for years.
You just need to supercharge it with an add-on to make it a reliable partner for data visualization.
Google knew very well it’s impossible to cater to all the data visualization needs you may have. And that’s why they came up with a store where you can access third-party add-ons to get various specialized tasks done with ease.
Well, there’s a reliable and incredibly easy-to-use add-on called ChartExpo. And it comes jam-packed with Word Cloud templates and other cutting-edge 50-plus charts.
What is ChartExpo?
The ChartExpo is a cloud-hosted add-on that transforms your Google Sheets into a highly responsive data visualization tool.
Wait! That’s not all.
This highly affordable data visualization tool comes with over 50 chart templates to grant you a broader choice of visuals to select. With ChartExpo, you don’t need to know programming or coding. Yes, it’s that easy peasy to use.
So when you’re curating a data story, feel confident you have a reliable data visualization buddy on your side. ChartExpo provides you unlimited freedom to customize your Word Cloud diagram.
Remember, you can highlight the key insights you want your audience to take in with ease. You just need a few mouse clicks to access a Word Cloud Chart that fits seamlessly within your data narrative.
Let’s head to the meaty part of the blog: the section where you get to practice what you’ve learned. Follow the simple steps below in preparation for the next section.
How to Install ChartExpo In Google Sheets To Access the Word Cloud Chart For Free
You need to install ChartExpo for Google Sheets Add-on.
Then follow the simple and easy steps below.
-
- Open your Google Sheets desktop application.
- Open the worksheet and click on the ‘Add-ons’ menu.
- You’ll see the ‘ChartExpo’ option in the dropdown menu.
- Click on ‘ChartExpo’ to install your Add-on.
-
- If you don’t, please click on the ‘Refresh’ button.
- Again select ChartExpo add-on and click on the ‘Insert’ button
- The add-on will be added to the Google Sheets application, as shown in the screenshot below.
-
- You’ll see an extensive library of visual charts categorized into 6 different groups.
- Click the PPC Charts Tab, as shown below.
- After clicking on the PPC Charts tab, you’ll see all the charts and Word Cloud Chart is one of them.
Practical uses of Word Cloud Chart
Imagine you’ve just conducted a survey for a hotel brand.
You’ve conducted personal interviews and recorded opinions from hotel guests regarding brand perception in various key areas, namely:
- Employees
- Restaurant
- Customer service
- Bars
- Hygiene
- Hotel facilities
- The general atmosphere, etc.
What are the Benefits of Using Word Cloud Chart?
ChartExpo (add-on for Google Sheets) is an interactive Word Cloud generator designed to ensure the most repeated keywords stand out without much highlighting using colors. Unlike other tools, you don’t need to code using python to access Word Cloud Charts that are easy to read and interpret.
Besides, this easy-to-use Word Cloud template automatically detects the collocations (words that often go together) in sentences, paragraphs, and documents, to offer you more context than other Word Cloud tools.
Guess what?
You have total freedom to customize and edit your Word Cloud Chart to align with your data story. Yes, you heard that right. More so, you can customize fonts, layouts, and color.
Lastly, it has a super-cool interface to help you discover the most frequent and profitable keywords your competition is hoarding.
Wait! There’s more for you.
We’ve only covered about one chart (Word Cloud) in ChartExpo. Well, the ChartExpo add-on is a visualization juggernaut you can rely on to create compelling data stories for your audiences.
So what are the benefits of ChartExpo besides being a Word Cloud Generator for seasoned data experts?
ChartExpo comes with an incredibly user-friendly interface to ensure you don’t have to waste time visualizing complex data. Besides, the cost of accessing over 50-plus chart templates is only $10 a month. And this is not to mention a 7-days FREE trial you get once you sign up.
Note, you’re not installing anything on your computer. So you don’t have to worry about viruses and malware because Google Sheets is cloud-hosted.
- ChartExpo add-on for Google Sheets comes with a free 7-days trial.
- So if you’re not satisfied with the tool within a week, you can opt-out as quickly as signing up for a trial.
- ChartExpo add-on is ONLY $10 a month after the end of the trial period.
- You have a 100% guarantee that your computer or Google Sheets won’t be slowed down.
- You can export your insightful, easy-to-read, and intuitive charts in JPEG and PNG, the world’s most-used formats for sharing images.
FAQs:
How do you explain word clouds?
Word clouds (also known as text clouds) work in a simple way: the more a specific word appears in a source of textual data (such as a speech, blog post, or database), the bigger and bolder it appears in the word cloud. A word cloud is a group, or cluster, of words depicted in different sizes.
What is word cloud good for?
Word cloud presents a low-cost alternative for analyzing text from any source e.g. surveys, plus it’s much faster than coding. Essentially, word clouds work by breaking the text down into component words and counting how often they appear in the body of text.
How do you visualize text analysis?
The simplest and most familiar form of text visualization is a word cloud. They depict tags arranged in space varied in size, color, and position based on the frequency, categorization, or importance. Font size is the important thing to consider as it mentions the frequency or value of the word.
Wrap Up
It’s crystal clear that the Word Cloud Charts are among the best visualizations to use for your data story. And this is because they are easy to read and interpret.
Essentially, if you use these charts in your data narrative, your audience will find them easy to read and interpret.
This you might have got the idea by having example of how to create a Word Cloud.
If you have textual data and want quick and high-level insights without wasting time, use ChartExpo library for creating Word or Word Cloud.
Download PC Repair Tool to quickly find & fix Windows errors automatically
Microsoft Word is not only useful for typing or editing, but it can also be used for photo editing too. It might not be as advanced as Photoshop and other advanced photo editing programs, but it can create posters, brochures, greeting cards, and Word Clouds. A Word Cloud is a cluster of words portrayed in different sizes. It is also known as a text cloud or tag cloud. The bigger the word is, the more it is important. Word Cloud is used in textual data such as Blog posts, speeches, databases, interviews, and other texts. In this tutorial, we will explain how to create a Word Cloud in Microsoft Word.
Follow the steps below to create a Word Cloud in Microsoft Excel:
- Launch Microsoft Word.
- Go to the Insert tab and click Get Add-ins.
- In the search engine, type Word Cloud, then press Enter.
- Select the Pro Word Cloud option.
- Click Continue.
- Highlight the paragraph you have in your document.
- In the pane, you can customize the Font, Colors, Layout, and Cases.
- You can also select the Maximum Words, increase or decrease the size or remove common words by unchecking its check box.
- Then click Create Word Cloud.
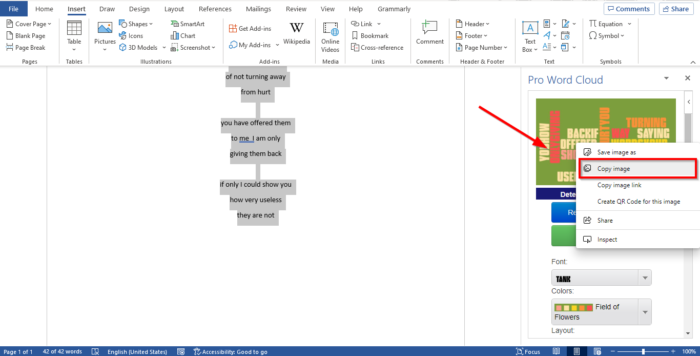
- Right-click the Word Cloud display in the Pro Word Cloud pane and select Copy image and paste it into the document and remove the original text.
Let’s see this in detail.
Launch Microsoft Word.
In your Word document, you can type a paragraph or copy a paragraph from a digital book or off the internet.
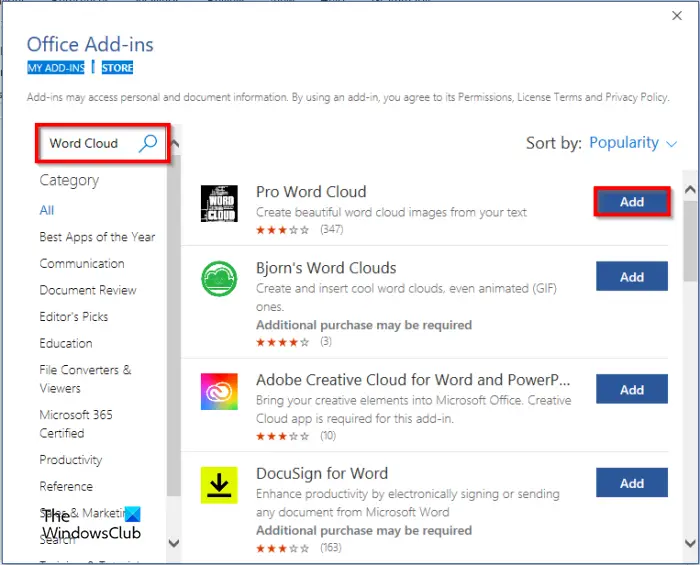
Go to the Insert tab and click Get Add-ins in the Add-ins group.
An Office Add-ins dialog box will open.
In the search engine, type Word Cloud, then press Enter.
A list of Word Cloud apps will pop up, choose Pro Word Cloud, and click the Add button.
A window will pop up displaying the License Term and Policy, then click Continue.
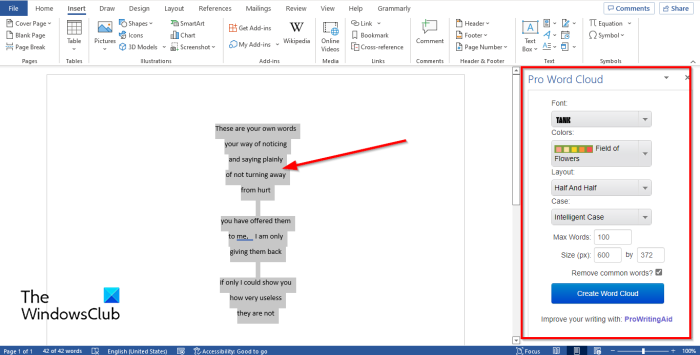
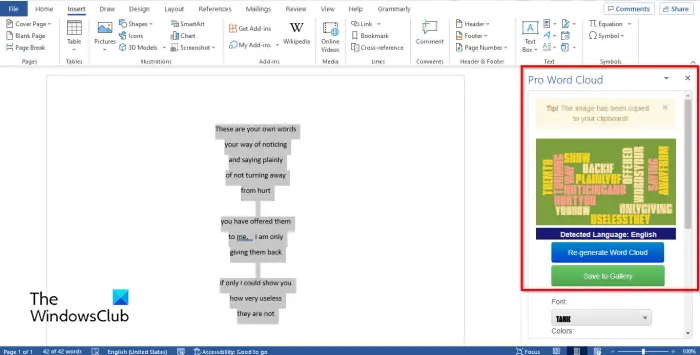
A Pro Word Cloud pane will appear on the right with some settings.
Highlight the paragraph you have in your document.
In the Pane, you can customize the Font, Colors, Layout, and Cases by clicking their drop-down arrows and selecting an option.
You can also change the Maximum Words, increase or decrease the Size or Remove common words by unchecking its check box, if desired.
Then select the Create Word Cloud button.
You will then see a display of the Word Cloud on the right; you can choose to Re-generate Word Cloud, it means to switch to a different display of the Word Cloud.
You can also choose to save your Word Cloud by clicking Save to Gallery if desired.
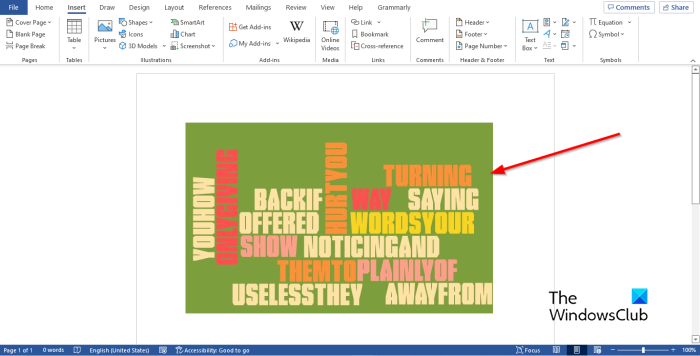
To add the Word Cloud to your document, right-click the Word Cloud display in the Pro Word Cloud pane and select Copy image and paste it into the document and remove the original text.
Close the Pro Word Cloud pane.
Now we have a Word Cloud in Microsoft Word.
We hope this tutorial helps you understand how to create Word Cloud in Microsoft Word.
READ: How to make Font blurry in Microsoft Word
Where can I create a Word Cloud?
You can create a Word Cloud using Microsoft Office, so you do not have to use some advanced programs. You can use Microsoft Word and PowerPoint, which can create some great Word Clouds by using the Word Cloud add-in apps offered by Microsoft.
READ: How to insert Text in Circle OR Circle Text in Microsoft Word
How do I make a Word Cloud for free?
Word Cloud is a cluster of words, and you can make one for free online. You can make Word Clouds on a website called wordclouds.com, where you can paste text and open a document or a URL to generate a Word.
Shantel has studied Data Operations, Records Management, and Computer Information Systems. She is quite proficient in using Office software. Her goal is to become a Database Administrator or a System Administrator.

Creating a word cloud in Google Docs is a creative way to visualize the text you’re working on. It allows you to see what words are being used the most, so you can get a quick sense of your themes emerging in your writing.
- In a Google Doc, navigate to the top your screen. Click Add-ons > Get add-ons.
- Search for Word Cloud Generator.
- Once you find it, click on the “+ Free” button to install the add-on. You’ll get a notification in Google Docs that Word Cloud Generator has been added to your add-ons menu.
- To create your word cloud, click on Add-ons > Word Cloud Generator > Create Word Cloud.
- The word cloud will form on the right side of your page, and it’ll be based on the words that are most commonly used in your document. The larger words indicate that they’re used more frequently. If you click on Append top word counts, it’ll create a table in your document that lists how many times each of your top words appears in your document.
Click here to watch this video on YouTube.
Categories
Sign up for our newsletter
Data visualizations (like charts, graphs, infographics, and more) give businesses a valuable way to communicate important information at a glance, but what if your raw data is text-based? If you want a stunning visualization format to highlight important textual data points, using a word cloud can make dull data sizzle and immediately convey crucial information.
When you’re looking at an in-depth data analysis, do you find it difficult to discern which points are the most important?
Anyone who’s ever stared blankly at a lengthy database or long pages of text can relate. With so many insights to comprehend, how do you know where to begin?
Word cloud generators can help simplify this process.
If you’ve ever looked at a jumble of disparate words that seem to have no correlation until you investigate further, you’ve seen a word cloud. These are powerful tools across myriad industries, from art to science.
Today, we’re exploring their use in the field of data visualization. Along the way, we’ll share how your organization can use them to help pinpoint important issues and better direct your steps forward.
Ready to learn more? Let’s get started!
What are Word Clouds?
Word clouds (also known as text clouds or tag clouds) work in a simple way: the more a specific word appears in a source of textual data (such as a speech, blog post, or database), the bigger and bolder it appears in the word cloud.
A word cloud is a collection, or cluster, of words depicted in different sizes. The bigger and bolder the word appears, the more often it’s mentioned within a given text and the more important it is.
Also known as tag clouds or text clouds, these are ideal ways to pull out the most pertinent parts of textual data, from blog posts to databases. They can also help business users compare and contrast two different pieces of text to find the wording similarities between the two.
Perhaps you’re already leveraging advanced data visualization techniques to turn your important analytics into charts, graphs, and infographics. This is an excellent first step, as our brains prefer visual information over any other format.
Yet, what do you do if your raw data is text-based in nature?
Much of the research your organization conducts will include at least some form of an open-ended inquiry that prompts respondents to give a textual answer.
For instance, you might ask current customers what they like or don’t like about your new product line. Or, you could ask them to give suggestions on how your organization could improve. They could also have the chance to elaborate on any pain points they’re experiencing.
There are industry tools that allow you to code such open-ended data so users can understand it quantitatively. Yet, these don’t come cheap. Word clouds offer a cost-effective, yet powerful, alternative.
With these, you can still quantify your text-based insights into measurable analytics. The only difference? You won’t create a chart or graph as you would with a set of numbers.
Instead, you’ll create a word cloud generator to transform the most critical information into a word cloud.
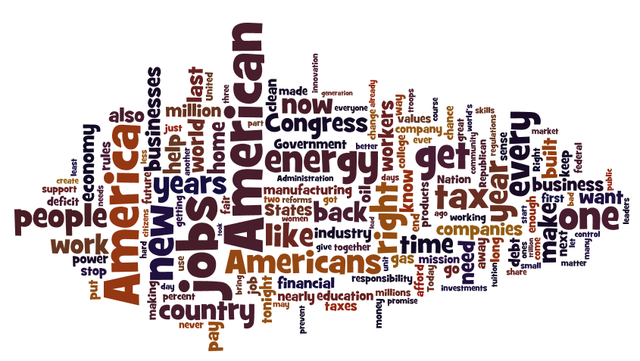
Here’s an example from USA Today using U.S. President Barack Obama’s State of the Union Speech 2012:
As you can see, words like “American,” “jobs,” “energy” and “every” stand out since they were used more frequently in the original text.
Now, compare that to the 2014 State of the Union address:
You can easily see the similarities and differences between the two speeches at a glance. “America” and “Americans” are still major words, but “help,” “work,” and “new” are more prominent than in 2012.
Using word clouds isn’t exclusively for creating presidential eye candy. Keep reading to discover how word clouds can benefit your business.
Where Word Clouds Excel for Businesses
In the right setting, word cloud visualizations are a powerful tool. Here are a few instances when word clouds excel:
- Finding customer pain points — and opportunities to connect. Do you collect feedback from your customers? (You should!) Analyzing your customer feedback can allow you to see what your customers like most about your business and what they like least. Pain points (such as “wait time,” “price,” or “convenience”) are very easy to identify with text clouds.
- Understanding how your employees feel about your company. Text cloud visualization can turn employee feedback from a pile of information you’ll read through later to an immediately valuable company feedback that positively drives company culture.
- Identifying new SEO terms to target. In addition to normal keyword research techniques, using a word cloud may make you aware of potential keywords to target that your site content already uses.
When Word Clouds Don’t Work
As mentioned, word clouds aren’t perfect for every situation. You wouldn’t use a pie chart to show company revenue growth over time, and you shouldn’t use word clouds for every application, either. Here’s when you want to avoid using a word cloud.
- When your data isn’t optimized for context. Simply dumping text into a word cloud generator isn’t going to give you the deep insights you want. Instead, an optimized data set (one handled by an experienced data analysis team) will give you accurate insights.
- When another visualization method would work better. It’s easy to think “Word Clouds are neat!” and overuse them — even when a different visualization should be used instead. You need to make sure you understand the right use case for a word cloud visualization.
There are many other instances when a different visualization should be used over word clouds. (Feel free to contact one of our data analysts to learn more.) More complex data sets and projects require a team of developers and designers for a complete transformation. In could an infographic or dashboard, but word cloud applications are limited to, well, words.
What is a Word Cloud Generator?
As its name implies, an online word cloud generator is a tool that scans a body of text, turning it into component words.
From there, it can create a word cloud that highlights the most frequently mentioned words. If you don’t prefer the cluster shape, most tools enable you to format the word cloud in various ways, including:
- Horizontal lines
- Columns
- Formed to fit a certain shape
Most providers will also allow users to choose different layouts, fonts and color schemes depending on their preference. This means you can make one to match the color scheme of your brand, your partners, or your clients.
While the color used on a word cloud holds a primarily aesthetic value, you can contrast the hues to help categorize words or illustrate a separate data variable.
Why Use a Word Cloud Generator?
Think word clouds aren’t relevant to your organization? Think again.
These are an unexpected yet powerful way to display important data visualizations. Let’s take a look at a few of the top ones.
1. Understanding Client Issues
How are you currently analyzing your customer satisfaction levels? From polls and surveys to social media posts and more, your audience is talking about your brand.
As they do so, they’re delivering valuable insights into the psyche of your target customer. What’s making them tick and what to do they love? Are there any issues that seem to pop up time and again?
It can be difficult to find the answers to these questions if you’re simply reading each comment on an individual basis. Yet, when you create a word cloud with this feedback, you can quickly visualize what everyone is talking about.
For instance, you might notice that phrases such as “wait time” or “attitude” appear to dominate the cloud. This can reveal your customers’ pain points.
Or, you might see positive terms such as “affordable” and “customer service” towering over others, revealing what you’re doing right. Either way, you’ll know which topics to focus on at your next meeting, and you’re already one step in the direction of change.
2. Quickening Business Actions
That important marketing research report just came in at 5:00 p.m. The only problem? It’s 50 pages long.
You’d love to read through it line by line, but you don’t have enough hours in the day, and you’re supposed to give a brief on the data the next morning. This is where a word cloud generator can help.
When you copy the text into the generator and let it do its job, you can see in seconds which talking points appear the most frequently. Then, you’ll know where to start your search to hit the most important parts.
3. Analyzing Employee Sentiment
When you ask employees to share their feedback and opinions about the workplace, what do you do with those responses? It can be difficult to turn this kind of unstructured data into meaningful action if you don’t know where to start.
This is where word cloud visualizations can help.
When you’re able to see which points your employees are discussing at the highest rate, you’ll know how to make valuable and meaningful changes that can boost morale, strengthen company culture, and improve performance.
4. Simplifying Technical Data
You could present highly technical researching findings to a non-technical audience, such as your community board of directors. Yet, when you do so, it’s common to look into an audience of blank stares.
When you present a word cloud instead, you’re able to share the same findings in a more accessible and engaging way. This expands your reach and enables you to share important information in a way that doesn’t require advanced technical understanding.
5. Searching for Patterns in Data
With quantitative data, charts, graphs, and other data visualizations can help you identify key patterns. However, pulling these same insights from qualitative data can prove cumbersome at best and impossible at worst.
A word cloud generator makes this process a cinch. Those words you see overpowering the others? Those are your salient points and overlapping themes.
These would be difficult to find in a tabular format, but they pop out in a word cloud.
6. Search Engine Optimization
You have a good basic grasp on the kinds of keywords that your target audience wants to see. In fact, you might even use a keyword generator to find the most popular ones in your industry niche.
However, do you really know how Google sees your website?
The answer to this question can make or break your Search Engine Optimization (SEO) strategy.
You can use a word cloud generator to see how your content appears to Google bots and similar machines. While it won’t reveal the more technical elements of SEO such as headers, backlinks, and alt tags, it does help you see the general message that your page conveys.
This is important because when Google “looks” at your page, it does so by scanning its content and code. You might think you’re getting the right points across, but do they really dominate? Your word cloud can reveal if you’re giving enough attention to the keywords that matter.
How to Make a Word Cloud
As shown by their increasing popularity, making a word cloud for your website or business isn’t difficult, but there are some important considerations that need to be made so your visualization is more than just eye-candy. While word clouds can be incredible tools for data visualization, it’s important to understand how to use them the right way.
Step 1: Optimize Your Data Set
First, you’ll want to get a valuable, text-based data set. Make sure the data set you’re using is both text-based and optimized for context. Copying and pasting just any textual data into a word cloud generator might not give you the exact insights you need.
Not sure where to begin?
Our team of data analysts is skilled in taking unstructured text and turning it into an optimized data set. First, we’ll help you make sure the source data you’re referencing is both usable and actionable. Then, we’ll compile it in a way that draws out the most interesting and relevant content. Having an experienced analyst compile this helps to ensure your source data is actually usable.
Step 2: Use a Word Cloud Generator Tool
Once your data set is in place, your next step is to run it through a word cloud generator tool. Many businesses like and use Wordle, but there are many others you can try, too (such as Tagxedo and WordItOut). The downside to these free tools is many sites, including Wordle, automatically add all text clouds to their portfolio. This means any site visitor can see it, potentially undermining your marketing efforts. (Check your individual tool’s policies to see if your word cloud will be used in this way.)There are many online resources and apps you can use to perform this step, including:
- Wordle
- Tagxedo
- Tag Crowd
- WordItOut
- Word Cloud Generator for Chrome
- Word Cloud Python tools
- Google Word Cloud tools
Step 3: Export the Word Cloud
Once you create your word cloud, you need to move it from the program to your files. Some platforms will enable you to download the image as a PDF, although many won’t make that easy. In some cases, you’ll have to take a screenshot of the image and save it that way.
Before you close out of the program and start reviewing the data, there’s one security precaution to keep in mind.
While most of the programs above are either free or low-priced, keep in mind that there can be some drawbacks to the convenience they offer. For instance, any time you create a word cloud in Wordle, it saves it to its virtual portfolio.
This might not be a deal-breaker if the data you’re compiling and analyzing isn’t confidential or highly sensitive. Yet, if you work in an industry (such as healthcare or banking) that emphasizes confidentiality and customer data protection, this can render the service unusable.
It’s also a drawback if you’re using a word cloud for marketing purposes. If anyone can search Wordle’s portfolio, there’s nothing stopping them from tapping into your most compelling data.
An easier, safer and all-around better route to take? Create your word cloud from scratch rather than relying on an online program to do the work for you.
Exporting your word cloud from a free tool might take some work. Sometimes, if download as an image or PDF isn’t available, you’ll be forced to take a screenshot – a less-than-elegant solution.
Here’s what to do if you really want your word cloud to be noticed: consider designing your word cloud from scratch!
Does this sound like a lot for you to handle in-house? Not all companies have (or need) an in-house data analyst. Our experienced team at Boost Labs has experience working with enterprise clients such as the U.S. Census Bureau, small businesses like individual websites, and everything in-between.
Creating Your Own Word Cloud
Sure, it’s simple to plug your text into a virtual generator and receive your custom word cloud in seconds. Yet, as we’ve discussed, this can put your most critical data sets in a vulnerable position.
Instead, why not let our team take the reins and create a one-of-a-kind word cloud that’s all yours? This eliminates the risk of your information falling into the wrong hands.
A data visualization expert can also help you pinpoint the most cloud-worthy parts of your unstructured data set so you’re not sifting through tomes of irrelevant data, attempting to make disjointed parts connect.
We’ll work with the most insight-rich parts and deliver a personalized graphic that you can use in your short-term and long-term department planning efforts.
The Best Word Cloud Generators Are Custom
Around the world, we’re creating and sharing more data than ever before and the trend shows no sign of stopping down.
From sales numbers to online traffic rates, you’ve likely got plenty of quantitative data to analyze and discuss. Yet, are you making as much use out of your qualitative inputs?
These are often some of the most insightful data points your organization can leverage. They’re full of opinion, long-form feedback, and personal reflection. Word cloud generators can help make the most of this content, one visual at a time.
Are you ready to discover the power of word clouds for yourself? We’d love to help.
We’re data visualization experts, dedicated to helping companies turn mind-numbing data into interactive and informative graphics, charts, tables and more. Contact us today and let’s discover something new together.


