This is the first in a series of articles about Tables in Word. It covers Word 2007 and Word 2010, and will include Word 2013 in time. The following articles will cover all of the different types of table and option in detail, as well as useful features such as how to retain your table heading line on every page of your document.
Why use tables in Word?
Tables can be a very useful way to show information in an easy-to-read form, and are essential if you have a lot of data – in words or numbers – to share with your readers. There are many different ways to construct tables in Word, so this post will show you the basics, then further posts will elaborate on each method.
How do I insert tables in Word?
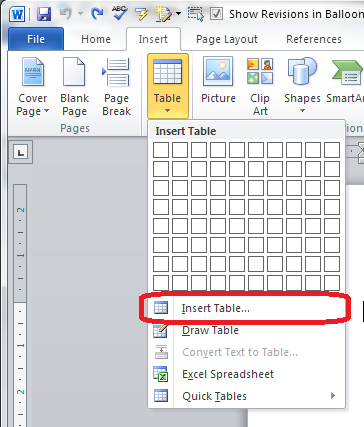
To put a table into a Word document, you need to choose the Insert tab and then look for the (very small) Tables section. There you will find a Tables button …

Press the Tables button and you’ll be shown a grid followed by a list of other options:

We will now take a quick look at all of these options in turn.
Insert table
The first option gives you a grid which you can highlight to create the table you want. The squares represent the number of rows and columns you want, although on the page, the columns will fit to the width of your page and the rows will be one line deep.
Move your mouse over the grid and the table will appear on the document behind the menu:

Let go, and there’s your table (we’ll learn about adding and deleting rows and columns in another post).
Insert table (2)
The first text option on the list below the grid is, rather confusingly, also called Insert table. But if you choose this option, you’ll find a rather more familiar and in some ways simpler menu.
The Insert Table menu allows you to choose the number of columns and rows by moving the up and down arrows for each. We’ll look at the other options later. For now, these choices will give you a table five columns across and two rows down when you click OK:

Draw table
The Draw table option allows you to hand draw the cells of your new table.

The Table tab will open up and Draw Table will be highlighted. You get a cursor that looks like a pencil and you have to draw each cell with that (there’s an eraser next to the draw button).

I personally find this really fiddly to use: you do have to play with it a bit to work out what to do with it. But I suppose it must be useful!
Convert text to table
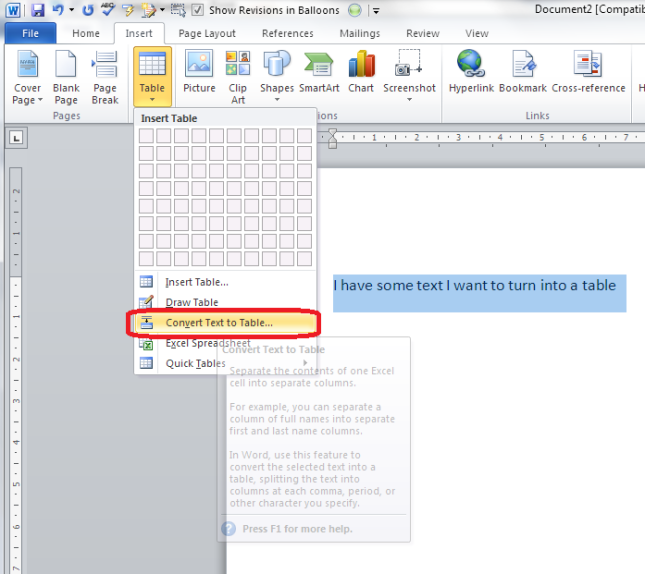
This is particularly useful if you’ve imported text or figures from another program. Highlight your text and choose this option …
… and you can specify whether you want the columns to separate at each comma, full stop or other character. Apparently, Mr Libro always uses this option when he creates a table, creating the text first and then the table!
Insert Excel spreadsheet
This option allows you to have a mini Excel spreadsheet, with all its normal functionality, inside your Word document:

Note: this inserts a blank, empty spreadsheet into your document:

Once you’ve created your data and clicked away from the spreadsheet, you will have a table made out of your spreadsheet (click on it to amend):

If you want to insert an Excel spreadsheet that you’ve already created into your Word document, you need to choose Object from the far right-hand side of the Insert tab …
Insert Quick Tables
The last option in the list will allow you to choose from a ready-made set of sample tables …

As you can see, this is particularly useful if you want to print out or insert a calendar!
——————–
This post has gone through the Table menu and the options it offers for inserting tables. In other posts, I will go into more detail about how to edit tables, add and delete rows and columns, etc. If you want to know more, subscribe to this blog (see links at the top left or add to your RSS reader) or keep your eye on the resource guide.
If you have enjoyed this post, please share the link!
Please note, these hints work with versions of Microsoft Word currently in use – Word 2007 and Word 2010, for PC. Mac compatible versions of Word should have similar options. Always save a copy of your document before manipulating it. I bear no responsibility for any pickles you might get yourself into!
Find all the short cuts here …
If you’ve used Word a little or a lot, you’ll no doubt have come across Word tables. They have been around ever since Word started but they continue to be a superb feature of Word. This article summarised just how important Word tables are.
If you’ve used Word a little or a lot, you’ll no doubt have come across Word tables. They have been around ever since Word started but they continue to be a superb feature of Word. This article summarised just how important Word tables are.
Word tables are really useful to use for all manner of reasons, so we’ll cover some of the major ones here. We’ll start with the ability to arrange text in columns. Without tables, the traditional way to arrange text in neat vertical columns was to use tabs. Tabs can be set to align left, right or centre for example and the careful use of tabs allows us to enter successive lines of text, pressing the tab key between text items. This resulted in neat columns of data provided you arranged the tabs correctly. You can still use tabs in this way to create effective columned data, and tabs can be particularly effective for example in aligning data based on decimal points.
However if you need basic data alignment then tables allow us to arrange data in columns more easily. If we first create a table in Word and then add text to each table cell, the text will line up perfectly to the left in vertical columns. You can also change the alignment of one or more table columns to the right or centre and even hide the table lines so that only the data shows. You can do this by formatting the table borders to show none at all, so your work will print in neat columns without the tell-tale table lines. You can still see the table guide lines in Word but these will not print.
Tables can also be used to organize the layout of whole sentences rather than just single text items. For example if you use landscape page layout and then add a table, you can create reports or meeting minutes in an organized structure within a table. Using landscape layout allows you to create relatively wide table with lots of columns and lots of text.
Suppose you create a table for minutes of a meeting with various text headings across the table. If you then enter each minute item with all the appropriate text in a separate row across the table, then each row of minute details will always stay in the same row across the table no matter what editing you do in rows above or below the item. So suppose you edit some text comments in a particular row and add or remove a couple of lines of text, that table row will expand or contract, and all the following rows move down or up, maintaining every row in perfect alignment. Again you can turn off the table lines if you wish prior to printing the minutes.
You can also use a Word table to position images in a Word document. Try adding one or more images to a Word document containing existing text and you’ll see the problem. When you add an image in Word, the image fixes itself to the nearest paragraph marker and does NOT just sit where you want it to. If you then edit the text so the paragraph marker moves, then the image also moves. This can make image positioning in a Word document extremely difficult.
You can solve this in Word in different ways, and one way is to use a table. If you add one or more images to cells in a Word table, the images fixes to the cell, not a paragraph marker. However the image also forces the cell to enlarge to fit the image size, so you may need resize the images smaller to have more control over their position. However once you’ve got the images to a manageable size, you can adjust the positions of table rows and columns by simply dragging them to adjust images positions in the table cells. Then you can hide the table lines to give a neater view and you then cannot see the images happily sitting in table cells.
Another use of table in Word is to copy and paste data to other applications. For example suppose you create a table in Word, add some data, then highlight it and copy, you can paste into other applications such as Excel, PowerPoint and Outlook. The result will still be a table of data. If you try copying and pasting data from Word without using a table, the data formatting usually becomes lost in the process. Similarly if you highlight some data in Excel, copy, and then paste into Word, the result will be a Word table and the data formatting will be intact.
So we’ve seen several examples of how useful tables are in Word. Even with the many new features successive versions of Word have introduced, tables are still a key feature to help you store and display data effectively.
Want to learn more about tables and Word’s many other features? You might like to consider attending a training course. That can be a really effective way to really boost your Word skills.
Last Update: Jan 03, 2023
This is a question our experts keep getting from time to time. Now, we have got the complete detailed explanation and answer for everyone, who is interested!
Asked by: Melody Rath
Score: 4.5/5
(13 votes)
Tables are used to organize data that is too detailed or complicated to be described adequately in the text, allowing the reader to quickly see the results. They can be used to highlight trends or patterns in the data and to make a manuscript more readable by removing numeric data from the text.
Why would you use a table in Word?
Tables are often used to organize and present information, but they have a variety of other uses as well. You can use tables to align numbers in columns, and then sort and perform calculations on them. You can also use tables to create interesting page layouts.
What is one advantage of using a data table?
By using the table, we can easily find out the information and it is one of the efficient way for summarize the given information into the form of columns. In table we can add the information in specific way rather than in paragraph. So, it makes the data more understandable and efficient.
Why is a table better than a graph?
Tables, with their rows and columns of data, interact primarily with our verbal system. … Tables are also handy when you have many different units of measure, which can be difficult to pull off in an easy to read manner in a graph. Graphs, on the other hand, interact with our visual system.
Why do we use tables in communication?
A table can be used if you’re looking to display individual values, if values are being compared, or if data is going to be shown and then summarized. They won’t convey your story to the reader as quickly as a graph might, but you will still be conveying a large amount of information in an easy-to-understand way.
19 related questions found
How do you present data from a table?
Ideally, every table should:
- Be self-explanatory;
- Present values with the same number of decimal places in all its cells (standardization);
- Include a title informing what is being described and where, as well as the number of observations (N) and when data were collected;
When would you use a chart rather than a table?
Charts are most useful when the data you are presenting is quantitative and has fewer distinct axes to measure. More importantly, charts can show you the “shape” of data—patterns that emerge when the data is examined altogether instead of presented in sets of individual values.
Is table A data Visualisation?
A table visualization lets you display data from a metric set using a tabular view. A table is also known as a data grid or data table, and it is the default type of visualization that is used when first selecting data if you did not choose another type.
How should we decide to use a table or a graph?
Table or Graph?
- Tables are generally best if you want to be able to look up specific information or if the values must be reported precisely.
- Graphics are best for illustrating trends and making comparisons.
What are the disadvantages of using tables?
Disadvantages of tables
- You can only squeeze in a small number of columns before the table width causes horizontal scrolling on smaller screens.
- Making columns narrow to prevent horizontal scrolling will decrease readability of text in cells, as a paragraph is stacked into one or two words per line.
What are the three advantages of table?
Answer: The following are the advantages of the table that are: By using the table, we can easily find out the information and it is one of the efficient way for summarize the given information into the form of columns. In table we can add the information in specific way rather than in paragraph.
Why is easy data entry a benefit when using a table?
Easy data entering
It is very easy to do data entry tasks with excel tables. When you enter data to a new row at the end of the table, the table is automatically expanded to include that row. The always visible header row also an advantage.
What are the advantages of inserting a table in a document?
The biggest benefit of adding a table to a Word document is providing a visual grouping of information. While you could simply type rows of data onto the Word page, the straight lines of a table direct the reader’s eye and show a clear delineation where paragraphs of text may not.
How do you work with a table?
To insert a blank table:
- Place your insertion point in the document where you want the table to appear.
- Select the Insert tab.
- Click the Table command.
- Hover your mouse over the diagram squares to select the number of columns and rows in the table. …
- Click your mouse, and the table appears in the document.
How style can be defined in a table?
A table style is a collection of table formatting attributes, such as table borders and row and column strokes, that can be applied in a single step. A cell style includes formatting such as cell insets, paragraph styles, and strokes and fills.
What are the characteristics of a good table?
Guidelines for good tables
- Have a reference to the table (such as a table number) in the text.
- Title should describe ‘what, where and when’
- Make sure that rows and columns are clearly labelled.
- For easy comparison put numbers most likely to be compared with each other in columns.
- Bold totals in tables.
What is the difference between a chart and a table?
A table is the representation of data or information in rows and columns while a chart is the graphical representation of data in symbols like bars, lines, and slices. … A table can be simple or multi-dimensional. While there are several types of charts, the most common are pie charts bar charts, and line charts.
What is the difference between a chart table and graph?
Key Differences
Charts represent a large set of information into graphs, diagrams, or in the form of tables, whereas the Graph shows the mathematical relationship between varied sets of data. As such, a Graph is a type of Chart but not all of it. In fact, a Graph is a type of subgroup of Chart.
In which circumstances is a table considered a text table?
HAI Sreenu, Table A is a text table of table B if the key of A comprises the key of B and an additional language key field (field of data type LANG). Table A may therefore contain explanatory text in several languages for each key entry of B.
What advantages does the visual representation have over the table?
Data visualization provides us with a quick, clear understanding of the information. Thanks to graphic representations, we can visualize large volumes of data in an understandable and coherent way, which in turn helps us comprehend the information and draw conclusions and insights.
What is the purpose of recording data in a table?
The general purpose of data recording is to set in writing and assure the preservation of the data collected in the course of field or laboratory studies.
What are the three ways of presenting data?
Broadly speaking, there are three methods of data presentation:
- Textual.
- Tabular.
- Diagrammatic.
What are the 3 methods of data presentation?
In this article, the techniques of data and information presentation in textual, tabular, and graphical forms are introduced.
How do you read a data table?
A table can be read from left to right or from top to bottom. If you read a table across the row, you read the information from left to right. In the Cats and Dogs Table, the number of black animals is 2 + 2 = 4. You’ll see that those are the numbers in the row directly to the right of the word ‘Black.
A table is one convenient way to display like information. People can refer to the table within a document and see how it applies to the lesson being taught. They can come to their own conclusions when they see the data stacked up against each other. That’s where knowing how to create and format tables within a Microsoft Word document pays off.
Why You Need to Use Tables in Documents
Let’s face it, some people need visual aids to learn. Even though text is comprised of letters, numbers, and punctuation, it can be very taxing on the eyes. When you’re able to stress a point visually with a table, you’re able to relay data quickly and in a way that other people understand well.
Tables take large amounts of data and categorize it in a way that is easy to understand and digest. It gives readers of a document, catalog or manual an organized way to process what they’ve learned from the author. You don’t have to skim paragraph after paragraph of text to gain the same understanding from a well-made table.
How to Create a Table and Then Format It to Your Liking
To create a table in Microsoft Word, you must first own Microsoft Office. Once you have the software downloaded to your computer, you’ll want to open a new word document by double clicking the MS Word icon and choosing ‘New’ when prompted by the menu to make a selection.
Once your blank document is open, you’ll want to type out your list or text. Converting it to table format takes a few steps, so be prepared. Once you learn how to do it the first time, you’ll have no problem creating and adding tables to documents.
Here’s what you need to do to get the process going:
-
Choose ‘Home’ then ‘Show/Hide’.
This allows you to see the tabs and paragraph makings made in the document.
-
Use separator characters in the form of commas or tabs.
This tells the program where to divide text. It will place it into table columns.
-
When you want to begin a new table row, you’ll need to use paragraph marks.
This allows you to decide how much information you plan to share on the table.
-
Once you’ve done that, you’ll want to create the table.
Select it by highlighting it with the highlighter tool on the ribbon at the top of the document.
-
Then select ‘Insert>Table’ and ‘Convert Text to Table.
You’ll find this in the drop down menu under ‘Insert Table’ and ‘Draw Table’.
-
Set the column width by choosing ‘Fixed column width’ and selecting a number.
You’ll determine how wide you want the columns to be based on the amount of text you’re sharing.
-
Resize the columns if necessary.
Select ‘AutoFit to contents’.
-
Resize the table to fit the width of space.
Do this by choosing ‘AutoFit to window’.
-
Separate text at requires the separator character used in the text you started with.
Make sure to include this before hitting ‘OK’.
Following these steps in order allows you to create and format unique tables to insert into your Word documents. You can enhance the effectiveness of your communications easily. All you need is a few extra minutes and Microsoft Office to begin.
Where to Get Microsoft Office Software and Apps
There are a number of places to get Microsoft Office software and apps. You can buy them directly from Microsoft or from Software Keep where you’re given a significant discount on authentic software and apps. If you shop online with us, you’ll have access to your purchase right away because you digitally download it opposed to waiting for a hardcopy CD or DVD to arrive by mail.
What Software Keep Has to Offer Its Customers
Many Americans prefer buying their MS Office software and apps from Software Keep because they’ve built a relationship with our company. They know our products are authentic and that we give them choices as to whether they download Microsoft Office for Mac or PC. If they find a deal on Student Microsoft Office on another site, they ask us to price match the identical product which we willingly do.
Get Microsoft Office Pro here.
Tables are the coolest. Get to know how to use them and how not to use
them, and you’ll love them like I do.
When to Use Tables
- Side-by-side bulleted lists
- Side-by-side text, such as instructor text alongside of student text, or
for troubleshooting manuals - When you’re tempted to insert a spreadsheet
- When you think you need a spreadsheet to do (minor) calculations
- For signature lines
- To have headings «top-aligned» side-by-side with a paragraph, such as with
a resume - In forms (definitely in forms!)
Tables are used on the web a lot, and just as ill-used as Word tables. Here’s
a few tips, and why they work.
No paragraph returns!
The ideal table in Word won’t have any paragraph returns in it. Why? If
you’re using table columns to align text side-by-side, likely, you’ll have a
bunch of paragraph returns to space them perfectly left and right.
The Wrong Way
What will happen to the table below if we take the word «lazy» out of the
first paragraph of text in the left-hand column? Everything bumps up one line,
and our 2nd paragraph is no longer aligned side-by-side with its paragraph.
The Right Way
Here, we create a new table row for each paragraph. I also like
to select my entire table and Format Paragraph and
put 3 in space before and space after (or use styles that do this for me). It
provides a nice amount of white space around your text.
How to Get it Right if it’s Already Wrong
Beginning at the bottom of your table create a bunch of rows.
Select your text, a paragraph at a time, working from the bottom-up, and drag
down into the new rows.
The Wrong Way
I’ve seen many documents with tables and tables and tables of
information to provide a layout like the following.
It’s okay to do this, but such a bunch of unnecessary trouble in
very large documents. Instead, create styles for your headings, and then have
your body text style indented a couple of inches. While you may use up a few
extra pages, you’re not dealing with stupid layout issues.
How to Get it Right if it’s Already Wrong
Select your table. Hit Table Convert Table
to Text. Choose Paragraphs, OK.
For Signatures
It’s really simple to put signature lines using table cells. I
like to begin by inserting a 3-column table, and set it up as shown:
The table above is created using paragraph formatting with 3pts
before and after. I used an extra heavy border line to create the screenshot
only. Normally, I use the default borderlines. If you need three signatures, you
can insert five columns instead of three. If you only need one signature, you
could simply delete the text and remove the borders from one of the columns.
Save this as an Autotext
entry so you can use it again and again.
When Not to Use Tables
- For newsletters (usually, you’ll want to use columns under Format Columns)
- To indent text (indent the style instead)
- For numbered lists with more than one column. (It’s not worth the effort
to figure out how to get your numbering to go left, then right, then left,
then right. But if your numbering goes down a column, that’s fine.) In other
words, it’s very difficult to create the following layout and use numbered
lists. You might as well do it manually if you must have it this way.