
Excel for Microsoft 365 Excel for Microsoft 365 for Mac Excel for the web Excel 2021 Excel 2021 for Mac Excel 2019 Excel 2019 for Mac Excel 2016 Excel 2016 for Mac Excel 2013 Excel 2010 Excel 2007 Excel for Mac 2011 Excel Starter 2010 More…Less
Estimates standard deviation based on a sample. The standard deviation is a measure of how widely values are dispersed from the average value (the mean).
Important: This function has been replaced with one or more new functions that may provide improved accuracy and whose names better reflect their usage. Although this function is still available for backward compatibility, you should consider using the new functions from now on, because this function may not be available in future versions of Excel.
For more information about the new function, see STDEV.S function.
Syntax
STDEV(number1,[number2],…)
The STDEV function syntax has the following arguments:
-
Number1 Required. The first number argument corresponding to a sample of a population.
-
Number2, … Optional. Number arguments 2 to 255 corresponding to a sample of a population. You can also use a single array or a reference to an array instead of arguments separated by commas.
Remarks
-
STDEV assumes that its arguments are a sample of the population. If your data represents the entire population, then compute the standard deviation using STDEVP.
-
The standard deviation is calculated using the «n-1» method.
-
Arguments can either be numbers or names, arrays, or references that contain numbers.
-
Logical values and text representations of numbers that you type directly into the list of arguments are counted.
-
If an argument is an array or reference, only numbers in that array or reference are counted. Empty cells, logical values, text, or error values in the array or reference are ignored.
-
Arguments that are error values or text that cannot be translated into numbers cause errors.
-
If you want to include logical values and text representations of numbers in a reference as part of the calculation, use the STDEVA function.
-
STDEV uses the following formula:

where x is the sample mean AVERAGE(number1,number2,…) and n is the sample size.

Example
Copy the example data in the following table, and paste it in cell A1 of a new Excel worksheet. For formulas to show results, select them, press F2, and then press Enter. If you need to, you can adjust the column widths to see all the data.
|
Data |
||
|---|---|---|
|
Strength |
||
|
1345 |
||
|
1301 |
||
|
1368 |
||
|
1322 |
||
|
1310 |
||
|
1370 |
||
|
1318 |
||
|
1350 |
||
|
1303 |
||
|
1299 |
||
|
Formula |
Description (Result) |
Result |
|
=STDEV(A3:A12) |
Standard deviation of breaking strength (27.46392) |
27.46392 |
Need more help?
На чтение 3 мин. Просмотров 1.5k. Опубликовано 25.06.2019
Содержание
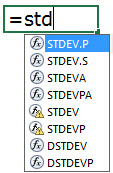
- Оценить стандартное отклонение в Excel
- Практическое использование функции STDEV
- STDEV в синтаксис и аргументы Excel
- Пример функции STDEV
Оценить стандартное отклонение в Excel
Стандартное отклонение – это статистический инструмент, который приблизительно показывает, насколько в среднем каждое число в списке значений данных отличается от среднего значения или среднего арифметического самого списка.
Инструкции в этой статье относятся к Excel 2019, 2016, 2013, 2010, 2007; Excel для Mac, Excel для Office 365, Excel Online, Excel для iPad, Excel для iPhone и Excel для Android.
Практическое использование функции STDEV
В Excel функция STDEV обеспечивает оценку набора стандартных отклонений данных. Функция предполагает, что введенные числа представляют только небольшую часть или выборку из всей изучаемой популяции. В результате функция STDEV не возвращает точное стандартное отклонение. Например, для чисел 1 и 2 функция STDEV в Excel возвращает приблизительное значение 0,71, а не точное стандартное отклонение 0,5.
Несмотря на то, что функция STDEV оценивает только стандартное отклонение, функция полезна, когда тестируется только небольшая часть совокупности. Например, при тестировании готовой продукции на соответствие среднему значению (для таких мер, как размер или долговечность) тестируется не каждая единица, и это дает оценку того, насколько каждая единица во всей совокупности отличается от средней.

Чтобы показать, насколько близки результаты для STDEV к фактическому стандартному отклонению (с использованием приведенного выше примера), размер выборки, использованный для функции, был менее одной трети от общего объема данных. Разница между расчетным и фактическим стандартным отклонением составляет 0,02.
STDEV в синтаксис и аргументы Excel
Синтаксис функции относится к макету функции и включает имя функции, скобки, разделители запятых и аргументы. Синтаксис для функции стандартного отклонения:
= STDEV ( Number1 , Number2 , ... Number255 )
Number1 (обязательно). Это число может быть фактическим числом, именованным диапазоном или ссылкой на ячейку для расположения данных на листе. Если используются ссылки на ячейки, пустые ячейки, логические значения, текстовые данные или значения ошибок в диапазоне ссылок на ячейки игнорируются.
Number2, … Number255 (необязательно): можно ввести до 255 номеров.

Пример функции STDEV
В этом руководстве образец данных, используемый для аргумента Number функции, находится в ячейках с A5 по D7. Стандартное отклонение для этих данных будет рассчитано. Для сравнения включены стандартное отклонение и среднее значение для всего диапазона данных от A1 до D10.
В Excel 2010 и Excel 2007 формула должна быть введена вручную.
Выполните следующие шаги, чтобы выполнить задачу и рассчитать информацию с помощью встроенной функции:
= СТАНДОТКЛОН (А5: Д7)
-
Выберите ячейку D12 , чтобы сделать ее активной. Здесь будут отображаться результаты функции STDEV.
-
Введите функцию = STDEV (A5: D7) и нажмите Enter .
-
Значение в D12 изменяется до 2,37. Это новое значение представляет собой расчетное стандартное отклонение каждого числа в списке от среднего значения 4,5
Для более старых версий Excel введите формулу вручную или выберите ячейку D12 и откройте селектор визуальных данных с помощью Формулы > Дополнительные функции > STDEV .
The STDEV Function is categorized under Excel Statistical functions. The function returns the statistical rank of a given value within a supplied array of values. Thus, it determines the position of a specific value in an array.. The function will estimate the standard deviation based on a sample.
Contents
- 1 How do you use standard deviation in Excel?
- 2 What is STDEV P and STDEV s?
- 3 What is the difference between STDEV and STDEV P in Excel?
- 4 Does standard deviation have units?
- 5 How do I work out the standard deviation?
- 6 Do I use STDEV or STDEV P?
- 7 Is STDEV in Excel sample or population?
- 8 What is the difference between STDEV and Stdeva?
- 9 What does standard deviation tell you?
- 10 What is unit deviation?
- 11 What is Unitless in statistics?
- 12 Does the range have units?
- 13 How do you find the deviation from the mean?
- 14 How many mean standard deviations?
- 15 Is low standard deviation good?
- 16 What is a large standard deviation?
- 17 Why is standard deviation important?
- 18 How is assumed mean calculated?
- 19 What is standard deviation squared?
- 20 What is DI in assumed mean method?
How do you use standard deviation in Excel?
In practice
Say there’s a dataset for a range of weights from a sample of a population. Using the numbers listed in column A, the formula will look like this when applied: =STDEV. S(A2:A10). In return, Excel will provide the standard deviation of the applied data, as well as the average.
The STDEV. P function is used when your data represents the entire population. The STDEV. S function is used when your data is a sample of the entire population.
What is the difference between STDEV and STDEV P in Excel?
Standard Deviation functions in Excel
Notes: STDEVP calculates standard deviation using the “n” method, ignoring logical values and text. STDEVP assumes your data is the entire population.
Does standard deviation have units?
The standard deviation is always a positive number and is always measured in the same units as the original data. For example, if the data are distance measurements in kilogrammes, the standard deviation will also be measured in kilogrammes.
How do I work out the standard deviation?
To calculate the standard deviation of those numbers:
- Work out the Mean (the simple average of the numbers)
- Then for each number: subtract the Mean and square the result.
- Then work out the mean of those squared differences.
- Take the square root of that and we are done!
Do I use STDEV or STDEV P?
Standard deviation is a measure of how much variance there is in a set of numbers compared to the average (mean) of the numbers. The STDEV. P function is meant to estimate standard deviation for an entire population. If data represents a sample, use the STDEV.
Is STDEV in Excel sample or population?
Standard Deviation functions in Excel
STDEV calculates standard deviation using the “n-1” method. STDEV assumes data is a sample only. When data represents an entire population, use STDEVP or STDEV. P.
What is the difference between STDEV and Stdeva?
STDEVA and STDEV Functions
The difference arises when an array of values that contain text or logical values is supplied to the function. In such a case, STDEV ignores the text and logical values, whereas STDEVA assigns the value 0 to text and the values 1 or 0 to logical values.
What does standard deviation tell you?
A standard deviation (or σ) is a measure of how dispersed the data is in relation to the mean. Low standard deviation means data are clustered around the mean, and high standard deviation indicates data are more spread out.
What is unit deviation?
Put simply, the standard deviation is the average distance from the mean value of all values in a set of data. An example:The standard deviation is always represented by the same unit of measurement as the variable in question. This makes its interpretation easier, compared to the variance.
What is Unitless in statistics?
Dimensionless quantities are often obtained as ratios of quantities that are not dimensionless, but whose dimensions cancel out in the mathematical operation.In statistics the coefficient of variation is the ratio of the standard deviation to the mean and is used to measure the dispersion in the data.
Does the range have units?
In statistics, the range of a set of data is the difference between the largest and smallest values.It is measured in the same units as the data.
How do you find the deviation from the mean?
Calculating the mean average helps you determine the deviation from the mean by calculating the difference between the mean and each value. Next, divide the sum of all previously calculated values by the number of deviations added together and the result is the average deviation from the mean.
How many mean standard deviations?
The Empirical Rule states that 99.7% of data observed following a normal distribution lies within 3 standard deviations of the mean. Under this rule, 68% of the data falls within one standard deviation, 95% percent within two standard deviations, and 99.7% within three standard deviations from the mean.
Is low standard deviation good?
A high standard deviation shows that the data is widely spread (less reliable) and a low standard deviation shows that the data are clustered closely around the mean (more reliable).
What is a large standard deviation?
A large standard deviation indicates that the data points can spread far from the mean and a small standard deviation indicates that they are clustered closely around the mean.
Why is standard deviation important?
Standard deviations are important here because the shape of a normal curve is determined by its mean and standard deviation.The standard deviation tells you how skinny or wide the curve will be. If you know these two numbers, you know everything you need to know about the shape of your curve.
How is assumed mean calculated?
If a is the assumed mean fi denotes the frequency of the ith class which is having a deviation of di from the assumed mean, the formula for the mean is ¯x=a+∑fidi∑fi. Using this method, we can assume a mean of 150 as it is in the middle and has the highest frequency and applying the formula gives the answer.
What is standard deviation squared?
Standard deviation is the square root of the variance so that the standard deviation would be about 3.03. Because of this squaring, the variance is no longer in the same unit of measurement as the original data.
What is DI in assumed mean method?
a – assumed mean. Fi- Frequency of ith class. Di=xi-a= deviation of ith class. Fi= n summation of observations. Xi=class mark= (upper class limit+lower class limit)/2.
The standard deviation shows the variability of the data values from the mean (average). In Excel, the STDEV and STDEV.S calculate sample standard deviation while STDEVP and STDEV.P calculate population standard deviation. STDEV is available in Excel 2007 and the previous versions. However, STDEV.P and STDEV.S are only available in Excel 2010 and subsequent versions.

You are free to use this image on your website, templates, etc, Please provide us with an attribution linkArticle Link to be Hyperlinked
For eg:
Source: Standard Deviation in Excel (wallstreetmojo.com)
Table of contents
- What is Standard Deviation in Excel?
- Standard Deviation Formulas in Excel
- The Syntax of STDEV.S Function
- The Population vs. Sample
- The STDEV.S and STDEVA Functions
- Calculating Standard Deviation in Excel
- #1 – Calculate Population Standard Deviation in Excel
- #2– Calculate Sample Standard Deviation in Excel
- Frequently Asked Questions
- Recommended Articles
- Standard Deviation Formulas in Excel
Standard Deviation Formulas in Excel
In excel, there are eight formulas to calculate the standard deviation. These are grouped under sample and population.
The functions STDEV.S, STDEVA, STDEV, DSTDEV are under sample and STDEV.P, STDEVP, STDEVPA, DSTDEVP are under population.
The Syntax of STDEV.S Function
The syntax of the function is stated as follows:
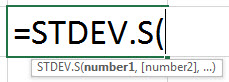
The function accepts the following arguments:
- Number 1: This is the first value of the sample data. It can be expressed as a range.
- Number 2: This is the second value of the sample data.
“Number 1” is mandatory and “number 2” is an optional argument.
Note 1: If the entire sample data is entered as a range, the “number 2” argument becomes optional.
Note 2: The sample standard deviation formula works correctly when the supplied arguments contain at least two numeric values. Otherwise, it returns the “#DIV/0!” error.
The Population vs. Sample
The population and sample are defined as follows:
- The population refers to the whole data set.
- A sample is a subset of the data set. A sample of the population is taken when it is difficult to use the complete data set.
Note: The sample standard deviation helps make conclusions for the population.
The STDEV.S and STDEVA Functions
The two functions are explained as follows:
- The STDEV.S function calculates the standard deviationStandard deviation (SD) is a popular statistical tool represented by the Greek letter ‘σ’ to measure the variation or dispersion of a set of data values relative to its mean (average), thus interpreting the data’s reliability.read more using the numerical values. It ignores the text values. The “S” of the function represents the sample data set.
- The STDEVA function calculates the standard deviation by counting the text values as zero. The logical value “false” is counted as 0 and “true” is counted as 1.
Note: The STDEV.S is available in Excel 2010 and the subsequent versions.
Calculating Standard Deviation in Excel
#1 – Calculate Population Standard Deviation in Excel
Let us consider an example to understand the concept of standard deviation in Excel.
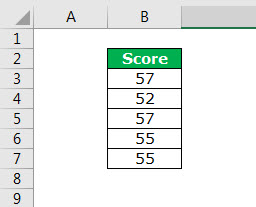
The following are the employee scores of an organization. They indicate the skill levels of the employees.
We want to calculate the standard deviation of the given data set.
The steps to calculate standard deviation in Excel are listed as follows:
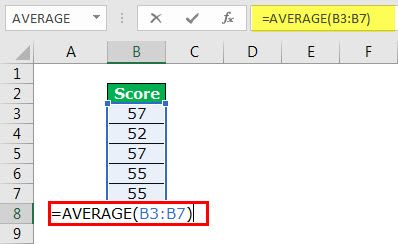
- Calculate the mean (average) of the data.

The output 55.2 signifies the average employee score.

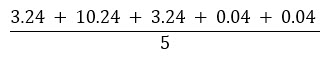
- Calculate the population variance. It is the difference of each score from the mean. The results are summed as shown in the following image.
Variance =

Variance =
The population variance is 3.36.
- Calculate the standard deviation. It is the square root of the variance.

Conclusion: The standard deviation is 1.83. This indicates that the employee scores range from 53.37 to 57.03.


#2– Calculate Sample Standard Deviation in Excel
Let us consider an example to understand the working of the STDEV.S function.
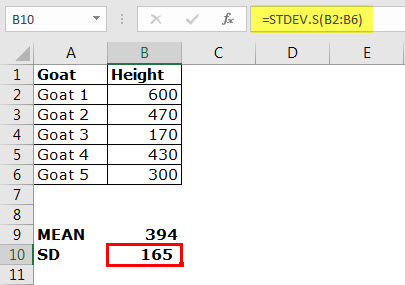
The following table shows the heights of different goats. The height is measured from the shoulder level and is denoted in millimeters.
You can download this Standard Deviation Excel Template here – Standard Deviation Excel Template

Step 1: Calculate the mean of the given data. The output is 394.

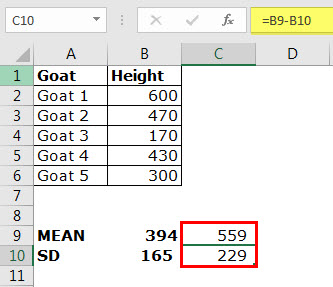
Step 2: Apply STDEV.S to the range B2:B6. The output is 165.
Conclusion: The standard deviation of the height of the goats is 165. This indicates that the usual heights are within the range of 229 and 559 millimeters.
In other words, the heights are on either side of the mean, i.e., 394–165=229 and 394+165=559.
Frequently Asked Questions
1. What is standard deviation in Excel?
The standard deviation measures the dispersion of a given set of values from the mean. It shows the fluctuation of data values. A low standard deviation indicates lower variability and greater accuracy of the mean. On the other hand, a high standard deviation indicates higher variation and lesser reliability of the mean.
While investing, the standard deviation of the returns is evaluated to assess the volatility of a stock. In Excel, the STDEV and STDEV.S calculate sample standard deviation while STDEVP and STDEV.P calculate population standard deviation.
2. Which standard deviation formula should be used in Excel?
To select the appropriate standard deviation formula, the following points must be considered:
• The standard deviation is being calculated for a population or sample.
• The type of values of the data set. These values can be numerical, logical or textual.
• The version of MS Excel which is being used currently.
3. How to create a standard deviation graph in Excel?
The steps to create a standard deviation graph in Excel are listed as follows:
• Create a usual Excel chart with the help of the “charts” group under the Insert tab.
• Select the chart and click the plus (+) sign on the top-right corner.
• In “chart elements,” click the arrow of “error bars,” and select “standard deviation.”
The standard deviation bars for the data points are inserted within the chart.
- STDEV calculates the standard deviation of the sample data supplied as an argument.
- The standard deviation shows the variability of the data values from the mean (average).
- The lower the standard deviation, the closer the data points to the mean.
- The higher the standard deviation, the more scattered the data points from the mean.
- The population refers to the entire data set while a sample is a subset of this data.
- The STDEV.S function calculates the standard deviation using the numerical values only.
- The STDEV.S function accepts two arguments–“number 1” and “number 2” representing the first and the second value of the sample data respectively.
Recommended Articles
This has been a guide to standard deviation in Excel. Here we discuss how to calculate standard deviation in excel using formula and examples. You may also look at these useful functions in Excel –
- Quartile DeviationQuartile deviation is based on the difference between the first quartile and the third quartile in the frequency distribution and the difference is also known as the interquartile range, the difference divided by two is known as quartile deviation or semi interquartile range.read more
- Sample Standard Deviation FormulaSample standard deviation refers to the statistical metric that is used to measure the extent by which a random variable diverges from the mean of the sample.read more
- Standard Deviation Graph in ExcelThe standard deviation is a metric that calculates how values change when compared to or in relation to the mean or average value. Both deviations are represented in a standard deviation graph, with one being positive on the right and the other being negative on the left.read more
- QUARTILE Function in Excel
STDEV and its related functions allow you to determine the standard deviation of a data sample or data set, measuring the variation between those numbers against the average. To help you work out how to use standard deviation in Excel, we’ll explain how to use it in this step-by-step guide.
Phrases like standard deviation put fear into the hearts of nervous mathematicians worldwide, but the concept is pretty simple. Standard deviation takes a range of data and determines how far each value is separated from the average of the total.
Rather than work this out manually, you can use functions like STDEV, STDEV.S, and STDEV.P instead. In this guide, we’ll explore:
- What is the STDEV function and what is it used for?
- How does standard deviation work in Microsoft Excel?
- Things to consider before using standard deviation in Excel
- How to use STDEV or STDEV.S in an Excel formula: A step-by-step guide
- Using STDEVA, STDEV.P, or STDEVPA for standard deviation in Excel
If you want to understand how to calculate standard deviation in Excel, this guide will help. Let’s get started.
1. What is the STDEV function and what is it used for?
To help explain standard deviation functions like STDEV and STDEV.S in Excel, we’ll give you an example. Let’s assume that you have a group of 10 people and you’re interested in learning what the average height of the group is.
You could use the AVERAGE function to determine the average height—so far, so good. However, what if there are outliers in the data? What if you wanted to determine the variance (the typical difference between the average height and the data set)?
This is standard deviation at work, letting you see the spread of values in a data sample or data set. You can learn more about standard deviation (and how it differs from standard error) in this guide.
Using STDEV or STDEV.S in Microsoft Excel
Just like the SUBTOTAL function and other Excel functions, the STDEV function exists to serve a single purpose: to allow you to calculate standard deviation in an Excel formula. However, while STDEV is perfectly suitable for the task, Microsoft has replaced it with a newer function: STDEV.S.
There isn’t much difference between STDEV and STDEV.S, with both having the same arguments and working in the same way. With no guarantees that Excel will continue to support STDEV in newer releases, however, it’s probably best to use STDEV.S to calculate the standard deviation from a data sample.
If you’re trying to calculate standard deviation from a population data set, you’ll need to use the closely-related STDEV.P function (or the older STDEVP which, like STDEV, is no longer recommended). Population, in this context, means an entire data set, rather than a sample (section) of it.
You can also use STDEVA to work with data that contains text or logical values (like TRUE or FALSE). By default, text and logical values are ignored by STDEV.P and STDEV.S.
2. How does standard deviation work in Microsoft Excel?
As we’ve explained, standard deviation works by determining the total variance between the average of a range of numbers and the numbers themselves.
For instance, if you had a range of cells containing the same number, the standard deviation would be zero: there isn’t any variation at all. In contrast, if you had a range of cells that contained numbers that all had a variation of one (for instance, 10, 11, or 12), then the standard deviation would be one, too.

This makes the standard deviation functions (STDEV, STDEV.S, STDEVP, STDEV.P, STDEVPA and STDEVA) incredibly useful for potential data analysts, helping to determine the outlier values in a data sample or population set.
Each of these standard deviation functions work in a similar way. For instance, if you want to determine standard deviation from a data sample using STDEV.S, you’d need to use the following structure:
=STDEV.S(number1,number2, …)
All standard deviation functions (STDEV, STDEV.S, STDEVP, STDEV.P, STDEVPA and STDEVA) in Excel must contain at least one argument: number1. In this example formula, number1 refers to the cell range containing your data set. If you want to use numbers within the function directly, number1 would refer to the first number in that range.

Each additional number argument is used to add additional numbers or cell ranges to the overall standard deviation calculation. You can mix and match these, adding numbers and cell ranges.
3. Things to consider before using standard deviation in Excel
Before you use Excel to calculate standard deviation using STDEV, STDEV.S, or another related function, you’ll need to be aware of some important quirks and limitations. These include:
- STDEV has been superseded by STDEV.S, so if you’re creating new formulae, you should use STDEV.S. Likewise, STDEVP has been replaced by STDEV.P for standard deviation calculations using an entire data set (or population).
- If you’re creating a standard deviation formula using STDEV, STDEV.S, STDEV.P, STDEVPA or STDEVA, you can use numbers, cell references, and arrays for the number arguments.
- The STDEV and STDEV.S functions in Excel use Bessel’s correction (n-1) to combat estimation bias due to the smaller sample size, compared to the entire data set. For entire population sets, where this isn’t an issue, use STDEV.P, STDEVPA or STDEVA, where n (rather than n-1) is used instead.
- For Excel to consider values that contain logical values (TRUE/FALSE) or text strings, you’ll need to use the STDEVA or STDEVPA functions. All other standard deviation functions (including STDEV.S and STDEV.P) ignore these values.
- Only one number argument (number1) is required. You can add up to 255 number arguments (containing numbers or cell references) in any standard deviation formula in Excel.
4. How to use STDEV or STDEV.S in an Excel formula: A step-by-step guide
To determine the standard variation of a data sample using STDEV or STDEV.S in Excel, you’ll need to follow these steps:
Step 1: Select an empty cell
You’ll need to begin by opening the Excel spreadsheet containing your data (or a blank spreadsheet if you’re inserting your numbers into the formula manually). Start by selecting an empty cell and, once the cell is selected, press the formula bar below the ribbon bar.

Once the formula bar is active (the blinking cursor will appear), you can begin to insert your new STDEV.S function, typing =STDEV.S( with an open parenthesis. If you’re using the older STDEV function, type =STDEV( instead.

Step 2: Insert your initial number or cell reference
Adding =STDEV( or STDEV.S( into the formula bar will begin the formula creation process. A hint, showing the available formula arguments, will appear in a box directly beneath the formula bar.

Using this syntax and structure (and as explained above), begin to insert your data, adding at least one number argument to the formula. If you want to insert numbers into the formula directly, type these (one after each other), separating each value with a comma.

You can also use a cell reference for the number1 and additional number arguments. This can be done by inserting it manually (eg. B1:B5) or by selecting the cells with your mouse or trackpad.
 typed into the formula bar")
It’s also possible to mix and match cell references and numbers. STDEV and STDEV.S will determine the standard deviation from the data set as a whole. Once you’re happy with the formula, close it with a closing parenthesis.
 typed into the formula bar")
STDEV and STDEV.S will ignore any values that contain numbers or logical values (TRUE or FALSE). If a range of cells contain no numbers, Excel will return a #DIV/0 error message.
5. Using STDEVA, STDEV.P, or STDEVPA for standard deviation in Excel
The STDEV and STDEV.S functions are useful for sample data sets that contain standard numbers. If you’re working with data that contains text, logical values, or if you want to find the standard deviation from an entire population data set, you’ll need to use STEDVA, STDEV.P, or STDEVPA instead.
Using STDEVA or STDEVPA
If you want to create a standard deviation formula that considers logical values (TRUE or FALSE) or text strings, then you’ll need to use STDEVA or STDEVPA instead. Use STDEVA for a sample data set and STDEVPA for an entire population set (where estimation bias is much less likely).
 typed into the formula bar")
Both STDEVA and STDEVPA work much like the STDEV and STDEV.S functions, with the same arguments and structure:
=STDEVA(number1,number2, …)
=STDEVPA(number1,number2, …)
The only difference is how Excel considers cell references or entries that contain text or logical values. For instance, if you have a cell range (A2:A9) and two of the cells contain text, the value of those cells is counted as zero, as is FALSE. For TRUE, STDEVA and STDEVPA count it as the value 1.
Using STDEV.P
Likewise, for the STDEV.P function, the only difference is the method Excel uses to determine the variance. For smaller samples, Bessel’s correction is used as the method, where the method n-1 is used (n referring to the number count). This helps to overcome bias issues in estimating the variation using a smaller sample size.
If you’re using an entire data set, then you don’t need to use this method to overcome potential estimation bias. Rather than using STDEV or STDEV.S (where S means sample), it’s better to use STDEV.P (where P means population, or the entire data set).

The arguments and structure remain the same, as follows:
=STDEV.P(number1,number2, …)
This will ignore text and logical values, so be sure to use STDEVPA instead if this is a requirement. You can also use the outdated STDEVP function, but there are no guarantees that this will remain available in future Excel releases.
Final thoughts
Standard deviation is a tricky mathematical concept made easy by functions like STDEV, STDEV.S, STDEV.P and others in Microsoft Excel. If you’re struggling, you can create a pivot table to determine the standard deviation of a data sample or set instead.
Excel has all kinds of functions, formulae, and features that can make data analysis a little easier. If you want to learn more, here are 10 essential Excel formulas for data analysts to use. You can also take our five day short course for new data analysts to get to grips with data a little easier. You might also find these Excel tutorials useful:
- How to use the IFERROR function in Excel
- How to use the SUBTOTAL function in Excel
- How to use the SUMIF function in Excel
- How to convert text to numbers in Excel