

If you’re looking for a way to streamline your business, then using Excel is up there as one of the best options. It’s a powerful tool, and most of us have probably used Excel in business before as employees or business owners.
One of the main reasons to use Excel for business tasks is because it saves time and money, thanks to the numerous options for storing and analysing data along with features that allow you to automate Excel to do repetitive daily tasks.
This blog post will cover a few essential uses for Excel in business while giving you an overview of why this software is so important and useful.
The Importance Of Excel In Business
Released in the early 1980s, Excel’s first version enabled users to step away from manual programming of macros and move towards automated Excel processes. The application has developed vastly since then to support graphs, charts, and histograms that can either be embedded in the spreadsheets or added as a stand-alone article.
Microsoft Excel’s feature-rich design means it’s used for a variety of purposes worldwide. Millions of companies use the software every day so the importance of Excel in business is not to be understated.
The reason for MS Excel’s growth in popularity is its user-friendly simple to use interface; this interface enables users to take control and perform tasks quickly and efficiently. Many employers now require candidates to have Excel skills, and skills in the wider offer suite so listing Excel skills on your CV is a must if you’re job seeking!

Learn how you can use Excel for Business & Financial Modelling with this practical guide.
What Is Excel Used For In Business?
MS Excel is used for a range of purposes in a business including accounting, stock management, sales reporting, product information management and automation. So, if you’re wondering why Excel is so important, it can power a whole business!
The multiple uses of Excel in business make it one of the main reasons businesses use Excel every day. We wanted to explore this further and came up with 7 of the most common examples we come across that demonstrate the use of Excel in business.

1. Using Excel For Managing Product Information
If you’re running an eCommerce business, you know how important maintaining accurate and up to date product information is in generating online sales, reducing returns and winning repeat business.
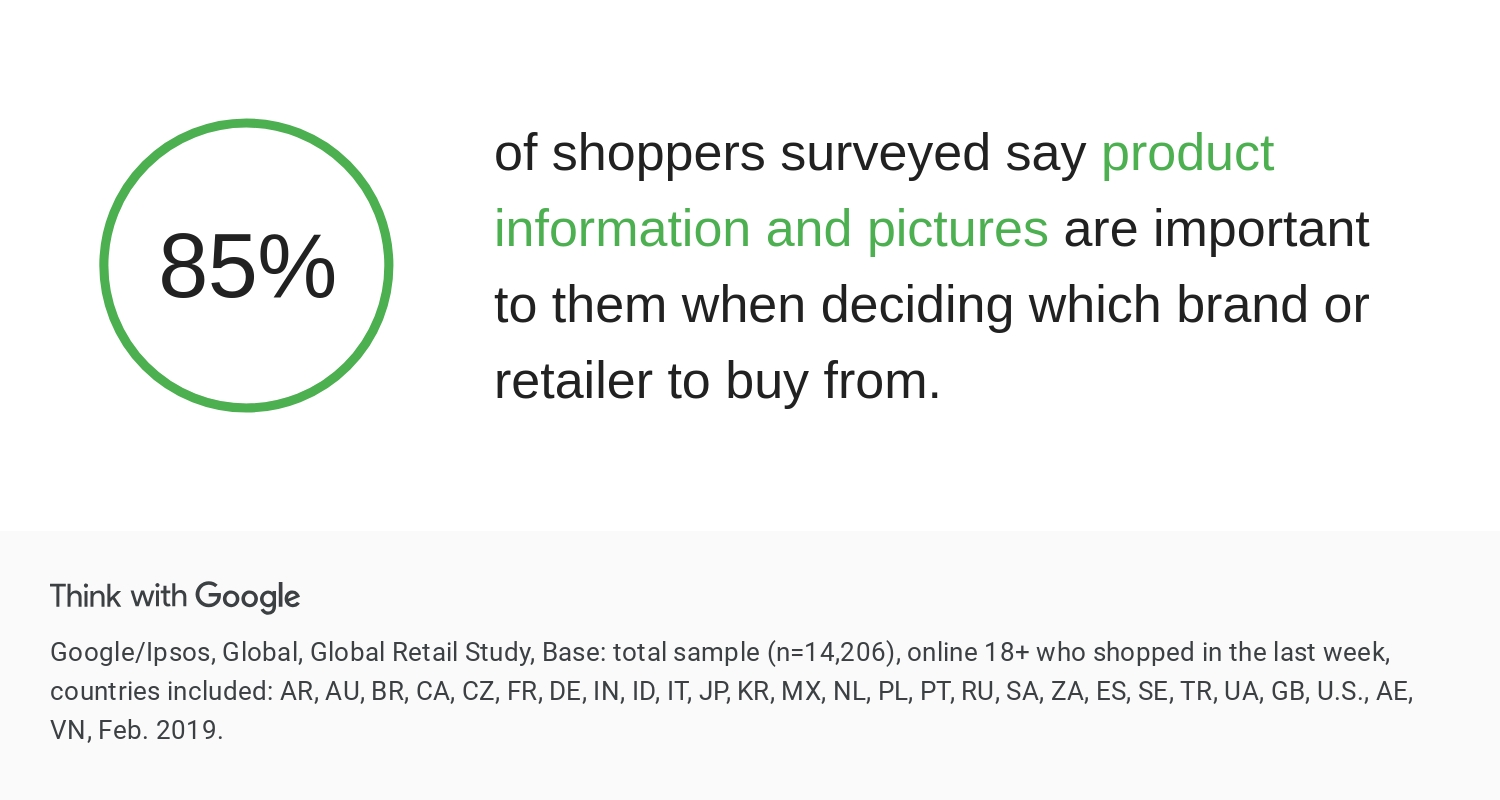
One of the main barriers that can prevent complete and accurate product information is the platform on which your website is built. WordPress, Magento and many more aren’t optimised to manage large amounts of data in the backend easily. This is where Excel comes in.
Almost all websites will give you the option to export and import data in CSV and XLSX format. Once you’ve exported your data and put it into Excel, you have complete control over your data.

![]()
Microsoft Excel Udemy Course – Excel from Beginner to Advanced 2023
Using a range of Excel features you can drill into your data and optimise your product information to fuel eCommerce growth. Once you’ve made your changes, simply import the sheet into your website back end and watch your sales fly.
Need help setting up a product information management spreadsheet? Contact The Excel Experts today!

2. Sales Reporting In Excel
Take a cross-section of businesses in the UK, and you’ll find some using complex and costly software to report on sales, while some will still be using pen and paper!
You’ll find most businesses using a spreadsheet for sales reporting between these two extremes, thanks to its easy to use format and automation capabilities.
Excel, in particular, is one of the best tools you can use to track and report on sales for your business.
With its capability for dashboard creation, automated reports, and integration into other business systems, Excel sales reports bring all your critical sales insights into one easy-to-use sheet that can be read by anyone and shared across the business to communicate and track performance.

3. Stock & Inventory Management Using a Spreadsheet
Because of its versatility and ability to hold thousands of data cells, using Excel for supply chain management & stock management is a great alternative to bespoke and expensive software.
SKU, barcode, stock levels, re-order levels, location, and bin number are just some of the columns you can add to your spreadsheet to maintain an accurate and up-to-date view of your inventory and stock levels.
Stock management spreadsheets can be as simple or complicated as they need to be for your business. One fantastic example of expanding on a simple sheet is the integration of barcode scanning into your document.
Connecting your spreadsheet to a barcode scanner will help you to process your goods quickly, track the delivery and purchase notes and pinpoint orders as they move through your business.
As we mentioned before, Excel can be integrated with many systems and even used as middleware to bridge the gap between systems. If you’re a larger business or have thousands of product lines and are using a SaaS or bespoke software system, Excel is still valuable.
For more information about using Excel for stock and supply chain management, get in touch.

4. Automate Business Tasks With Excel
Potentially one of the least known but most valuable features of Excel in business is automating repetitive business tasks. Reducing tasks to lines of code, companies can use Excel Automation to save time, increase productivity and ultimately increase profits.
Excel automation usually needs to be set up by specialists who know VBA (Visual Basic for Applications). However, the benefits your business will gain from automating tasks will far outweigh the costs of putting automation in place.
If you’re interested in exploring the possibilities of automating some of the tasks in your business using Excel, contact one of our VBA and automation specialists today.
We’ll tell you everything you need to know, what’s possible, and the potential savings your business could see.

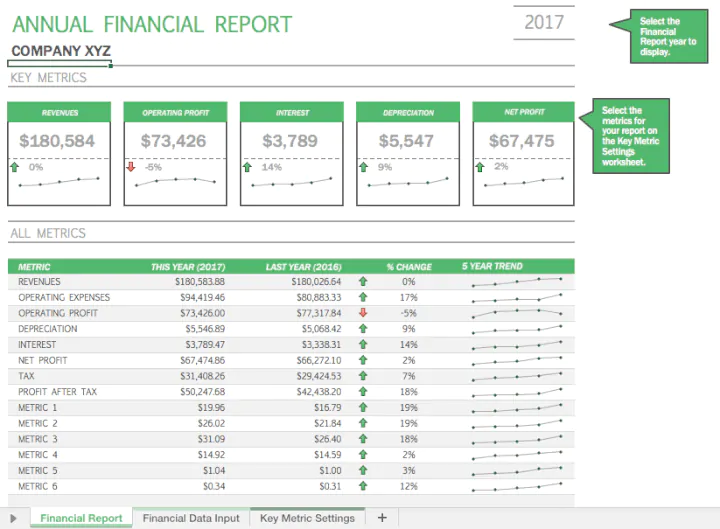
5. Build Excel Dashboards
Dashboards provide a snapshot of your current business performance so you can make data-driven decisions about the future of your business.
Excel dashboards are one of the most essential tools a company can use to visualise figures, turning lines of data into easy to read and shareable graphs and charts.
The range of dashboards you can create in Excel is enormous.
Once you’ve decided which type of dashboard you want to create, you need to make a few considerations to ensure your dashboard displays the data you wish to and is pulling data regularly (which can be done with Excel automation). The key things to think about are:
- How will we import data into the dashboard, and how often?
- How will the data in the dashboard be managed and linked to elements like charts and graphs?
- What’s the best layout and format for your dashboard, and which metrics are most important and need to be front and centre.
In addition to MS Excel, you can use Power BI for business-related data visualisation and reporting. It’s the leading tool for data visualisation and we highly recommend checking out the capabilities if Excel isn’t quite delivering what you need.

6. Use Excel For Accounting
According to an article on Accounting Today, 90 per cent of companies use Excel for budgeting, planning and forecasting operations. Excel is the go-to solution for businesses when it comes to accounting software.
One of the reasons for this the sheer number of formulas and calculations that can be used and automated in Excel for businesses using Excel for accounting.
VLOOKUP, Nesting IF Functions and Conditional IF Formulas are just three of the most valuable formulas companies use to manage and keep track of their accounts.
Additionally, because Excel is so widely used by a range of business types from eCommerce through to accountants, you can be confident that if you’re using Excel for accounting in your business, you won’t have any problems sharing a purchase ledger or invoice tracking sheet with your accountant, in a suitable format.

7. Invoice Creation & Tracking In Excel
Errors when processing orders can have a severe impact on a business, from losing a sale to going bankrupt. That means keeping track of orders is essential, and ensuring you have all the relevant information regarding the order in the same place, such as value and customer details, is a must-have.
Not only is invoice and order tracking in Excel vital for keeping your customers happy this type of report can easily be integrated into other sheets and even dashboards to give you a complete view of your business from the point of sale through to dispatch, delivery and customer service metrics like returns and complaints.
Three of the most common requests that we receive regarding setting up or updating existing invoice and order tracking spreadsheets include:
- Scanning incoming jobs reduce errors and save staff time when it comes to doing repetitive tasks.
- Setting up forms within the sheet so new orders are inputted correctly with all required information.
- Tieing in an invoice tracking sheet with stock management and sales reports to close the loop and consolidate critical business information
Why Excel Is So Important In Business
Using Excel in business is one of the best ways to streamline your processes, organise your data and improve business performance in sales and productivity.
From tracking inventory to automating repetitive tasks, we’ve covered a range of spreadsheet uses in business in this post that you can put in place today to improve the use of Excel in your business.
If you need any help using Excel or would like to discuss an idea with an Excel Expert contact us at info@theexcelexperts.com today.
NEED HELP WITH AN EXCEL PROJECT, BIG OR SMALL?
The Excel Experts can help you or your business complete an unfinished project, integrate web applications, automate tasks, and much more.

Содержание
- Uses of Microsoft Excel in Business
- Top 10 Uses of Microsoft Excel in Business
- 1. Business Analysis
- 2. People Management
- 3. Managing Operations
- 4. Performance Reporting
- 5. Office Administration
- 6. Strategic Analysis
- 7. Project Management
- 8. Managing Programs
- 9. Contract Administration
- 10. Account Management
- Why You Need Excel Skills in Business
- The Importance of Excel in Business
- Key Takeaways
- Finance and Accounting
- Marketing and Product Management
- Human Resources Planning
- You Can Do Anything With a Spreadsheet
- Excel Is Not Going Anywhere
- What Is Microsoft Excel and How Is It Used in Business?
- How Can You Create a Business Budget in Excel?
- How Do You Track Business Expenses in Excel?
Uses of Microsoft Excel in Business
Released in 1985, Microsoft Excel has grown to become arguably one of the dominant tools in workplaces across the world. With over billions of Microsoft office users, Excel uses are beyond accounting and calculating.
Be it analyzing stocks, budgeting, organizing client sales lists, or recording computer analysis, Excel plays a key role and became entrenched in businesses of any size worldwide.
Through Excel courses online, one can learn basic and advanced nuances of Excel to perform any business tasks efficiently and quickly.
Let’s have a look at the advantages of using Excel, from increasing value to improving the work output. Here the different ways Excels are used professionally.
1) Finance and Accounting
Finance and accounting are the areas that heavily rely on Excel spreadsheets for seamless and efficient output. In the past, financial analysts used to have tough times and would spend weeks using advanced formulas either manually or in programs for various accounting functions.
Now with Excel, handling complex modeling has become easy and can be performed in minutes. Excels are common in any corporate office and are widely used for crunching numbers, creating budgets, outlining financial results, forecasts, and plans used to make any major business decisions.
If you want to learn more about this program, joining the Microsoft Excel course online will give you comprehensive knowledge essential for business usage.
2) Marketing and Product Management
While marketing and product professionals are heavily focused on financial analysis and figures, using spreadsheets for tracking sales trends helps manage salesforce and plan marketing strategies on the basis of past results.
Also, using pivot tables aid in summarizing customer or sales figures and important decision making.
An online Excel course can help you learn using pivot tables in an efficient manner.
3) Human Resource Planning
While database systems such as Oracle, SAP, and Quickbooks are used to take control of payroll and employee information, deploying the data into Excel streamlines the tasks as it enables them to summarize expenses and hours by pay period, month, or year. This in turn helps have better insight into how your workforce is deployed as per function or pay level.
The Excel spreadsheet manages the data concerning employees and costs while helping to plan and control them for the future in an efficient manner.
The Microsoft Excel Courses Online can teach you to carry all these tasks with ease.
Use of Excel in Business has no Limits
· Excel creates revenue growth models involving new products on the basis of new customer predictions.
· Carry out complex calculation methods, such as Sharpe ratios
· Calculate customer revenue by-product, which helps find areas where you can build strong customer relationships.
· Calculate customer discounts on products on a monthly basis.
As Excel has become a primary tool, it is used for diverse functions in the corporate sector. An online excel course can enhance your Excel skills and open a host of opportunities, including promotions.
With the help of experts online, you can learn to excel and become a spreadsheet ninja in no time.
Источник
Top 10 Uses of Microsoft Excel in Business
What are the uses of Microsoft Excel in the workplace? The list of ways that businesses use the spreadsheet program is long. But we’ve broken it down to a top 10 list after analyzing data on 800 job ads (using Excel by the way).
The most common business uses of MS Excel are business analysis, managing lists of people, operations management, and performance reporting. The software is also handy for office administration, project management, and managing programs, contracts and accounts.
At a basic level, Excel is using for storing information, analysing and sorting, and reporting. The platform is popular in business because an Excel spreadsheet is highly visual and fairly ease to use.
1. Business Analysis
The number 1 use of Microsoft Excel in the workplace is to improve business performance through analysis. This is essentially using collected data to inform decision making.
Businesses naturally gather data in their day-to-day activities, which may be data on product sales, website traffic, spending on supplies, insurance claims, etc. Analysis is the activity of converting data into something useful to the people who run the business.
For example, you could run a profitability report by day of the week. If the business always loses money on a Sunday, that information management could be used to make a decision to not open on Sundays.
Job examples: business analyst, business planning analyst, business solutions analyst, claims analyst, collections analyst, credit officer, data analyst, data and audience analyst, finance business analyst, investment operations portfolio analyst, junior data analyst, regional finance analyst, senior data analyst, senior finance analyst, senior portfolio analyst.
2. People Management

You may be surprised to learn that one of the top uses of Microsoft Excel in business is to manage people. An Excel spreadsheet is a powerful way to organise information about people, whether they are employees, customers, supporters, or training attendees.
Using Excel, information about an individual person can be stored and retrieved efficiently. A spreadsheet row or column can be used for an individual record that may include information like name, email address, start date, items purchased, subscription status, and last contact.
Job examples: client growth coordinator, client management and administration, client relationship manager, client service manager, client service specialist, employer service consultant, HR administrator, human resources administrative assistant, human resources administrator, human resources adviser, human resources officer, junior HR analyst, reconciliation and payments officer, relationship manager.
3. Managing Operations

Excel is relied on heavily to manage the day-to-day operations of many businesses.
While Amazon uses sophisticated custom software for operations management, Microsoft Excel is an important tool for many smaller businesses (or parts of larger businesses). An advantage of Excel is that it’s relatively low tech, allowing it to be used by many people and without the risk of programming bugs.
Business activities can often involve quite complicated logistics. Inventory flows need to be controlled so that you can keep operations running smoothly – and without overstocking on particular items. That means keeping track of supplier and client transactions, listing critical dates, and managing times and schedules.
Job examples: business operations analyst, data operations manager, graduate program – supply chain and operations, in market supply chain analyst, operational business analyst, operational enablement associate, operational knowledge management specialist, supply chain associate, supply chain specialist.
4. Performance Reporting
Performance monitoring and reporting is a specialised type of company analysis that can be done effectively using Microsoft Excel. For example, many accountants still use Excel (partly because it’s compatible with cloud-based accounting software).
A common way to convert data into a performance report in Excel is to create a pivot table. By inserting a pivot table and linking it to data, you can extra useful information from the dataset quickly. Pivot tables have numerous in-built functions that allow for tasks such as counting and summing certain types of data within the dataset.
Job examples: financial accountant, forecast analyst / sales support, performance analyst, performance analyst – procurement, professional services operations analyst, reporting analyst, reporting development analyst, sales coordinator, sales operations analyst.
5. Office Administration

Underlining the importance of Microsoft Excel, office administrators use Excel to enter and store key administrative data. The same data may be subsequently used for accounting and financial reporting, as well as operations analysis and performance reporting.
Apart from recordkeeping, Excel is useful in office administration for supporting day-to-day tasks such as invoicing, paying bills, and contacting suppliers and clients. It’s an all-purpose tool for keeping track of and managing office activities.
Job examples: administration assistant, administration officer, administration supervisor, administrative assistant, business operations and office manager, junior clerical and administrative officer, office admin manager, office support – maintenance / general duties.
6. Strategic Analysis

With respect to uses of Excel, strategic analysis is where business decisions are closely connected to the data and formulas on spreadsheets. You apply Excel to guide actions such as investments and asset allocations.
As an example, based on an Excel model, you may decide to take out currency insurance. Spreadsheet analysis is designed to inform business decisions in a specific way.
Job examples: asset manager – realty management division, mergers and acquisitions valuations – analyst, membership and campaigns strategist, portfolio administration associate, portfolio analyst, portfolio associate – wealth management, portfolio management officer – asset finance.
7. Project Management
Although project managers have access to purpose-built project management (PM) software, an Excel workbook is often an effective alternative.
Projects are business activities that typically have a budget and start and end dates. Project plans can be placed into a workbook, which can then be used to track progress and keep the project on schedule. In an Excel sheet, you can create a Gantt chart to map out tasks in terms of durations and key dates.
An advantage of using Excel is that you can easily share the project workbook to others, including to people who are unfamiliar with, or lack access to, custom PM software.
Job examples: project analyst, project assistant / officer (IT), project business analyst.
8. Managing Programs

Microsoft Excel is a good platform for managing programs. It can be adapted to handle the specific characteristics of a given program. And, because MS Excel is widely known, program records can easily be managed by multiple people and, when the time comes, handed over to a new manager.
A program is like a project, but may be ongoing and can depend on participation by users. Excel helps managers allocate resources, keep track of progress, and maintain participant records. Pivot tables are useful here because you can quickly create a pivot table to summarize large amounts of data in a simple cross-tabular format.
Job examples: event coordinator, learning and development officer, learning and development coordinator, manager – internships, programs and office coordinator, records and results coordinator, training administrator.
9. Contract Administration
Contract administrators like to use Microsoft Excel because it provides a no-fuss means of recording contract details, including dates, milestones, deliverables and payments.
Many different contract management templates are available, and these can be adapted to suit the particular contract type or stage of the contract lifecycle.
Job examples: building contract administrator, contracts administrator, estimator / contracts administrator, graduate contracts administrator, lease administrator, quote and tender administrator.
10. Account Management

Account managers are generally required to be competent Excel workbook users since they receive and need to maintain customer records. Excel is commonly used in account management since it provides a simple way to share and maintain client files.
The job of an account manager is to nurture relationships with existing clients of the business. Key goals are to achieve customer loyalty and repeat sales. It’s a marketing kind of role and a popular career for MBA graduates.
Job examples: account coordinator, advertising manager, design studio account manager, digital account manager, junior account manager.
Why You Need Excel Skills in Business
If this list hasn’t convinced you already, Excel spreadsheet skills are very useful in the workplace. Your skills can also be easily adapted to other spreadsheets programs such as Google Sheets.
Not all jobs use Excel and those that do are often considered ‘middle skill‘ jobs. However, Excel is widely used. Having good spreadsheet skills gives you the ability to work on all sorts of different tasks. And you can more easily get value out of information that’s being shared in workbooks.
Once you know how to use Excel, you’ll find yourself using it more and more. You can also quickly expand from doing basic tasks such as sorting lists through to writing formulas and creating nice-looking charts and pivot tables. It’s an accessible platform that can be used to do both simple and highly sophisticated business tasks.
Источник
The Importance of Excel in Business
:max_bytes(150000):strip_icc()/eric_rosenberg_headshot_2017__eric_rosenberg-5bfc262546e0fb0051bce9ce-865c481f0f584f238d339dcb2bdd37eb.png)
:max_bytes(150000):strip_icc()/PortraitHeadshot-DavidKindness-DavidKindness-2318e84654364a0584b715e44c99f13a.jpg)
:max_bytes(150000):strip_icc()/E7F37E3D-4C78-4BDA-9393-6F3C581602EB-2c2c94499d514e079e915307db536454.jpeg)
Pete Rathburn is a copy editor and fact-checker with expertise in economics and personal finance and over twenty years of experience in the classroom.
Microsoft (NASDAQ: MSFT) Excel is a spreadsheet software application used to store, organize, and analyze data. It was released in 1985 and has grown to become arguably the most important computer program in workplaces around the world. In business, any function in any industry can benefit from those with strong Excel knowledge.
Excel is a powerful tool that has become entrenched in business processes worldwide—whether for analyzing stocks or issuers, budgeting, or organizing client sales lists.
Key Takeaways
- Microsoft Excel is a spreadsheet application used to manipulate stored data.
- Finance and accounting professionals choose Excel for its complex analytical and computing features.
- Microsoft Excel enables users to identify trends and organize and sort data into meaningful categories.
- Excel also performs Human Resources functions, such as sorting worked hours and organizing employee profiles and expenses, which help businesses better understand the structure and activities of their workforce.
- Pivot tables summarize data from a worksheet into a chart.
Finance and Accounting
Financial services and financial accounting are the areas of finance that rely on and benefit from Excel spreadsheets the most. In the 1970s and early 1980s, financial analysts would spend weeks running advanced formulas either manually or (beginning in 1983) on programs like Lotus 1-2-3. Now, you can perform complex modeling in minutes with Excel.
Walk through the finance or accounting department of any major corporate office, and you will see computer screens filled with Excel spreadsheets crunching numbers, outlining financial results, and creating budgets, forecasts, and plans used to make major business decisions.
Most users know that Excel can add, subtract, multiply, and divide, but it can do much more with advanced IF functions when coupled with VLOOKUP, INDEX-MATCH-MATCH, and pivot tables.
Marketing and Product Management
While marketing and product professionals look to their finance teams to do the heavy lifting for financial analysis, using spreadsheets to list customer and sales targets can help you manage your salesforce and plan future marketing strategies based on past results.
Using a pivot table, users can quickly and easily summarize customer and sales data by category with a quick drag-and-drop.
Human Resources Planning
While database systems like Oracle (ORCL), SAP (SAP), and Quickbooks (INTU) can be used to manage payroll and employee information, exporting that data into Excel allows users to discover trends, summarize expenses and hours by pay period, month, or year, and better understand how their workforce is spread out by function or pay level.
In Excel, all dates prior to March 1, 1900 are incorrect due to an irreparable error.
HR professionals can use Excel to take a giant spreadsheet full of employee data and understand exactly where the costs are coming from and how to best plan and control them for the future.
You Can Do Anything With a Spreadsheet
Using Excel for business has almost no limits for applications. Here are some examples:
- When planning a team outing to a baseball game, you can use Excel to track the RSVP list and costs.
- Excel creates revenue growth models for new products based on new customer forecasts.
- When planning an editorial calendar for a website, you can list out dates and topics in a spreadsheet.
- When creating a budget for a small product, you can list expense categories in a spreadsheet, update it monthly and create a chart to show how close the product is to budget across each category.
- You can calculate customer discounts based on monthly purchase volume by product.
- Users can summarize customer revenue by product to find areas where to build a stronger customer relationships.
- Use complex calculation methods, like Sharpe ratios.
Excel was the first software application to use a toolbar.
Excel Is Not Going Anywhere
Excel is not going anywhere, and businesses will continue to use Excel as a primary tool for diverse functions and applications ranging from IT projects to company picnics.
Working knowledge of Excel is vital for most office-based professionals today, and stronger Excel skills can open the door to promotion and leadership opportunities. Excel is a powerful tool but cannot function alone. It takes a savvy computer user to take advantage of everything Excel has to offer to provide the best results for their company.
What Is Microsoft Excel and How Is It Used in Business?
Microsoft Excel is a computer software program that uses spreadsheets to organize and analyze stored data. Businesses use Excel for budgeting, analysis, forecasting, spotting trends, reporting, and more.
How Can You Create a Business Budget in Excel?
Excel is outfitted with many templates for personal and business uses. The simplest way to create a business budget is to select a budget template that’s most appropriate for your business. Most contain labels for input, formulas for analysis, and other worksheets for the most recognized budgeting categories, such as income, personnel expenses, and operating expenses. Users can also manually create their budget, inputting their labels, tables, and formulas.
How Do You Track Business Expenses in Excel?
Excel contains templates for tracking expenses. One of the most commonly used is the Expense Report template with categories for specific business-related expenses. Data is organized into columns with column headers or labels that can be changed or deleted if not fitting for the user’s business. The template is formatted for ease of use, allowing the user to input data into designated cells. Users can also create their expense reports manually.
Источник
Contents
- 1 Is Excel good for small business?
- 2 How do you create a business sheet in Excel?
- 3 What are the 3 common uses for Excel?
- 4 Do accountants use Excel a lot?
- 5 What businesses use Excel?
- 6 How do I record sales in Excel?
- 7 How do I create a spreadsheet for my business expenses?
- 8 What are the 5 functions in Excel?
- 9 What is the formulas in Excel?
- 10 What is spreadsheet example?
- 11 How is Excel useful in business?
- 12 What is VLOOKUP in Excel?
- 13 What Excel skills are most valuable for accounting?
- 14 What jobs use Excel the most?
- 15 What Excel skills are employers looking for?
- 16 How do I buy excel?
- 17 How do you sum daily sales in Excel?
- 18 How do I keep track of business finances in Excel?
- 19 How do I track business income and expenses?
- 20 How do I learn Excel formulas?
Is Excel good for small business?
Excel is an ok place to start for small business owners. It’s hard to overlook the access to customizable, simple worksheets that come with free Excel versions. However, owners will soon discover a host of problems that can arise, including the risk of broken formulas, misplaced data, and lost files.
How do you create a business sheet in Excel?
How to Create a Bookkeeping System in Excel
- Step 1: Start with a bookkeeping Excel sheet template.
- 3 Necessary Parts of an Excel Bookkeeping System.
- Step 2: Customize the chart of accounts within your template.
- Step 3: Customize the income statement sheet.
- Add a sheet for tracking invoices.
What are the 3 common uses for Excel?
The three most common general uses for spreadsheet software are to create budgets, produce graphs and charts, and for storing and sorting data. Within business spreadsheet software is used to forecast future performance, calculate tax, completing basic payroll, producing charts and calculating revenues.
Do accountants use Excel a lot?
Accountants use Excel as most users who use Excel daily would. Any professional that understands the power of Excel knows that you have to maximize it if you want the most benefit out of it. Short answer: It really depends on what type of accountant they are, what they do, and how much data they have to work with.
What businesses use Excel?
How to use Excel for Business
- Accounting. Virtually every accounting professional uses Excel in some capacity.
- Inventory Tracking.
- Compiling Mailing and Contact Lists.
- Visualizations.
- HR Management.
- Checklists and Task Lists.
- Time Logs.
- How can a CRM help?
How do I record sales in Excel?
Open a workbook with a table you’d like to format into a sales report. Click and drag to select the data you want to appear in the report. Select non-adjacent data by pressing and holding “Ctrl” before you drag. Include data for items or categories and sales figures in your selection.
How do I create a spreadsheet for my business expenses?
In short, the steps to create an expense sheet are:
- Choose a template or expense-tracking software.
- Edit the columns and categories (such as rent or mileage) as needed.
- Add itemized expenses with costs.
- Add up the total.
- Attach or save your corresponding receipts.
- Print or email the report.
What are the 5 functions in Excel?
5 Functions of Excel/Sheets That Every Professional Should Know
- VLookup Formula.
- Concatenate Formula.
- Text to Columns.
- Remove Duplicates.
- Pivot Tables.
What is the formulas in Excel?
In Excel, a formula is an expression that operates on values in a range of cells or a cell. For example, =A1+A2+A3, which finds the sum of the range of values from cell A1 to cell A3.
What is spreadsheet example?
Examples of spreadsheet programs
- Google Sheets – (online and free).
- iWork Numbers – Apple Office Suite.
- LibreOffice -> Calc (free).
- Lotus 1-2-3 (discontinued).
- Lotus Symphony – Spreadsheets.
- Microsoft Excel.
- OpenOffice -> Calc (free).
- VisiCalc (discontinued).
How is Excel useful in business?
At a basic level, MS Excel is using for storing information, analysing and sorting, and reporting.Some of the most common business uses of MS Excel are for business analysis, managing human resources, performance reporting, and operations management. We know this for a fact after analysing job data (using MS Excel).
What is VLOOKUP in Excel?
VLOOKUP stands for ‘Vertical Lookup’. It is a function that makes Excel search for a certain value in a column (the so called ‘table array’), in order to return a value from a different column in the same row.
What Excel skills are most valuable for accounting?
Let’s look at 7 essential Excel skills for accountants.
- Keyboard Shortcuts.
- Repeat the Last Action.
- Perform Calculations Without Formulas.
- Easy Charting with Sparklines.
- Using Data Validation to Limit Users’ Options.
- Using Proper Cell Referencing.
- Summarize Data with Pivot Tables.
What jobs use Excel the most?
Excel is a versatile program that is widely used in many career fields.
You may change your mind when you see this list of careers that require it.
- Administrative Assistant.
- Accountants.
- Retail Manager.
- Cost Estimator.
- Financial Analyst.
- Project Manager.
- Business Analyst.
- Data Journalist.
What Excel skills are employers looking for?
Below is the list of Microsoft Excel skills that you need to look for while hiring the entry-level hires:
- SUMIF/SUMIFS.
- COUNTIF / COUNTIFS.
- Data Filters.
- Data Sorting.
- Pivot Tables.
- Cell Formatting.
- Data validation.
- Excel shortcut keys.
How do I buy excel?
You can buy standalone versions of Word, Excel, and PowerPoint for Mac or PC. Go to the Microsoft Store and search for the app you want. You can also get a one-time purchase or a subscription version of Visio or Project, available for PCs only. Buy Visio or buy Project.
How do you sum daily sales in Excel?
For example, say management wants to be able to determine the total sales receipts for each product category any day of the month.
Here are the steps:
- Select cells I5:I8.
- Enter the following formula:
- =SUMIF($A$2:$A$21,$H$2,OFFSET($A$2:$A$21,0,MATCH(H5,$1:$1,)-1))
- Press Ctrl + Enter.
How do I keep track of business finances in Excel?
Your business can also use a spreadsheet to summarize and compare your expenses over time.
Creating an Expense Summary Spreadsheet
- Use the columns at the top of the page for the months.
- Use the left hand column for each expense category.
- In each cell, enter the amount you spent on that category during that month.
How do I track business income and expenses?
Here’s how you can track your business expenses:
- Open a business bank account.
- Choose an appropriate accounting system.
- Choose cash or accrual accounting.
- Connect financial institutions.
- Begin managing receipts properly.
- Record all expenses promptly.
- Consider using an expense app.
How do I learn Excel formulas?
To enter a formula, execute the following steps.
- Select a cell.
- To let Excel know that you want to enter a formula, type an equal sign (=).
- For example, type the formula A1+A2. Tip: instead of typing A1 and A2, simply select cell A1 and cell A2.
- Change the value of cell A1 to 3.
Excel. Chances are, that word alone inspires visions of lengthy spreadsheets, complicated macros, and the occasional pivot table or bar graph.
It’s true—with more than one billion Microsoft Office users globally, Excel has become the professional standard in offices across the globe for pretty much anything that requires management of large amounts of data.
But, if you think Excel is only good for making you cross-eyed while looking at a bunch of numbers and financial reports, think again. As Tomasz Tunguz points out, there are tons of uses of Excel in business (and beyond) outside of simple spreadsheets. In fact, the potential uses are seemingly endless.
There’s no way for us to compile a list that captures every one of Excel’s possible applications (even if you were up for reading a War and Peace-sized listicle).
However, in an effort to demonstrate the power and flexibility of everybody’s favorite spreadsheet tool, we’ve pulled together different ways that you could use Excel—both professionally, personally, and just for the fun of it.
Free Excel crash course
Learn Excel essentials fast with this FREE course. Get your certificate today!
Start free course
All about numbers
Of course, the core purpose of Excel all boils down to numbers. If you need to sort, retrieve, and analyze a large (or even small!) amount of data, Excel makes it a breeze.
Here are a few broad categories to keep in mind when it comes to implementing Excel for anything numbers-related.
1. Calculating
Find yourself running the same calculations over and over again? Build yourself a totally customized calculator in Excel by programming your commonly-used formulas. That way, you just need to punch in your digits and Excel will spit the answer out for you—no elbow grease required.
2. Accounting
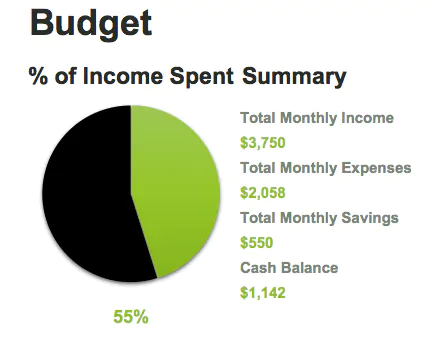
Budget plans, forecasts, expense tracking, financial reports, loan calculators, and more. Excel was pretty much designed to meet these different accounting needs. And, considering that 89 percent of companies utilize Excel for its various accounting functions, it obviously fits the bill.
Excel even has numerous different spreadsheet templates to make all of those processes that much easier.
3. Charting
Pie charts, scatter charts, line charts, bar charts, area charts, column charts—the list goes on and on. If you need to find a way to represent data in a more visual and digestible way, Excel’s ability to transform rows and columns of digits into beautiful charts is sure to become one of your favorite things about it.
Want more information about the types of charts you can create in Excel? This article is a helpful resource.
Want to learn more?
Take your Excel skills to the next level with our comprehensive (and free) ebook!
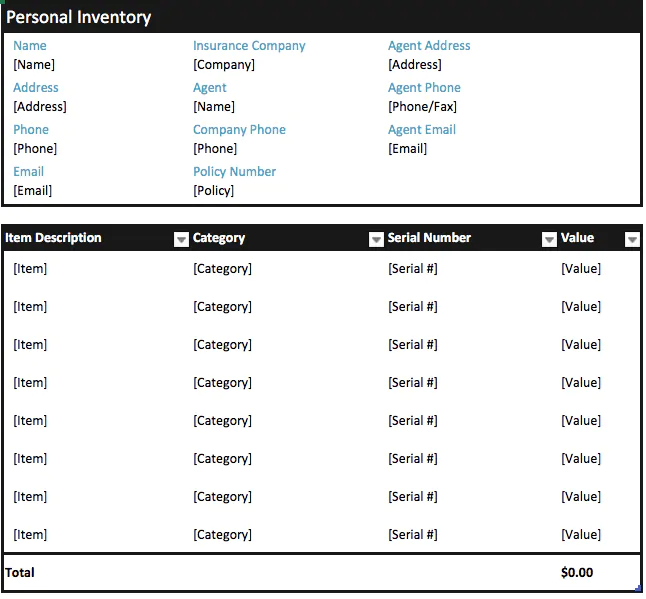
4. Inventory tracking
Tracking inventory can be a headache. Fortunately, Excel can help to keep employees, business owners, or even individuals organized and on top of their inventory—before any major problems crop up.
Making a plan
Let’s move on from the numbers—there are plenty of things that Excel can help you plan and organize that don’t necessarily involve endless rows of digits.
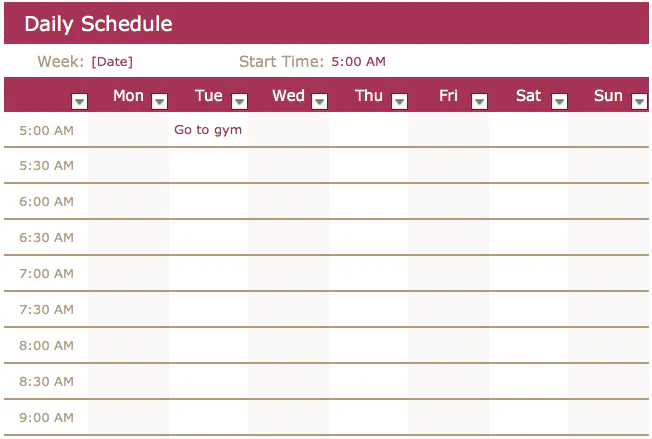
5. Calendars and schedules
Need to map out a content calendar for your blog or website? Lesson plans for your classroom? A PTO schedule for you and all of your co-workers? A daily schedule for you or your family? When it comes to various calendars, Excel can be surprisingly robust.
6. Seating charts
From a large corporate luncheon to a wedding, arranging a seating chart can be a royal headache. Fortunately, Excel can make it a total breeze. If you’re a real whiz, you’ll be able to automatically create your seating chart using your spreadsheet of RSVPs. Need help getting this done? This article provides a detailed walkthrough of how you can create a seating chart in Excel.

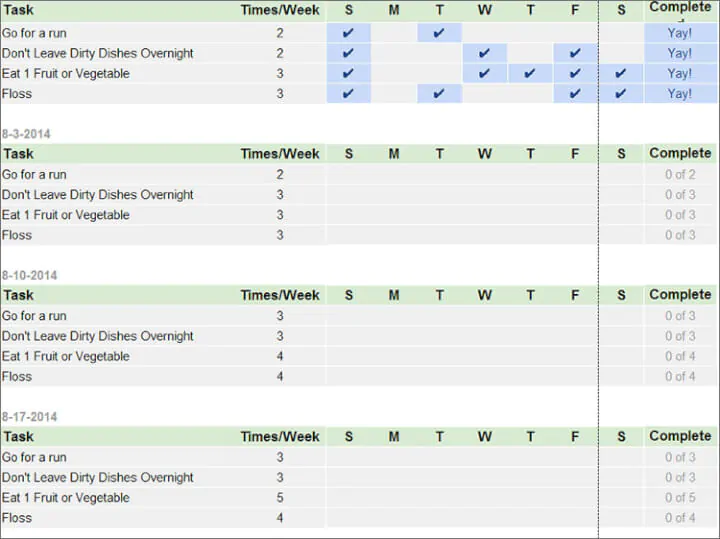
7. Goal planning worksheet
From professional goals to fitness goals to financial goals, it helps to have something to keep you focused and on track. Enter the beauty of Excel. Using the tool, you can create various worksheets, logs, and planning documents to help you monitor your progress—and, hopefully, cross the finish line.
8. Mock-ups
Excel might not be the first platform you think of when it comes to design. But, believe it or not, you can use the tool to put together various mock-ups and prototypes. In fact, it’s a surprisingly popular choice for creating website wireframes and dashboards.
Getting stuff done
Want to kick your productivity into high gear? Well, Excel can swoop in and save the day with a variety of uses that can help you tackle your tasks and to-dos with ease and organization.
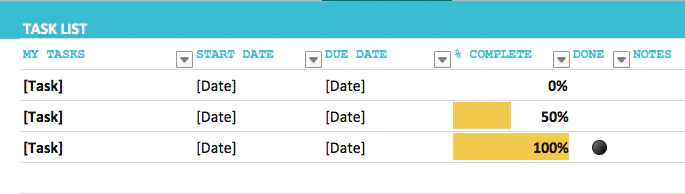
9. Task list
Say goodbye to your standard pen and paper to-do list. With Excel, you can make a far more robust task list—and even track your progress on those larger to-dos that are currently on your plate.
10. Checklist
Similarly, you can create a simple checklist that allows you to tick off the things you’ve purchased or accomplished—from a grocery list to a roster of to-dos for an upcoming marketing campaign.
11. Project management charts
We’ve already touched on the fact that Excel is a total beast when it comes to creating charts. And, this concept holds true when it comes to various charts for project management.
From waterfall charts to manage your team’s progress to kanban style boards (just like Trello!) to keep things organized, there are tons of ways that Excel can help keep your project on track.

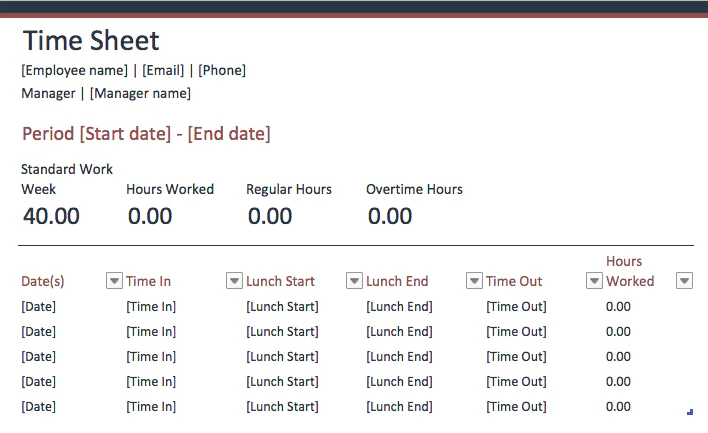
12. Time logs
You know that tracking time can be a huge asset to you and your productivity. While there are plenty of fancy apps and tools to help meet that need, you can think of Excel as the original tool for logging your time. And, it still serves as a suitable option today.
Involving other people
Need to collect information from other people? Survey tools and forms are one option. But, rest assured, you can also create your own in Excel.
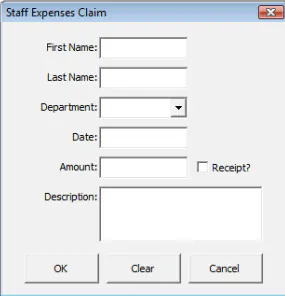
13. Forms
From simple to complicated, Excel is a great option for creating forms. You can even program various drop-down menus so that users can select their choice from a pre-set list.
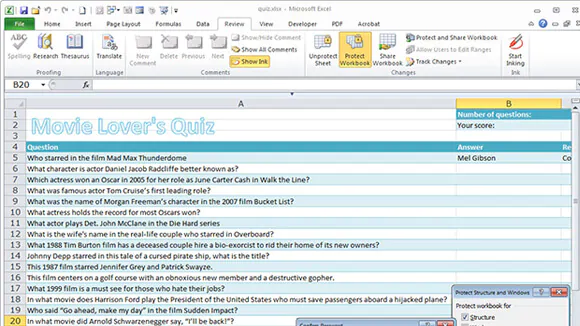
14. Quizzes
Trying to test somebody else’s—or even your own—knowledge of a subject? In Excel, you can create a bank of questions and answers in one worksheet, and then instruct Excel to quiz you in another.
Staying in touch
Managing relationships is crucial to your success both professionally and personally. Fortunately, Excel makes it easy to keep in touch.
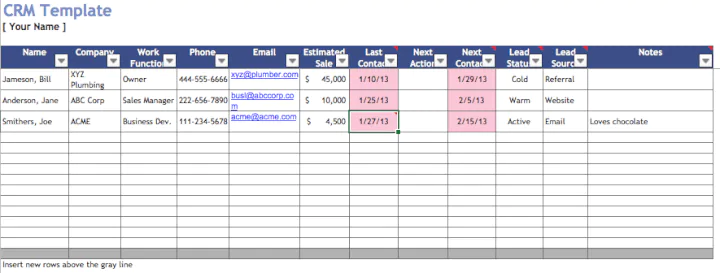
15. CRM
Need a lightweight CRM to stay top of mind for your customers? You can make one in Excel. And, the best part? Building your own means it will be totally customizable. Sales Hacker also put together a nifty set of free sales excel templates you can use to help get started!
16. Mailing list
Data doesn’t just have to involve numbers. Excel is also great at managing and sorting large amounts of names and addresses—making it the perfect solution for your invite list for that company holiday party or the mailing list for that large promotion or campaign.
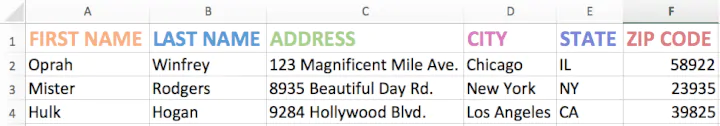
Using Excel, you can also mail merge—which makes it that much easier to print address labels and other necessary materials.
You can also apply a similar concept to create things like directories, RSVP lists, and other rosters that involve a large amount of information about people.
Just for fun
Excel doesn’t need to be all work and no play. There are plenty of other fun things you can create using the spreadsheet tool.
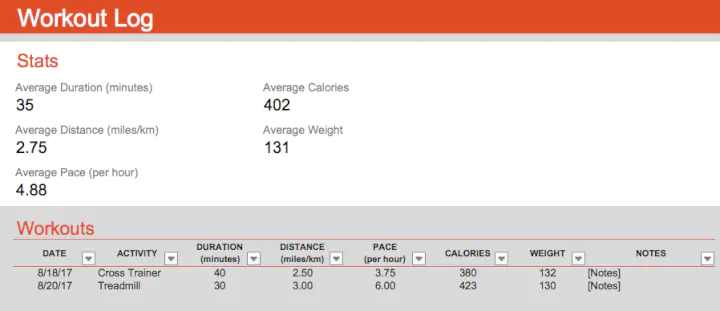
17. Historical logs
Whether you want to keep track of the various craft beers you’ve tasted, the workouts you’ve completed, or something else entirely, you can think of Excel as your go-to resource for keeping those things sorted and logged.
18. Sudoku puzzles
Love Sudoku puzzles? As it turns out, you can make your own in Excel. Or, if you find yourself stuck on a particularly challenging one, you can enlist the help of Excel to help you get it figured out!
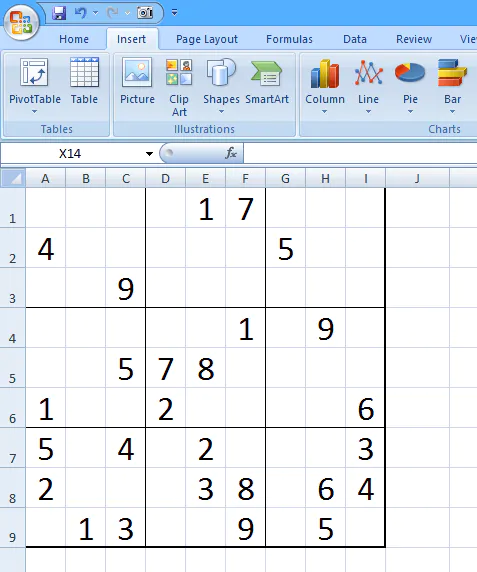
Need help creating the Sudoku solver and generator? This post will get you well on your way!
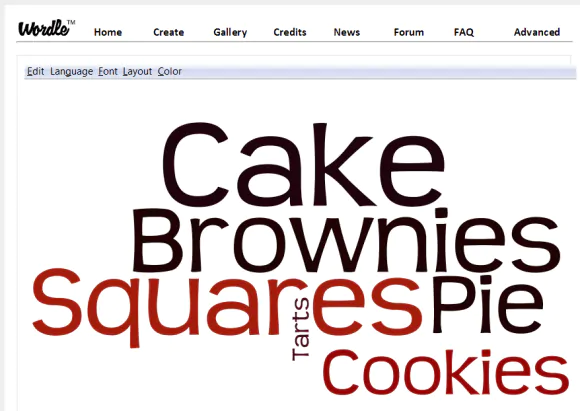
19. Word cloud
Word clouds might not be the most scientific representations of data. But, they’re a fun (not to mention beautiful way) to gain an understanding of what words are being utilized most. You guessed it—you can create one using Excel. Here’s how to use information from Excel to create a word cloud in Wordle.
20. Art and animations
The capabilities of Excel likely extend far beyond what you’d initially anticipate. In fact, many people have used the tool to create some downright awesome art—from pixelated portraits to animations.
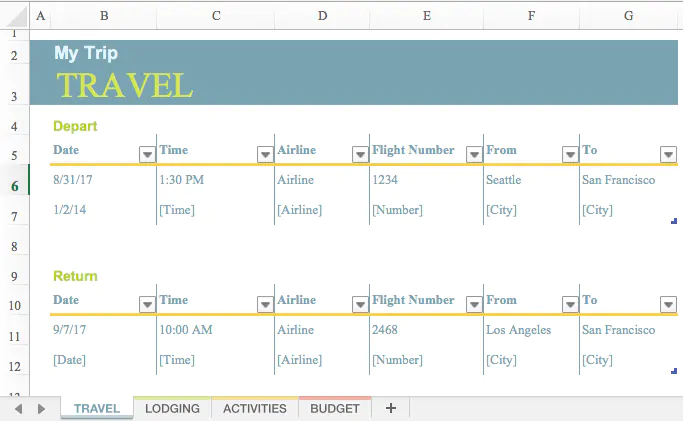
21. Trip planner
Have a vacation coming up? Make sure you have everything covered by creating yourself a helpful itinerary before you pack your bags and head out. Excel even has a handy trip planner template you can use to make sure you don’t miss anything (from your budget to airline information!).
Over to you
This might seem like a lengthy list. But, rest assured, it barely scratches the surface of all of the different things—aside from simple spreadsheets—that Excel is capable of. From lists to charts to design mock-ups, the different uses of Excel are seemingly limitless.
Feeling intimidated? Don’t worry — you can learn Excel online, all at your own pace, and become a spreadsheet ninja in no time.
Do you have something cool you like to create using Excel? Let us know in the comments!
Free Excel crash course
Learn Excel essentials fast with this FREE course. Get your certificate today!
Start free course
Microsoft (NASDAQ: MSFT) Excel is a spreadsheet software application used to store, organize, and analyze data. It was released in 1985 and has grown to become arguably the most important computer program in workplaces around the world. In business, any function in any industry can benefit from those with strong Excel knowledge.
Excel is a powerful tool that has become entrenched in business processes worldwide—whether for analyzing stocks or issuers, budgeting, or organizing client sales lists.
Key Takeaways
- Microsoft Excel is a spreadsheet application used to manipulate stored data.
- Finance and accounting professionals choose Excel for its complex analytical and computing features.
- Microsoft Excel enables users to identify trends and organize and sort data into meaningful categories.
- Excel also performs Human Resources functions, such as sorting worked hours and organizing employee profiles and expenses, which help businesses better understand the structure and activities of their workforce.
- Pivot tables summarize data from a worksheet into a chart.
Finance and Accounting
Financial services and financial accounting are the areas of finance that rely on and benefit from Excel spreadsheets the most. In the 1970s and early 1980s, financial analysts would spend weeks running advanced formulas either manually or (beginning in 1983) on programs like Lotus 1-2-3. Now, you can perform complex modeling in minutes with Excel.
Walk through the finance or accounting department of any major corporate office, and you will see computer screens filled with Excel spreadsheets crunching numbers, outlining financial results, and creating budgets, forecasts, and plans used to make major business decisions.
Most users know that Excel can add, subtract, multiply, and divide, but it can do much more with advanced IF functions when coupled with VLOOKUP, INDEX-MATCH-MATCH, and pivot tables.
Marketing and Product Management
While marketing and product professionals look to their finance teams to do the heavy lifting for financial analysis, using spreadsheets to list customer and sales targets can help you manage your salesforce and plan future marketing strategies based on past results.
Using a pivot table, users can quickly and easily summarize customer and sales data by category with a quick drag-and-drop.
Human Resources Planning
While database systems like Oracle (ORCL), SAP (SAP), and Quickbooks (INTU) can be used to manage payroll and employee information, exporting that data into Excel allows users to discover trends, summarize expenses and hours by pay period, month, or year, and better understand how their workforce is spread out by function or pay level.
In Excel, all dates prior to March 1, 1900 are incorrect due to an irreparable error.
HR professionals can use Excel to take a giant spreadsheet full of employee data and understand exactly where the costs are coming from and how to best plan and control them for the future.
You Can Do Anything With a Spreadsheet
Using Excel for business has almost no limits for applications. Here are some examples:
- When planning a team outing to a baseball game, you can use Excel to track the RSVP list and costs.
- Excel creates revenue growth models for new products based on new customer forecasts.
- When planning an editorial calendar for a website, you can list out dates and topics in a spreadsheet.
- When creating a budget for a small product, you can list expense categories in a spreadsheet, update it monthly and create a chart to show how close the product is to budget across each category.
- You can calculate customer discounts based on monthly purchase volume by product.
- Users can summarize customer revenue by product to find areas where to build a stronger customer relationships.
- Use complex calculation methods, like Sharpe ratios.
Excel was the first software application to use a toolbar.
Excel Is Not Going Anywhere
Excel is not going anywhere, and businesses will continue to use Excel as a primary tool for diverse functions and applications ranging from IT projects to company picnics.
Working knowledge of Excel is vital for most office-based professionals today, and stronger Excel skills can open the door to promotion and leadership opportunities. Excel is a powerful tool but cannot function alone. It takes a savvy computer user to take advantage of everything Excel has to offer to provide the best results for their company.
What Is Microsoft Excel and How Is It Used in Business?
Microsoft Excel is a computer software program that uses spreadsheets to organize and analyze stored data. Businesses use Excel for budgeting, analysis, forecasting, spotting trends, reporting, and more.
How Can You Create a Business Budget in Excel?
Excel is outfitted with many templates for personal and business uses. The simplest way to create a business budget is to select a budget template that’s most appropriate for your business. Most contain labels for input, formulas for analysis, and other worksheets for the most recognized budgeting categories, such as income, personnel expenses, and operating expenses. Users can also manually create their budget, inputting their labels, tables, and formulas.
How Do You Track Business Expenses in Excel?
Excel contains templates for tracking expenses. One of the most commonly used is the Expense Report template with categories for specific business-related expenses. Data is organized into columns with column headers or labels that can be changed or deleted if not fitting for the user’s business. The template is formatted for ease of use, allowing the user to input data into designated cells. Users can also create their expense reports manually.