
Содержание
- Воробьёв в.В.
- Пособие для начинающих
- Содержание
- Общие сведения Окно программы Рис.1
- П Рис.3анели инструментов
- Excel 2000 — как вершина эволюции электронных таблиц
- От VisiCalc до Excel 2000
- Что нового в Excel 2000
- Интеграция с Web
- Публикация в Интернете
- Web-компонент (Электронная таблица)
- Web-компонент Chart (Диаграмма)
- Web-компонент PivotTable (Сводная таблица)
- Расширены возможности Web-запросов
- Сводные таблицы и сводные диаграммы
- Совершенствование коллективной работы
- Отправление почты непосредственно из Excel
- Web-обсуждения
- Упрощение работы
- Автозаполнение списков
- Усовершенствованы параметры просмотра и форматирования
- Расширены возможности форматирования ячеек
- Предотвращение проблем, связанных с 2000 годом
- Поддержка денежной единицы евро
- Улучшены условия для доступа и анализа данных
- Оперативный анализ данных
- Поддержка технологий OLE DB и ADO
Воробьёв в.В.


Пособие для начинающих
Microsoft Excel 2000: Пособие для начинающих. — К.: 2000. – 36 с., с ил.
Данное учебное пособие посвящено табличному процессору Microsoft Excel 2000, который входит в пакет Microsoft Office 2000. Пособие содержит описание основных операций создания и обработки таблиц с помощью Microsoft Excel.
Пособие рассчитано на пользователей, которые имеют минимальный опыт работы в среде Windows.
Содержание
Общие сведения 3
Окно программы 3
Панели инструментов 4
Рабочая книга 5
Выделение элементов таблицы 6
Заполнение ячеек 6
Отмена операций 6
Создание рабочей книги 7
Открытие рабочей книги 8
Сохранение рабочей книги 9
Закрытие рабочей книги 9
Завершение работы с Microsoft Excel 9
Работа с формулами 9
Основные сведения 10
Массивы формул 11
Сообщения об ошибках 12
Операции с элементами таблицы 12
Вставка элементов таблицы 12
Удаление элементов таблицы 13
Удаление содержимого элементов таблицы 13
Копирование и перемещение данных 13
Буфер обмена 14
Поиск данных 14
Зaменa данных 15
Операции с листами рабочих книг 15
Формат данных 16
Формат чисел 16
Маски форматов 17
Выравнивание содержимого ячеек 19
Установление шрифта 20
Изменение размеров строк и столбцов 21
Оформление таблиц 22
Группирование элементов таблицы 24
Работа с окнами 25
Разделение окон 25
Создание нового окна 25
Фиксация подокон 26
Присвоение имени ячейке, диапазону или формуле 26
Создание примечаний 27
Работа с базами данных 28
Сортировка данных 28
Формы данных 29
Установление диапазона критериев 31
Расширенный фильтр 33
Создание диаграмм 34
Печать таблиц 35
Общие сведения Окно программы Рис.1
Microsoft Excel 2000 – табличный процессор, программа для создания и обработки электронных таблиц. Ярлык Microsoft Excel 2000 имеет вид на рис.1.
Microsoft Excel позволяет работать с таблицами в двух режимах:
Обычный – наиболее удобный для выполнения большинства операций.
Разметка страниц – удобен для окончательного форматирования таблицы перед распечаткой. Границы между страницами в этом режиме отображаются синими пунктирными линиями. Границы таблицы – сплошной синей линией, перетягивая которую, можно изменять размеры таблицы.
Для перехода между режимами Обычный и Разметка страниц используются соответствующие пункты меню Вид.

Рис.2. Окно Microsoft Excel
Под заголовком окна находится строка меню, через которую можно вызвать любую команду Microsoft Excel. Для открытия меню необходимо щелкнуть мышью на его имени. После этого появятся те команды этого меню, которые используются наиболее часто (рис.3). Если щелкнуть по кнопке  в нижней части меню то появятся все команды этого меню (рис.4).
П Рис.3анели инструментов

од строкой меню расположены панели инструментов, которые состоят из кнопок с рисунками. Каждой кнопке соответствует команда, а рисунок на этой кнопке передает значение команды. Большинство кнопок дублирует наиболее часто употребляемые команды, доступные в меню. Для вызова команды, связанной с кнопкой, необходимо щелкнуть мышью на этой кнопке. Если навести указатель мыши на кнопку, рядом появится рамка с названием команды.
Обычно под строкой меню находятся две панели инструментов – Стандартная и Форматирование. Чтобы вывести или убрать панель с экрана, следует выбрать в меню Вид пункт Панели инструментов, а затем щелкнуть на имя нужной панели. Если панель присутствует на экране, то рядом с ее именем будет стоять метка .


сли для отображения всех кнопок на панели не достаточно места, то выводятся кнопки, которые были использованы последними. Если нажать на кнопку  в конце панели, то появятся остальные кнопки (рис.5). При нажатии на кнопку Добавить или удалить кнопки появится меню (рис.6), в котором можно вывести или убрать кнопку с панели.
Также для изменения состава панели инструментов, используется окно Настройка из меню Сервис. В диалоговом окне необходимо выбрать вкладыш Команды. В списке Категории выбирается группа кнопок, после чего в списке К

оманды появляются кнопки этой группы. Чтобы добавить кнопку на панель инструментов, следует перетянуть ее из диалогового окна в нужную позицию меню. Процесс установления кнопки завершается щелчком кнопки Закрыть. Для удаления кнопки с панели инструментов необходимо перетянуть ее в диалоговое окно Настройка.
Управлять панелями инструментов удобно с помощью контекстного меню (рис.7), которое вызывается нажатием правой клавиши мыши на любой кнопке.
Под панелями инструментов Microsoft Excel обычно находится строка формул, а в нижней части окна – строка состояния. Чтобы вывести или убрать эти строки, следует в меню Вид выбрать соответствующие пункты: Строка формул (рис.8) или Строка состояния.
Источник
Excel 2000 — как вершина эволюции электронных таблиц
От VisiCalc до Excel 2000
В истории развития техники известны примеры, когда изобретатель новой технологии на многие годы и десятилетия становился лидером в распространении, развитии и коммерциализации своего детища. Примерно так было с изобретениями Белла или Жилета. Однако есть в истории и примеры того, как автор какого-либо творения со временем оставался в стороне от дальнейшего развития, совершенствования и, увы, продвижения в массы предложенной им технологии. В этом смысле интерес представляет эволюция электронных таблиц и переход пальмы первенства в распространении этого типа программ от одной компьютерной компании к другой.
Начало созданию электронных таблиц было положено еще в 1979 году, когда два студента, Дэн Бриклин и Боб Френкстон, на компьютере Apple II создали первую программу электронных таблиц, которая получила название VisiCalc от Visible Calculator (наглядный калькулятор). Основная идея программы заключалась в том, чтобы в одни ячейки помещать числа, а в других задавать закон их математического преобразования.
Эта идея определила целый класс программ, которые теперь принято называть табличными процессорами. VisiCalc получила широкое распространение как первая электронная таблица, однако вскоре уступила свои позиции Lotus 1-2-3, которая обогнала ее по количеству продаж, прежде всего в силу более широкого распространения IBM-совместимых компьютеров, под которые она разрабатывалась. Когда же Windows стал ведущей настольной операционной системой, пальма первенства перешла к Excel, которая на сегодняшний день является самой распространенной и самый продаваемой в мире электронной таблицей. Однако бесспорно, что компания Microsoft вышла вперед по продвижению на рынок электронных таблиц не только благодаря успехам своей операционной системы.
Конкуренция не дает остановиться процессу интенсивного развития офисных программ. Оставаясь на вершине, Microsoft имеет достаточно конкурентов. Например, в последнее время появляется все больше инсталляций под Linux, под который бесплатно распространяется табличный процессор от компании Sun в рамках пакета StarOffice. И, конечно, Microsoft не стоит на месте. Кажется, совсем недавно вышел новый релиз — Excel 97— программа, в которой появилось множество новых возможностей. И вот сегодня мы уже имеем Office 2000 и соответственно Excel 2000 — существенно модернизированную и усовершенствованную версию. О том, какие же изменения претерпела Excel, вы сможете узнать из данной статьи.
Что нового в Excel 2000
Excel 2000 сегодня предлагает самый широкий набор инструментов для создания анализа, обмена и совместного использования электронных таблиц. Одно из достоинств Excel 2000 заключается в том, что она поддерживает формат Excel 97, и поэтому просмотреть файл, подготовленный в Excel 2000, в большинстве случаев смогут даже те, кто еще не перешел на новую версию табличного процессора 1 .
Интеграция с Web
Конечно, основное новшество, появившееся в Excel 2000, заключается в том, что программа позволяет сохранять файлы с разметкой HTML в качестве базового формата, который теперь является равноправным форматом хранения документов для всех приложений Office 2000. Это приобретение предоставляет возможность донести результаты анализа данных, полученные с помощью Excel, до широкой аудитории пользователей Интернета в том виде, в каком он был создан. Помещение данных на Web позволяет получить доступ к данным и пользоваться интерактивными возможностями, не устанавливая Excel на компьютере. Для этого требуется соответствующий Web-обозреватель и доступ к Интернету или Интранету.
Публикация в Интернете
Используя возможности Excel 2000, вы можете опубликовать как всю рабочую книгу, так и любую ее часть. Существует два варианта сохранения данных в формате HTML: «только для просмотра» и «интерактивный».
Документ, полученный в первом случае, представляет собой статическую Web-страницу (неизменяемая копия данных), которую можно просматривать в последних версиях большинства распространенных обозревателей. Второй вариант создает документ в виде интерактивной Web-страницы, обеспечивающей взаимодействие с пользователем.
Публикация статической таблицы или базы данных без возможности интерактивной работы с ней является малоэффективным средством. Если же опубликовать документ в его естественном формате, то для работы с ним пользователю одного только браузера будет недостаточно, а понадобится само офисное приложение. Чтобы устранить эти проблемы, Microsoft выпустила набор Web-компонентов, которые служат для публикации на Web и для обеспечения доступа к электронным таблицам, диаграммам и базам данных. Все эти компоненты открывают доступ к данным из обозревателя.
Необходимо отметить, что просмотр интерактивных Web-страниц возможен не из всех браузеров; для работы с интерактивными элементами необходим браузер, поддерживающий элементы управления ActiveX. Так, например, пользователи Internet Explorer (не ранее версии 4.01 2 ) не будут иметь проблем при просмотре подобных документов, а вот пользователи Netscape Communicator просмотреть интерактивные страницы не смогут.
При публикации интерактивных элементов имеется опция Добавить интерактивность (рис. 1).
Web-компонент (Электронная таблица)
Выглядит как внедренный в Web-страницу лист Excel (рис. 2) и выполняет основные функции табличного процессора: ввод цифровых и текстовых данных, создание формул, вычисления, сортировку и т.д.
При этом поддерживаются инструменты форматирования ячеек и рабочего листа, все стандартные формулы Excel, однако есть и некоторые ограничения, например, инструмент Advanced Filter (Расширенный фильтр) отсутствует и доступен только инструмент Autofilter (Автофильтр).
Рядовому пользователю вполне хватит данных возможностей. Продвинутым пользователям для создания специальных настроек можно порекомендовать воспользоваться компонентом офиса Front Page 2000. Открыв страницу в этой программе, можно настраивать параметры компонента Электронная таблица в виде, отличном от установленного по умолчанию.
Web-компонент Chart (Диаграмма)
Web-компонент Диаграмма позволяет создать на Web-странице диаграмму, которая будет обновляться при изменении исходных данных. При этом обязательно создается Web-компонент Spread Sheet (Электронная таблица). По своим функциональным возможностям Web-компонент практически не имеет отличий от стандартной диаграммы Excel.
Web-компонент PivotTable (Сводная таблица)
Web-компонент Сводная таблица используется для анализа и просмотра информации из базы данных. Функционирование Web-компонента Сводная таблица аналогично обычной сводной таблице, с помощью которой можно просматривать данные отчетов, производить динамическую сортировку и фильтрацию, получать суммарные значения и т.д.
Расширены возможности Web-запросов
В Excel 2000 усовершенствована возможность оперативного импорта последних данных с Web для помещения их в таблицы и базы данных. Наличие включенного в Excel 2000 мастера Web-запросов упрощает процесс импорта данных. Мастер помогает создать файл запроса, определить критерии отбора информации и задать параметры форматирования данных (рис. 3). Возможность автоматического обновления данных по заранее спланированному расписанию позволяет иметь оперативную информацию по быстро меняющимся данным, например по финансовым документам: котировкам акций, курсам валют и т.д.
Сводные таблицы и сводные диаграммы
В Excel 2000 стало еще проще создавать сводные таблицы и менять их структуру.
Изменение структуры можно проводить теперь непосредственно на рабочем листе. Автоматическое форматирование сводных таблиц позволяет использовать последние в качестве основы для удобно оформленных отчетов.
В Excel 2000 появилась новая возможность построения сводной диаграммы, отображающей данные сводной таблицы в удобной графической форме. Поскольку Сводная диаграмма Pivot Chart и сводная таблица Pivot Table взаимосвязанны — они одновременно обновляются при изменении или перемещении полей.
Мастер сводных таблиц и диаграмм (рис. 4) упрощает работу пользователя.
Совершенствование коллективной работы
В Excel 2000 появилось несколько усовершенствований, касающихся упрощения коллективной работы. Во-первых, сам факт возможности сохранения полнофункциональных Excel-документов в HTML-формате позволяет доносить их до широкой аудитории пользователей, не имеющих Excel, а пользующихся только браузером.
Во-вторых, упростился обмен электронной почтой и добавилась возможность Web-обсуждений.
Отправление почты непосредственно из Excel
На панели инструментов Excel 2000 появилась новая кнопка — Сообщение (рис. 5), пользуясь которой вы имеете возможность послать почту, не покидая окна Excel, что весьма удобно.
Web-обсуждения
Пользователи Excel 2000 получили возможность удобного обмена данными посредством Web-обсуждения (рис. 6). Коллективные пользователи могут добавлять комментарии и просматривать замечания своих коллег при помощи Web-браузера по мере поступления последних.
Упрощение работы
Автозаполнение списков
В Excel 2000 появилась функция Автозаполнение, которая позволяет автоматически продолжать ряд ячеек, если заполнение последних подчиняется определенному принципу. Автозаполнение может применяться не только к значениям ячеек, но и к формулам. Данное новшество в ряде случаев позволяет существенно снизить выполнение рутинных операций заполнения рабочей книги.
Усовершенствованы параметры просмотра и форматирования
В новой версии Excel вам легко увидеть внесенные вами изменения, не дожидаясь отмены выделения, благодаря новой функции SeeThrough View (Прозрачное выделение), которая обеспечивает легкое затемнение выделенных ячеек, не прибегая к инверсному цвету и не скрывая элементов форматирования (рис. 7).
Расширены возможности форматирования ячеек
В новой версии Excel усовершенствован инструмент форматирования ячеек. У пользователей появилась возможность произвольного вращения текста внутри ячейки и объединения ячеек, без сложной процедуры, которая требовалась в более ранних версиях (рис. 8).
Предотвращение проблем, связанных с 2000 годом
Excel 2000 указывает правила, по которым даты (в которых используется только две цифры) дополняются до четырехзначных чисел, что соответственно позволяет избежать риска некорректного прочтения года. С помощью редактора системных правил имеется возможность настройки режима принудительного использования четырехзначных дат.
Поддержка денежной единицы евро
Excel 2000 обеспечивает поддержку новой денежной единицы — евро, включая символ и трехзначный код ISO.
Улучшены условия для доступа и анализа данных
Оперативный анализ данных
Excel 2000 позволяет создавать сводные таблицы и диаграммы, используя данные от поставщика услуг OLAP 3 . В качестве такого источника данных может, например, выступать Microsoft SQL Server 7.0, в состав которого входит полнофункциональный OLAP Server — SQL-Server OLAP Services.
Поддержка технологий OLE DB и ADO
Реализованная в Excel 2000 встроенная поддержка технологий OLE DB и ADO 4 упрощает доступ к данным, хранящимся на в настольных СУБД или на серверах баз данных. При этом реализуется удобный полнофункциональный интерфейс доступа к данным. Поддержка технологий OLE DB и ADO обеспечивает пользователям Excel 2000 возможность производить предварительную обработку данных на сервере баз данных. Из корпоративной базы данных на клиентскую машину копируется только та часть информации, которая анализируется в данный момент. Это позволяет производить обработку больших объемов информации.
Источник
 |
|
A simple bar graph being created in Excel, running on Windows 11 |
|
| Developer(s) | Microsoft |
|---|---|
| Initial release | November 19, 1987; 35 years ago |
| Stable release |
2103 (16.0.13901.20400) |
| Written in | C++ (back-end)[2] |
| Operating system | Microsoft Windows |
| Type | Spreadsheet |
| License | Trialware[3] |
| Website | microsoft.com/en-us/microsoft-365/excel |
Excel for Mac (version 16.67), running on macOS Big Sur 11.5.2 |
|
| Developer(s) | Microsoft |
|---|---|
| Initial release | September 30, 1985; 37 years ago |
| Stable release |
16.70 (Build 23021201) |
| Written in | C++ (back-end), Objective-C (API/UI)[2] |
| Operating system | macOS |
| Type | Spreadsheet |
| License | Proprietary commercial software |
| Website | products.office.com/mac |
Excel for Android running on Android 13 |
|
| Developer(s) | Microsoft Corporation |
|---|---|
| Stable release |
16.0.14729.20146 |
| Operating system | Android Oreo and later |
| Type | Spreadsheet |
| License | Proprietary commercial software |
| Website | products.office.com/en-us/excel |
| Developer(s) | Microsoft Corporation |
|---|---|
| Stable release |
2.70.1 |
| Operating system | iOS 15 or later iPadOS 15 or later |
| Type | Spreadsheet |
| License | Proprietary commercial software |
| Website | products.office.com/en-us/excel |
Microsoft Excel is a spreadsheet developed by Microsoft for Windows, macOS, Android, iOS and iPadOS. It features calculation or computation capabilities, graphing tools, pivot tables, and a macro programming language called Visual Basic for Applications (VBA). Excel forms part of the Microsoft 365 suite of software.
Features
Basic operation
Microsoft Excel has the basic features of all spreadsheets,[7] using a grid of cells arranged in numbered rows and letter-named columns to organize data manipulations like arithmetic operations. It has a battery of supplied functions to answer statistical, engineering, and financial needs. In addition, it can display data as line graphs, histograms and charts, and with a very limited three-dimensional graphical display. It allows sectioning of data to view its dependencies on various factors for different perspectives (using pivot tables and the scenario manager).[8] A PivotTable is a tool for data analysis. It does this by simplifying large data sets via PivotTable fields. It has a programming aspect, Visual Basic for Applications, allowing the user to employ a wide variety of numerical methods, for example, for solving differential equations of mathematical physics,[9][10] and then reporting the results back to the spreadsheet. It also has a variety of interactive features allowing user interfaces that can completely hide the spreadsheet from the user, so the spreadsheet presents itself as a so-called application, or decision support system (DSS), via a custom-designed user interface, for example, a stock analyzer,[11] or in general, as a design tool that asks the user questions and provides answers and reports.[12][13] In a more elaborate realization, an Excel application can automatically poll external databases and measuring instruments using an update schedule,[14] analyze the results, make a Word report or PowerPoint slide show, and e-mail these presentations on a regular basis to a list of participants. Excel was not designed to be used as a database.[citation needed]
Microsoft allows for a number of optional command-line switches to control the manner in which Excel starts.[15]
Functions
Excel 2016 has 484 functions.[16] Of these, 360 existed prior to Excel 2010. Microsoft classifies these functions in 14 categories. Of the 484 current functions, 386 may be called from VBA as methods of the object «WorksheetFunction»[17] and 44 have the same names as VBA functions.[18]
With the introduction of LAMBDA, Excel will become Turing complete.[19]
Macro programming
VBA programming

Use of a user-defined function sq(x) in Microsoft Excel. The named variables x & y are identified in the Name Manager. The function sq is introduced using the Visual Basic editor supplied with Excel.

Subroutine in Excel calculates the square of named column variable x read from the spreadsheet, and writes it into the named column variable y.
The Windows version of Excel supports programming through Microsoft’s Visual Basic for Applications (VBA), which is a dialect of Visual Basic. Programming with VBA allows spreadsheet manipulation that is awkward or impossible with standard spreadsheet techniques. Programmers may write code directly using the Visual Basic Editor (VBE), which includes a window for writing code, debugging code, and code module organization environment. The user can implement numerical methods as well as automating tasks such as formatting or data organization in VBA[20] and guide the calculation using any desired intermediate results reported back to the spreadsheet.
VBA was removed from Mac Excel 2008, as the developers did not believe that a timely release would allow porting the VBA engine natively to Mac OS X. VBA was restored in the next version, Mac Excel 2011,[21] although the build lacks support for ActiveX objects, impacting some high level developer tools.[22]
A common and easy way to generate VBA code is by using the Macro Recorder.[23] The Macro Recorder records actions of the user and generates VBA code in the form of a macro. These actions can then be repeated automatically by running the macro. The macros can also be linked to different trigger types like keyboard shortcuts, a command button or a graphic. The actions in the macro can be executed from these trigger types or from the generic toolbar options. The VBA code of the macro can also be edited in the VBE. Certain features such as loop functions and screen prompt by their own properties, and some graphical display items, cannot be recorded but must be entered into the VBA module directly by the programmer. Advanced users can employ user prompts to create an interactive program, or react to events such as sheets being loaded or changed.
Macro Recorded code may not be compatible with Excel versions. Some code that is used in Excel 2010 cannot be used in Excel 2003. Making a Macro that changes the cell colors and making changes to other aspects of cells may not be backward compatible.
VBA code interacts with the spreadsheet through the Excel Object Model,[24] a vocabulary identifying spreadsheet objects, and a set of supplied functions or methods that enable reading and writing to the spreadsheet and interaction with its users (for example, through custom toolbars or command bars and message boxes). User-created VBA subroutines execute these actions and operate like macros generated using the macro recorder, but are more flexible and efficient.
History
From its first version Excel supported end-user programming of macros (automation of repetitive tasks) and user-defined functions (extension of Excel’s built-in function library). In early versions of Excel, these programs were written in a macro language whose statements had formula syntax and resided in the cells of special-purpose macro sheets (stored with file extension .XLM in Windows.) XLM was the default macro language for Excel through Excel 4.0.[25] Beginning with version 5.0 Excel recorded macros in VBA by default but with version 5.0 XLM recording was still allowed as an option. After version 5.0 that option was discontinued. All versions of Excel, including Excel 2021 are capable of running an XLM macro, though Microsoft discourages their use.[26]
Charts

Graph made using Microsoft Excel
Excel supports charts, graphs, or histograms generated from specified groups of cells. It also supports Pivot Charts that allow for a chart to be linked directly to a Pivot table. This allows the chart to be refreshed with the Pivot Table. The generated graphic component can either be embedded within the current sheet or added as a separate object.
These displays are dynamically updated if the content of cells changes. For example, suppose that the important design requirements are displayed visually; then, in response to a user’s change in trial values for parameters, the curves describing the design change shape, and their points of intersection shift, assisting the selection of the best design.
Add-ins
Additional features are available using add-ins. Several are provided with Excel, including:
- Analysis ToolPak: Provides data analysis tools for statistical and engineering analysis (includes analysis of variance and regression analysis)
- Analysis ToolPak VBA: VBA functions for Analysis ToolPak
- Euro Currency Tools: Conversion and formatting for euro currency
- Solver Add-In: Tools for optimization and equation solving
Data storage and communication
Number of rows and columns
Versions of Excel up to 7.0 had a limitation in the size of their data sets of 16K (214 = 16384) rows. Versions 8.0 through 11.0 could handle 64K (216 = 65536) rows and 256 columns (28 as label ‘IV’). Version 12.0 onwards, including the current Version 16.x, can handle over 1M (220 = 1048576) rows, and 16384 (214, labeled as column ‘XFD’) columns.[27]
File formats
| Filename extension |
.xls, (.xlsx, .xlsm, .xlsb — Excel 2007) |
|---|---|
| Internet media type |
application/vnd.ms-excel |
| Uniform Type Identifier (UTI) | com.microsoft.excel.xls |
| Developed by | Microsoft |
| Type of format | Spreadsheet |
Microsoft Excel up until 2007 version used a proprietary binary file format called Excel Binary File Format (.XLS) as its primary format.[28] Excel 2007 uses Office Open XML as its primary file format, an XML-based format that followed after a previous XML-based format called «XML Spreadsheet» («XMLSS»), first introduced in Excel 2002.[29]
Although supporting and encouraging the use of new XML-based formats as replacements, Excel 2007 remained backwards-compatible with the traditional, binary formats. In addition, most versions of Microsoft Excel can read CSV, DBF, SYLK, DIF, and other legacy formats. Support for some older file formats was removed in Excel 2007.[30] The file formats were mainly from DOS-based programs.
Binary
OpenOffice.org has created documentation of the Excel format. Two epochs of the format exist: the 97-2003 OLE format, and the older stream format.[31] Microsoft has made the Excel binary format specification available to freely download.[32]
XML Spreadsheet
The XML Spreadsheet format introduced in Excel 2002[29] is a simple, XML based format missing some more advanced features like storage of VBA macros. Though the intended file extension for this format is .xml, the program also correctly handles XML files with .xls extension. This feature is widely used by third-party applications (e.g. MySQL Query Browser) to offer «export to Excel» capabilities without implementing binary file format. The following example will be correctly opened by Excel if saved either as Book1.xml or Book1.xls:
<?xml version="1.0"?>
<Workbook xmlns="urn:schemas-microsoft-com:office:spreadsheet"
 xmlns:o="urn:schemas-microsoft-com:office:office"
 xmlns:x="urn:schemas-microsoft-com:office:excel"
 xmlns:ss="urn:schemas-microsoft-com:office:spreadsheet"
 xmlns:html="http://www.w3.org/TR/REC-html40">
 <Worksheet ss:Name="Sheet1">
  <Table ss:ExpandedColumnCount="2" ss:ExpandedRowCount="2" x:FullColumns="1" x:FullRows="1">
   <Row>
    <Cell><Data ss:Type="String">Name</Data></Cell>
    <Cell><Data ss:Type="String">Example</Data></Cell>
   </Row>
   <Row>
    <Cell><Data ss:Type="String">Value</Data></Cell>
    <Cell><Data ss:Type="Number">123</Data></Cell>
   </Row>
  </Table>
 </Worksheet>
</Workbook>
Current file extensions
Microsoft Excel 2007, along with the other products in the Microsoft Office 2007 suite, introduced new file formats. The first of these (.xlsx) is defined in the Office Open XML (OOXML) specification.
| Format | Extension | Description |
|---|---|---|
| Excel Workbook | .xlsx
|
The default Excel 2007 and later workbook format. In reality, a ZIP compressed archive with a directory structure of XML text documents. Functions as the primary replacement for the former binary .xls format, although it does not support Excel macros for security reasons. Saving as .xlsx offers file size reduction over .xls[33] |
| Excel Macro-enabled Workbook | .xlsm
|
As Excel Workbook, but with macro support. |
| Excel Binary Workbook | .xlsb
|
As Excel Macro-enabled Workbook, but storing information in binary form rather than XML documents for opening and saving documents more quickly and efficiently. Intended especially for very large documents with tens of thousands of rows, and/or several hundreds of columns. This format is very useful for shrinking large Excel files as is often the case when doing data analysis. |
| Excel Macro-enabled Template | .xltm
|
A template document that forms a basis for actual workbooks, with macro support. The replacement for the old .xlt format. |
| Excel Add-in | .xlam
|
Excel add-in to add extra functionality and tools. Inherent macro support because of the file purpose. |
Old file extensions
| Format | Extension | Description |
|---|---|---|
| Spreadsheet | .xls
|
Main spreadsheet format which holds data in worksheets, charts, and macros |
| Add-in (VBA) | .xla
|
Adds custom functionality; written in VBA |
| Toolbar | .xlb
|
The file extension where Microsoft Excel custom toolbar settings are stored. |
| Chart | .xlc
|
A chart created with data from a Microsoft Excel spreadsheet that only saves the chart. To save the chart and spreadsheet save as .XLS. XLC is not supported in Excel 2007 or in any newer versions of Excel. |
| Dialog | .xld
|
Used in older versions of Excel. |
| Archive | .xlk
|
A backup of an Excel Spreadsheet |
| Add-in (DLL) | .xll
|
Adds custom functionality; written in C++/C, Fortran, etc. and compiled in to a special dynamic-link library |
| Macro | .xlm
|
A macro is created by the user or pre-installed with Excel. |
| Template | .xlt
|
A pre-formatted spreadsheet created by the user or by Microsoft Excel. |
| Module | .xlv
|
A module is written in VBA (Visual Basic for Applications) for Microsoft Excel |
| Library | .DLL
|
Code written in VBA may access functions in a DLL, typically this is used to access the Windows API |
| Workspace | .xlw
|
Arrangement of the windows of multiple Workbooks |
Using other Windows applications
Windows applications such as Microsoft Access and Microsoft Word, as well as Excel can communicate with each other and use each other’s capabilities. The most common are Dynamic Data Exchange: although strongly deprecated by Microsoft, this is a common method to send data between applications running on Windows, with official MS publications referring to it as «the protocol from hell».[34] As the name suggests, it allows applications to supply data to others for calculation and display. It is very common in financial markets, being used to connect to important financial data services such as Bloomberg and Reuters.
OLE Object Linking and Embedding allows a Windows application to control another to enable it to format or calculate data. This may take on the form of «embedding» where an application uses another to handle a task that it is more suited to, for example a PowerPoint presentation may be embedded in an Excel spreadsheet or vice versa.[35][36][37][38]
Using external data
Excel users can access external data sources via Microsoft Office features such as (for example) .odc connections built with the Office Data Connection file format. Excel files themselves may be updated using a Microsoft supplied ODBC driver.
Excel can accept data in real-time through several programming interfaces, which allow it to communicate with many data sources such as Bloomberg and Reuters (through addins such as Power Plus Pro).
- DDE: «Dynamic Data Exchange» uses the message passing mechanism in Windows to allow data to flow between Excel and other applications. Although it is easy for users to create such links, programming such links reliably is so difficult that Microsoft, the creators of the system, officially refer to it as «the protocol from hell».[34] In spite of its many issues DDE remains the most common way for data to reach traders in financial markets.
- Network DDE Extended the protocol to allow spreadsheets on different computers to exchange data. Starting with Windows Vista, Microsoft no longer supports the facility.[39]
- Real Time Data: RTD although in many ways technically superior to DDE, has been slow to gain acceptance, since it requires non-trivial programming skills, and when first released was neither adequately documented nor supported by the major data vendors.[40][41]
Alternatively, Microsoft Query provides ODBC-based browsing within Microsoft Excel.[42][43][44]
Export and migration of spreadsheets
Programmers have produced APIs to open Excel spreadsheets in a variety of applications and environments other than Microsoft Excel. These include opening Excel documents on the web using either ActiveX controls, or plugins like the Adobe Flash Player. The Apache POI opensource project provides Java libraries for reading and writing Excel spreadsheet files.
Password protection
Microsoft Excel protection offers several types of passwords:
- Password to open a document[45]
- Password to modify a document[46]
- Password to unprotect the worksheet
- Password to protect workbook
- Password to protect the sharing workbook[47]
All passwords except password to open a document can be removed instantly regardless of the Microsoft Excel version used to create the document. These types of passwords are used primarily for shared work on a document. Such password-protected documents are not encrypted, and a data sources from a set password is saved in a document’s header. Password to protect workbook is an exception – when it is set, a document is encrypted with the standard password «VelvetSweatshop», but since it is known to the public, it actually does not add any extra protection to the document. The only type of password that can prevent a trespasser from gaining access to a document is password to open a document. The cryptographic strength of this kind of protection depends strongly on the Microsoft Excel version that was used to create the document.
In Microsoft Excel 95 and earlier versions, the password to open is converted to a 16-bit key that can be instantly cracked. In Excel 97/2000 the password is converted to a 40-bit key, which can also be cracked very quickly using modern equipment. As regards services that use rainbow tables (e.g. Password-Find), it takes up to several seconds to remove protection. In addition, password-cracking programs can brute-force attack passwords at a rate of hundreds of thousands of passwords a second, which not only lets them decrypt a document but also find the original password.
In Excel 2003/XP the encryption is slightly better – a user can choose any encryption algorithm that is available in the system (see Cryptographic Service Provider). Due to the CSP, an Excel file cannot be decrypted, and thus the password to open cannot be removed, though the brute-force attack speed remains quite high. Nevertheless, the older Excel 97/2000 algorithm is set by the default. Therefore, users who do not change the default settings lack reliable protection of their documents.
The situation changed fundamentally in Excel 2007, where the modern AES algorithm with a key of 128 bits started being used for decryption, and a 50,000-fold use of the hash function SHA1 reduced the speed of brute-force attacks down to hundreds of passwords per second. In Excel 2010, the strength of the protection by the default was increased two times due to the use of a 100,000-fold SHA1 to convert a password to a key.
Other platforms
Excel for mobile
Excel Mobile is a spreadsheet program that can edit XLSX files. It can edit and format text in cells, calculate formulas, search within the spreadsheet, sort rows and columns, freeze panes, filter the columns, add comments, and create charts. It cannot add columns or rows except at the edge of the document, rearrange columns or rows, delete rows or columns, or add spreadsheet tabs.[48][49][50][51][52][53] The 2007 version has the ability to use a full-screen mode to deal with limited screen resolution, as well as split panes to view different parts of a worksheet at one time.[51] Protection settings, zoom settings, autofilter settings, certain chart formatting, hidden sheets, and other features are not supported on Excel Mobile, and will be modified upon opening and saving a workbook.[52] In 2015, Excel Mobile became available for Windows 10 and Windows 10 Mobile on Windows Store.[54][55]
Excel for the web
Excel for the web is a free lightweight version of Microsoft Excel available as part of Office on the web, which also includes web versions of Microsoft Word and Microsoft PowerPoint.
Excel for the web can display most of the features available in the desktop versions of Excel, although it may not be able to insert or edit them. Certain data connections are not accessible on Excel for the web, including with charts that may use these external connections. Excel for the web also cannot display legacy features, such as Excel 4.0 macros or Excel 5.0 dialog sheets. There are also small differences between how some of the Excel functions work.[56]
Microsoft Excel Viewer
Microsoft Excel Viewer was a freeware program for Microsoft Windows for viewing and printing spreadsheet documents created by Excel.[57] Microsoft retired the viewer in April 2018 with the last security update released in February 2019 for Excel Viewer 2007 (SP3).[58][59]
The first version released by Microsoft was Excel 97 Viewer.[60][61] Excel 97 Viewer was supported in Windows CE for Handheld PCs.[62] In October 2004, Microsoft released Excel Viewer 2003.[63] In September 2007, Microsoft released Excel Viewer 2003 Service Pack 3 (SP3).[64] In January 2008, Microsoft released Excel Viewer 2007 (featuring a non-collapsible Ribbon interface).[65] In April 2009, Microsoft released Excel Viewer 2007 Service Pack 2 (SP2).[66] In October 2011, Microsoft released Excel Viewer 2007 Service Pack 3 (SP3).[67]
Microsoft advises to view and print Excel files for free to use the Excel Mobile application for Windows 10 and for Windows 7 and Windows 8 to upload the file to OneDrive and use Excel for the web with a Microsoft account to open them in a browser.[58][68]
Quirks
In addition to issues with spreadsheets in general, other problems specific to Excel include numeric precision, misleading statistics functions, mod function errors, date limitations and more.
Numeric precision
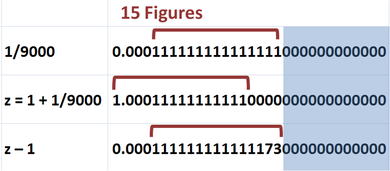
Excel maintains 15 figures in its numbers, but they are not always accurate: the bottom line should be the same as the top line.
Despite the use of 15-figure precision, Excel can display many more figures (up to thirty) upon user request. But the displayed figures are not those actually used in its computations, and so, for example, the difference of two numbers may differ from the difference of their displayed values. Although such departures are usually beyond the 15th decimal, exceptions do occur, especially for very large or very small numbers. Serious errors can occur if decisions are made based upon automated comparisons of numbers (for example, using the Excel If function), as equality of two numbers can be unpredictable.[citation needed]
In the figure, the fraction 1/9000 is displayed in Excel. Although this number has a decimal representation that is an infinite string of ones, Excel displays only the leading 15 figures. In the second line, the number one is added to the fraction, and again Excel displays only 15 figures. In the third line, one is subtracted from the sum using Excel. Because the sum in the second line has only eleven 1’s after the decimal, the difference when 1 is subtracted from this displayed value is three 0’s followed by a string of eleven 1’s. However, the difference reported by Excel in the third line is three 0’s followed by a string of thirteen 1’s and two extra erroneous digits. This is because Excel calculates with about half a digit more than it displays.
Excel works with a modified 1985 version of the IEEE 754 specification.[69] Excel’s implementation involves conversions between binary and decimal representations, leading to accuracy that is on average better than one would expect from simple fifteen digit precision, but that can be worse. See the main article for details.
Besides accuracy in user computations, the question of accuracy in Excel-provided functions may be raised. Particularly in the arena of statistical functions, Excel has been criticized for sacrificing accuracy for speed of calculation.[70][71]
As many calculations in Excel are executed using VBA, an additional issue is the accuracy of VBA, which varies with variable type and user-requested precision.[72]
Statistical functions
The accuracy and convenience of statistical tools in Excel has been criticized,[73][74][75][76][77] as mishandling missing data, as returning incorrect values due to inept handling of round-off and large numbers, as only selectively updating calculations on a spreadsheet when some cell values are changed, and as having a limited set of statistical tools. Microsoft has announced some of these issues are addressed in Excel 2010.[78]
Excel MOD function error
Excel has issues with modulo operations. In the case of excessively large results, Excel will return the error warning #NUM! instead of an answer.[79]
Fictional leap day in the year 1900
Excel includes February 29, 1900, incorrectly treating 1900 as a leap year, even though e.g. 2100 is correctly treated as a non-leap year.[80][81] The bug originated from Lotus 1-2-3 (deliberately implemented to save computer memory), and was also purposely implemented in Excel, for the purpose of bug compatibility.[82] This legacy has later been carried over into Office Open XML file format.[83]
Thus a (not necessarily whole) number greater than or equal to 61 interpreted as a date and time are the (real) number of days after December 30, 1899, 0:00, a non-negative number less than 60 is the number of days after December 31, 1899, 0:00, and numbers with whole part 60 represent the fictional day.
Date range
Excel supports dates with years in the range 1900–9999, except that December 31, 1899, can be entered as 0 and is displayed as 0-jan-1900.
Converting a fraction of a day into hours, minutes and days by treating it as a moment on the day January 1, 1900, does not work for a negative fraction.[84]
Conversion problems
Entering text that happens to be in a form that is interpreted as a date, the text can be unintentionally changed to a standard date format. A similar problem occurs when a text happens to be in the form of a floating-point notation of a number. In these cases the original exact text cannot be recovered from the result. Formatting the cell as TEXT before entering ambiguous text prevents Excel from converting to a date.
This issue has caused a well known problem in the analysis of DNA, for example in bioinformatics. As first reported in 2004,[85] genetic scientists found that Excel automatically and incorrectly converts certain gene names into dates. A follow-up study in 2016 found many peer reviewed scientific journal papers had been affected and that «Of the selected journals, the proportion of published articles with Excel files containing gene lists that are affected by gene name errors is 19.6 %.»[86] Excel parses the copied and pasted data and sometimes changes them depending on what it thinks they are. For example, MARCH1 (Membrane Associated Ring-CH-type finger 1) gets converted to the date March 1 (1-Mar) and SEPT2 (Septin 2) is converted into September 2 (2-Sep) etc.[87] While some secondary news sources[88] reported this as a fault with Excel, the original authors of the 2016 paper placed the blame with the researchers misusing Excel.[86][89]
In August 2020 the HUGO Gene Nomenclature Committee (HGNC) published new guidelines in the journal Nature regarding gene naming in order to avoid issues with «symbols that affect data handling and retrieval.» So far 27 genes have been renamed, including changing MARCH1 to MARCHF1 and SEPT1 to SEPTIN1 in order to avoid accidental conversion of the gene names into dates.[90]
Errors with large strings
The following functions return incorrect results when passed a string longer than 255 characters:[91]
type()incorrectly returns 16, meaning «Error value»IsText(), when called as a method of the VBA objectWorksheetFunction(i.e.,WorksheetFunction.IsText()in VBA), incorrectly returns «false».
Filenames
Microsoft Excel will not open two documents with the same name and instead will display the following error:
- A document with the name ‘%s’ is already open. You cannot open two documents with the same name, even if the documents are in different folders. To open the second document, either close the document that is currently open, or rename one of the documents.[92]
The reason is for calculation ambiguity with linked cells. If there is a cell ='[Book1.xlsx]Sheet1'!$G$33, and there are two books named «Book1» open, there is no way to tell which one the user means.[93]
Versions
Early history
Microsoft originally marketed a spreadsheet program called Multiplan in 1982. Multiplan became very popular on CP/M systems, but on MS-DOS systems it lost popularity to Lotus 1-2-3. Microsoft released the first version of Excel for the Macintosh on September 30, 1985, and the first Windows version was 2.05 (to synchronize with the Macintosh version 2.2) on November 19, 1987.[94][95] Lotus was slow to bring 1-2-3 to Windows and by the early 1990s, Excel had started to outsell 1-2-3 and helped Microsoft achieve its position as a leading PC software developer. This accomplishment solidified Microsoft as a valid competitor and showed its future of developing GUI software. Microsoft maintained its advantage with regular new releases, every two years or so.
Microsoft Windows
Excel 2.0 is the first version of Excel for the Intel platform. Versions prior to 2.0 were only available on the Apple Macintosh.
Excel 2.0 (1987)
The first Windows version was labeled «2» to correspond to the Mac version. It was announced on October 6, 1987, and released on November 19.[96] This included a run-time version of Windows.[97]
BYTE in 1989 listed Excel for Windows as among the «Distinction» winners of the BYTE Awards. The magazine stated that the port of the «extraordinary» Macintosh version «shines», with a user interface as good as or better than the original.
Excel 3.0 (1990)
Included toolbars, drawing capabilities, outlining, add-in support, 3D charts, and many more new features.[97]
Excel 4.0 (1992)
Introduced auto-fill.[98]
Also, an easter egg in Excel 4.0 reveals a hidden animation of a dancing set of numbers 1 through 3, representing Lotus 1-2-3, which is then crushed by an Excel logo.[99]
Excel 5.0 (1993)
With version 5.0, Excel has included Visual Basic for Applications (VBA), a programming language based on Visual Basic which adds the ability to automate tasks in Excel and to provide user-defined functions (UDF) for use in worksheets. VBA includes a fully featured integrated development environment (IDE). Macro recording can produce VBA code replicating user actions, thus allowing simple automation of regular tasks. VBA allows the creation of forms and in‑worksheet controls to communicate with the user. The language supports use (but not creation) of ActiveX (COM) DLL’s; later versions add support for class modules allowing the use of basic object-oriented programming techniques.
The automation functionality provided by VBA made Excel a target for macro viruses. This caused serious problems until antivirus products began to detect these viruses. Microsoft belatedly took steps to prevent the misuse by adding the ability to disable macros completely, to enable macros when opening a workbook or to trust all macros signed using a trusted certificate.
Versions 5.0 to 9.0 of Excel contain various Easter eggs, including a «Hall of Tortured Souls», a Doom-like minigame, although since version 10 Microsoft has taken measures to eliminate such undocumented features from their products.[100]
5.0 was released in a 16-bit x86 version for Windows 3.1 and later in a 32-bit version for NT 3.51 (x86/Alpha/PowerPC)
Excel 95 (v7.0)

Released in 1995 with Microsoft Office for Windows 95, this is the first major version after Excel 5.0, as there is no Excel 6.0 with all of the Office applications standardizing on the same major version number.
Internal rewrite to 32-bits. Almost no external changes, but faster and more stable.
Excel 95 contained a hidden Doom-like mini-game called «The Hall of Tortured Souls», a series of rooms featuring the names and faces of the developers as an easter egg.[101]
Excel 97 (v8.0)
Included in Office 97 (for x86 and Alpha). This was a major upgrade that introduced the paper clip office assistant and featured standard VBA used instead of internal Excel Basic. It introduced the now-removed Natural Language labels.
This version of Excel includes a flight simulator as an Easter Egg.
Excel 2000 (v9.0)

Included in Office 2000. This was a minor upgrade but introduced an upgrade to the clipboard where it can hold multiple objects at once. The Office Assistant, whose frequent unsolicited appearance in Excel 97 had annoyed many users, became less intrusive.
A small 3-D game called «Dev Hunter» (inspired by Spy Hunter) was included as an easter egg.[102][103]
Excel 2002 (v10.0)
Included in Office XP. Very minor enhancements.
Excel 2003 (v11.0)
Included in Office 2003. Minor enhancements.
Excel 2007 (v12.0)

Included in Office 2007. This release was a major upgrade from the previous version. Similar to other updated Office products, Excel in 2007 used the new Ribbon menu system. This was different from what users were used to, and was met with mixed reactions. One study reported fairly good acceptance by users except highly experienced users and users of word processing applications with a classical WIMP interface, but was less convinced in terms of efficiency and organization.[104] However, an online survey reported that a majority of respondents had a negative opinion of the change, with advanced users being «somewhat more negative» than intermediate users, and users reporting a self-estimated reduction in productivity.
Added functionality included Tables,[105] and the SmartArt set of editable business diagrams. Also added was an improved management of named variables through the Name Manager, and much-improved flexibility in formatting graphs, which allow (x, y) coordinate labeling and lines of arbitrary weight. Several improvements to pivot tables were introduced.
Also like other office products, the Office Open XML file formats were introduced, including .xlsm for a workbook with macros and .xlsx for a workbook without macros.[106]
Specifically, many of the size limitations of previous versions were greatly increased. To illustrate, the number of rows was now 1,048,576 (220) and columns was 16,384 (214; the far-right column is XFD). This changes what is a valid A1 reference versus a named range. This version made more extensive use of multiple cores for the calculation of spreadsheets; however, VBA macros are not handled in parallel and XLL add‑ins were only executed in parallel if they were thread-safe and this was indicated at registration.
Excel 2010 (v14.0)
Microsoft Excel 2010 running on Windows 7
Included in Office 2010, this is the next major version after v12.0, as version number 13 was skipped.
Minor enhancements and 64-bit support,[107] including the following:
- Multi-threading recalculation (MTR) for commonly used functions
- Improved pivot tables
- More conditional formatting options
- Additional image editing capabilities
- In-cell charts called sparklines
- Ability to preview before pasting
- Office 2010 backstage feature for document-related tasks
- Ability to customize the Ribbon
- Many new formulas, most highly specialized to improve accuracy[108]
Excel 2013 (v15.0)
Included in Office 2013, along with a lot of new tools included in this release:
- Improved Multi-threading and Memory Contention
- FlashFill[109]
- Power View[110]
- Power Pivot[111]
- Timeline Slicer
- Windows App
- Inquire[112]
- 50 new functions[113]
Excel 2016 (v16.0)
Included in Office 2016, along with a lot of new tools included in this release:
- Power Query integration
- Read-only mode for Excel
- Keyboard access for Pivot Tables and Slicers in Excel
- New Chart Types
- Quick data linking in Visio
- Excel forecasting functions
- Support for multiselection of Slicer items using touch
- Time grouping and Pivot Chart Drill Down
- Excel data cards[114]
Excel 2019, Excel 2021, Office 365 and subsequent (v16.0)
Microsoft no longer releases Office or Excel in discrete versions. Instead, features are introduced automatically over time using Windows Update. The version number remains 16.0. Thereafter only the approximate dates when features appear can now be given.
- Dynamic Arrays. These are essentially Array Formulas but they «Spill» automatically into neighboring cells and does not need the ctrl-shift-enter to create them. Further, dynamic arrays are the default format, with new «@» and «#» operators to provide compatibility with previous versions. This is perhaps the biggest structural change since 2007, and is in response to a similar feature in Google Sheets. Dynamic arrays started appearing in pre-releases about 2018, and as of March 2020 are available in published versions of Office 365 provided a user selected «Office Insiders».
Apple Macintosh

Microsoft Excel for Mac 2011
- 1985 Excel 1.0
- 1988 Excel 1.5
- 1989 Excel 2.2
- 1990 Excel 3.0
- 1992 Excel 4.0
- 1993 Excel 5.0 (part of Office 4.x—Final Motorola 680×0 version[115] and first PowerPC version)
- 1998 Excel 8.0 (part of Office 98)
- 2000 Excel 9.0 (part of Office 2001)
- 2001 Excel 10.0 (part of Office v. X)
- 2004 Excel 11.0 (part of Office 2004)
- 2008 Excel 12.0 (part of Office 2008)
- 2010 Excel 14.0 (part of Office 2011)
- 2015 Excel 15.0 (part of Office 2016—Office 2016 for Mac brings the Mac version much closer to parity with its Windows cousin, harmonizing many of the reporting and high-level developer functions, while bringing the ribbon and styling into line with its PC counterpart.)[116]
OS/2
- 1989 Excel 2.2
- 1990 Excel 2.3
- 1991 Excel 3.0
Summary
| Legend: | Old version, not maintained | Older version, still maintained | Current stable version |
|---|
| Year | Name | Version | Comments |
|---|---|---|---|
| 1987 | Excel 2 | 2.0 | Renumbered to 2 to correspond with contemporary Macintosh version. Supported macros (later known as Excel 4 macros). |
| 1990 | Excel 3 | 3.0 | Added 3D graphing capabilities |
| 1992 | Excel 4 | 4.0 | Introduced auto-fill feature |
| 1993 | Excel 5 | 5.0 | Included Visual Basic for Applications (VBA) and various object-oriented options |
| 1995 | Excel 95 | 7.0 | Renumbered for contemporary Word version. Both programs were packaged in Microsoft Office by this time. |
| 1997 | Excel 97 | 8.0 | |
| 2000 | Excel 2000 | 9.0 | Part of Microsoft Office 2000, which was itself part of Windows Millennium (also known as «Windows ME»). |
| 2002 | Excel 2002 | 10.0 | |
| 2003 | Excel 2003 | 11.0 | Released only 1 year later to correspond better with the rest of Microsoft Office (Word, PowerPoint, etc.). |
| 2007 | Excel 2007 | 12.0 | |
| 2010 | Excel 2010 | 14.0 | Due to superstitions surrounding the number 13, Excel 13 was skipped in version counting. |
| 2013 | Excel 2013 | 15.0 | Introduced 50 more mathematical functions (available as pre-packaged commands, rather than typing the formula manually). |
| 2016 | Excel 2016 | 16.0 | Part of Microsoft Office 2016 |
| Year | Name | Version | Comments |
|---|---|---|---|
| 1985 | Excel 1 | 1.0 | Initial version of Excel. Supported macros (later known as Excel 4 macros). |
| 1988 | Excel 1.5 | 1.5 | |
| 1989 | Excel 2 | 2.2 | |
| 1990 | Excel 3 | 3.0 | |
| 1992 | Excel 4 | 4.0 | |
| 1993 | Excel 5 | 5.0 | Only available on PowerPC-based Macs. First PowerPC version. |
| 1998 | Excel 98 | 8.0 | Excel 6 and Excel 7 were skipped to correspond with the rest of Microsoft Office at the time. |
| 2000 | Excel 2000 | 9.0 | |
| 2001 | Excel 2001 | 10.0 | |
| 2004 | Excel 2004 | 11.0 | |
| 2008 | Excel 2008 | 12.0 | |
| 2011 | Excel 2011 | 14.0 | As with the Windows version, version 13 was skipped for superstitious reasons. |
| 2016 | Excel 2016 | 16.0 | As with the rest of Microsoft Office, so it is for Excel: Future release dates for the Macintosh version are intended to correspond better to those for the Windows version, from 2016 onward. |
| Year | Name | Version | Comments |
|---|---|---|---|
| 1989 | Excel 2.2 | 2.2 | Numbered in between Windows versions at the time |
| 1990 | Excel 2.3 | 2.3 | |
| 1991 | Excel 3 | 3.0 | Last OS/2 version. Discontinued subseries of Microsoft Excel, which is otherwise still an actively developed program. |
Impact
Excel offers many user interface tweaks over the earliest electronic spreadsheets; however, the essence remains the same as in the original spreadsheet software, VisiCalc: the program displays cells organized in rows and columns, and each cell may contain data or a formula, with relative or absolute references to other cells.
Excel 2.0 for Windows, which was modeled after its Mac GUI-based counterpart, indirectly expanded the installed base of the then-nascent Windows environment. Excel 2.0 was released a month before Windows 2.0, and the installed base of Windows was so low at that point in 1987 that Microsoft had to bundle a runtime version of Windows 1.0 with Excel 2.0.[117] Unlike Microsoft Word, there never was a DOS version of Excel.
Excel became the first spreadsheet to allow the user to define the appearance of spreadsheets (fonts, character attributes, and cell appearance). It also introduced intelligent cell re-computation, where only cells dependent on the cell being modified are updated (previous spreadsheet programs recomputed everything all the time or waited for a specific user command). Excel introduced auto-fill, the ability to drag and expand the selection box to automatically copy a cell or row contents to adjacent cells or rows, adjusting the copies intelligently by automatically incrementing cell references or contents. Excel also introduced extensive graphing capabilities.
Security
Because Excel is widely used, it has been attacked by hackers. While Excel is not directly exposed to the Internet, if an attacker can get a victim to open a file in Excel, and there is an appropriate security bug in Excel, then the attacker can gain control of the victim’s computer.[118] UK’s GCHQ has a tool named TORNADO ALLEY with this purpose.[119][120]
Games
Besides the easter eggs, numerous games have been created or recreated in Excel, such as Tetris, 2048, Scrabble, Yahtzee, Angry Birds, Pac-Man, Civilization, Monopoly, Battleship, Blackjack, Space Invaders, and others.[121][122][123][124][125]
In 2020, Excel became an esport with the advent of the Financial Modeling World Cup.[126]
See also
- Comparison of spreadsheet software
- Numbers (spreadsheet)—the iWork equivalent
- Spreadmart
- Financial Modeling World Cup, online esport financial modelling competition using Excel
References
- ^ «Update history for Microsoft Office 2019». Microsoft Docs. Retrieved April 13, 2021.
- ^ a b «C++ in MS Office». cppcon. July 17, 2014. Archived from the original on November 7, 2019. Retrieved June 25, 2019.
- ^ «Microsoft Office Excel 365». Microsoft.com. Retrieved January 25, 2021.
- ^ «Update history for Office for Mac». Microsoft Docs.
- ^ «Microsoft Excel APKs». APKMirror.
- ^ «Microsoft Excel». App Store.
- ^
Harvey, Greg (2006). Excel 2007 For Dummies (1st ed.). Wiley. ISBN 978-0-470-03737-9. - ^
Harvey, Greg (2007). Excel 2007 Workbook for Dummies (2nd ed.). Wiley. p. 296 ff. ISBN 978-0-470-16937-7. - ^
de Levie, Robert (2004). Advanced Excel for scientific data analysis. Oxford University Press. ISBN 978-0-19-515275-3. - ^
Bourg, David M. (2006). Excel scientific and engineering cookbook. O’Reilly. ISBN 978-0-596-00879-6. - ^
Şeref, Michelle M. H. & Ahuja, Ravindra K. (2008). «§4.2 A portfolio management and optimization spreadsheet DSS». In Burstein, Frad & Holsapple, Clyde W. (eds.). Handbook on Decision Support Systems 1: Basic Themes. Springer. ISBN 978-3-540-48712-8. - ^
Wells, Eric & Harshbarger, Steve (1997). Microsoft Excel 97 Developer’s Handbook. Microsoft Press. ISBN 978-1-57231-359-0. Excellent examples are developed that show just how applications can be designed. - ^
Harnett, Donald L. & Horrell, James F. (1998). Data, statistics, and decision models with Excel. Wiley. ISBN 978-0-471-13398-8. - ^
Some form of data acquisition hardware is required. See, for example, Austerlitz, Howard (2003). Data acquisition techniques using PCs (2nd ed.). Academic Press. p. 281 ff. ISBN 978-0-12-068377-2. - ^
«Description of the startup switches for Excel». Microsoft Help and Support. Microsoft Support. May 7, 2007. Retrieved December 14, 2010.Microsoft Excel accepts a number of optional switches that you can use to control how the program starts. This article lists the switches and provides a description of each switch.
{{cite web}}: CS1 maint: url-status (link) - ^ «Excel functions (alphabetical)». microsoft.com. Microsoft. Retrieved November 4, 2018.
{{cite web}}: CS1 maint: url-status (link) - ^ «WorksheetFunction Object (Excel)». Office VBA Reference. Microsoft. March 30, 2022. Retrieved November 4, 2018.
{{cite web}}: CS1 maint: url-status (link) - ^ «Functions (Visual Basic for Applications)». Office VBA Reference. Microsoft. September 13, 2021. Retrieved November 4, 2018.
{{cite web}}: CS1 maint: url-status (link) - ^ Gordon, Andy (January 25, 2021). «LAMBDA: The ultimate Excel worksheet function». microsoft.com. Microsoft. Retrieved April 23, 2021.
{{cite web}}: CS1 maint: url-status (link) - ^
For example, by converting to Visual Basic the recipes in Press, William H. Press; Teukolsky, Saul A.; Vetterling, William T. & Flannery, Brian P. (2007). Numerical recipes: the art of scientific computing (3rd ed.). Cambridge University Press. ISBN 978-0-521-88068-8. Code conversion to Basic from Fortran probably is easier than from C++, so the 2nd edition (ISBN 0521437210) may be easier to use, or the Basic code implementation of the first edition: Sprott, Julien C. (1991). Numerical recipes: routines and examples in BASIC. Cambridge University Press. ISBN 978-0-521-40689-5. - ^ «Excel». Office for Mac. OfficeforMacHelp.com. Archived from the original on June 19, 2012. Retrieved July 8, 2012.
- ^ «Using Excel — PC or Mac? | Excel Lemon». www.excellemon.com. Archived from the original on September 21, 2016. Retrieved July 29, 2015.
- ^ However an increasing proportion of Excel functionality is not captured by the Macro Recorder leading to largely useless macros. Compatibility among multiple versions of Excel is also a downfall of this method. A macro recorder in Excel 2010 may not work in Excel 2003 or older. This is most common when changing colors and formatting of cells.
Walkenbach, John (2007). «Chapter 6: Using the Excel macro recorder». Excel 2007 VBA Programming for Dummies (Revised by Jan Karel Pieterse ed.). Wiley. p. 79 ff. ISBN 978-0-470-04674-6. - ^ Walkenbach, John (February 2, 2007). «Chapter 4: Introducing the Excel object model». cited work. p. 53 ff. ISBN 978-0-470-04674-6.
- ^ «The Spreadsheet Page for Excel Users and Developers». spreadsheetpage.com. J-Walk & Associates, Inc. Retrieved December 19, 2012.
- ^ «Working with Excel 4.0 macros». microsoft.com. Microsoft Office Support. Retrieved December 19, 2012.
- ^ «The «Big Grid» and Increased Limits in Excel 2007″. microsoft.com. May 23, 2014. Retrieved April 10, 2008.
{{cite web}}: CS1 maint: url-status (link) - ^ «How to extract information from Office files by using Office file formats and schemas». microsoft.com. Microsoft. February 26, 2008. Retrieved November 10, 2008.
{{cite web}}: CS1 maint: url-status (link) - ^ a b «XML Spreadsheet Reference». Microsoft Excel 2002 Technical Articles. MSDN. August 2001. Retrieved November 10, 2008.
- ^ «Deprecated features for Excel 2007». Microsoft—David Gainer. August 24, 2006. Retrieved January 2, 2009.
- ^ «OpenOffice.org’s documentation of the Microsoft Excel File Format» (PDF). August 2, 2008.
- ^ «Microsoft Office Excel 97 — 2007 Binary File Format Specification (*.xls 97-2007 format)». Microsoft Corporation. 2007.
- ^ Fairhurst, Danielle Stein (March 17, 2015). Using Excel for Business Analysis: A Guide to Financial Modelling Fundamentals. John Wiley & Sons. ISBN 978-1-119-06245-5.
- ^ a b Newcomer, Joseph M. «Faking DDE with Private Servers». Dr. Dobb’s.
- ^ Schmalz, Michael (2006). «Chapter 5: Using Access VBA to automate Excel». Integrating Excel and Access. O’Reilly Media, Inc. ISBN 978-0-596-00973-1.Schmalz, Michael (2006). «Chapter 5: Using Access VBA to automate Excel». Integrating Excel and Access. O’Reilly Media, Inc. ISBN 978-0-596-00973-1.
- ^ Cornell, Paul (2007). «Chapter 5: Connect to other databases». Excel as Your Database. Apress. p. 117 ff. ISBN 978-1-59059-751-4.
- ^ DeMarco, Jim (2008). «Excel’s data import tools». Pro Excel 2007 VBA. Apress. p. 43 ff. ISBN 978-1-59059-957-0.
- ^
Harts, Doug (2007). «Importing Access data into Excel 2007». Microsoft Office 2007 Business Intelligence: Reporting, Analysis, and Measurement from the Desktop. McGraw-Hill Professional. ISBN 978-0-07-149424-3. - ^ «About Network DDE — Win32 apps». learn.microsoft.com.
- ^ «How to set up and use the RTD function in Excel — Office». learn.microsoft.com.
- ^
DeMarco, Jim (2008). Pro Excel 2007 VBA. Berkeley, CA: Apress. p. 225. ISBN 978-1-59059-957-0.External data is accessed through a connection file, such as an Office Data Connection (ODC) file (.odc)
- ^
Bullen, Stephen; Bovey, Rob & Green, John (2009). Professional Excel Development (2nd ed.). Upper Saddle River, NJ: Addison-Wesley. p. 665. ISBN 978-0-321-50879-9.To create a robust solution, we always have to include some VBA code …
- ^ William, Wehrs (2000). «An Applied DSS Course Using Excel and VBA: IS and/or MS?» (PDF). The Proceedings of ISECON (Information System Educator Conference). p. 4. Archived from the original (PDF) on August 21, 2010. Retrieved February 5, 2010.
Microsoft Query is a data retrieval tool (i.e. ODBC browser) that can be employed within Excel 97. It allows a user to create and save queries on external relational databases for which an ODBC driver is available.
- ^ Use Microsoft Query to retrieve external data Archived March 12, 2010, at the Wayback Machine
- ^ «Password protect documents, workbooks, and presentations — Word — Office.com». Office.microsoft.com. Retrieved April 24, 2013.
- ^ «Password protect documents, workbooks, and presentations — Word — Office.com». Office.microsoft.com. Retrieved April 24, 2013.
- ^ «Password protect worksheet or workbook elements — Excel — Office.com». Office.microsoft.com. Archived from the original on March 26, 2013. Retrieved April 24, 2013.
- ^ Ralph, Nate. «Office for Windows Phone 8: Your handy starter guide». TechHive. Archived from the original on October 15, 2014. Retrieved August 30, 2014.
- ^ Wollman, Dana. «Microsoft Office Mobile for iPhone hands-on». Engadget. Retrieved August 30, 2014.
- ^ Pogue, David. «Microsoft Adds Office for iPhone. Yawn». The New York Times. Retrieved August 30, 2014.
- ^ a b Ogasawara, Todd. «What’s New in Excel Mobile». Microsoft. Archived from the original on February 8, 2008. Retrieved September 13, 2007.
- ^ a b «Unsupported features in Excel Mobile». Microsoft. Archived from the original on October 20, 2007. Retrieved September 21, 2007.
- ^ Use Excel Mobile Archived October 20, 2007, at the Wayback Machine. Microsoft. Retrieved September 21, 2007.
- ^ «Excel Mobile». Windows Store. Microsoft. Retrieved June 26, 2016.
- ^ «PowerPoint Mobile». Windows Store. Microsoft. Retrieved June 26, 2016.
- ^ «Differences between using a workbook in the browser and in Excel — Office Support». support.office.com. Archived from the original on 8 February 2017. Retrieved 7 February 2017.
- ^ «Description of the Excel Viewer». Microsoft. February 17, 2012. Archived from the original on April 6, 2013.
- ^ a b «How to obtain the latest Excel Viewer». Microsoft Docs. May 22, 2020. Retrieved January 3, 2021.
- ^ «Description of the security update for Excel Viewer 2007: February 12, 2019». Microsoft. April 16, 2020. Retrieved January 3, 2021.
- ^ «Microsoft Excel Viewer». Microsoft. 1997. Archived from the original on January 20, 1998.
- ^ «Excel 97/2000 Viewer: Spreadsheet Files». Microsoft. Archived from the original on January 13, 2004.
- ^ «New Features in Windows CE .NET 4.1». Microsoft Docs. June 30, 2006. Retrieved January 3, 2021.
- ^ «Excel Viewer 2003». Microsoft. October 12, 2004. Archived from the original on January 15, 2005.
- ^ «Excel Viewer 2003 Service Pack 3 (SP3)». Microsoft. September 17, 2007. Archived from the original on October 11, 2007.
- ^ «Excel Viewer». Microsoft. January 14, 2008. Archived from the original on September 26, 2010.
- ^ «Excel Viewer 2007 Service Pack 2 (SP2)». Microsoft. April 24, 2009. Archived from the original on April 28, 2012.
- ^ «Excel Viewer 2007 Service Pack 3 (SP3)». Microsoft. October 25, 2011. Archived from the original on December 29, 2011.
- ^ «Supported versions of the Office viewers». Microsoft. April 16, 2020. Retrieved January 3, 2021.
- ^
Microsoft’s overview is found at: «Floating-point arithmetic may give inaccurate results in Excel». Revision 8.2 ; article ID: 78113. Microsoft support. June 30, 2010. Retrieved July 2, 2010. - ^
Altman, Micah; Gill, Jeff; McDonald, Michael (2004). «§2.1.1 Revealing example: Computing the coefficient standard deviation». Numerical issues in statistical computing for the social scientist. Wiley-IEEE. p. 12. ISBN 978-0-471-23633-7. - ^ de Levie, Robert (2004). cited work. pp. 45–46. ISBN 978-0-19-515275-3.
- ^
Walkenbach, John (2010). «Defining data types». Excel 2010 Power Programming with VBA. Wiley. pp. 198 ff and Table 8–1. ISBN 978-0-470-47535-5. - ^ McCullough, Bruce D.; Wilson, Berry (2002). «On the accuracy of statistical procedures in Microsoft Excel 2000 and Excel XP». Computational Statistics & Data Analysis. 40 (4): 713–721. doi:10.1016/S0167-9473(02)00095-6.
- ^ McCullough, Bruce D.; Heiser, David A. (2008). «On the accuracy of statistical procedures in Microsoft Excel 2007». Computational Statistics & Data Analysis. 52 (10): 4570–4578. CiteSeerX 10.1.1.455.5508. doi:10.1016/j.csda.2008.03.004.
- ^ Yalta, A. Talha (2008). «The accuracy of statistical distributions in Microsoft Excel 2007». Computational Statistics & Data Analysis. 52 (10): 4579–4586. doi:10.1016/j.csda.2008.03.005.
- ^ Goldwater, Eva. «Using Excel for Statistical Data Analysis—Caveats». University of Massachusetts School of Public Health. Retrieved November 10, 2008.
- ^
Heiser, David A. (2008). «Microsoft Excel 2000, 2003 and 2007 faults, problems, workarounds and fixes». Archived from the original on April 18, 2010. Retrieved April 8, 2010. - ^
Function improvements in Excel 2010 Archived April 6, 2010, at the Wayback Machine Comments are provided from readers that may illuminate some remaining problems. - ^ «The MOD bug». Byg Software. Archived from the original on January 11, 2016. Retrieved November 10, 2008.
- ^ «Days of the week before March 1, 1900 are incorrect in Excel». Microsoft. Archived from the original on July 14, 2012. Retrieved November 10, 2008.
- ^ «Excel incorrectly assumes that the year 1900 is a leap year». Microsoft. Retrieved May 1, 2019.
- ^ Spolsky, Joel (June 16, 2006). «My First BillG Review». Joel on Software. Retrieved November 10, 2008.
- ^ «The Contradictory Nature of OOXML». ConsortiumInfo.org. January 17, 2007.
- ^ «Negative date and time value are displayed as pound signs (###) in Excel». Microsoft. Retrieved March 26, 2012.
- ^ Zeeberg, Barry R; Riss, Joseph; Kane, David W; Bussey, Kimberly J; Uchio, Edward; Linehan, W Marston; Barrett, J Carl; Weinstein, John N (2004). «Mistaken Identifiers: Gene name errors can be introduced inadvertently when using Excel in bioinformatics». BMC Bioinformatics. 5 (1): 80. doi:10.1186/1471-2105-5-80. PMC 459209. PMID 15214961.
- ^ a b Ziemann, Mark; Eren, Yotam; El-Osta, Assam (2016). «Gene name errors are widespread in the scientific literature». Genome Biology. 17 (1): 177. doi:10.1186/s13059-016-1044-7. PMC 4994289. PMID 27552985.
- ^ Anon (2016). «Microsoft Excel blamed for gene study errors». bbc.co.uk. London: BBC News.
- ^ Cimpanu, Catalin (August 24, 2016). «One in Five Scientific Papers on Genes Contains Errors Because of Excel». Softpedia. SoftNews.
- ^ Ziemann, Mark (2016). «Genome Spot: My personal thoughts on gene name errors». genomespot.blogspot.co.uk. Archived from the original on August 30, 2016.
- ^ Vincent, James (August 6, 2020). «Scientists rename human genes to stop Microsoft Excel from misreading them as dates». The Verge. Retrieved October 9, 2020.
- ^ «Excel: type() and
WorksheetFunction.IsText()fail for long strings». Stack Overflow. November 3, 2018. - ^ Rajah, Gary (August 2, 2004). «Trouble with macros». The Hindu Business Line. Retrieved March 19, 2019.
- ^ Chirilov, Joseph (January 8, 2009). «Microsoft Excel — Why Can’t I Open Two Files With the Same Name?». MSDN Blogs. Microsoft Corporation. Archived from the original on July 29, 2010. Retrieved March 19, 2019.
- ^ Infoworld Media Group, Inc. (July 7, 1986). InfoWorld First Look: Supercalc 4 challenging 1-2-3 with new tactic.
- ^ «The History of Microsoft — 1987». channel9.msdn.com. Archived from the original on September 27, 2010. Retrieved October 7, 2022.
- ^ «The History of Microsoft — 1987». learn.microsoft.com. Retrieved October 7, 2022.
- ^ a b Walkenbach, John (December 4, 2013). «Excel Version History». The Spreadsheet Page. John Walkenbach. Retrieved July 12, 2020.
- ^ Lewallen, Dale (1992). PC/Computing guide to Excel 4.0 for Windows. Ziff Davis. p. 13. ISBN 9781562760489. Retrieved July 27, 2013.
- ^ Lake, Matt (April 6, 2009). «Easter Eggs we have loved: Excel 4». crashreboot.blogspot.com. Retrieved November 5, 2013.
- ^ Osterman, Larry (October 21, 2005). «Why no Easter Eggs?». Larry Osterman’s WebLog. MSDN Blogs. Retrieved July 29, 2006.
- ^ «Excel 95 Hall of Tortured Souls». Retrieved July 7, 2006.
- ^ «Excel Oddities: Easter Eggs». Archived from the original on August 21, 2006. Retrieved August 10, 2006.
- ^ «Car Game In Ms Excel». Totalchoicehosting.com. September 6, 2005. Retrieved January 28, 2014.
- ^ Dostál, M (December 9, 2010). User Acceptance of the Microsoft Ribbon User Interface (PDF). Palacký University of Olomouc. ISBN 978-960-474-245-5. ISSN 1792-6157. Retrieved May 28, 2013.
- ^ [Using Excel Tables to
Manipulate Billing Data https://mooresolutionsinc.com/downloads/Billing_MJ12.pdf] - ^ Dodge, Mark; Stinson, Craig (2007). «Chapter 1: What’s new in Microsoft Office Excel 2007». Microsoft Office Excel 2007 inside out. Microsoft Press. p. 1 ff. ISBN 978-0-7356-2321-7.
- ^ «What’s New in Excel 2010 — Excel». Archived from the original on December 2, 2013. Retrieved September 23, 2010.
- ^ Walkenbach, John (2010). «Some Essential Background». Excel 2010 Power Programming with VBA. Indianapolis, Indiana: Wiley Publishing, Inc. p. 20. ISBN 9780470475355.
- ^ Harris, Steven (October 1, 2013). «Excel 2013 — Flash Fill». Experts-Exchange.com. Experts Exchange. Retrieved November 23, 2013.
- ^ «What’s new in Excel 2013». Office.com. Microsoft. Retrieved January 25, 2014.
- ^ K., Gasper (October 10, 2013). «Does a PowerPivot Pivot Table beat a regular Pivot Table». Experts-Exchange.com. Experts Exchange. Retrieved November 23, 2013.
- ^ K., Gasper (May 20, 2013). «Inquire Add-In for Excel 2013». Experts-Exchange.com. Experts Exchange. Retrieved November 23, 2013.
- ^ «New functions in Excel 2013». Office.com. Microsoft. Retrieved November 23, 2013.
- ^ «What’s new in Office 2016». Office.com. Microsoft. Retrieved August 16, 2015.
- ^ «Microsoft Announces March Availability of Office 98 Macintosh Edition». Microsoft. January 6, 1998. Retrieved December 29, 2017.
- ^ «Office for Mac Is Finally a ‘First-Class Citizen’«. Re/code. July 16, 2015. Retrieved July 29, 2015.
- ^ Perton, Marc (November 20, 2005). «Windows at 20: 20 things you didn’t know about Windows 1.0». switched.com. Archived from the original on April 11, 2013. Retrieved August 1, 2013.
- ^ Keizer, Gregg (February 24, 2009). «Attackers exploit unpatched Excel vulnerability». Computerworld. IDG Communications, Inc. Retrieved March 19, 2019.
- ^ «JTRIG Tools and Techniques». The Intercept. First Look Productions, Inc. July 14, 2014. Archived from the original on July 14, 2014. Retrieved March 19, 2019.
- ^ Cook, John. «JTRIG Tools and Techniques». The Intercept. p. 4. Retrieved March 19, 2019 – via DocumentCloud.
- ^ Phillips, Gavin (December 11, 2015). «8 Legendary Games Recreated in Microsoft Excel». MUO.
- ^ «Excel Games – Fun Things to Do With Spreadsheets». November 10, 2021.
- ^ «Unusual Uses of Excel». techcommunity.microsoft.com. August 5, 2022.
- ^ «Someone made a version of ‘Civilization’ that runs in Microsoft Excel». Engadget.
- ^ Dalgleish, Debra. «Have Fun Playing Games in Excel». Contextures Excel Tips.
- ^ «Microsoft Excel esports is real and it already has an international tournament». ONE Esports. June 9, 2021.
References
- Bullen, Stephen; Bovey, Rob; Green, John (2009). Professional Excel Development: The Definitive Guide to Developing Applications Using Microsoft Excel and VBA (2nd ed.). Boston: Addison Wesley. ISBN 978-0-321-50879-9.
- Dodge, Mark; Stinson, Craig (2007). Microsoft Office Excel 2007 Inside Out. Redmond, Wash.: Microsoft Press. ISBN 978-0-7356-2321-7.
- Billo, E. Joseph (2011). Excel for Chemists: A Comprehensive Guide (3rd ed.). Hoboken, N.J.: John Wiley & Sons. ISBN 978-0-470-38123-6.
- Gordon, Andy (January 25, 2021). «LAMBDA: The ultimate Excel worksheet function». microsoft.com. Microsoft. Retrieved April 23, 2021.
External links
![]()
Wikibooks has a book on the topic of: Excel
- Microsoft Excel – official site

Воробьёв в.В.
Пособие для начинающих
Воробьев В.В.
Microsoft Excel
2000: Пособие для начинающих.
— К.: 2000. – 36 с., с ил.
Данное учебное пособие
посвящено табличному процессору
Microsoft Excel 2000, который входит в пакет
Microsoft Office 2000. Пособие содержит
описание основных операций создания и
обработки таблиц с помощью Microsoft Excel.
Пособие рассчитано на
пользователей, которые имеют минимальный
опыт работы в среде
Windows.
2000 Воробьёв В.В.
Содержание
Общие сведения 3
Окно программы 3
Меню 3
Панели инструментов 4
Рабочая книга 5
Выделение элементов таблицы 6
Заполнение ячеек 6
Отмена операций 6
Создание рабочей книги 7
Открытие рабочей книги 8
Сохранение рабочей книги 9
Закрытие рабочей книги 9
Завершение работы с Microsoft Excel 9
Работа с формулами 9
Основные сведения 10
Функции 10
Массивы формул 11
Сообщения об ошибках 12
Операции с элементами таблицы 12
Вставка элементов таблицы 12
Удаление элементов таблицы 13
Удаление содержимого элементов
таблицы 13
Копирование и перемещение данных 13
Буфер обмена 14
Поиск данных 14
Зaменa данных 15
Операции с листами рабочих книг 15
Формат данных 16
Формат чисел 16
Маски форматов 17
Выравнивание содержимого ячеек 19
Установление шрифта 20
Изменение размеров строк и столбцов 21
Оформление таблиц 22
Группирование элементов таблицы 24
Работа с окнами 25
Разделение окон 25
Создание нового окна 25
Фиксация подокон 26
Присвоение имени ячейке, диапазону
или формуле 26
Создание примечаний 27
Работа с базами данных 28
Сортировка данных 28
Формы данных 29
Установление диапазона критериев 31
Автофильтр 32
Расширенный фильтр 33
Создание диаграмм 34
Печать таблиц 35
Общие сведения Окно программы Рис.1
Microsoft
Excel 2000 – табличный
процессор, программа для создания и
обработки электронных таблиц. Ярлык
Microsoft
Excel 2000
имеет вид на рис.1.
Microsoft
Excel позволяет
работать с таблицами в двух режимах:
-
Обычный
– наиболее удобный для выполнения
большинства операций. -
Разметка
страниц
– удобен для окончательного
форматирования таблицы перед распечаткой.
Границы между страницами в этом режиме
отображаются синими пунктирными
линиями. Границы таблицы – сплошной
синей линией, перетягивая которую,
можно изменять размеры таблицы.
Для перехода между режимами
Обычный
и Разметка
страниц
используются
соответствующие пункты меню Вид.
Рис.2. Окно Microsoft Excel
Меню
Под заголовком окна находится
строка меню, через которую можно вызвать
любую команду Microsoft Excel. Для открытия
меню необходимо щелкнуть мышью на его
имени. После этого появятся те команды
этого меню, которые используются наиболее
часто (рис.3). Если щелкнуть по кнопке
![]() в нижней части меню то появятся все
в нижней части меню то появятся все
команды этого меню (рис.4).
П Рис.3анели инструментов
П
Рис.4
од строкой меню расположены
панели инструментов, которые состоят
из кнопок с рисунками. Каждой кнопке
соответствует команда, а рисунок на
этой кнопке передает значение команды.
Большинство кнопок дублирует наиболее
часто употребляемые команды, доступные
в меню. Для вызова команды, связанной с
кнопкой, необходимо щелкнуть мышью на
этой кнопке. Если навести указатель
мыши на кнопку, рядом появится рамка с
названием команды.
Обычно под строкой меню
находятся две панели инструментов –
Стандартная
и Форматирование.
Чтобы вывести или убрать панель с экрана,
следует выбрать в меню Вид
пункт Панели
инструментов,
а затем щелкнуть на имя
нужной панели.
Если панель присутствует на экране, то
рядом с ее именем будет стоять метка .
Е
Рис.5
Рис.6
сли для отображения всех
кнопок на панели не достаточно места,
то выводятся кнопки, которые были
использованы последними. Если нажать
на кнопку![]()
в конце панели, то
появятся остальные кнопки (рис.5). При
нажатии на кнопку Добавить
или удалить кнопки
появится меню (рис.6), в котором можно
вывести или убрать кнопку с панели.
Также для изменения состава
панели инструментов, используется окно
Настройка
из меню Сервис.
В диалоговом окне необходимо выбрать
вкладыш Команды.
В списке Категории
выбирается группа
кнопок, после чего в списке К
Рис.7
оманды
появляются кнопки
этой группы. Чтобы добавить кнопку на
панель инструментов, следует перетянуть
ее из диалогового окна в нужную позицию
меню. Процесс установления кнопки
завершается щелчком кнопки Закрыть.
Для удаления кнопки с панели инструментов
необходимо перетянуть ее в диалоговое
окно Настройка.
Управлять панелями инструментов
удобно с помощью контекстного меню
(рис.7), которое вызывается нажатием
правой клавиши мыши на любой кнопке.
Под панелями инструментов
Microsoft
Excel обычно находится строка формул, а в
нижней части окна – строка состояния.
Чтобы вывести или убрать эти строки,
следует в меню Вид
выбрать соответствующие пункты: Строка
формул
(рис.8) или Строка
состояния.
Соседние файлы в папке Excel
- #
- #
- #
![]() Download
Download
Skip this Video
Loading SlideShow in 5 Seconds..
Excel 2000 PowerPoint Presentation


Download Presentation
Excel 2000
— — — — — — — — — — — — — — — — — — — — — — — — — — — E N D — — — — — — — — — — — — — — — — — — — — — — — — — — —
Presentation Transcript
-
Excel 2000 Chapter 1 Mr. Keller Mr. Keller — MS Office 2
-
What is Excel? • A powerful spreadsheet program that allows you to organize data, complete calculations, make decisions, graph data, develop professional looking reports, publish organized data to the Web and access real-time data from Web sites. Mr. Keller — MS Office 2
-
Features • Worksheets – enter, calculate, manipulate and analyze data • Charts – pictorially represent data • Databases – Manage data. Sort, search and select data. • Web Support – Save as HTML to view in browsers like Netscape, Explorer, AOL; use web queries to retrieve real data. Mr. Keller — MS Office 2
-
Start Excel Describe Wksheet Reset Menus/Toolbars Select cell(s) Text & Numbers Autosumm button Copy Cell(s) Resize font Bold entries Autoformat Center cell contents Name boxes Chart Wizard Save & Print Wksheet Quit Open Workbook Autocalculate Correct errors Project 1 — Fun-N-Sun Sojourn First Quarter Sales Mr. Keller — MS Office 2
-
OFFICE ASSISTANT How to use the Office Assistant Mr. Keller — MS Office 2
-
End of Chapter Activities • Apply Your Knowledge • Open a Worksheet • Manipulate a Worksheet • In The Lab 1, 2, 3 • All Chapter Skills • Cases and Places 1-4 Required • Cases and Places 5 & 6 Extra Credit Mr. Keller — MS Office 2
-
Let’s Get Started Open your Microsoft Excel 2000 books to Page E 1.8 Mr. Keller — MS Office 2
Transcription
Introducing Microsoft Excel 2000Microsoft Excel is a spreadsheet and graphing program. It replaces your calculator, ledger, andgraphing equipment to help you record, analyze, and represent quantitative data. Quantitative data isinformation that can be measured and given a number value. Using Excel, you will easily accomplishdifficult calculating and graphing tasks in a fraction of the time it would take with a pencil and paper. Inaddition, your projects will also have superior looks and far better accuracy than ordinary pencil andpaper work.The file you create and save in Excel is called a workbook. It contains a collection of worksheets thatlook similar to an accountant’s ledger sheet, but you can perform calculations and other tasksautomatically.Viewing the Excel 2000 WindowTitle BarMenu BarStandardToolbarFormattingToolbarFormula BarLabelsValues (Data)End of PageWorksheet TabsExcel SpreadsheetsPage 1
Exercise 1Creating A Worksheet In A WorkbookStarting Excel1. Click the Start buttonon the Taskbar and point to Programs .2. On the Programs Submenu, click Microsoft Excel.3. In a few seconds, the program is loaded and the Excel window appears.Figure 2Column Heading—clickthis to select the entirecolumnCell B1 is selected—noticethat the cell’s contentsappears in the Formula BarRow Heading—click this toselect the entire row4. Click the Maximize button5. Change the Zoom boxto enlarge the window.on the Standard toolbar to 100% to see the whole spreadsheet.Your untitled workbook opens as Book1. It contains threeempty worksheets. Looking at the worksheet name on thetab at the bottom of the window, you can tell that you are onSheet1. A worksheet is a huge grid of columns and rows;most of which cannot fit on the screen. It has 256 columns and more than 65,000 rows. Each worksheetcan hold a huge amount of data.Notice that each column has a letter. This is the Column Heading. Each row has a number this is theRow Heading. Cells are the rectangles formed by the intersection of a column and a row. Each cell isnamed by the column and row it is in (A1, B12, C134 ).Unlike a table in Microsoft Word, there is not a blinking insertion point to tell you what cell you are in.Instead, Excel has a black border around the cell you have currently selected and the name of the cell isin the Name Box above cell A1.Excel SpreadsheetsPage 2
6. Notice the black dot in the lower right hand corner of the border of A1. Thisis called the Fill Handle. You’ll use this shortcut later.Naming a Workbook by SavingBook1 has not been saved with a name.7. Press the Save buttonon the Standard toolbar.8. The Save As dialog box opens.9. To the right of the Save in text box, click the drop-down arrowand select your period folder.10. Replace this filename by typing My First Excel Workbook, press Spacebar, type your initials,press Spacebar, and type your partner’s initials.11. Click the Save button or press Enter.A workbook can hold up to 255 worksheets. You will learn to insert new worksheets later.Moving Around the WorksheetTable 1Shortcuts for Moving between Cells in ExcelTo Move ToPressNext cell to rightTab or Right ArrowNext cell to leftShift Tab or left arrowNext cell downDown arrow or EnterNext cell upUp arrowEntering Labels and Numbers in a WorksheetLabels turn a worksheet full of numbers into a meaningful report by clarifying the relationships betweenthe numbers. You use labels to identify the data in the worksheet columns and rows. A label can be textor numbers.Numbers can be whole numbers, decimals, fractions, percentages, or dates. You can enter numbersusing the top row of your keyboard or the numeric keypad on the right side of the keyboard.Excel SpreadsheetsPage 3
Enter a Text LabelFigure 312. Click in cell A1.13. Type Month.14. Press Tab to move to cell B1.15. Type Number of Students.16. Notice how the words spilled into Column C. Do notworry about it now. You will adjust the columnwidth later.17. Click in cell A2.18. Type January.19. Press Enter.20. Pressing Enter moves you to the next row down inthe same column.21. Fill in cells A3 to A15 with the information in theFigure 3.22. Press Ctrl S to save your workbook.Entering Number Data23. Enter the number of students born in January intocell B2.Figure 424. Press Enter to move to cell B3.25. Enter the number of students born in Februaryinto cell B3.26. Press Enter to move to cell B4.27. Continue to enter the number of students born ineach month into cells B4 to B13.28. Do not enter data into cells B14 or B15.29. Press Ctrl S to save your workbook.30. Look at Figure 4.Editing Cell ContentsNo matter how much you plan you can count onhaving to make changes in a worksheet. Sometimes itsbecause you want to correct an error; other times youmight want to add new information. You edit data justas easily as you enter it, using the Formula bar ordirectly editing the active cell.Excel SpreadsheetsPage 4
Editing Cell Contents Using the Formula Bar31. Click in cell B1, the cell you want to edit.32. Click in the Formula bar before the N in Number.33. Press the Delete key to erase the words and spaces for Number of.34. Press the Enter key.35. The label B1 should read Students.Editing Cell Content In-Cell36. Double-click in cell A15.37. The blinking insertion point tells you that you can edit the contents of the cell.38. Use the Arrow key to move the insertion point to the left ofthe N in Number.39. Press the Delete key to erase the words and spaces forNumber of.40. Press the Enter key.41. The label A15 should read TotalStudents.Formatting a Cell42. Click in cell A1 and drag to B1.43. Both cells are now selected.44. Press Format on the Menu bar andselect Cells.45. The Format Cells dialog boxappears.46. Click the Font tab.47. Change the Font style to Bold.48. Click the Border tab.49. Under Line Style, select theheaviest line.50. Under Presets, click the Outline and Inside buttons.51. Click the Patterns tab.52. Under Cell Shading, select the lightest gray color.53. Click OK.54. Click in cell A15.55. Press Format on the Menu bar and select Cells.56. The Format Cells dialog box appears.Excel SpreadsheetsPage 5
57. Click the Font tab.58. Change the Font style to Bold.59. Select the Border tab.60. Under Line Style, select the heaviest line.61. Under Presets, click the Outline button.62. Click the Patterns tab.63. Under Cell Shading, select the lightest gray color.64. Click OK.65. Press Ctrl S to save your workbook.66. Look at the picture to the right.Formatting Columns67. Click Column Heading A and drag to Column Heading B.68. Both columns are selected.69. Using the Formatting toolbar, change the Font Size to 14 points.70. Change the Zoom boxon the Standard toolbar to 75% to see the whole spreadsheet.Changing the Column WidthTable 2How to Change Column WidthTo change column widthDrag the boundary on the right side of the columnheading until the column is the width you want.To make the column width fit the contentsDouble-click the boundary to the right of the columnheadingTo make the column width an exact sizeClick Format on the Menu bar and select ColumnWidth. Type the number of points you want thewidth to be.71. Double-click the gray border to the between Column HeadingA and Column Heading B.72. This is called AutoFitting.73. The width of the column will fit the contents perfectly.74. Double-click the gray border to the between Column HeadingB and Column Heading C.Excel SpreadsheetsPage 6
Exploring FormulasOne of the best things about Excel is that it will do mathematical calculations for you automatically. Forthis to happen, you must type a formula into a cell. A formula is a series of mathematical steps thatcalculates values and returns a result. There are several formula rules you must follow.Table 3: If you do not follow these rules, Excel cannot do the calculation for you.Excel Formula Rules1. A formula always begins with an equals sign.2. Never use spaces in a formula.3. Press Enter to see the result of your formula.4. You may use upper or lowercase letters.Table 4How to Write Mathematical ExpressionsSymbolOperationExample Addition e3 f3-Subtraction e3-f3xMultiplication e3*f3/Division e3/f3Mixed OperationsExcel follows the Order of Operations automaticallywhen it calculates (e3 f3)/g2*3.14To calculate the total number of students in the class we need to tell Excel to add up the contents of eachcell that contains birthday data. We want the total number of students to appear in cell B15. This tellsExcel to take whatever value is in each of these cells and add them together.75. Change the Zoom boxon the Standard toolbar to 100%.76. Click in cell B15.Excel SpreadsheetsPage 7
77. Type the formula b2 b3 b4 b5 b6 b7 b8 b9 b10 b11 b12 b13.78. The formula appears in the Formula bar.79. Look at Figure 5.Figure 5: This formula will add up all the cells between B2 and B13.80. Press Enter when you are done.81. Did the answer appear in cell B15?Performing Calculations Using FunctionsFunctions are predesigned formulas that save you the time andtrouble of creating a long formula expression.82. Click in cell B15.83. Type Sum(b2:b13).84. Press Enter.85. The answer is returned in cell B15.86. Press Ctrl S to save your work.Inserting a WordArt Title87. Click the Drawing buttonStandard toolbar.on the88. The Drawing toolbar opens.89. On the Drawing toolbar, click theInsert WordArt button.90. The Word Art Gallery opens.91. Select any style from the WordArtGallery.92. Click OK.93. The Edit WordArt Text dialog boxopens.Excel SpreadsheetsPage 8
94. Type Class Birthdays.95. Select any Font that looks attractive.96. Change the Size from 24 – 36 points.97. Click OK.98. Drag the WordArt somewherebetween Columns D and F.99. Warning! Do not go over thedotted line. That’s the end of thepage.100.Look at Figure 6.Naming a Worksheet101.Double-click the tab Sheet1.102.The title becomes highlighted.103.Type the words Class Birthdays.Creating a Header for Your HeadingYour worksheet needs a heading. You will create a header and footer. Remember, a header and footerappear on every page.104.Click View on the Menu bar and select Header and Footer.105.The Page Setup dialog box opens.106.Click the Custom Header button107.The Header dialog box opens.108.In the Right section type your name .109.Press Enter.110.Type your partner’s name .111.Press Enter.112.Click the Date button113.Press Enter.114.It should say &[Date].115.Press Enter.116.Type the word Period, press the Spacebar, and type your period number.117.Press Enter.118.Type Excel Exercise 1.119.Click OK.Excel Spreadsheets.Page 9
120.Click the Custom Footer button.121.The Footer dialog box opens.122.In the Right section, click the File Name button.123. The file name is what yo u called the document whenyou saved it.124.It should say &[File].125.Click OK.126.Click the Margins tab.127. Change the Top Margin to 2 inches so you haveroom for your header.128.Click OK.129.Note: You will not see the header and footer until you use Print Preview.Previewing a Worksheet130.Press F7 to run a spell check.131.Fix any errors.132.Press Ctrl S to save your work.133.Click on the Print Preview button134.Check the bottom of the Print Preview window to check that you only have one page.135.You will now see your header and footer.136.Click the Close button.on the Print Preview toolbar.Printing a Document137.Press Ctrl P.138.The Print dialog box opens.139.The Name of the printer should be Ireland.140.Next to Number of copies, type 2 in the text box.141.Click OK.142.Look at Figure 6.Excel SpreadsheetsPage 10
Figure 6You only see theHeader and Footer inPrint Preview and afteryou print.143.Press Alt F4 to close all open windows and to return to the Desktop.Excel SpreadsheetsPage 11
Exercise 2More On Excel Functions, Editing, And FormattingTable 5Selecting Spreadsheet ElementsTo SelectMouseCellCell is selected when its address appears in the name boxRowClick the row number headingColumnClick column letter headingRangeDrag over the cells, columns, or rows you want in your range.Opening Two Existing Files144.Click the Start button, point to Programs , and select Microsoft Excel.145.Click File on the Menu bar and select Open.146.The Open dialog box opens.147.Click the drop-down arrow148.Select your period folder.149.Click the file My First Excel Workbook to open it.150.Click the Open button151.Click the Maximize button152.Change the Zoom box on the Standard toolbar to 100%.153.You should be looking at the Class Birthdays worksheet.154.Click the Open button155.The Open dialog box opens.to the right of the Look in box.to enlarge the window.on the Standard toolbar.156. Click the drop-down arrowNeighborhood.to the right of the Look in box and select Network157.Double-click Wright-ms1 (Zeus).158.Double-click Students 200 .159.Double-click the folder entitled Excel Exercises to open itExcel SpreadsheetsPage 12
160. Double-click the file entitledStudent Names to open it.161. You now have two Excel filesopen and two buttons on the Taskbar.162.Click the My First Excel Workbook button on the Taskbar.Renaming a Sheet163.Click the Sheet2 tab.164.Sheet2 opens.165.Double-click the words Sheet2 on the tab.166.Type Class Ages to rename the tab.Copying and Pasting Data from Another File167.Click the Student Names button on the Taskbar.168.Click the worksheet tab with your class period.169.Click Column Heading A170.Column A is now selected.171.Press Ctrl C to copy the information.172.A line of «dancing ants» (marquee) will tell you your range has been copied to the Clipboard.173.Press Ctrl W to close the Student Names file.174. A message may appear stating that you have placed alot of information into the Clipboard.175.Click Yes so you can paste your information.176. Click the My First Excel Workbook button on theTaskbar.177.The workbook opens.178.Click in cell Al.179.Press Ctrl V to paste.180.The name information will appear in your worksheet.181.In cell B1 type Age.182.In cell A35 type Mean Age.183.In cell A36 type Median Age.184.In cell A37 type Mode Age.185.In cell A38 type Number of Students.Excel SpreadsheetsPage 13
186.Type the ages of each person in your class into your Class Ages worksheet.187.Press Ctrl S to save your work.Calculating the Average Age of Your ClassIn Exercise 1, you commanded Excel to add the amount of class birthdays to find the total amount ofstudents in the class. In Exercise 2, you are going to perform three average calculations without apencil and paper, or calculator. You are also going to have Excel count the number of students. Thefastest way to perform these calculations is with functions (predesigned formulas). Before you beginyou should review the three kinds of averages.Table 6Three Kinds of AveragesMeanThe sum of the data divided by the number of pieces of dataMedianThe middle number in a series of data.ModeThe piece of data that is the most frequent.Table 7Functions (Predesigned Formulas)SumAdds a group of dataProductMultiplies a group of dataCountCounts number of pieces of data that are numbersAverageCalculates the mean averageMedianCalculates the median averageModeCalculates the mode averageMinFinds the least number in a group of dataMaxFinds the greatest number in a group of data188.Look at Figure 7.Excel SpreadsheetsPage 14
Figure 7Michael is the last student inthis class. Therefore, thefunctions end with the cell thatcontains Michael’s age.Entering the Functions189.In cell B35 type Average(b2:b?).190.The question mark should be the cell of the last age in your class.191.Press Enter.192.In cell B36 type193.The question should be the cell of the last age in your class.194.Press Enter.195.In cell B37 type196.The question should be the cell of the last age in your class.197.Press Enter.198.In cell B38 type199.The question mark should be the cell of the last age in your class.200.Press Enter. Median(b2:b?). Mode(b2:b?). Count(b2:b?).201. You should now have calculated the mean, median, and mode average ages. You ha ve alsocounted up how many ages you collected, therefore, how many students we have in the class.Formatting the Worksheet202.Press Ctrl A to select all the cells.203.Press Ctrl 1.Excel SpreadsheetsPage 15
204.The Format Cells dialog box opens.205.Click the Alignment tab.206. Click the drop down arrow under Vertical and change itto Center.207.This will center the information in the cells vertically.208.Click the Font tab.209.Change the Size to 12 points.210.Click OK.Formatting the Column Labels211.Click in cell A1 and drag to cell B1.212.Both column labels are selected.213.Press Ctrl 1.214.The Format Cells dialog box opens.215.Click the Alignment tab.216.Click the drop down arrow under Horizontal and change it to Center.217.This will center the labels in the cells horizontally.218.The bottom check boxes should be unchecked.219.Click the Font tab.220.Change the Font style to Bold.221.Click the Border tab.222.Under Line Style, select the heaviest solid line in the group.223.Under Presets, click the Outline button and the Inside button.224.Click the Patterns tab.225.Under Cell Shading, select the lightest gray color.226.Click OK.Formatting the Function Labels227.Click in cell A35 and drag down to cell A38.228.The cells are selected.229.Press Ctrl 1.230.The Format Cells dialog box opens.231.Click the Alignment tab.232.Click the drop down arrow under Horizontal and change it to Right.233.This will right align the labels in the cells horizontally.234.The bottom check boxes should be unchecked.Excel SpreadsheetsPage 16
235.Click the Font tab.236.Change the Font style to Bold.237.Click the Border tab.238. Under Line Style, select the heaviest solid linein the group.239. Under Presets, click the Outline button and theInside button.240.Click the Patterns tab.241. Under Cell Shading, select the lightest graycolor.242.Click OK.Formatting the Averages and the Number of Students243.Click in cell B35 and drag down to cell B38.244.The cells are selected.245.Press Ctrl B to make the numbers bold.Adjusting the Column Width246.Click the Column Heading A and drag to the Column Heading B.247.Both columns are selected.248. Click Format on the menu bar; point toColumn, and select AutoFit Selection.249. Autofitting makes the columns or rowsfit the data and labels perfectly.Changing the Page Setup250. Click File on the Menu bar and selectPage Setup.251.The Page Setup dialog box opens.252.Click on the Sheet tab.253.Under Print, check Gridlines.254. This will put gridlines around your cellswhen you print. Generally, you shouldprint gridlines if you have a lot of data. Itmakes the numbers more readable.255.Click the Margins tab.256.Make the Top Margin 1.25 inches.257.Make the Bottom Margin 0.75 inch.258.This will push the spreadsheet downExcel SpreadsheetsPage 17
and away from your header.259.Check the box that says Center on page Horizontally.260.Click the Header/Footer tab.261.Click the Custom Header button262.The Header dialog box opens.263.In the Right section type your name.264.Press Enter.265.Type your partner’s name .266.Press Enter.267.Click the Date button268.Press Enter.269.It should say &[Date].270.Type the word Period, press the Spacebar, and type your period number.271.Press Enter.272.Type Excel Exercise 2.273.In the left section, type Class Ages.274.Click and drag to select the words Class Ages.275.Click the Font button276.The Format Font dialog box opens.277.Change the Font to Arial Black.278.Change the Size to 20 points.279.Click OK twice.280.Click the Custom Footer button281.The Footer dialog box opens.282.In the Right section click the File Name button283.Click OK twice.Previewing a Worksheet284.Press F7 to run a spell check.285.Fix any errors.286.Press Ctrl S to save your work.287.Click on the Print Preview button288.Check the bottom of the Print Preview window to check that you only have one page.Excel Spreadsheets.Page 18
289.You will now see your header and footer.290.Click the Close buttonon the Print Preview to
Excel Spreadsheets Page 2 Exercise 1 Creating A Worksheet In A Workbook Starting Excel 1. Click the Start button on the Taskbar and point to Programs. 2. On the Programs Submenu, click Microsoft Excel. 3. In a few seconds, the program is loaded and the Excel window appears. Figure 2 4. Click the Maximize button to enlarge the window. 5.