
Excel for Microsoft 365 Excel for Microsoft 365 for Mac Excel for the web Excel 2021 Excel 2021 for Mac Excel 2019 Excel 2019 for Mac Excel 2016 Excel 2016 for Mac Excel 2013 Excel 2010 Excel 2007 Excel for Mac 2011 Excel Starter 2010 More…Less
This article describes the formula syntax and usage of the MEDIAN function in Microsoft Excel.
Description
Returns the median of the given numbers. The median is the number in the middle of a set of numbers.
Syntax
MEDIAN(number1, [number2], …)
The MEDIAN function syntax has the following arguments:
-
Number1, number2, … Number1 is required, subsequent numbers are optional. 1 to 255 numbers for which you want the median.
Remarks
-
If there is an even number of numbers in the set, then MEDIAN calculates the average of the two numbers in the middle. See the second formula in the example.
-
Arguments can either be numbers or names, arrays, or references that contain numbers.
-
Logical values and text representations of numbers that you type directly into the list of arguments are counted.
-
If an array or reference argument contains text, logical values, or empty cells, those values are ignored; however, cells with the value zero are included.
-
Arguments that are error values or text that cannot be translated into numbers cause errors.
Note: The MEDIAN function measures central tendency, which is the location of the center of a group of numbers in a statistical distribution. The three most common measures of central tendency are:
-
Average which is the arithmetic mean, and is calculated by adding a group of numbers and then dividing by the count of those numbers. For example, the average of 2, 3, 3, 5, 7, and 10 is 30 divided by 6, which is 5.
-
Median which is the middle number of a group of numbers; that is, half the numbers have values that are greater than the median, and half the numbers have values that are less than the median. For example, the median of 2, 3, 3, 5, 7, and 10 is 4.
-
Mode which is the most frequently occurring number in a group of numbers. For example, the mode of 2, 3, 3, 5, 7, and 10 is 3.
For a symmetrical distribution of a group of numbers, these three measures of central tendency are all the same. For a skewed distribution of a group of numbers, they can be different.
Example
Copy the example data in the following table, and paste it in cell A1 of a new Excel worksheet. For formulas to show results, select them, press F2, and then press Enter. If you need to, you can adjust the column widths to see all the data.
|
Data |
||
|
1 |
||
|
2 |
||
|
3 |
||
|
4 |
||
|
5 |
||
|
6 |
||
|
Formula |
Description |
Result |
|
=MEDIAN(A2:A6) |
Median of the 5 numbers in the range A2:A6. Because there are 5 values, the third is the median. |
3 |
|
=MEDIAN(A2:A7) |
Median of the 6 numbers in the range A2:A7. Because there are six numbers, the median is the midway point between the third and fourth numbers. |
3.5 |
Need more help?
Want more options?
Explore subscription benefits, browse training courses, learn how to secure your device, and more.
Communities help you ask and answer questions, give feedback, and hear from experts with rich knowledge.
Purpose
Get the median of a group of numbers
Return value
A number representing the median.
Usage notes
The MEDIAN function returns the median (middle number) in a set of data. The calculation performed by MEDIAN varies according to the number of numeric values provided. When the number is odd, MEDIAN returns the middle number in the group. When the number is even, MEDIAN returns the average of the two numbers in the middle.
The MEDIAN function takes multiple arguments in the form number1, number2, number3, etc. Arguments can be a hardcoded constant, a cell reference, or a range, in any combination. MEDIAN ignores empty cells, text values, and the logical values TRUE and FALSE. The MEDIAN function will accept up to 255 separate arguments.
Examples
When the number of values provided is odd, MEDIAN returns the middle number:
=MEDIAN(1,2,3,4,5) // returns 3
=MEDIAN(1,4,5,7,11) // returns 5
When the number of values provided is even, MEDIAN returns the average of the two middle numbers:
=MEDIAN(1,2,3,4,5,6) // returns 3.5
=MEDIAN(1,2,4,6,8,9) // returns 9
In the worksheet shown above, the formulas in H5 and H6 are:
=MEDIAN(B5:B16) // returns 83.5
=MEDIAN(D5:D16) // returns 80
Note that MEDIAN ignores the empty cell in D5:D16 and returns the middle number in the eleven values provided.
Notes
- When the count of numbers is odd, MEDIAN returns the middle number.
- When the count of numbers is even, MEDIAN returns the average of the two middle numbers.
- MEDIAN ignores empty cells, the logical values TRUE and FALSE, and text.
- MEDIAN returns a #NUM! error if no numeric values are provided.
- Arguments can be numbers, names, arrays, or references, up to 255 total.
The MEDIAN function in Excel gives the median of any given set of numbers and is categorized as a statistical function. The median of any given number is the number in the middle of the set.
The MEDIAN measures central tendencyCentral Tendency is a statistical measure that displays the centre point of the entire Data Distribution & you can find it using 3 different measures, i.e., Mean, Median, & Mode.read more, which is the location of the center of a group of numbers in a statistical distribution.
For example, =MEDIAN(5,6,7,8,9) returns 7.

Likewise, we can use MEDIAN function to find the results.
Table of contents
- What Is Median Function In Excel?
- Syntax
- Illustration
- How To Use The MEDIAN Function In Excel?
- Examples
- Important Things To Note
- Frequently Asked Questions (FAQs)
- MEDIAN Excel Function Video
- Recommended Articles
- The MEDIAN function in Excel gives the median of any given set of numbers.
- We have to provide at least one number should be provided as an input to the MEDIAN function in Excel.
- The maximum number of values which can be provided as an input to the MEDIAN function in Excel is 255.
- The input can be numbers, names, arrays, or references containing numbers.
- Meanwhile, the logical values are also counted as numbers by the MEDIAN function in Excel.
Syntax
Below is the MEDIAN formula in Excel.
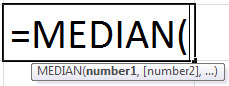
Arguments used for MEDIAN Formula:
- number_1, number_2, … , number_n: Set of numbers or cell references denoting numeric values for which the median is calculated.
We must provide at least one number. Subsequent numbers are optional. We can provide a maximum of 255 numbers in the MEDIAN function. The input can be numbers, names, arrays, or cell references containing numbers. Any logical value and text representations of numbers typed directly as the MEDIAN function counts input.
Output:
The MEDIAN function calculates the median of the given set of numbers. Half of the input numbers have values greater than the median, and half of the numbers have values less than the median. If there is an even number of inputs, then the MEDIAN function calculates the average of the two numbers in the middle. For example, suppose there are six numbers given as input, then the MEDIAN function will return the average of the third and fourth numbers. The MEDIAN function first rearranges the numerical input values in ascending order and then identifies the middle value.
Illustration
Suppose you want to find the median of numbers {2, 3, 4, 5, 6}. These numbers are given in cell B3:B7.

To calculate the median function, you could use the following MEDIAN FormulaThe median formula in statistics is used to determine the middle number in a data set that is arranged in ascending order. Median ={(n+1)/2}thread more:
=MEDIAN(B3:B7)

The MEDIAN formula will return the middle value, 4.

Instead of cell references, you could give the input values directly as:
=MEDIAN(2, 3, 4, 5, 6)

This MEDIAN formula in Excel will return the same output.

If you use an even number of values as an argument, such as {2, 3, 4, 5, 6, 7}, the MEDIAN formula will output the average of the middle two values- 4 and 5.

It will return the result as 4.5.

Suppose you give the nine arguments {3, 8, 4, 12, 14, 5, 1, 2, 10} which are not arranged in ascending order, MEDIAN will itself rearranges it in ascending order: {1, 2, 3, 4, 5, 8, 10, 12, 14} and then return the fifth value, 5, instead of giving 14 as an output.

Output:

How To Use The MEDIAN Function In Excel?
The MEDIAN Excel function is very simple and easy to use. Let us understand the working of the MEDIAN function by some examples.
The MEDIAN function in Excel measures the central tendency or average value. It is most suitable when skewed data includes exceptionally high or low values. The MEDIAN is the most appropriate measure for data classified on an ordinal scale. For example, we can use the MEDIAN function in Excel to find the median sales, revenue, or expenses.
You can download this MEDIAN Function Excel Template here – MEDIAN Function Excel Template
Examples
Example #1
Suppose you have the sales data for different products of your company. The data is given in cell B4:B17.
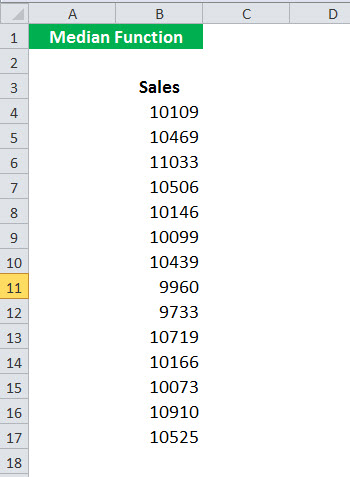
Now, you want to calculate the median sales. To do so, you can use the MEDIAN formula in Excel:
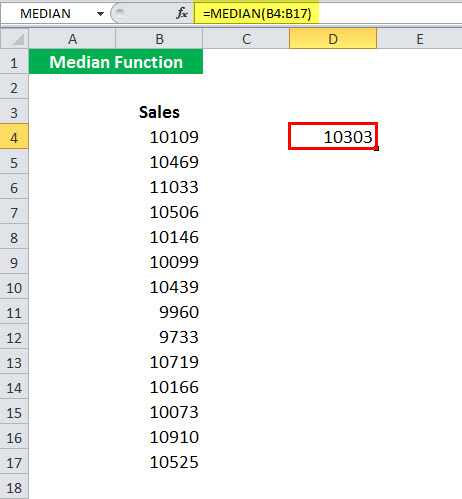
=MEDIAN(B4:B17)

And press the “Enter” key. It will return the median.
Example #2
Suppose you have the height of 12 students given in cell C4:C15. Then, you want to calculate the median height of the students.

To calculate the median height, you can use the MEDIAN formula in Excel:
=MEDIAN(C4:C15)

It will return 167.

Example #3
Suppose you have the petrol prices of different cities in the country for two months, as shown below.
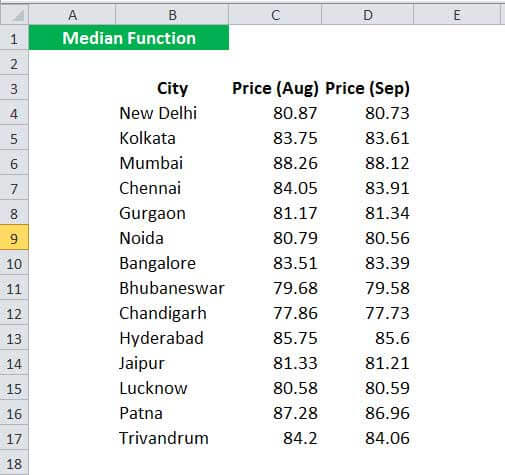
You want to calculate the median petrol prices for each month and then compare them based on their median values.
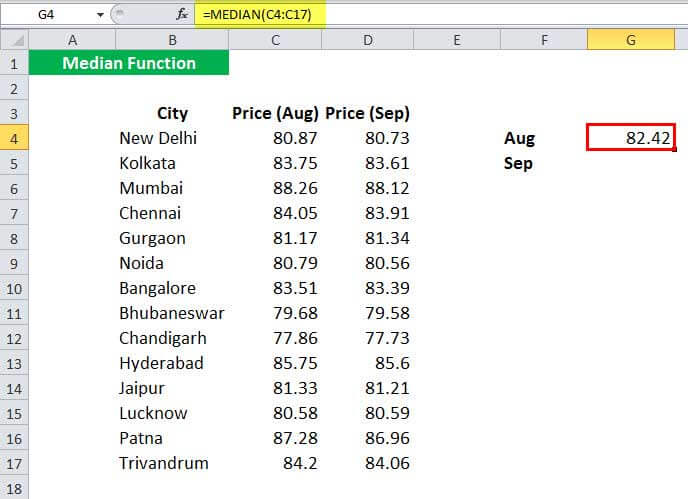
To calculate the median prices for Aug, you can use the MEDIAN formula in Excel:
=MEDIAN(C4:C17)
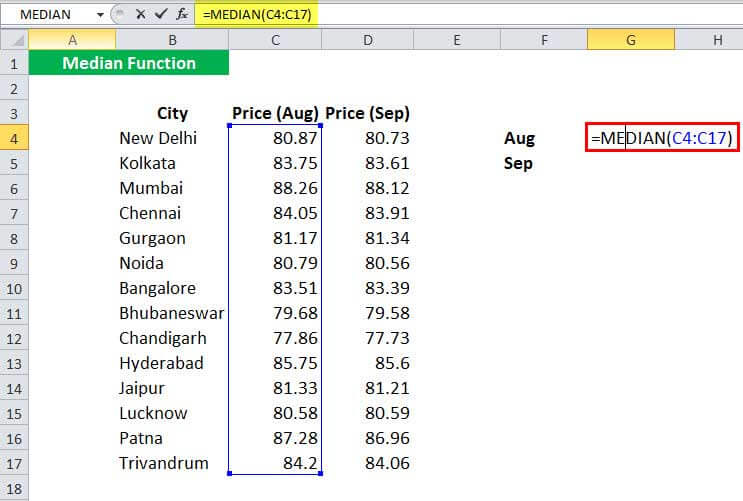
And press the “Enter” key. It will give the median for Aug – 82.42.
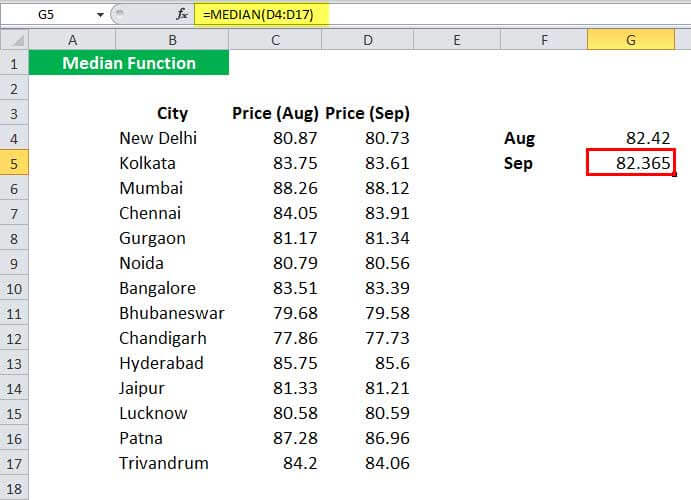
Similarly, you can find the median for Sep using the MEDIAN formula in Excel:
=MEDIAN(D4:D17)
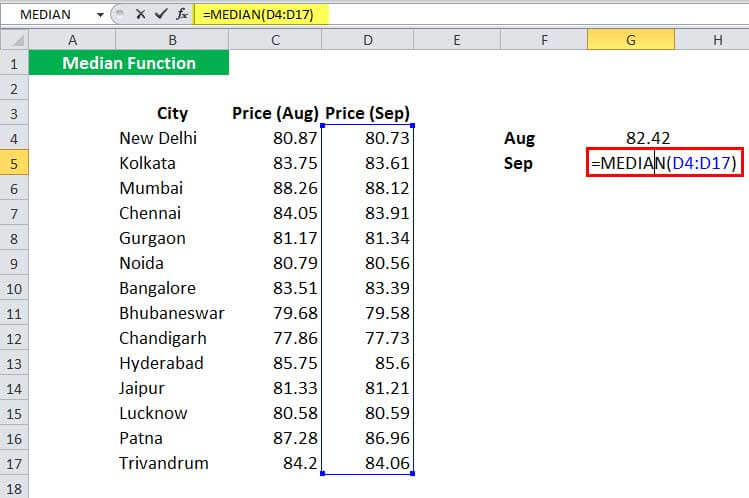
It will return 82.365
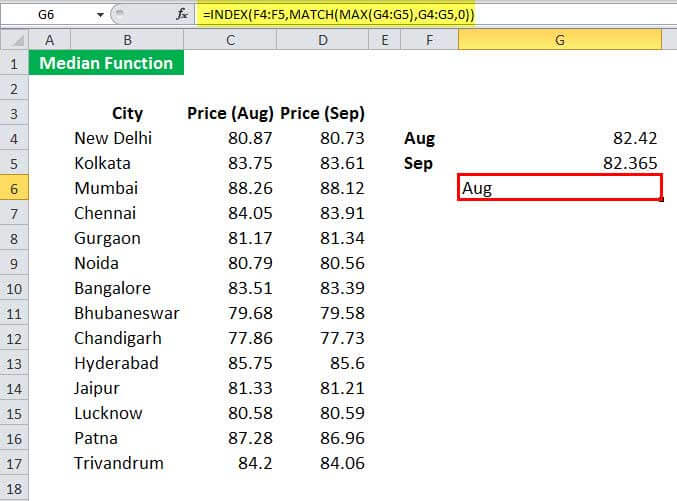
Now, to find which month had the larger median value, you can use the INDEX:
=INDEX(F4:F5,MATCH(MAX(G4:G5),G4:G5,0))
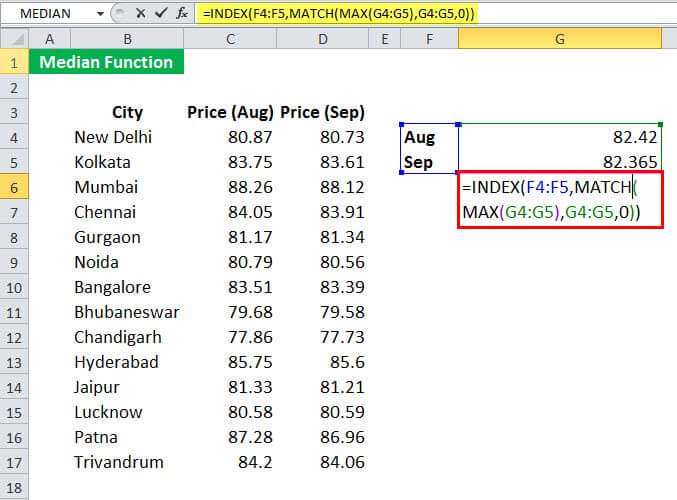
It will return the result as Aug.
Example #4
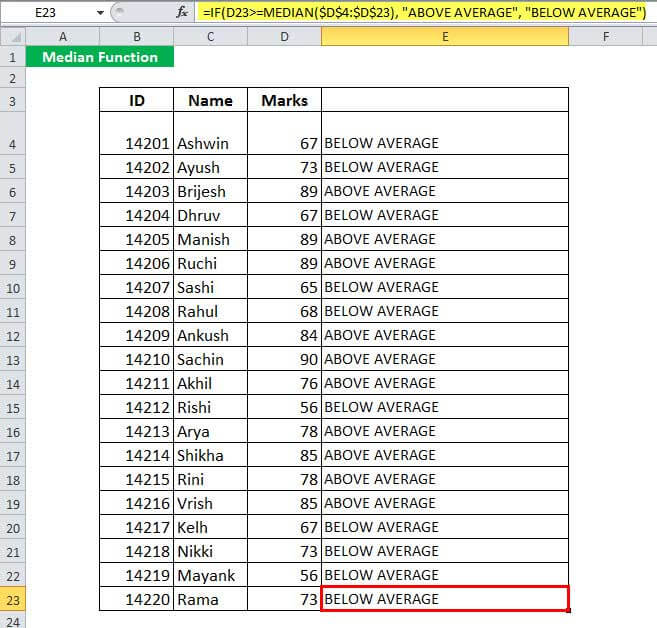
Suppose you have the marks obtained by students in a class. The marks are given in cell D4:D23.

Now, you want to compare the marks with the median marks obtained. If the marks obtained are greater than the median, the student will be considered above average. Otherwise, the student will be regarded as below average.
To do so, you can use the following MEDIAN formula:
=IF(D4>=MEDIAN($D$4:$D$23),“ABOVE AVERAGE”, “BELOW AVERAGE”)
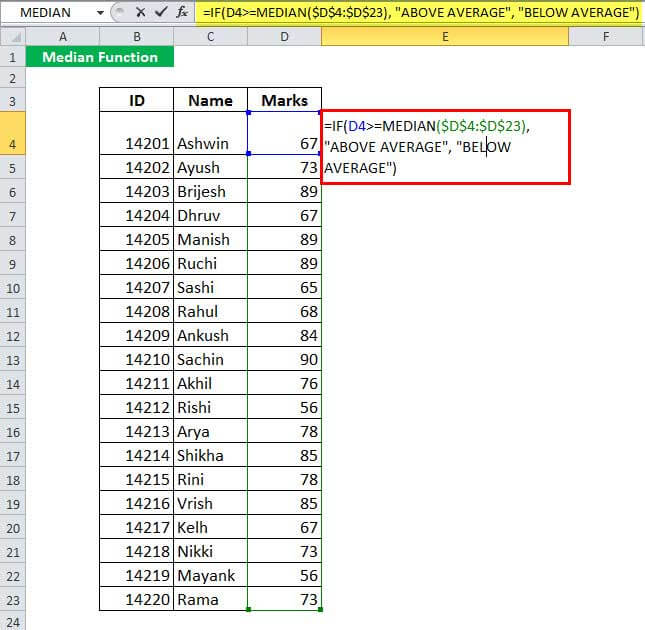
And press the “Enter” key. It will return the performance for the 1st student.
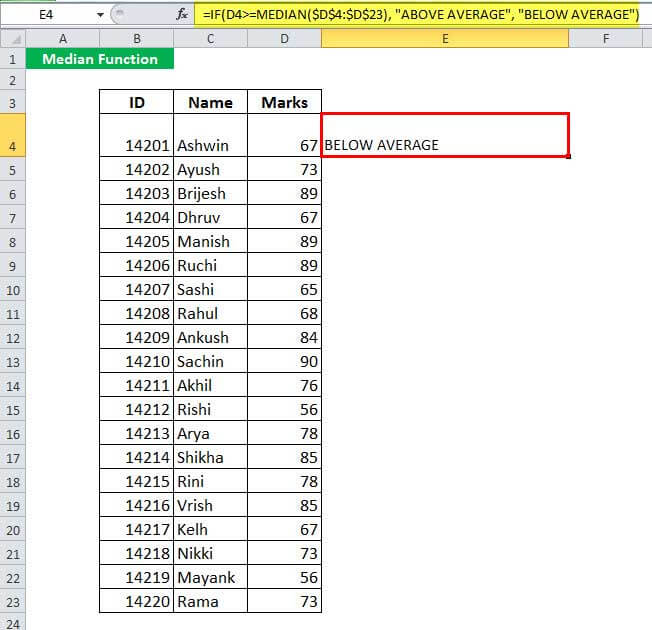
Now, you can drag it to the rest of the students to get the performance of each of the students.
Let us see the MEDIAN formula in Excel in detail.
- MEDIAN($D$4:$D$23) will calculate the median of the marks obtained by the students. Here, the median is 74.4.
- IF(D4>=MEDIAN($D$4:$D$23),“ABOVE AVERAGE”, “BELOW AVERAGE”) means that if the marks obtained by the student are greater than the median, it will return “Above Average,” else it will return “Below Average.”
Example #5
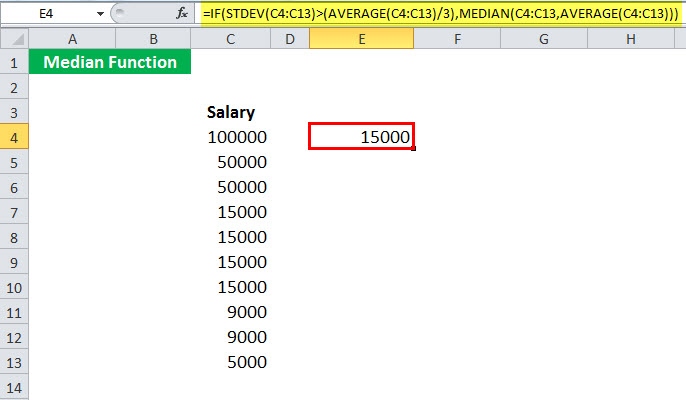
Suppose you have the monthly salary of a department of your company. The salary is given in cell B4:B13.

Now you are interested in calculating the central tendency of the given salary. You have decided that if the standard deviation is greater than one-third of the mean, you will calculate the median; else, you will calculate the mean.
To do so, you can use the MEDIAN formula in Excel:
=IF(STDEV(C4:C13)>(AVERAGE(C4:C13)/3),MEDIAN(C4:C13),AVERAGE(C4:C13))
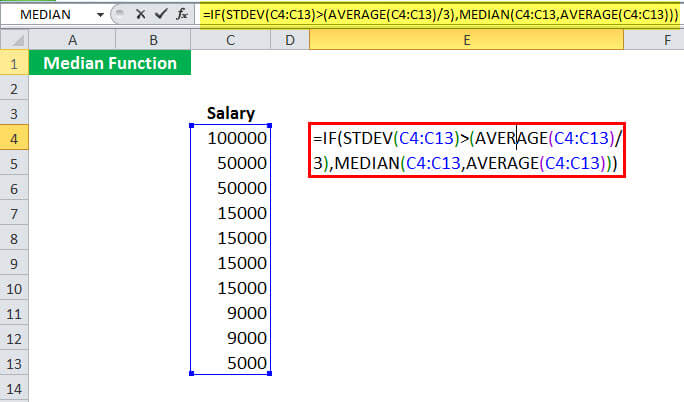
In this case, the standard deviation is 29959, and the mean is 28300, which clearly shows that the data has a very high standard deviation. The standard deviation, in this case, is greater than one-third of the mean; thus, it will report the median value, 15000.
Important Things To Note
- We can easily find the middle value of any data using MEDIAN function in excel.
- It is an inbuilt statistical function.
- If the data has even number of values, the MEDIAN function will return the average of the two middle values.
Frequently Asked Questions (FAQs)
1. What is MEDIAN function in excel?
One of the statistical functions available in excel is MEDIAN function. It is used to find the middle value of the data.
The syntax of MEDIAN function in excel is =MEDIAN(number1,[number2])…)
2. How to calculate using MEDIAN function in excel?
Using MEDIAN function is very simple.
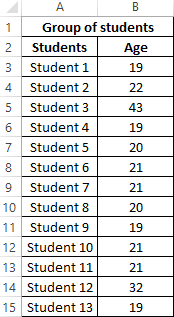
For example, consider the below table with values showing the age of various participants. Now, let us learn how to use MEDIAN excel function.

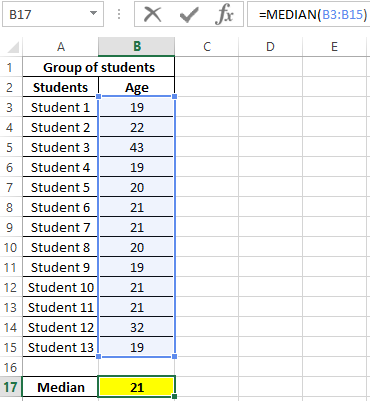
The steps used to find the middle value using MEDIAN excel function are:
• Step 1: First, insert the MEDIAN excel function.

• Step 2: Next, select the values for which we have to find the MEDIAN (middle value)
In this example, we have to select the cell range B2:B8.

• Step 3: Press Enter key.
We can see that the MEDIAN excel function has returned the middle value from the data.

We can see that the function has returned the middle value.
Likewise, we can use the middle value from the dataset.
3. How Median function will calculate the middle value if the numbers are even?
If the selected data are even in number, the MEDIAN function will return the middle value by calculating the average of the two middle values.
For example, consider the below set of numbers 26, 31, 45, 22, 65, 67. We can see that there are total of 6 numbers.
Let us see the middle value of the given set using MEDIAN function in excel.
The steps to find the middle value of an even number set are:
• Step 1: Insert the MEDIAN function and select the cell range A2:A7.
• Step 2: Press Enter key.

• Step 3: We can see that the function has returned the value as 38. It is obtained by calculating the average of the two middle values (45 and 22).

Likewise, MEDIAN function calculates the middle value of even number set.
MEDIAN Excel Function Video
Recommended Articles
This article is a guide to MEDIAN Function in Excel. We discuss the MEDIAN formula in Excel and how to use the MEDIAN function in Excel, along with Excel examples and downloadable Excel templates. You may also look at these useful functions in Excel: –
- MEDIAN Formula in ExcelMEDIAN function in Excel gives the median of a given set of numbers. MEDIAN Identifies the location of the center of a group of numbers in a statistical distribution.read more
- Cell Reference in ExcelCell reference in excel is referring the other cells to a cell to use its values or properties. For instance, if we have data in cell A2 and want to use that in cell A1, use =A2 in cell A1, and this will copy the A2 value in A1.read more
- INT Function in ExcelINT or integer function in excel returns the nearest integer of a given number and is used when we have many data sets and each data in a different format.read more
- MONTH Function in ExcelThe Month Function is a date function that determines the month for a given date in date format. It takes an argument in a date format and displays the result in integer format.read more
- Frequency Distribution in ExcelFrequency distribution in excel is a calculation of the rate of a change happening over time in the data. By categorizing data in sets and applying the array formula frequency function or in the data analysis tab, use the histogram tool to determine frequency distribution.read more
Содержание
- Функция МЕДИАНА
- Описание
- Синтаксис
- Замечания
- Пример
- Calculate the median of a group of numbers
- Example
- MEDIAN function
- Description
- Syntax
- Remarks
- Example
- Mean, median and mode in Excel
- How to calculate mean in Excel
- How to find median in Excel
- How to calculate mode in Excel
- Mean vs. median: which is better?
- MEDIAN Function
- Related functions
- Summary
- Purpose
- Return value
- Arguments
- Syntax
- Usage notes
- Examples
В этой статье описаны синтаксис формулы и использование функции МЕДИАНА в Microsoft Excel.
Описание
Возвращает медиану заданных чисел. Медиана — это число, которое является серединой множества чисел.
Синтаксис
Аргументы функции МЕДИАНА описаны ниже.
Число1, число2. Аргумент «число1» является обязательным, последующие числа необязательные. От 1 до 255 чисел, для которых требуется определить медиану.
Замечания
Если в наборе имеется ряду чисел, медиана вычисляет среднее значение двух чисел в середине. См. вторую формулу в примере.
Аргументы могут быть либо числами, либо содержащими числа именами, массивами или ссылками.
Учитываются логические значения и текстовые представления чисел, которые непосредственно введены в список аргументов.
Если аргумент, который является массивом или ссылкой, содержит текст, логические значения или пустые ячейки, то такие значения пропускаются; однако ячейки, которые содержат нулевые значения, учитываются.
Аргументы, которые являются значениями ошибки или текстами, не преобразуемыми в числа, приводят в возникновению ошибок.
Примечание: Функция МЕДИАНА измеряет центральную тенденцию, которая является центром множества чисел в статистическом распределении. Существует три наиболее распространенных способа определения центральной тенденции:
Среднее значение — это среднее арифметическое, которое вычисляется путем сложения набора чисел с последующим делением полученной суммы на их количество. Например, средним значением для чисел 2, 3, 3, 5, 7 и 10 будет 5, которое является результатом деления их суммы, равной 30, на их количество, равное 6.
Медиана — это число, которое является серединой множества чисел, то есть половина чисел имеют значения большие, чем медиана, а половина чисел имеют значения меньшие, чем медиана. Например, медианой для чисел 2, 3, 3, 5, 7 и 10 будет 4.
Мода — это число, наиболее часто встречающееся в данном наборе чисел. Например, модой для чисел 2, 3, 3, 5, 7 и 10 будет 3.
При симметричном распределении множества чисел все три значения центральной тенденции будут совпадать. При смещенном распределении множества чисел значения могут быть разными.
Пример
Скопируйте образец данных из следующей таблицы и вставьте их в ячейку A1 нового листа Excel. Чтобы отобразить результаты формул, выделите их и нажмите клавишу F2, а затем — клавишу ВВОД. При необходимости измените ширину столбцов, чтобы видеть все данные.
Источник
Let’s say you want to find out what the midpoint is in a distribution of student grades or a quality control data sample. To calculate the median of a group of numbers, use the MEDIAN function.
The MEDIAN function measures central tendency, which is the location of the center of a group of numbers in a statistical distribution. The three most common measures of central tendency are:
Average which is the arithmetic mean, and is calculated by adding a group of numbers and then dividing by the count of those numbers. For example, the average of 2, 3, 3, 5, 7, and 10 is 30 divided by 6, which is 5.
Median which is the middle number of a group of numbers; that is, half the numbers have values that are greater than the median, and half the numbers have values that are less than the median. For example, the median of 2, 3, 3, 5, 7, and 10 is 4.
Mode which is the most frequently occurring number in a group of numbers. For example, the mode of 2, 3, 3, 5, 7, and 10 is 3.
For a symmetrical distribution of a group of numbers, these three measures of central tendency are all the same. For a skewed distribution of a group of numbers, they can be different.
The screen shots in this article were taken in Excel 2016. If you have a different version your view might be slightly different, but unless otherwise noted, the functionality is the same.
Example
The example may be easier to understand if you copy it to a blank worksheet.
Open a blank workbook or worksheet.
How to copy an example
Select the example below.
Note: Do not select the row or column headers.
Источник
This article describes the formula syntax and usage of the MEDIAN function in Microsoft Excel.
Description
Returns the median of the given numbers. The median is the number in the middle of a set of numbers.
Syntax
The MEDIAN function syntax has the following arguments:
Number1, number2, . Number1 is required, subsequent numbers are optional. 1 to 255 numbers for which you want the median.
If there is an even number of numbers in the set, then MEDIAN calculates the average of the two numbers in the middle. See the second formula in the example.
Arguments can either be numbers or names, arrays, or references that contain numbers.
Logical values and text representations of numbers that you type directly into the list of arguments are counted.
If an array or reference argument contains text, logical values, or empty cells, those values are ignored; however, cells with the value zero are included.
Arguments that are error values or text that cannot be translated into numbers cause errors.
Note: The MEDIAN function measures central tendency, which is the location of the center of a group of numbers in a statistical distribution. The three most common measures of central tendency are:
Average which is the arithmetic mean, and is calculated by adding a group of numbers and then dividing by the count of those numbers. For example, the average of 2, 3, 3, 5, 7, and 10 is 30 divided by 6, which is 5.
Median which is the middle number of a group of numbers; that is, half the numbers have values that are greater than the median, and half the numbers have values that are less than the median. For example, the median of 2, 3, 3, 5, 7, and 10 is 4.
Mode which is the most frequently occurring number in a group of numbers. For example, the mode of 2, 3, 3, 5, 7, and 10 is 3.
For a symmetrical distribution of a group of numbers, these three measures of central tendency are all the same. For a skewed distribution of a group of numbers, they can be different.
Example
Copy the example data in the following table, and paste it in cell A1 of a new Excel worksheet. For formulas to show results, select them, press F2, and then press Enter. If you need to, you can adjust the column widths to see all the data.
Источник
 by Svetlana Cheusheva, updated on February 7, 2023
When analyzing numerical data, you may often be looking for some way to get the «typical» value. For this purpose, you can use the so-called measures of central tendency that represent a single value identifying the central position within a data set or, more technically, the middle or center in a statistical distribution. Sometimes, they are also classified as summary statistics.
The three main measures of central tendency are Mean, Median and Mode. They all are valid measures of central location, but each gives a different indication of a typical value, and under different circumstances some measures are more appropriate to use than others.
How to calculate mean in Excel
Arithmetic mean, also referred to as average, is probably the measure you are most familiar with. The mean is calculated by adding up a group of numbers and then dividing the sum by the count of those numbers.
For example, to calculate the mean of numbers <1, 2, 2, 3, 4, 6>, you add them up, and then divide the sum by 6, which yields 3: (1+2+2+3+4+6)/6=3.
In Microsoft Excel, the mean can be calculated by using one of the following functions:
- AVERAGE- returns an average of numbers.
- AVERAGEA — returns an average of cells with any data (numbers, Boolean and text values).
- AVERAGEIF — finds an average of numbers based on a single criterion.
- AVERAGEIFS — finds an average of numbers based on multiple criteria.
For the in-depth tutorials, please follow the above links. To get a conceptual idea of how these functions work, consider the following example.
In a sales report (please see the screenshot below), supposing you want to get the average of values in cells C2:C8. For this, use this simple formula:
To get the average of only «Banana» sales, use an AVERAGEIF formula:
=AVERAGEIF(A2:A8, «Banana», C2:C8)
To calculate the mean based on 2 conditions, say, the average of «Banana» sales with the status «Delivered», use AVERAGEIFS:
=AVERAGEIFS(C2:C8,A2:A8, «Banana», B2:B8, «Delivered»)
You can also enter your conditions in separate cells, and reference those cells in your formulas, like this: 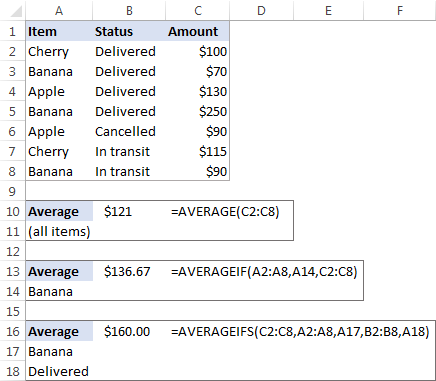
Median is the middle value in a group of numbers, which are arranged in ascending or descending order, i.e. half the numbers are greater than the median and half the numbers are less than the median. For example, the median of the data set <1, 2, 2, 3, 4, 6, 9>is 3. 
This works fine when there are an odd number of values in the group. But what if you have an even number of values? In this case, the median is the arithmetic mean (average) of the two middle values. For example, the median of <1, 2, 2, 3, 4, 6>is 2.5. To calculate it, you take the 3rd and 4th values in the data set and average them to get a median of 2.5. 
In Microsoft Excel, a median is calculated by using the MEDIAN function. For example, to get the median of all amounts in our sales report, use this formula:
To make the example more illustrative, I’ve sorted the numbers in column C in ascending order (though it is not actually required for the Excel Median formula to work): 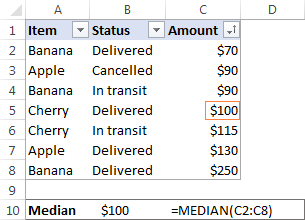
In contrast to average, Microsoft Excel does not provide any special function to calculate median with one or more conditions. However, you can «emulate» the functionality of MEDIANIF and MEDIANIFS by using a combination of two or more functions like shown in these examples:
How to calculate mode in Excel
Mode is the most frequently occurring value in the dataset. While the mean and median require some calculations, a mode value can be found simply by counting the number of times each value occurs.
For example, the mode of the set of values <1, 2, 2, 3, 4, 6>is 2. In Microsoft Excel, you can calculate a mode by using the function of the same name, the MODE function. For our sample data set, the formula goes as follows:
=MODE(C2:C8) 
In situations when there are two or more modes in your data set, the Excel MODE function will return the lowest mode.
Generally, there is no «best» measure of central tendency. Which measure to use mostly depends on the type of data you are working with as well as your understanding of the «typical value» you are attempting to estimate.
For a symmetrical distribution (in which values occur at regular frequencies), the mean, median and mode are the same. For a skewed distribution (where there are a small number of extremely high or low values), the three measures of central tendency may be different.
Since the mean is greatly affected by skewed data and outliers (non-typical values that are significantly different from the rest of the data), median is the preferred measure of central tendency for an asymmetrical distribution.
For instance, it is generally accepted that the median is better than the mean for calculating a typical salary. Why? The best way to understand this would be from an example. Please have a look at a few sample salaries for common jobs:
- Electrician — $20/hour
- Nurse — $26/hour
- Police officer — $47/hour
- Sales manager — $54/hour
- Manufacturing engineer — $63/hour
Now, let’s calculate the average (mean): add up the above numbers and divide by 5: (20+26+47+54+63)/5=42. So, the average wage is $42/hour. The median wage is $47/hour, and it is the police officer who earns it (1/2 wages are lower, and 1/2 are higher). Well, in this particular case the mean and median give similar numbers.
But let’s see what happens if we extend the list of wages by including a celebrity who earns, say, about $30 million/year, which is roughly $14,500/hour. Now, the average wage becomes $2,451.67/hour, a wage that no one earns! By contrast, the median is not significantly changed by this one outlier, it is $50.50/hour. 
Agree, the median gives a better idea of what people typically earn because it is not so strongly affected by abnormal salaries.
This is how you calculate mean, median and mode in Excel. I thank you for reading and hope to see you on our blog next week!
Источник

Summary
The Excel MEDIAN function returns the median (middle number) in the supplied set of data. For example, =MEDIAN(1,2,3,4,5) returns 3.
Purpose
Return value
Arguments
- number1 — A number or cell reference that refers to numeric values.
- number2 — [optional] A number or cell reference that refers to numeric values.
Syntax
Usage notes
The MEDIAN function returns the median (middle number) in a set of data. The calculation performed by MEDIAN varies according to the number of numeric values provided. When the number is odd, MEDIAN returns the middle number in the group. When the number is even, MEDIAN returns the average of the two numbers in the middle.
The MEDIAN function takes multiple arguments in the form number1, number2, number3, etc. Arguments can be a hardcoded constant, a cell reference, or a range, in any combination. MEDIAN ignores empty cells, text values, and the logical values TRUE and FALSE. The MEDIAN function will accept up to 255 separate arguments.
Examples
When the number of values provided is odd, MEDIAN returns the middle number:
When the number of values provided is even, MEDIAN returns the average of the two middle numbers:
In the worksheet shown above, the formulas in H5 and H6 are:
Note that MEDIAN ignores the empty cell in D5:D16 and returns the middle number in the eleven values provided.
Источник
MEDIAN function in Excel is used to analyze a range of numeric values and returns a number that is the midpoint of the set being examined. That is, this function conditionally divides the set of numbers into two subsets, the first of which contains numbers less than the median, and the second — more. This is one of several methods for determining the central trend of the range studied.
Examples of using the MEDIAN function in Excel
Example 1. In the study of age groups of students used data from a randomly selected group of students in the university. The task is to determine the average age of students.
Initial data:
The formula for calculating:
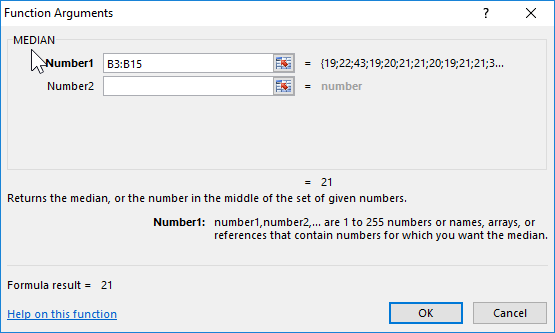
Argument Description:
- B3:B15 — the range of the investigated ages.
The result:
That is, there are students in the group whose age is less than 21 years and more than this value.
Comparison of MEDIAN and average functions to calculate the average
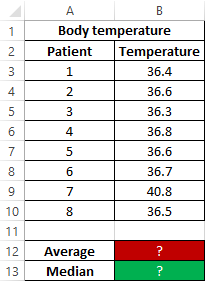
Example 2. During the evening tour in the hospital, each patient was measured body temperature. Demonstrate the feasibility of using the parameter median instead of the average value for the study of a number of values obtained.
Initial data:
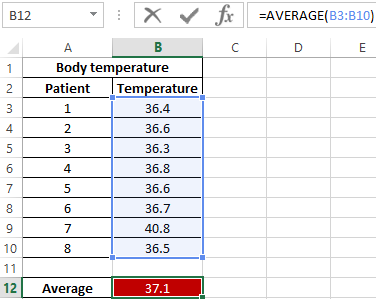
The formula for finding the average value:
The formula for finding the median value:
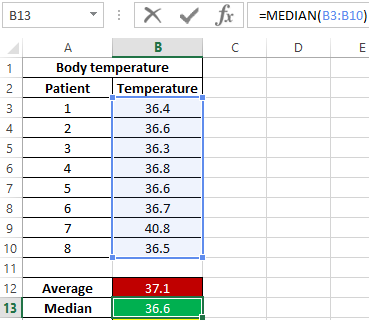
As can be seen from the average value, the average temperature in patients is above the norm, but this is not true. The median shows that at least half of the patients have a normal body temperature that does not exceed 36.6.
Attention! Another method for determining the central trend is fashion (the most common value in the range under study). To determine the central trend in Excel, use the MODE function. In this example, the values of the median and the mode are the same:
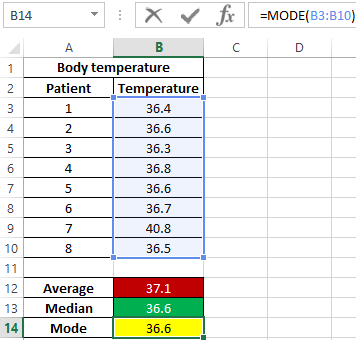
That is, the median value dividing one set into subsets of smaller and larger values is also the most frequently occurring value in the set. As can be seen, in most patients the temperature is 36.6.
Example of calculating the MEDIAN for statistical analysis in Excel
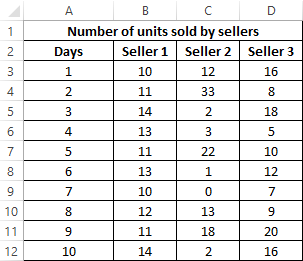
Example 3. The store has 3 sellers. According to the results of the last 10 days, it is necessary to determine the employee who will receive the award. When choosing the best employee, the degree of effectiveness of his work, and not the number of goods sold, is taken into account.
Source data table:
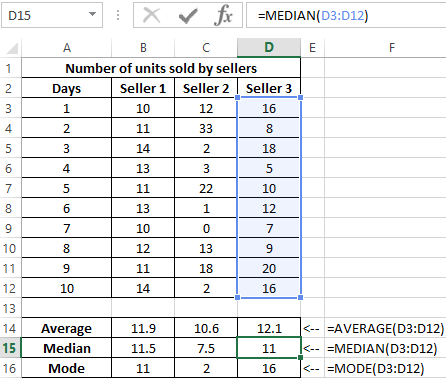
To characterize the efficiency, we will use three indicators at once: the average value, the median and the mode. We define them for each employee using the formula AVERAGE, MEDIAN and MODE, respectively:
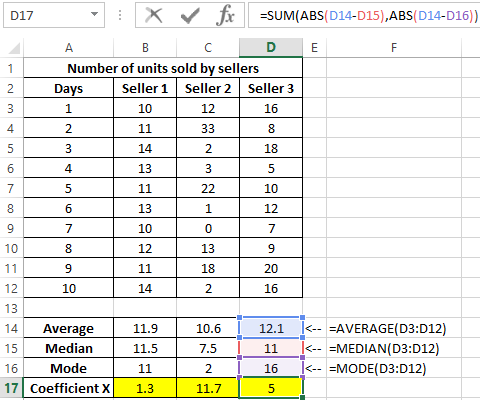
To determine the degree of scatter of data, we use a value that is the total value of the modulus of the difference between the mean and the mode, the mean and the median, respectively. That is, the coefficient x = | av-med | + | av-mod |, where:
- av is average;
- med is median;
- mod is a mode.
Calculate the value of the coefficient x for the first seller:
Similarly, we will carry out calculations for the remaining sellers. Results:
Determine the seller to whom the bonus will be issued:
Note: the SMALL function returns the first minimum value from the considered range of x values.
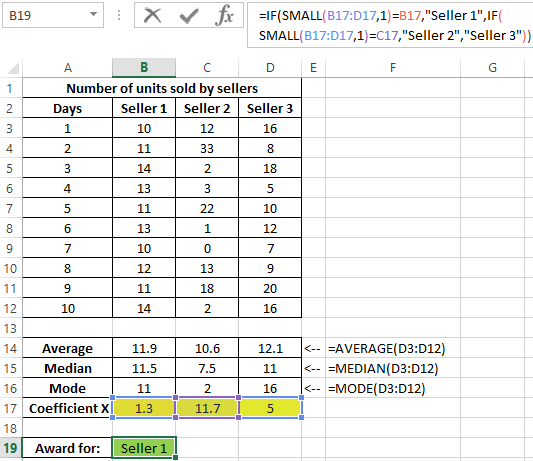
The coefficient x is a quantitative characteristic of the stability of the work of sellers, which was introduced by the economist of the store. With its help, it was possible to determine the range with the smallest deviations of values. This method demonstrates how three methods of determining the central tendency can be used at once to obtain the most reliable results.
Features of using the MEDIAN function in Excel
The function has the following syntax:
=MEDIAN(number1,[number2],…)
Argument Description:
- number1 is a required argument characterizing the first numerical value contained in the range under study;
- [num2] — optional second (and subsequent arguments, up to 255 arguments in total), characterizing the second and subsequent values of the studied range.
Notes 1:
- When calculating, it is more convenient to transfer the whole range of values under investigation instead of sequentially entering arguments.
- Arguments are data of a numeric type, names containing numbers, data of a reference type, and arrays (for example, =MEDIAN({1,2,3,5,7,10})).
- The calculation of the median takes into account cells containing empty values or logical TRUE, FALSE, which will be interpreted as numerical values 1 and 0, respectively. For example, the result of executing a function with logical values in arguments (TRUE,FALSE) is equivalent to the result of executing with arguments =MEDIAN(1,0) and is equal to 0.5.
- If one or more function arguments take text values that cannot be converted to numeric values, or contain error codes, the result of the function is the error code #VALUE!.
- Other Excel functions can be used to determine the median of the sample: PERCENTILE.INC, QUARTILE.INC, LARGE examples. Examples:
- =PERCENTILE.INC(A1:A10,0.5), since by definition the median is the 50th percentile.
- =QUARTILE.INC(A1:A10,2), since the median is the 2nd quartile.
- =LARGE(A1:A9,COUNT(A1:A9)/2), but only if the number of numbers in the range is an odd number.
Notes 2:
- If in the studied range all numbers are distributed symmetrically with respect to the average value, the arithmetic mean and median for this range will be equivalent.
- With large deviations of data in the range («spread» of values), the median better reflects the trend in the distribution of values than the arithmetic average. An excellent example is the use of a median to determine the real level of wages among the population of a state in which officials receive an order of magnitude more than ordinary citizens.
- The range of tested values may contain:
Download examples MEDIAN function in Excel
- Odd number of numbers. In this case, the median will be a single number dividing the range into two subsets of large and small values, respectively;
- Even number of numbers. Then is calculated as the arithmetic average for two numerical values dividing the set into the two subsets indicated above.