
In this guide, I will show you how to calculate the interquartile range (IQR) by using Microsoft Excel. I will also show you how to how to calculate the first and third quartiles for a dataset.
What is the IQR?
The IQR is the difference between the first (25th percentile) and third (75th percentile) quartiles. These are often abbreviated to Q1 and Q3 respectively.
The IQR is used to represent the middle (50%) spread of the data. When a dataset is sorted in order from the smallest to the largest values, it is possible to split the data into four parts (the quartiles).
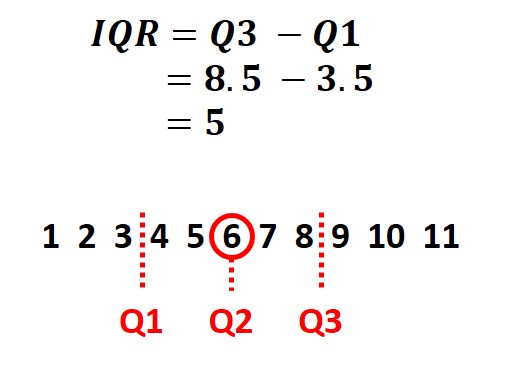
Consider the simple example below. In it, Q1 is 3.5 (half way between 3 and 4) and Q3 is 8.5 (half way between 8 and 9). Thus, the IQR is 5 (ie 8.5 – 3.5).
There is no direct formula to calculate the IQR in Excel, however, it is relatively straight forward to do. The easiest approach is to firstly calculate the Q1 and Q3 and then use these to determine the IQR.
Below is the steps recommended to calculate the IQR in Excel.
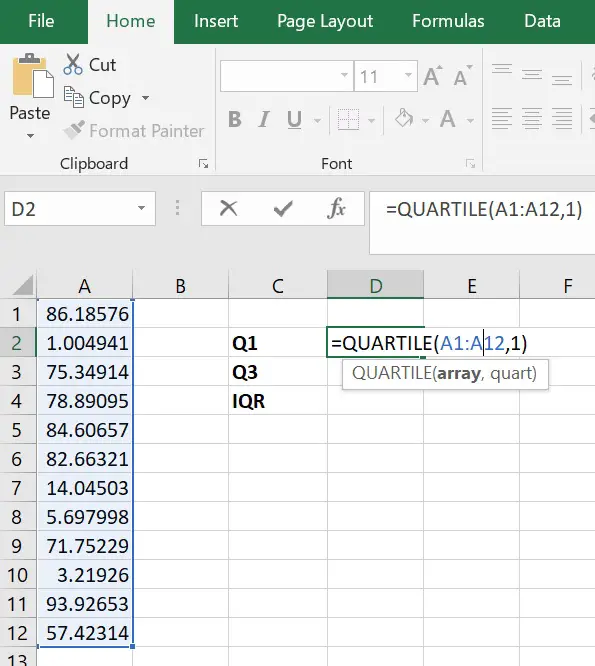
- To calculate the Q1 in Excel, click on an empty cell and type ‘=QUARTILE(array, 1)‘. Replace the ‘array‘ part with the data of interest. For this, simply click and drag on the cells containing all of the data. The ‘1‘ in the formula signifies Excel to return the Q1 of the data.
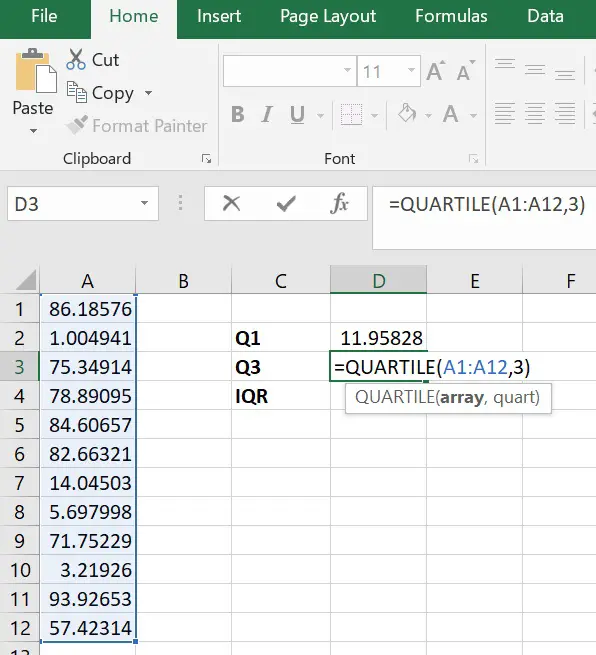
2. Next, we need to calculate Q3. To calculate Q3 in Excel, simply find an empty cell and enter the formula ‘=QUARTILE(array, 3)‘. Again, replacing the ‘array‘ part with the cells that contain the data of interest.
3. Finally, to calculate the IQR, simply subtract the Q1 value away from the Q3 value. In the example above, the formula used would be ‘=D3-D2‘.

Combine the approach to form one equation
The approach described above to calculate the IQR is rather long winded. If you are more confident with working with Excel and fomulas, you could combine everything into one simple formula.
For example, the formula below would create the IQR in Excel. Just remember to replace the ‘array‘ components with the desired cells containing the data.
=QUARTILE(array, 3) - QUARTILE(array, 1)
Conclusion
The IQR is a measure of the middle dispersion of a dataset, basically the difference between Q1 and Q3. To calculate the IQR in Microsoft Excel, use the =QUARTILE function to calculate Q1 and Q3, and ultimately find the difference between these two values.
Microsoft Excel version used: 365 ProPlus
The IQR is a measure of the middle dispersion of a dataset, basically the difference between Q1 and Q3. To calculate the IQR in Microsoft Excel, use the =QUARTILE function to calculate Q1 and Q3, and ultimately find the difference between these two values.
Contents
- 1 How do you find the IQR?
- 2 What is Q1 and Q3 in Excel?
- 3 What does IQR stand for in Excel?
- 4 How do you find Q3?
- 5 What is Iqr in math?
- 6 How do you find range on Excel?
- 7 What is range formula in Excel?
- 8 How do you find the mode on Excel?
- 9 How do you find Q1 Q2 and Q3?
- 10 How do you find Q1 and Q3 with even numbers?
- 11 How do you find the interquartile range with an even set of numbers?
- 12 Which method can be used to find the interquartile range for a set of data?
- 13 What is the value of Q3?
- 14 What is the quartile 3?
- 15 How do you find a range of numbers in Excel?
- 16 How do I use mult mode in Excel?
- 17 How do you find the modal number?
- 18 How do I find the 5 most common numbers in Excel?
- 19 Can Google Sheets calculate IQR?
- 20 What is the 1.5 IQR rule?
How do you find the IQR?
The interquartile range is the difference between the upper quartile and the lower quartile. In example 1, the IQR = Q3 – Q1 = 87 – 52 = 35. The IQR is a very useful measurement. It is useful because it is less influenced by extreme values as it limits the range to the middle 50% of the values.
What is Q1 and Q3 in Excel?
First Quartile, Q1: It is also known as the lower quartile where 25% of the scores fall below it. Median (middle value) or second quartile: It is basically the mid-value in the dataset. Third Quartile, Q3: It is also known as the Upper quartile in which 25% of the data is above it and the rest 75% falls below it.
What does IQR stand for in Excel?
The interquartile range, often denoted IQR, is a way to measure the spread of the middle 50% of a dataset. It is calculated as the difference between the first quartile* (Q1) and the third quartile (Q3) of a dataset.
How do you find Q3?
Q1 is the median (the middle) of the lower half of the data, and Q3 is the median (the middle) of the upper half of the data. (3, 5, 7, 8, 9), | (11, 15, 16, 20, 21).
What is Iqr in math?
The “Interquartile Range” is the difference between smallest value and the largest value of the middle 50% of a set of data.
How do you find range on Excel?
Calculating Range in One Step
Imagine you have data running from cell A2 to cell A20. Type “=MAX(A2:A20)-MIN(A2:A20)” to find the range in a single step. This tells Excel to find the maximum of the data and then subtract the minimum of the data from it.
What is range formula in Excel?
A formula range is usually a reference to a range of cells, within which a formula persists consistently throughout the full range.A formula range, like a cell range, is defined by the reference of the upper left cell of the range and the reference of the lower right cell of the range.
How do you find the mode on Excel?
Use a function to find the mode in Microsoft Excel
- Step 1: Type your data into one column.
- Step 2: Click a blank cell anywhere on the worksheet and then type “=MODE.
- Step 3: Change the range in Step 2 to reflect your actual data.
- Step 4: Press “Enter.” Excel will return the solution in the cell with the formula.
How do you find Q1 Q2 and Q3?
There are four different formulas to find quartiles:
- Formula for Lower quartile (Q1) = N + 1 multiplied by (1) divided by (4)
- Formula for Middle quartile (Q2) = N + 1 multiplied by (2) divided by (4)
- Formula for Upper quartile (Q3) = N + 1 multiplied by (3) divided by (4)
How do you find Q1 and Q3 with even numbers?
Since there are an even number of data points in the first half of the data set, the middle value is the average of the two middle values; that is, Q1 = (3 + 4)/2 or Q1 = 3.5. Q3 is the middle value in the second half of the data set.
How do you find the interquartile range with an even set of numbers?
How To Find Interquartile Range for an Even Set of Numbers
- Order the numbers from least to greatest.
- Make a mark in the center of the data:
- Place the parentheses around the numbers before and after the median.
- Find the median.
- Subtract Q1 from Q3 to find the interquartile range.
Which method can be used to find the interquartile range for a set of data?
To find the interquartile range (IQR), first find the median (middle value) of the lower and upper half of the data. These values are quartile 1 (Q1) and quartile 3 (Q3). The IQR is the difference between Q3 and Q1.
What is the value of Q3?
The upper quartile, or third quartile (Q3), is the value under which 75% of data points are found when arranged in increasing order. The median is considered the second quartile (Q2). The interquartile range is the difference between upper and lower quartiles.
What is the quartile 3?
The upper or third quartile, denoted as Q3, is the central point that lies between the median and the highest number of the distribution.
How do you find a range of numbers in Excel?
Enter formula =IF(COUNTIF(A1:E8,”new”),”Yes”,”No“) into the Formula Bar, and then press the Enter key. Notes: 1. In the formula, A1:E8 is the range you want to find certain number or value inside.
How do I use mult mode in Excel?
How to use the MODE. MULT Function in Excel?
- Select a vertical range of cells.
- Enter the MODE. MULT function.
- Confirm with Ctrl + Shift + Enter.
- In each selected cell, MODE. MULTI will return a mode value if one exists.
How do you find the modal number?
The mode is the number that appears the most.
- To find the mode, order the numbers lowest to highest and see which number appears the most often.
- Eg 3, 3, 6, 13, 100 = 3.
- The mode is 3.
How do I find the 5 most common numbers in Excel?
If you just want to find most common number in a list, you can use a simple formula. Select a blank cell, here is C1, type this formula =MODE(A1:A13), and then press Enter key to get the most common number in the list.
Can Google Sheets calculate IQR?
Find IQR Using Percentile Function in Sheets
Since we can find the Q1 and Q3 using the Percentile function, we can use this function also for finding IQR in Google Sheets. Replace the Quartile formulas in cell C2 and D2 with the following Percentile formulas. You can keep the same formula in cell E2, i.e., =D2-C2 .
What is the 1.5 IQR rule?
A commonly used rule says that a data point is an outlier if it is more than 1.5 ⋅ IQR 1.5cdot text{IQR} 1. 5⋅IQR1, point, 5, dot, start text, I, Q, R, end text above the third quartile or below the first quartile.
Для вычисления квартилей в MS EXCEL существует специальная функция
КВАРТИЛЬ()
. В этой статье дадим определение квартилей и научимся их вычислять для выборки и для непрерывного распределения. Также вычислим интерквартильный интервал.
Квартили
(Quartiles) — значения, которые делят
выборку
(набор значений) на четыре части, содержащие приблизительно равное количество наблюдений (по 25%).
Поясним определение
квартиля
на примере. Пусть имеется
выборка
, состоящая из 50 значений в ячейках
А7:А56
(см.
файл примера
, лист Квартиль-выборка). Для наглядности
отсортируем значения по возрастанию
и построим
гистограмму
.
Чтобы разделить
выборку
на 4 части достаточно 3-х
квартилей
.
Первый
квартиль
(или
нижний квартиль
, Q1) делит
выборку
, на 2 части: примерно 25% значений в
выборке
меньше Q1, остальные 75% — больше. Для вычисления
1-го квартиля
используйте формулу
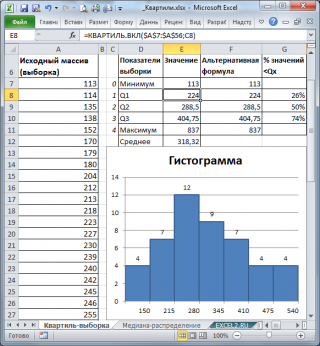
=КВАРТИЛЬ.ВКЛ(A7:A56;1)
. Для нашей выборки формула вернет значение 224. Значения 224 нет в
выборке
, формула произвела интерполяцию на основе 2-х соседних значений 223 и 227.
Примечание
: Функция
КВАРТИЛЬ.ВКЛ()
появилась в MS EXCEL 2010. В более ранних версиях использовалась аналогичная ей функция
КВАРТИЛЬ()
.
Чтобы убедиться, что примерно 25% значений меньше, чем 224, используем формулу
=СЧЁТЕСЛИ(A7:A56;»<«&224)/СЧЁТ(A7:A56)
. В результате получим, что 26% меньше, чем 1-й
квартиль
.
Чем в
выборке
больше значений и меньше
повторов
, тем точнее деление
выборки квартилями
на четверти.
Примечание
: Первый квартиль — это то же самое, что и 25-я
процентиль
. Подробнее см.
статью про процентили
.
Второй
квартиль
(или
медиана
, Q2) также делит
выборку
, на 2 равные части: половина чисел множества больше, чем
медиана
, а половина чисел меньше, чем
медиана
. Для вычисления 2-го
квартиля
используйте формулу
=КВАРТИЛЬ.ВКЛ(A7:A56;2)
или
=МЕДИАНА(A7:A56)
Третий
квартиль
(или верхний
квартиль
, Q3) делит
выборку
, на 2 части: примерно 75% значений в
выборке
меньше Q3, остальные 25% — больше. Для вычисления 3-го
квартиля
используйте формулу
=КВАРТИЛЬ.ВКЛ(A7:A56;3)
или
=ПРОЦЕНТИЛЬ.ВКЛ(A7:A56;0,75)
Примечание
: Третий
квартиль
— это то же самое, что и 75-я
процентиль
.
Второй аргумент функции
КВАРТИЛЬ.ВКЛ()
может также принимать значения 0 и 4. В первом случае функция вернет
минимальное значение
, во втором –
максимальное
.
Интерквартильный размах
Интерквартильным размахом
или
интерквартильным интервалом
(InterQuartile range, IQR) называется разность между третьим и первым
квартилями
(Q3 — Q1).
Интерквартильный размах
является характеристикой разброса значений в
выборке
.
Примечание
: Характеристикой разброса значений в
выборке
является также
дисперсия и стандартное отклонение
.
Интерквартильный размах
, а также
квартили
используются при построении
Блочной диаграммы
, которая полезна для оценки разброса значений (variation) в небольших
выборках
или для сравнения нескольких
выборок
имеющих сходные распределения.
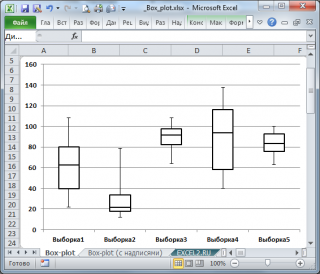
Подробнее о построении
Блочной диаграммы
см. статью
Блочная диаграмма в MS EXCEL
.
Квартили непрерывного распределения
Если
функция распределения
F
(х)
случайной величины
х
непрерывна, то 1-й
квартиль
является решением уравнения
F(х)
=0,25, второй —
F(х)
=0,5, а третий
F(х)
=0,75.
Примечание
: Подробнее о
Функции распределения
см. статью
Функция распределения и плотность вероятности в MS EXCEL
.
Если известна
функция плотности вероятности
p
(х)
, то 1-й
квартиль
можно найти из уравнения:
![]()
Например, решив аналитическим способом это уравнение для
Логнормального распределения
lnN(μ; σ
2
), получим, что
медиана
(2-й
квартиль
) вычисляется по формуле e
μ
или в MS EXCEL =EXP(μ). При μ=1,
медиана
равна 2,718.

Обратите внимание на точку
Функции распределения
, для которой
F(х)=0,5
(см. картинку выше или
файл примера
, лист Квартиль-распределение)
.
Абсцисса этой точки равна 2,718. Это и есть значение 2-го
квартиля
(
медианы
), что естественно совпадает с ранее вычисленным значением по формуле e
μ
.
Примечание
: Напомним, что интеграл от
функции плотности вероятности
по всей области задания случайной величины равен единице:
![]()
Поэтому, линии
квартилей
(
х=квартиль
) делят площадь под графиком
функции плотности вероятности
на 4 равные части.
Квартили в MS EXCEL
Чтобы вычислить в MS EXCEL
квартили
заданного распределения необходимо использовать соответствующую
обратную функцию распределения
.
При вычислении
квартилей
в MS EXCEL используются
обратные функции распределения
:
НОРМ.СТ.ОБР()
,
ЛОГНОРМ.ОБР()
,
ХИ2.ОБР()
,
ГАММА.ОБР()
и т.д. Подробнее о распределениях, представленных в MS EXCEL, можно прочитать в статье
Распределения случайной величины в MS EXCEL
.
Например, в MS EXCEL 1-й
квартиль
для
логнормального распределения
LnN(1;1) можно вычислить по формуле
=ЛОГНОРМ.ОБР(0,25;1;1)
, а 3-й
квартиль
для
стандартного нормального распределения
по формуле
=НОРМ.СТ.ОБР(0,75)
.
This tutorial explains how to calculate the interquartile range of a dataset in Excel.
The interquartile range, often denoted IQR, is a way to measure the spread of the middle 50% of a dataset. It is calculated as the difference between the first quartile* (Q1) and the third quartile (Q3) of a dataset.
*Quartiles are simply values that split up a dataset into four equal parts.
For example, suppose we have the following dataset:
[58, 66, 71, 73, 74, 77, 78, 82, 84, 85, 88, 88, 88, 90, 90, 92, 92, 94, 96, 98]
The third quartile turns out to be 91 and the first quartile is 75.5. Thus, the interquartile range (IQR) for this dataset is 91 – 75.5 = 15. This tells us how spread out the middle 50% of the values are in this dataset.
How to Calculate the Interquartile Range in Excel
Microsoft Excel doesn’t have a built-in function to calculate the IQR of a dataset, but we can easily find it by using the QUARTILE() function, which takes the following arguments:
QUARTILE(array, quart)
- array: the array of data you’re interested in.
- quart: the quartile you would like to calculate.
Example: Finding IQR in Excel
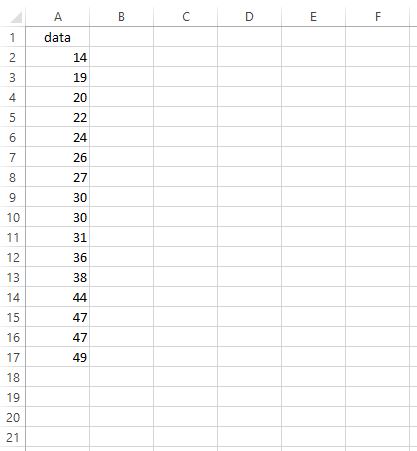
Suppose we would like to find the IQR for the following dataset:

To find the IQR, we can perform the following steps:
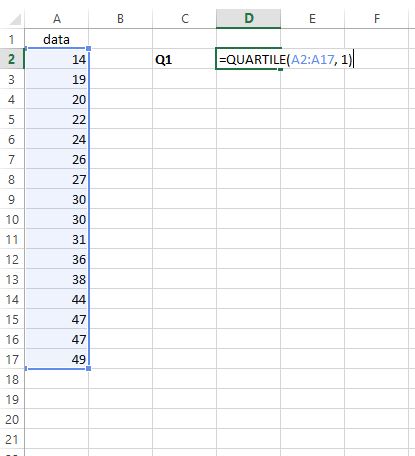
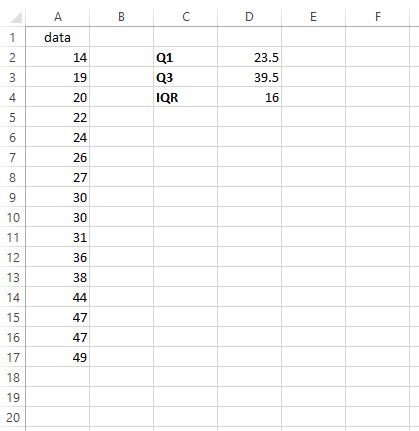
Step 1: Find Q1.
To find the first quartile, we simply type =QUARTILE(A2:A17, 1) into any cell we choose:

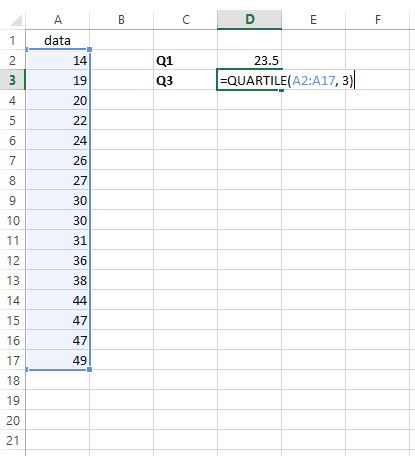
Step 2: Find Q3.
To find the third quartile, we type =QUARTILE(A2:A17, 3) into any cell we choose:

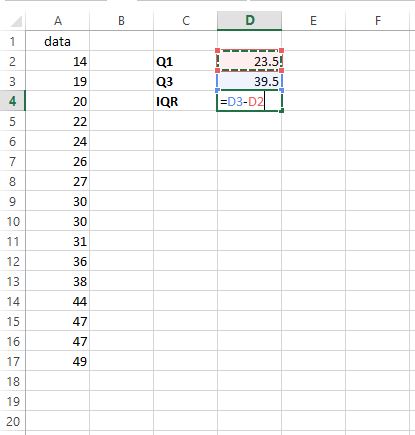
Step 3: Find IQR.
To find the interquartile range (IQR), we simply subtract Q1 from Q3:

The IQR turns out to be 39.5 – 23.5 = 16. This tells us how spread out the middle 50% of the values are in this particular dataset.

A Shorter Approach
Note that we could also have found the interquartile range of the dataset in the previous example by using one formula:
=QUARTILE(A2:A17, 3) – QUARTILE(A2:A17, 1)
This would also result in the value 16.
Conclusion
The interquartile range only represents one way of measuring the “spread” of a dataset. Some other ways to measure spread are the range, the standard deviation, and the variance.
The nice part about using the IQR to measure spread is that it’s resistant to outliers. Since it only tells us the spread of the middle 50% of the dataset, it isn’t affect by unusually small or unusually large outliers.
This makes it a preferable way to measure dispersion compared to a metric like the range, which simply tells us the difference between the largest and the smallest values in a dataset.
Related: How to Calculate the Midrange in Excel
Содержание
- Квартили и интерквартильный интервал (IQR) в EXCEL
- Интерквартильный размах
- Квартили непрерывного распределения
- Квартили в MS EXCEL
- Как рассчитать межквартильный диапазон (IQR) в Excel
- Что такое межквартильный диапазон?
- Как рассчитать межквартильный диапазон в Excel
- Пример: поиск IQR в Excel
- Более короткий подход
- Вывод
- How To Find Iqr In Excel?
- How do you find the IQR?
- What is Q1 and Q3 in Excel?
- What does IQR stand for in Excel?
- How do you find Q3?
- What is Iqr in math?
- How do you find range on Excel?
- What is range formula in Excel?
- How do you find the mode on Excel?
- How do you find Q1 Q2 and Q3?
- How do you find Q1 and Q3 with even numbers?
- How do you find the interquartile range with an even set of numbers?
- Which method can be used to find the interquartile range for a set of data?
- What is the value of Q3?
- What is the quartile 3?
- How do you find a range of numbers in Excel?
- How do I use mult mode in Excel?
- How do you find the modal number?
- How do I find the 5 most common numbers in Excel?
- Can Google Sheets calculate IQR?
- What is the 1.5 IQR rule?
Квартили и интерквартильный интервал (IQR) в EXCEL
history 20 ноября 2016 г.
Для вычисления квартилей в MS EXCEL существует специальная функция КВАРТИЛЬ() . В этой статье дадим определение квартилей и научимся их вычислять для выборки и для непрерывного распределения. Также вычислим интерквартильный интервал.
Квартили (Quartiles) — значения, которые делят выборку (набор значений) на четыре части, содержащие приблизительно равное количество наблюдений (по 25%).
Поясним определение квартиля на примере. Пусть имеется выборка , состоящая из 50 значений в ячейках А7:А56 (см. файл примера , лист Квартиль-выборка). Для наглядности отсортируем значения по возрастанию и построим гистограмму . 
Чтобы разделить выборку на 4 части достаточно 3-х квартилей .
Первый квартиль (или нижний квартиль , Q1) делит выборку , на 2 части: примерно 25% значений в выборке меньше Q1, остальные 75% — больше. Для вычисления 1-го квартиля используйте формулу =КВАРТИЛЬ.ВКЛ(A7:A56;1) . Для нашей выборки формула вернет значение 224. Значения 224 нет в выборке , формула произвела интерполяцию на основе 2-х соседних значений 223 и 227.
Примечание : Функция КВАРТИЛЬ.ВКЛ() появилась в MS EXCEL 2010. В более ранних версиях использовалась аналогичная ей функция КВАРТИЛЬ() .
Чтобы убедиться, что примерно 25% значений меньше, чем 224, используем формулу =СЧЁТЕСЛИ(A7:A56;» . В результате получим, что 26% меньше, чем 1-й квартиль .
Чем в выборке больше значений и меньше повторов , тем точнее деление выборки квартилями на четверти.
Примечание : Первый квартиль — это то же самое, что и 25-я процентиль . Подробнее см. статью про процентили .
Второй квартиль (или медиана , Q2) также делит выборку , на 2 равные части: половина чисел множества больше, чем медиана , а половина чисел меньше, чем медиана . Для вычисления 2-го квартиля используйте формулу =КВАРТИЛЬ.ВКЛ(A7:A56;2) или =МЕДИАНА(A7:A56)
Третий квартиль (или верхний квартиль , Q3) делит выборку , на 2 части: примерно 75% значений в выборке меньше Q3, остальные 25% — больше. Для вычисления 3-го квартиля используйте формулу =КВАРТИЛЬ.ВКЛ(A7:A56;3) или =ПРОЦЕНТИЛЬ.ВКЛ(A7:A56;0,75)
Примечание : Третий квартиль — это то же самое, что и 75-я процентиль .
Второй аргумент функции КВАРТИЛЬ.ВКЛ() может также принимать значения 0 и 4. В первом случае функция вернет минимальное значение , во втором – максимальное .
Интерквартильный размах
Интерквартильным размахом или интерквартильным интервалом (InterQuartile range, IQR) называется разность между третьим и первым квартилями (Q3 — Q1). Интерквартильный размах является характеристикой разброса значений в выборке .
Примечание : Характеристикой разброса значений в выборке является также дисперсия и стандартное отклонение .
Интерквартильный размах , а также квартили используются при построении Блочной диаграммы , которая полезна для оценки разброса значений (variation) в небольших выборках или для сравнения нескольких выборок имеющих сходные распределения. 
Подробнее о построении Блочной диаграммы см. статью Блочная диаграмма в MS EXCEL .
Квартили непрерывного распределения
Если функция распределения F (х) случайной величины х непрерывна, то 1-й квартиль является решением уравнения F(х) =0,25, второй — F(х) =0,5, а третий F(х) =0,75.
Если известна функция плотности вероятности p (х) , то 1-й квартиль можно найти из уравнения: 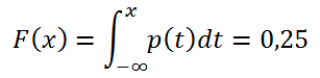
Например, решив аналитическим способом это уравнение для Логнормального распределения lnN(μ; σ 2 ), получим, что медиана (2-й квартиль ) вычисляется по формуле e μ или в MS EXCEL =EXP(μ). При μ=1, медиана равна 2,718. 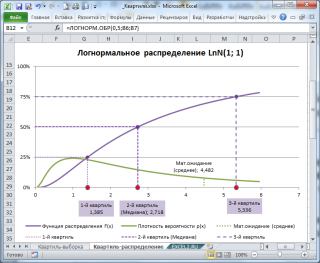
Обратите внимание на точку Функции распределения , для которой F(х)=0,5 (см. картинку выше или файл примера , лист Квартиль-распределение) . Абсцисса этой точки равна 2,718. Это и есть значение 2-го квартиля ( медианы ), что естественно совпадает с ранее вычисленным значением по формуле e μ .
Примечание : Напомним, что интеграл от функции плотности вероятности по всей области задания случайной величины равен единице: 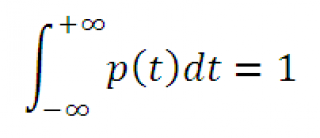
Поэтому, линии квартилей ( х=квартиль ) делят площадь под графиком функции плотности вероятности на 4 равные части.
Квартили в MS EXCEL
Чтобы вычислить в MS EXCEL квартили заданного распределения необходимо использовать соответствующую обратную функцию распределения .
При вычислении квартилей в MS EXCEL используются обратные функции распределения : НОРМ.СТ.ОБР() , ЛОГНОРМ.ОБР() , ХИ2.ОБР() , ГАММА.ОБР() и т.д. Подробнее о распределениях, представленных в MS EXCEL, можно прочитать в статье Распределения случайной величины в MS EXCEL .
Например, в MS EXCEL 1-й квартиль для логнормального распределения LnN(1;1) можно вычислить по формуле =ЛОГНОРМ.ОБР(0,25;1;1) , а 3-й квартиль для стандартного нормального распределения по формуле =НОРМ.СТ.ОБР(0,75) .
Источник
Как рассчитать межквартильный диапазон (IQR) в Excel
В этом руководстве объясняется, как рассчитать межквартильный диапазон набора данных в Excel.
Что такое межквартильный диапазон?
Межквартильный диапазон , часто обозначаемый IQR, — это способ измерения разброса средних 50% набора данных. Он рассчитывается как разница между первым квартилем* (Q1) и третьим квартилем (Q3) набора данных.
*Квартили — это просто значения, которые делят набор данных на четыре равные части.
Например, предположим, что у нас есть следующий набор данных:
[58, 66, 71, 73, 74, 77, 78, 82, 84, 85, 88, 88, 88, 90, 90, 92, 92, 94, 96, 98]
Третий квартиль оказывается равным 91 , а первый квартиль равен 75,5.Таким образом, межквартильный размах (IQR) для этого набора данных составляет 91 – 75,5 = 15.Это говорит нам о том, насколько распределены средние 50% значений в этом наборе данных.
Как рассчитать межквартильный диапазон в Excel
В Microsoft Excel нет встроенной функции для расчета IQR набора данных, но мы можем легко найти ее с помощью функции КВАРТИЛЬ() , которая принимает следующие аргументы:
- массив: массив данных, которые вас интересуют.
- квартиль : квартиль, который вы хотите рассчитать.
Пример: поиск IQR в Excel
Предположим, мы хотим найти IQR для следующего набора данных:

Чтобы найти IQR, мы можем выполнить следующие шаги:
Шаг 1: Найдите Q1 .
Чтобы найти первый квартиль, мы просто вводим =КВАРТИЛЬ(A2:A17, 1) в любую выбранную ячейку:
Шаг 2: Найдите Q3 .
Чтобы найти третий квартиль, мы вводим =КВАРТИЛЬ(A2:A17, 3) в любую выбранную ячейку:
Шаг 3: Найдите IQR .
Чтобы найти межквартильный размах (IQR), мы просто вычитаем Q1 из Q3:
IQR оказывается равным 39,5 – 23,5 = 16.Это говорит нам о том, насколько распределены средние 50% значений в этом конкретном наборе данных.
Более короткий подход
Обратите внимание, что мы могли бы также найти межквартильный диапазон набора данных в предыдущем примере, используя одну формулу:
=КВАРТИЛЬ(A2:A17, 3) – КВАРТИЛЬ(A2:A17, 1)
Это также приведет к значению 16 .
Вывод
Межквартильный диапазон представляет собой только один из способов измерения «разброса» набора данных. Другими способами измерения разброса являются диапазон, стандартное отклонение и дисперсия .
Преимущество использования IQR для измерения спреда заключается в том, что он устойчив к выбросам.Поскольку он сообщает нам только разброс средних 50% набора данных, на него не влияют необычно маленькие или необычно большие выбросы.
Это делает его более предпочтительным способом измерения дисперсии по сравнению с таким показателем, как диапазон, который просто сообщает нам разницу между наибольшим и наименьшим значениями в наборе данных.
Источник
How To Find Iqr In Excel?
The IQR is a measure of the middle dispersion of a dataset, basically the difference between Q1 and Q3. To calculate the IQR in Microsoft Excel, use the =QUARTILE function to calculate Q1 and Q3, and ultimately find the difference between these two values.
How do you find the IQR?
The interquartile range is the difference between the upper quartile and the lower quartile. In example 1, the IQR = Q3 – Q1 = 87 – 52 = 35. The IQR is a very useful measurement. It is useful because it is less influenced by extreme values as it limits the range to the middle 50% of the values.
What is Q1 and Q3 in Excel?
First Quartile, Q1: It is also known as the lower quartile where 25% of the scores fall below it. Median (middle value) or second quartile: It is basically the mid-value in the dataset. Third Quartile, Q3: It is also known as the Upper quartile in which 25% of the data is above it and the rest 75% falls below it.
What does IQR stand for in Excel?
The interquartile range, often denoted IQR, is a way to measure the spread of the middle 50% of a dataset. It is calculated as the difference between the first quartile* (Q1) and the third quartile (Q3) of a dataset.
How do you find Q3?
Q1 is the median (the middle) of the lower half of the data, and Q3 is the median (the middle) of the upper half of the data. (3, 5, 7, 8, 9), | (11, 15, 16, 20, 21).
What is Iqr in math?
The “Interquartile Range” is the difference between smallest value and the largest value of the middle 50% of a set of data.
How do you find range on Excel?
Calculating Range in One Step
Imagine you have data running from cell A2 to cell A20. Type “=MAX(A2:A20)-MIN(A2:A20)” to find the range in a single step. This tells Excel to find the maximum of the data and then subtract the minimum of the data from it.
What is range formula in Excel?
A formula range is usually a reference to a range of cells, within which a formula persists consistently throughout the full range.A formula range, like a cell range, is defined by the reference of the upper left cell of the range and the reference of the lower right cell of the range.
How do you find the mode on Excel?
Use a function to find the mode in Microsoft Excel
- Step 1: Type your data into one column.
- Step 2: Click a blank cell anywhere on the worksheet and then type “=MODE.
- Step 3: Change the range in Step 2 to reflect your actual data.
- Step 4: Press “Enter.” Excel will return the solution in the cell with the formula.
How do you find Q1 Q2 and Q3?
There are four different formulas to find quartiles:
- Formula for Lower quartile (Q1) = N + 1 multiplied by (1) divided by (4)
- Formula for Middle quartile (Q2) = N + 1 multiplied by (2) divided by (4)
- Formula for Upper quartile (Q3) = N + 1 multiplied by (3) divided by (4)
How do you find Q1 and Q3 with even numbers?
Since there are an even number of data points in the first half of the data set, the middle value is the average of the two middle values; that is, Q1 = (3 + 4)/2 or Q1 = 3.5. Q3 is the middle value in the second half of the data set.
How do you find the interquartile range with an even set of numbers?
How To Find Interquartile Range for an Even Set of Numbers
- Order the numbers from least to greatest.
- Make a mark in the center of the data:
- Place the parentheses around the numbers before and after the median.
- Find the median.
- Subtract Q1 from Q3 to find the interquartile range.
Which method can be used to find the interquartile range for a set of data?
To find the interquartile range (IQR), first find the median (middle value) of the lower and upper half of the data. These values are quartile 1 (Q1) and quartile 3 (Q3). The IQR is the difference between Q3 and Q1.
What is the value of Q3?
The upper quartile, or third quartile (Q3), is the value under which 75% of data points are found when arranged in increasing order. The median is considered the second quartile (Q2). The interquartile range is the difference between upper and lower quartiles.
What is the quartile 3?
The upper or third quartile, denoted as Q3, is the central point that lies between the median and the highest number of the distribution.
How do you find a range of numbers in Excel?
Enter formula =IF(COUNTIF(A1:E8,”new”),”Yes”,”No“) into the Formula Bar, and then press the Enter key. Notes: 1. In the formula, A1:E8 is the range you want to find certain number or value inside.
How do I use mult mode in Excel?
How to use the MODE. MULT Function in Excel?
- Select a vertical range of cells.
- Enter the MODE. MULT function.
- Confirm with Ctrl + Shift + Enter.
- In each selected cell, MODE. MULTI will return a mode value if one exists.
How do you find the modal number?
The mode is the number that appears the most.
- To find the mode, order the numbers lowest to highest and see which number appears the most often.
- Eg 3, 3, 6, 13, 100 = 3.
- The mode is 3.
How do I find the 5 most common numbers in Excel?
If you just want to find most common number in a list, you can use a simple formula. Select a blank cell, here is C1, type this formula =MODE(A1:A13), and then press Enter key to get the most common number in the list.
Can Google Sheets calculate IQR?
Find IQR Using Percentile Function in Sheets
Since we can find the Q1 and Q3 using the Percentile function, we can use this function also for finding IQR in Google Sheets. Replace the Quartile formulas in cell C2 and D2 with the following Percentile formulas. You can keep the same formula in cell E2, i.e., =D2-C2 .
What is the 1.5 IQR rule?
A commonly used rule says that a data point is an outlier if it is more than 1.5 ⋅ IQR 1.5cdot text 1. 5⋅IQR1, point, 5, dot, start text, I, Q, R, end text above the third quartile or below the first quartile.
Источник
17 авг. 2022 г.
читать 2 мин
В этом руководстве объясняется, как рассчитать межквартильный диапазон набора данных в Excel.
Что такое межквартильный диапазон?
Межквартильный диапазон , часто обозначаемый IQR, — это способ измерения разброса средних 50% набора данных. Он рассчитывается как разница между первым квартилем* (Q1) и третьим квартилем (Q3) набора данных.
*Квартили — это просто значения, которые делят набор данных на четыре равные части.
Например, предположим, что у нас есть следующий набор данных:
[58, 66, 71, 73, 74, 77, 78, 82, 84, 85, 88, 88, 88, 90, 90, 92, 92, 94, 96, 98]
Третий квартиль оказывается равным 91 , а первый квартиль равен 75,5.Таким образом, межквартильный размах (IQR) для этого набора данных составляет 91 – 75,5 = 15.Это говорит нам о том, насколько распределены средние 50% значений в этом наборе данных.
Как рассчитать межквартильный диапазон в Excel
В Microsoft Excel нет встроенной функции для расчета IQR набора данных, но мы можем легко найти ее с помощью функции КВАРТИЛЬ() , которая принимает следующие аргументы:
КВАРТИЛЬ(массив, кварта)
- массив: массив данных, которые вас интересуют.
- квартиль : квартиль, который вы хотите рассчитать.
Пример: поиск IQR в Excel
Предположим, мы хотим найти IQR для следующего набора данных:
Чтобы найти IQR, мы можем выполнить следующие шаги:
Шаг 1: Найдите Q1 .
Чтобы найти первый квартиль, мы просто вводим =КВАРТИЛЬ(A2:A17, 1) в любую выбранную ячейку:
Шаг 2: Найдите Q3 .
Чтобы найти третий квартиль, мы вводим =КВАРТИЛЬ(A2:A17, 3) в любую выбранную ячейку:
Шаг 3: Найдите IQR .
Чтобы найти межквартильный размах (IQR), мы просто вычитаем Q1 из Q3:
IQR оказывается равным 39,5 – 23,5 = 16.Это говорит нам о том, насколько распределены средние 50% значений в этом конкретном наборе данных.
Более короткий подход
Обратите внимание, что мы могли бы также найти межквартильный диапазон набора данных в предыдущем примере, используя одну формулу:
=КВАРТИЛЬ(A2:A17, 3) – КВАРТИЛЬ(A2:A17, 1)
Это также приведет к значению 16 .
Вывод
Межквартильный диапазон представляет собой только один из способов измерения «разброса» набора данных. Другими способами измерения разброса являются диапазон, стандартное отклонение и дисперсия .
Преимущество использования IQR для измерения спреда заключается в том, что он устойчив к выбросам.Поскольку он сообщает нам только разброс средних 50% набора данных, на него не влияют необычно маленькие или необычно большие выбросы.
Это делает его более предпочтительным способом измерения дисперсии по сравнению с таким показателем, как диапазон, который просто сообщает нам разницу между наибольшим и наименьшим значениями в наборе данных.
Связанный: Как рассчитать средний диапазон в Excel
Stats students must know about the term Interquartile Range which helps in recognizing the natural flow that appears in a dataset. In Excel, you will not find any direct way to analyze the IQR, however, you still need an answer to how to calculate IQR in Excel.
What is the IQR?
Before getting started let’s understand what this IQR term means in reality. When you tend to find the difference between the first and third quartiles it usually gives IQR value. moreover, the IQR shows 50% of the data. You can simply sort data in four sections when you need a dataset to be sorted from the smallest to the largest values. Below is a simple example you can consider:
Q1 is 3.5 and Q3 is 8.5
The IQR would be 5:

How to Calculate IQR in Excel with Quartile Function?
With the help of the Quartile function, you can easily find out the Interquartile Range in Excel. Using this function, you need to calculate Q1 and Q3 to find IQR in Excel and for this, you need to follow the steps given steps:

- Choose Cell F6 in the first step.
- Enter the following formula.
- =QUARTILE(C5:C15, 1)

- The range C5:C15 is selected in the QUARTILE function and it returns 1 as quart which simply means 25th percentile. Now, you will get the first quartile from the array.
- Press ENTER key and you will get the value of Quartile(Q1).

- Choose cell F7.
- Enter the following formula.
=QUARTILE(C5:C15, 3)

- In this function, the C5:C15 is selected as an array and it returns 3 as a quart in which 3 shows the 75th percentile. You will get the third quartile in return from the array.
- Press ENTER key and you will get the value of Quartile(Q3).

- Now, you need to find the difference between Quartile Q1 and Quartile Q3. For this, enter the following formula in cell F8:
=F7-F6

- Press ENTER key and you will get the Interquartile Range.

That’s it!
This is how to calculate IQR in Excel with the help of the QUARTILE function.
How to Calculate IQR in Excel with the QUARTILE.INC Function?
In this method, you will find an example in which the dataset has test scores given in cell range B2:B21. You need to find the Interquartile Range in the D3 cell.
Here is the formula given:
=QUARTILE.INC(B2:B21,3)-QUARTILE.INC(B2:B21,1)

Let’s have a bit more understanding of how this formula works:
As already explained that Excel does not have a direct function to calculate the IQR, that’s why some alternatives appear including the use of QUARTILE.INC function. It helps in returning the third quartile and the first quartile in the formula.
When you get the value of the difference between these two, it is called the Interquartile Range value. and the syntax for this function is given below:
Syntax of the QUARTILE.INC Function:
=QUARTILE.INC(array, quart)
array: This argument contains the cell range or numeric values. And this is a compulsory value to be added to the formula.
quart: This is also a required value that gives a value between 0 and 4. It simply indicates the function should return. You will always get a minimum value when 0 is specified. On the other hand, you will get the first quartile when 1 is specified. In case, when 2 is specified, you will get the median value.
Ultimately, you have noticed that the first part of the formula is given the third quartile, whereas we have specified the number 3. When the number 1 is specified, the second part of the formula gives the first quartile. And we have an IQR of 6 that appears by calculating the difference between these two values.
How Do You Interpret the IQR Results?
You can interpret the IQR results in several different ways. You can simply take it as a value that shows the value range in which you can see the most data points. Therefore, you must know that the IQR value will be higher when the dataset has multiple variables.
Things to Consider:
MIN, MEDIAN, and MAX values can be used in the QUARTILE function.
You will face the #NUM! error when the array does not have any value.
Whenever you will have the quart<0 or quart>4, you will face the #NUM! error.
Summary:
In this post, you have learned how to calculate IQR in Excel with the help of multiple approaches. Each method is worth appraising and you can try any of them without risk.
In this article, let’s see how you can calculate interquartile range in excel.
What is an interquartile range (IQR)?
IQR represents where does the middle (50%) or bulk of values lie in a given range of data. Let’s simplify it further.
From a given range of data like students’ scores, first it is sorted in order of smallest to largest value such that, the data can be divided into 4 parts or 4 quartiles.
IQR here is the difference between first quartile (25th percentile) & third quartile (75th percentile).
IQR=Q3-Q1
Let’s see an example. Here is a range of values: 1 2 3 4 5 6 7 8 9 10 11
Here first quartile is at 3.5 (Between 3 & 4) and third quartile is 8.5 (Between 8 & 9).
IQR=8.5-3.5
=5
Calculating Interquartile Range Excel
In excel, there is no direct method or function to calculate interquartile range on excel. So we have to use another way to do so.
One of the easiest method is to calculate Q3 & Q1 and subtract them.
Here are the steps on how to calculate IQR in excel:
- Select the cell, where we want to get the value of Q1. Then type =Quartile(array,1).
Here the array means the range of the cells. Just select the range of cells by dragging the cells. Also, 1 in the formula represents quartile 1, it’s telling excel to return the value of Q1
- Now, calculate the value of Q3 the same way. Use the same formula, type =Quartile(array,3). Again array should be the range of cells and 3 is Q3.

- Now, select the cell where you want to display the value or IQR in excel. Use the simple subtract formula i.e type=D4-D3. D4 has the value of Q3 & D3 of Q1.

- You can use a much faster way. Instead of calculating Q1 & Q3 and then subtracting. You can use 1 single formula to calculate IQR in excel.
You can directly type, =Quartile(array,3)-Quartile(array,1)
Just replace array with the range of cells.


Conclusion
IQR is just the measure of middle dispersion of given data, i.e difference between Q3 & Q1.
I hope this article was helpful to you and explained you in depth how to find IQR in excel and what IQR is.
If you have any questions or tips, I’d love to hear them in the comment section below.
This Post Has One Comment
-

sabrina 15 Feb 2023 Reply
Hello, what if my data have duplicate numbers, should I removed them or just use the formula for the whole data?

Leave a Reply
This tutorial demonstrates how to calculate interquartile range (IQR) in Excel and Google Sheets.
What is Interquartile Range (IQR)?
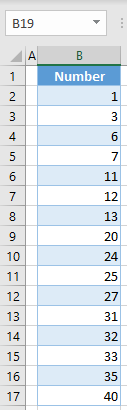
The Interquartile range presents a spread of the middle half of the dataset. It is actually the difference between the third and the first quartile. Quartiles are values that split a dataset into 4 equal parts. Say. that you have the following dataset:
1, 3, 6, 7, 11, 12, 13, 20, 24, 25, 27, 31, 32, 33, 35, 40
In this case, there are 16 values, so quartiles will split it into 4 parts, each containing 4 numbers. Therefore, the first quartile is 10, the second is 22, and the third is 31.25, From this, you can conclude that the IQR is 31.5-9 = 22.5.
Calculate Interquartile Range (IQR) in Excel
Say that you have the same dataset in Excel and want to calculate IQR.
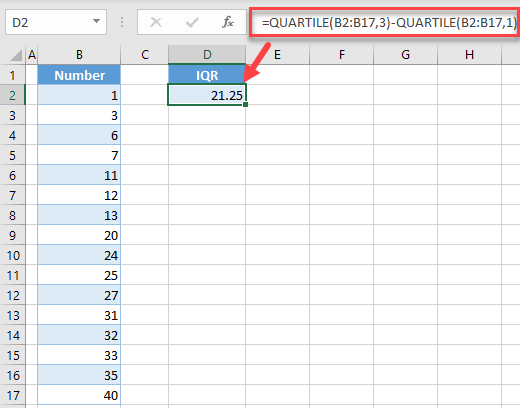
To achieve this, you need to use the QUARTILE Function to get the first and third quartile. Enter the following formula in cell D2:
=QUARTILE(B2:B17,3)-QUARTILE(B2:B17,1)
As you can see the IQR is 21.25
Calculate Interquartile Range (IQR) in Google Sheets
Similar to Excel, to calculate interquartile range in Google Sheets, enter the formula:
=QUARTILE(B2:B17,3)-QUARTILE(B2:B17,1)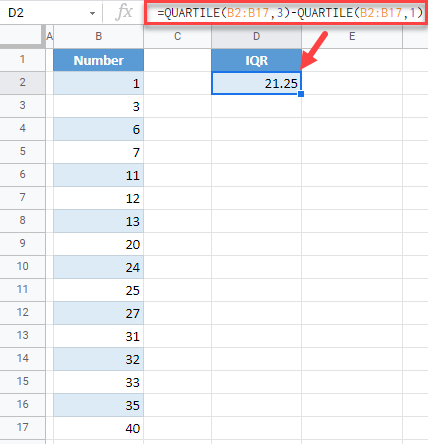
In statistics, the five-number summary is mostly used as it gives a rough idea about the dataset. It is basically a summary of the dataset describing some key features in statistics. The five key features are :
- Minimum value: It is the minimum value in the data set.
- First Quartile, Q1: It is also known as the lower quartile where 25% of the scores fall below it.
- Median (middle value) or second quartile: It is basically the mid-value in the dataset.
- Third Quartile, Q3: It is also known as the Upper quartile in which 25% of the data is above it and the rest 75% falls below it.
- Maximum value: It is the maximum value in the dataset.
Using two quartiles of the five-number summary we can easily calculate the IQR abbreviated as Interquartile Range.
In this article, we are going to see how to calculate the Interquartile range in Excel using a sample dataset as an example.
Interquartile Range
In terms of Mathematics, it is basically defined as the difference between the third quartile (75th percentile) and the first quartile (25th percentile).
Q3-Q1
IQR denotes the middle 50% hence also known as midspread or H-spread in statistics. It can be easily observed using a box plot.
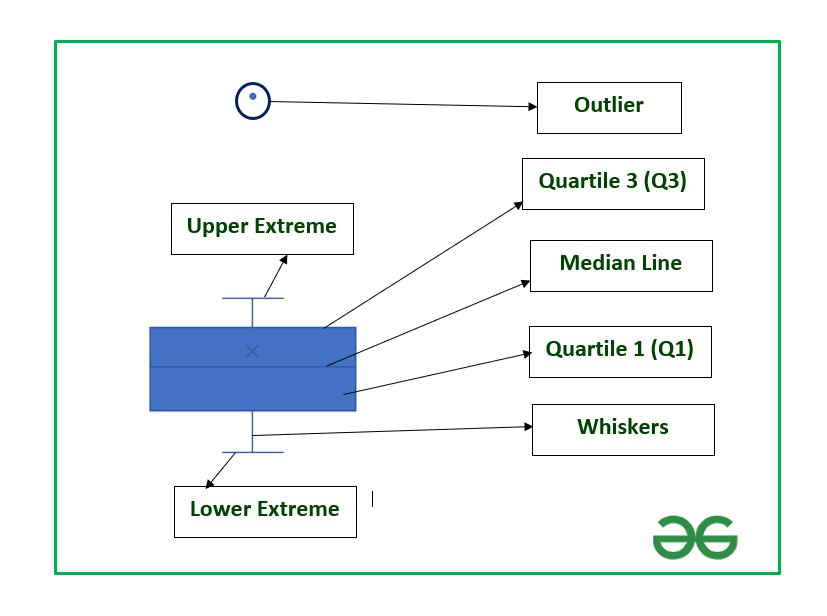
The vertical lines of the rectangular box plot denote the Interquartile range which lies between Quartile 1 and Quartile 3.
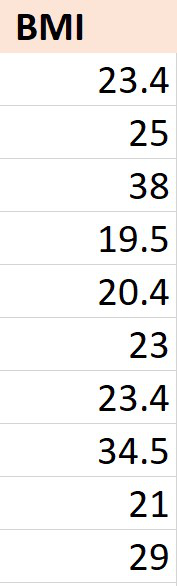
Example: Consider the dataset consisting of the BMI of ten students in a class.
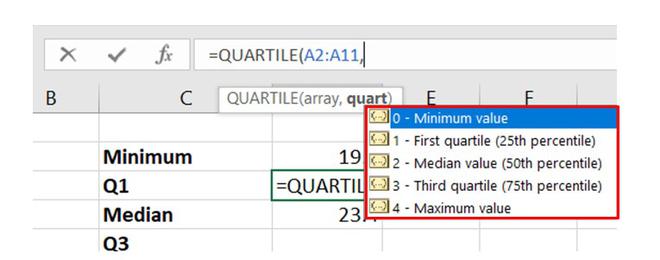
Now, in order to calculate the IQR we need to first calculate the two quartile values Q1 and Q3. The function used is :
QUARTILE(Array,quart)         // Used in Excel 2007 version and lower
or
QUARTILE.INC(Array,quart)    // Used in latest version of Excel

Array : Cell range
quart : The five quart values from 0 to 4

0- Minimum value
1- First Quartile (25 percent)
2- Median Value (50 percentile)
3- Third Quartile (75 percentile)
4- Maximum value
quart values
Calculation
Follow the below steps to calculate the same:
Step 1: Insert the dataset.
Step 2: Select any cell where you want to write the formula to calculate the values of Q1, Q3, and IQR.
Step 3: First find the values of Q1 and Q3 using the quart values as 1 and 3 respectively.
The dataset is stored in column “A” of the worksheet and the observations are stored from cell A2 to A11.
So the array will start from A2 and end at A11.
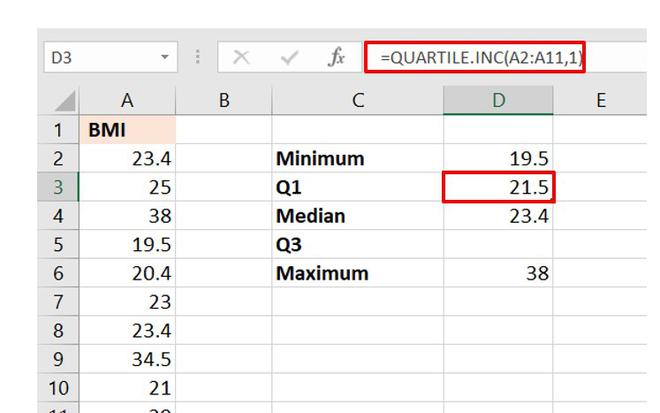
Calculation of Q1

Calculation of Q3
You can also find the remaining three parameters of a five-number summary using the same formula just by changing the quart value. But to find the IQR, we only need the values of Q1 and Q3.
The value of Q3 is stored in cell D4 and that of Q1 in cell D3. The formula will be :
=Cell_no_Q3-Cell_no_Q1
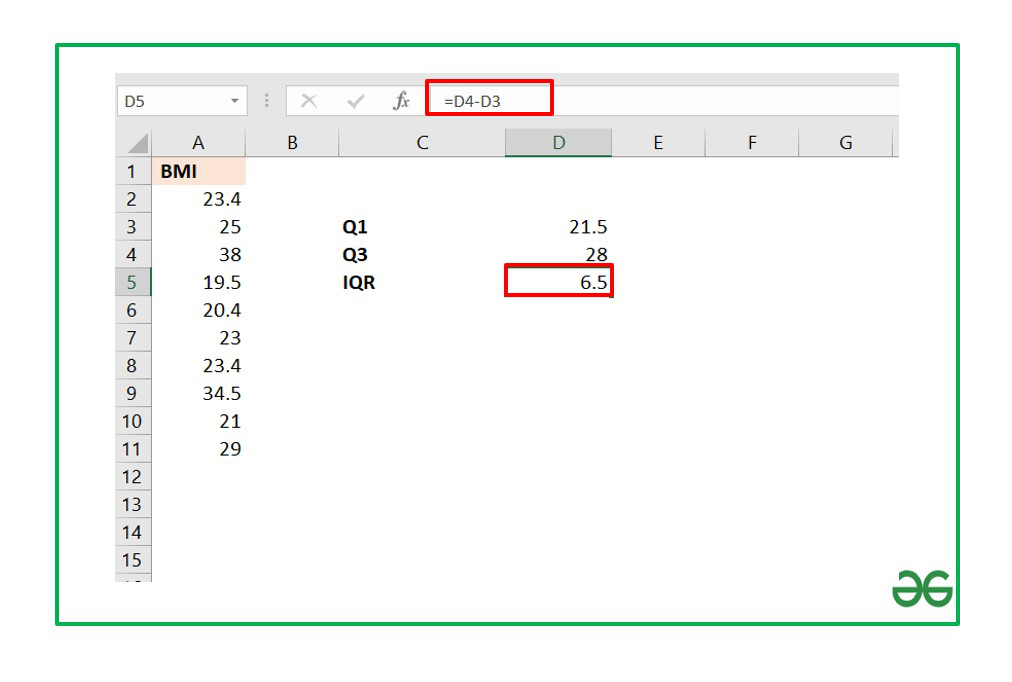
The Interquartile range for the above dataset turns out to be 6.5.