
![]()
What is Excel?

Microsoft Excel is a spreadsheet program available in the Microsoft Office Package. MS Excel is used to create Worksheets (spreadsheets) to store and organize data in a table format.
Microsoft Excel is one of the most used software application in the world. Excel have the Powerful Tools and Functions, using it for wide verity of applications across the global IT Companies. It is easy to enter the data, read and manipulate the data. Excel stores the data in a table format in Rows and Columns.
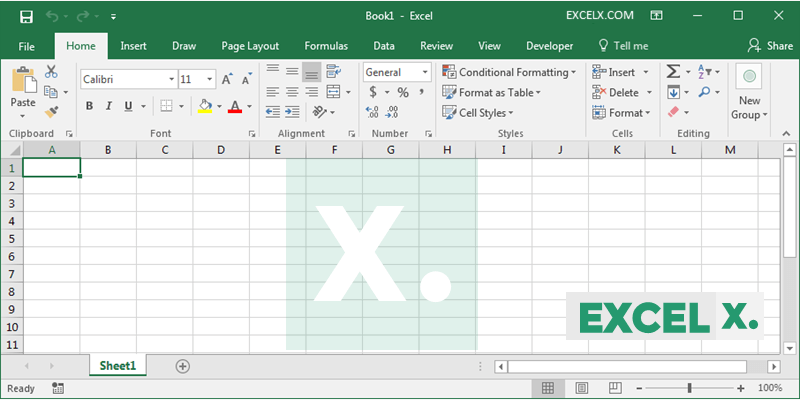
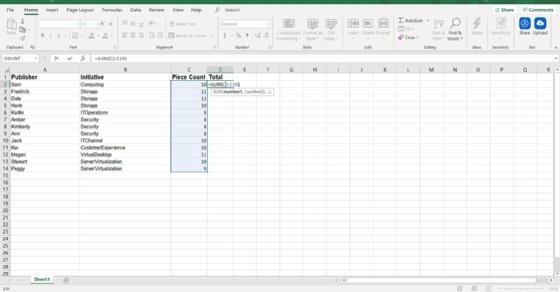
Here is a screen-shot of a Microsoft Excel File:
- What is Excel in Computer?
- What is Excel Used for?
- Where Excel is Used?
- Features of MS Excel:
- Key Components:
- Usage
- Industries
- Interface
- Data Analysis
- Data Visualization
- Templates
- Enhancing Excel Features
- Programming Language
- Macros
- Add-ins
- Integration with Other Office Applications:
- Security Features
- Resource and Support Communities:
- Limitations
- Data security and privacy
- Data accuracy and integrity
- Alternative Applications
- Conclusion
- Excel Objects and Definitions
- What is Excel Ribbon?
- What is Excel Workbook?
- What is Excel Worksheet?
- What is Excel Range?
- What is Excel Cell?
- What is Excel Row?
- What is Excel Column?
- What are Excel Macros?
- What is Excel VLookUp?
What is Excel in Computer?
In computer terms, Excel is a spreadsheet application in Microsoft Office Pack. It is one of the most using Applications in business industries. We can store any kind of the data in the spreadsheets in the Excel Range or Excel Cells. We can also insert Images, Shapes, Charts, Pivot Tables in the Excel Sheets to understand the data.
What is Excel Used for?
Microsoft Excel used for storing the data, processing the data, analyzing and presenting the data.
- We can enter data in Strings, Dates or Numerical type of Data in the Excel Cells and Save the Files for future reference
- We can use verity of formulas available in Excel to perform calculations
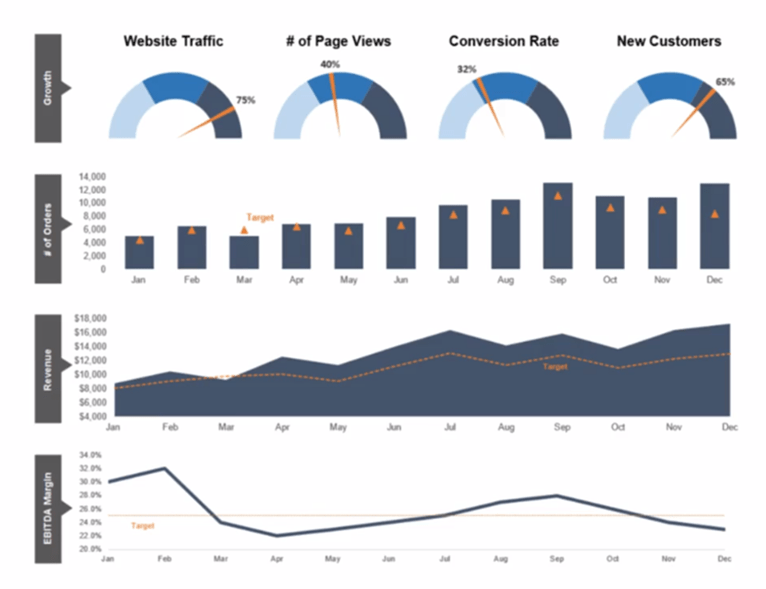
- We can Develop Tools and Dashboards
- We can Interact with Other Applications
- We can connect to verity of Data Bases
- We can represent data in Charts
- We can drill down and analyze the data using Pivot Tables
Read More Uses
Where Excel is Used?
Microsoft Excel used in almost all industries. Here are the some of the real-time Excel Using industries and domains:
- Financial sector is excessively using to perform different kind of calculations.
- Analytical professional use Excel almost everyday for applying the basic analytical techniques and tools.
- Banking Sector use to understand the Customer
- Retail Associates uses for analyzing the POS data to check the change and trend in sales
- Reporting Analysts uses for generating Daily, Weekly, Monthly, Quarterly and Yearly Reports.
- Healthcare Teams uses for performing the longitudinal data analysis.
- Market Research Analysts uses for finding the frequencies and cumulative aggregates.
- VBA Developers uses for developing the Office Applications, Tools, Office Add-ins and Dashboards.
Features of MS Excel:
The following features of Excel made the Excel as most widely using application:
-
Graphical Features of Excel
Excel have verity of the graphical features to represent the data in Charts and pictorial format. For Example, Charts, Shapes, Smart Arts, Clip Arts, Pictures.
-
Data Base Features of Excel
Excel can be used as data base and perform of verity of data operations. For example, Pivot Tables, Slicers, Tables, Spark lines, Database, Sorting, Filtering, Data Validation, Grouping, etc.
-
Functional Features of Excel
Excel Tools and Functions will help to perform powerful calculations and enhance the Excel Application Features. For example, Formulas, VBA Macros, Add-ins, Hyperlinks, Conditional Formatting, Spell Check, Protection, etc.
Key Components:
Excel is a spreadsheet software developed by Microsoft that is used to perform calculations, data analysis, and data visualization. Some of the key components of Excel include:
- Workbook: A workbook is the main file that contains one or more worksheets where you can enter data, perform calculations, and create charts and graphs.
- Worksheet: A worksheet is a single spreadsheet within a workbook that consists of rows, columns, and cells.
- Cell: A cell is a rectangular box in a worksheet where you can enter data, formulas, and functions.
- Range: A group of adjacent cells, which can be selected and formatted together.
- Chart: A chart is a visual representation of data in a worksheet that can help you to identify patterns and trends.
- PivotTable: A PivotTable is a powerful tool that allows you to summarize and analyze large amounts of data quickly and easily.
- Sparklines: Sparklines are small, simple charts that are used to show trends in data over time.
- Ribbon: The Ribbon is a graphical user interface that contains all the tools and commands you need to work with Excel. It is organized into tabs, which are further divided into groups of related commands.
- Quick Access Toolbar: The Quick Access Toolbar is a customizable toolbar that provides quick access to frequently used commands.
- Name box: The box located to the left of the formula bar, which displays the reference of the selected cell or range.
- Solver: Solver is an add-in tool that allows you to find the optimal solution to a problem by changing the values of certain variables.
- Goal Seek: Goal Seek is a tool that allows you to determine the value of a variable that will achieve a certain goal in a formula.
- Scenario Manager: Scenario Manager is a tool that allows you to create and compare different scenarios for a worksheet by changing the input values of certain variables.
- Power Query: Power Query is a tool that allows you to transform and analyze large amounts of data from various sources, such as databases, spreadsheets, and web pages.
- Power Pivot: Power Pivot is an add-in tool that allows you to create advanced data models and perform complex data analysis using large amounts of data.
- Data Tables: Data Tables are tools that allow you to calculate multiple results based on different sets of input values for one or more formulas.
- Web Queries: Web Queries are tools that allow you to import data from a website directly into Excel, making it easier to collect and analyze data from the internet.
- Get & Transform: Get & Transform is a feature that allows you to connect to various data sources, transform and reshape data, and load it into Excel for analysis and reporting.
- Freeze Panes: Freeze Panes is a feature that allows you to keep certain rows or columns visible as you scroll through a worksheet, making it easier to view and analyze large amounts of data.
- Collaboration Tools: Excel also provides various collaboration tools that allow multiple users to work on the same worksheet simultaneously, such as shared workbooks and co-authoring.
- Protect Workbook/Worksheet: Protect Workbook/Worksheet is a feature that allows you to restrict access to certain parts of a workbook or worksheet by setting password protection, so that only authorized users can view or edit the data.
- Error Checking: Error Checking is a feature that allows you to identify and correct errors in your formulas and functions, which can help to ensure data accuracy.
- Templates: Excel Templates are pre-designed spreadsheets that you can use to quickly create different types of documents, such as budgets, calendars, and invoices.
- Macro: A macro is a set of instructions that automate repetitive tasks in Excel.
- Office Add-ins: Office Add-ins are third-party tools that you can install in Excel to extend its functionality, such as data connectors, visualization tools, and productivity apps.
- Merge cells: A tool that allows you to combine multiple cells into a single, larger cell.
- Autofill: A tool that allows you to quickly fill a series of cells with a pattern or sequence of data.
- Data Validation: Data Validation is a feature that allows you to restrict the type of data that can be entered into a cell. This can help to ensure data accuracy and consistency.
- Custom Number Formats: Custom Number Formats are tools that allow you to create your own number formats, making it easier to display numbers in a way that is more meaningful for your data.
- Text to Columns: Text to Columns is a feature that allows you to split data in a column into multiple columns based on a delimiter, such as a comma or space.
- Flash Fill: Flash Fill is a tool that allows you to automatically fill in data based on a pattern that you specify, making it easier to clean and transform data.
- Print Options: Excel also provides various print options that allow you to customize the layout and formatting of your worksheet before printing, such as page orientation, margins, and scaling.
- Page Layout View: Page Layout View is a feature that allows you to view your worksheet as it will appear when printed, making it easier to adjust the layout and formatting.
- Filter: A tool that allows you to display only specific data in a worksheet, based on certain criteria.
- Sort: A tool that allows you to arrange data in a worksheet in ascending or descending order, based on certain criteria.
- Function: A function is a built-in formula that performs a specific calculation or task, such as SUM, AVERAGE, MAX, and MIN.
- Formula: A formula is an equation that performs a calculation in a cell based on the values in other cells.
- Formula bar: The area at the top of the Excel window where you can view and edit the contents of a selected cell.
- Cell reference: A way to identify a cell in a worksheet, which is a combination of the column letter and row number, such as A1, B2, etc.
- Relative reference: A cell reference that changes when you copy or move a formula to a different location in a worksheet.
- Absolute reference: A cell reference that remains constant when you copy or move a formula to a different location in a worksheet, which is denoted by a dollar sign ($).
- Mixed reference: A cell reference that has both absolute and relative components, which is denoted by a dollar sign ($) before the column or row reference.
- Dynamic Arrays: Dynamic Arrays are a new feature in Excel that allow you to create formulas that automatically expand or shrink to fit the size of the data, making it easier to perform calculations on large datasets.
- Formula auditing: A tool that allows you to trace the relationships between cells and formulas in a worksheet, which can help you identify errors and troubleshoot problems.
Usage
Excel is a widely used spreadsheet program developed by Microsoft. It is part of the Microsoft Office suite of applications and is used to organize, analyse, and manipulate data. Excel allows users to create, format, and manipulate tables of numerical and textual data in rows and columns.
Users can perform various mathematical and statistical calculations on the data, create charts and graphs to visualize the data, and use formulas and functions to automate calculations and analysis. Excel also provides various tools and features for data analysis, such as sorting, filtering, and pivot tables, that allow users to extract insights quickly and easily from large data sets.
Industries
Excel can be used in a variety of industries and professions, including finance, accounting, marketing, and research. It is often used for budgeting, financial forecasting, tracking expenses, inventory management, and analyzing sales data.
Interface
Excel has a user-friendly interface and is widely available on Windows and Mac OS systems. Additionally, Excel supports collaboration features, such as sharing workbooks and co-authoring, which allow multiple users to work on the same spreadsheet simultaneously.
Data Analysis
Another important feature of Excel is its ability to handle large amounts of data. Excel can handle millions of rows of data and thousands of columns, making it ideal for working with large datasets. Additionally, Excel provides several features for managing large datasets, such as sorting, filtering, and searching.
Excel also allows users to collaborate on workbooks in real-time using cloud-based solutions like OneDrive or SharePoint. This feature makes it easy for teams to work on the same document simultaneously and ensures that everyone is working with the most up-to-date version of the data.
Data Visualization
Excel also provides various tools for data visualization, which make it easy to create charts, graphs, and other visualizations that help to communicate data insights. With features like sparklines and conditional formatting, users can quickly identify trends and patterns in data without the need for complex analysis.
Overall, Excel is an essential tool for anyone who works with data. Its extensive feature set, customizability, and ease of use make it an ideal choice for businesses, researchers, educators, and individuals. Whether you are working with small datasets or large, Excel can help you manage and analyze your data efficiently, saving you time and improving your productivity.
Templates
Excel also provides various templates that help users get started with common tasks, such as budgeting, invoicing, and project management. These templates can be customized to meet specific needs, making it easy for users to create professional-looking spreadsheets without starting from scratch.
Enhancing Excel Features
Another way to overcome some of the limitations of Excel is to use Excel add-ins or plugins that provide additional features and capabilities. There are many add-ins available that can help users automate tasks, perform advanced analysis, and enhance visualization.
- For example, the Analysis ToolPak add-in provides a wide range of statistical and engineering functions, while the Power Query add-in allows users to extract and transform data from a variety of sources. The Solver add-in can help users find optimal solutions for complex problems, while the Power Pivot add-in provides advanced data modeling and analysis capabilities.
- In addition to add-ins, users can also consider using Excel templates or pre-built solutions that provide pre-configured spreadsheets and models for specific use cases. There are many templates available for financial modeling, budgeting, project management, and other applications. These templates can help users save time and avoid errors by providing pre-built formulas and templates for common tasks.
Finally, to improve collaboration and data sharing, users can consider using cloud-based collaboration platforms such as Microsoft Teams or SharePoint. These platforms allow users to share and collaborate on Excel spreadsheets in real-time, providing a more efficient and collaborative workflow.
Programming Language
Excel also has a programming language called VBA (Visual Basic for Applications) that allows users to automate repetitive tasks and create custom solutions. With VBA, users can create macros, which are small programs that automate common tasks, such as formatting data or generating reports.
VBA also provides access to many of Excel’s built-in features, as well as the ability to create custom functions and procedures. This allows users to create highly customized solutions that can save time and increase efficiency.
Macros
In addition to add-ins, templates, and complementary tools, users can also consider using Excel macros to automate repetitive tasks and improve productivity. Macros are small programs written in Visual Basic for Applications (VBA) that can be used to automate tasks and add custom functionality to Excel.
- With macros, users can automate tasks such as formatting, data entry, and data cleaning, as well as perform more advanced tasks such as data analysis and modeling. Macros can also be used to create custom functions and formulas that can be reused in other Excel spreadsheets.
- To create macros, users need to have a basic understanding of VBA programming. Excel provides a built-in macro recorder that allows users to record their actions and convert them into VBA code. Users can also write their own code from scratch or modify existing code to create more complex macros.
- Macros can be saved as part of the Excel spreadsheet or as a separate file, and can be easily shared with other users. However, it is important to be cautious when using macros as they can potentially contain malicious code that can harm your computer or compromise your data.
- Excel VBA Macros can be a powerful tool for automating tasks and improving productivity in Excel. By learning how to write and use macros, users can save time and improve their workflow, and add custom functionality to Excel spreadsheets. However, it is important to be careful when using macros, and to ensure that they come from a trusted source and do not contain any malicious code.
Add-ins
In addition to its core features, Excel also supports a wide range of add-ins and third-party applications that can further extend its functionality. For example, users can install add-ins to enhance data visualization, automate data entry, or integrate Excel with other software tools.
Integration with Other Office Applications:
One of the advantages of Excel is its compatibility with other Microsoft Office applications, such as Word and PowerPoint. Excel data can easily be copied and pasted into these applications, allowing users to create professional-looking documents and presentations that include charts, tables, and graphs.
Excel also supports a wide range of file formats, including CSV, TXT, XML, and HTML, making it easy to share data with other applications or import data from external sources. Additionally, Excel can connect to external data sources such as SQL databases, SharePoint lists, and OData feeds, allowing users to work with data from a wide range of sources.
Security Features
Excel also provides various security features, such as password protection and file encryption, that help to keep data safe and secure. This is especially important when working with sensitive or confidential information.
Finally, Excel is widely supported by third-party tools and services, which can further enhance its capabilities. For example, there are many add-ins and plug-ins available that provide additional functionality, such as data analysis tools, charting software, and collaboration platforms.
In conclusion, Excel is a powerful and versatile tool that provides many features and capabilities for managing and analyzing data. Whether you are a business owner, financial analyst, researcher, or student, Excel can help you work with data more efficiently and effectively. Its ease of use, customizability, and compatibility with other applications make it an ideal choice for anyone who works with data on a regular basis.
Resource and Support Communities:
Excel’s popularity has led to the development of many resources and support communities, which can help users learn how to use the software effectively. These resources include online tutorials, user forums, and training courses, which can help users become proficient in Excel quickly.
- Furthermore, Excel’s features are constantly evolving, with new updates being released on a regular basis. These updates often include new tools and functionality that help users work with data more effectively.
- In addition to its features, Excel’s versatility and wide range of applications make it an essential tool for many industries and professions. For example, Excel is commonly used in finance and accounting for budgeting, forecasting, and financial modeling. It is also used in marketing and sales for data analysis, customer segmentation, and campaign tracking.
- In research, Excel is used for data cleaning, manipulation, and analysis. Excel is also frequently used in education, where it is used to teach data analysis, statistics, and financial modeling.
In summary, Excel is a powerful and versatile tool that provides many features and capabilities for managing and analyzing data. Its ease of use, customizability, compatibility with other applications, and wide range of applications make it an essential tool for many industries and professions. With its continued development and support, Excel is likely to remain a key tool for data management and analysis for years to come.
Limitations
Despite its many advantages, Excel is not without its limitations. One limitation is its ability to handle extremely large datasets. While Excel can handle millions of rows of data, it may become slow and unwieldy with datasets that exceed this limit.
- Additionally, Excel is not well-suited for complex data modeling and analysis. While it provides many tools and features for data analysis, it may not be the best choice for advanced statistical analysis or machine learning.
- Another limitation of Excel is its potential for errors. Because it relies on manual data entry and manipulation, it is vulnerable to human errors such as typos and miscalculations. Additionally, its use of cell-based formulas and references can lead to errors when cells are moved or deleted.
- Finally, Excel’s use of proprietary file formats can make it difficult to share data with users who do not have access to the software. While Excel can save files in a variety of formats, users may need to use specialized software to open or work with these files.
- While Excel is a powerful and versatile tool for managing and analyzing data, it does have some limitations. Users should be aware of these limitations and choose the appropriate tools and software for their specific needs. Despite its limitations, Excel remains a popular and widely used tool for data management and analysis, and its continued development and support make it a valuable tool for many industries and professions.
Data security and privacy
Another important consideration when working with Excel is data security and privacy. Excel files can contain sensitive and confidential data, such as financial records, personal information, or trade secrets. As such, it is important to take appropriate measures to protect this data from unauthorized access or disclosure.
- One way to improve data security in Excel is to use password protection. Excel allows users to password-protect their spreadsheets and workbooks, which can prevent unauthorized access or editing. Passwords should be strong and complex, and users should avoid sharing passwords with others or storing them in an insecure location.
- Another way to improve data security is to restrict access to Excel files. Users can use file permissions to control who has access to their Excel files and what they can do with them. For example, users can set read-only permissions for certain users, or prevent users from copying or printing the file.
- Users should also be aware of the risks associated with sharing Excel files over email or cloud storage services. Excel files can be intercepted or accessed by unauthorized parties if they are not encrypted or secured properly. To avoid these risks, users can use secure file-sharing services or encrypt their Excel files before sharing them.
- Finally, users should be aware of privacy laws and regulations that may apply to their use of Excel. For example, certain types of data, such as personal information or medical records, may be subject to specific data protection laws. Users should ensure that they are complying with applicable privacy laws and regulations when working with Excel.
In conclusion, data security and privacy are important considerations when working with Excel. By using password protection, access restrictions, secure file-sharing, and complying with privacy laws, users can protect their sensitive data and ensure that it is not disclosed or accessed by unauthorized parties.
Data accuracy and integrity
Another important consideration when working with Excel is data accuracy and integrity. Excel spreadsheets can be prone to errors, such as data entry mistakes, formula errors, or incorrect formatting. These errors can lead to incorrect analysis, decision-making, or reporting, and can have serious consequences for businesses or organizations.
- To ensure data accuracy and integrity, users should follow best practices for data entry and management in Excel. This includes using consistent and clear naming conventions for data and columns, validating data as it is entered, using data validation rules to restrict data entry to specific formats or ranges, and using formulas and functions to perform calculations and analysis.
- Users should also be careful when using copy-and-paste or importing data from external sources, as these actions can introduce errors or inconsistencies in the data. Users should validate and clean data as it is imported, and ensure that data is formatted consistently with the rest of the spreadsheet.
- Another way to improve data accuracy and integrity is to perform regular checks and audits of Excel spreadsheets. Users can use tools such as Excel’s auditing and error-checking features to identify potential errors or inconsistencies in their data, and correct them before they become serious issues. Users can also use third-party tools or add-ins that provide more advanced auditing and error-checking capabilities.
In conclusion, data accuracy and integrity are critical considerations when working with Excel. By following best practices for data entry and management, validating and cleaning data, performing regular checks and audits, and using tools and add-ins that improve data accuracy and integrity, users can ensure that their Excel spreadsheets are reliable, accurate, and trustworthy.
Alternative Applications
To mitigate some of the limitations of Excel, there are several alternatives and complementary tools that users can consider. For example, users can consider using more advanced data analysis software such as Python, R, or MATLAB, which offer more powerful statistical analysis and machine learning capabilities.
- Users can also consider using cloud-based data management and analysis tools such as Google Sheets or Microsoft Power BI, which offer collaborative features, more powerful data visualization options, and support for larger datasets.
- Finally, to ensure compatibility and interoperability with other software and systems, users can consider using open-source or non-proprietary file formats such as CSV or JSON, which can be read and manipulated by a wide range of software tools and platforms.
- In summary, while Excel remains a valuable tool for data management and analysis, it is important for users to be aware of its limitations and consider using complementary tools and software to meet their specific needs. By combining Excel with other tools and techniques, users can work more efficiently, reduce errors, and extract more value from their data.
Conclusion
Excel is constantly evolving, with new features and capabilities being added with each new version. For example, recent updates have introduced new functions, new chart types, improved data analysis tools, and enhanced collaboration features.
- Excel is also widely used in data analysis and business intelligence. With features like Power Query and Power Pivot, users can easily connect to external data sources, clean and transform data, and create interactive dashboards and reports.
- In addition to its business applications, Excel is also used extensively in education, where it is used to teach data analysis, mathematical modeling, and financial analysis.
- Overall, Excel is a powerful and versatile tool that can be used to perform a wide range of tasks. Whether you are a small business owner, financial analyst, researcher, or student, Excel can help you manage and analyse data more efficiently, saving you time and improving your productivity. With its user-friendly interface, extensive feature set, and customizability, Excel is a valuable tool for businesses, professionals, and individuals alike.
In conclusion, while Excel has some limitations, there are many ways to overcome these limitations and enhance its capabilities. By using add-ins, templates, and complementary tools and software, users can work more efficiently, perform advanced analysis, and share data more effectively. With its continued development and support, Excel is likely to remain a key tool for data management and analysis for years to come.
Excel Objects and Definitions

What is Excel Ribbon?
Excel ribbon is the navigation menu in Excel, shows all the Controls and Commands in different Tabs.

What is Excel Workbook?
Excel Workbook is the Main File which can contain at one or more worksheet or spreadsheets.

What is Excel Worksheet?
Excel workbook can contain more than one worksheet. It is a spreadsheet with rows, columns and cells.

What is Excel Range?
Excel range is the worksheet object contains one or more Cells.

What is Excel Cell?
Cell is an Object of Excel Sheet to enter information. It represents with Column Name followed by Row Number.

What is Excel Row?
Rows are the Records in Excel Spreadsheet. Excel Rows are represented by row numbers (1,2,3,…).

What is Excel Column?
Columns are Fields in Excel Spreadsheet. Each Column in a sheet represented with a unique Column Name, starts with Column name A.

What are Excel Macros?
A Macro is a re usable tiny program which we can save and run to repeat the same action or tasks in Excel.

What is Excel VLookUp?
VLOOKUP Function in Excel helps to lookup the corresponding values of a Range, Table and Arrays.
- Microsoft Excel
- What’s New in Excel?
- MS Excel Resource
© Copyright 2012 – 2020 | Excelx.com | All Rights Reserved
Page load link
This is a beginners guide to Excel spreadsheets
A “Dummies” Guide to Excel for Beginners
Welcome to our free Excel for beginners guide! In this guide, we will give you everything a beginner needs to know – what is Excel, why do we use it, and what are the most important keyboard shortcuts, functions, and formulas. If you’re new to MS Excel, then you’ve come to the right spot and our dummies guide to Excel will give you the foundation you’re looking for.
Launch our free YouTube course on Excel for beginners below!
What is Excel?
The Microsoft Excel program is a spreadsheet consisting of individual cells that can be used to build functions, formulas, tables, and graphs that easily organize and analyze large amounts of information and data.
Excel works like a database, organized into rows (represented by numbers) and columns (represented by letters) that contain information, formulas, and functions used to perform complex calculations.
The first version of Excel was released by Microsoft in 1985, and by the 1990’s it was one of the most widely used and important business tools in the world.
Today, Excel is still a ubiquitous program, found on just about every personal and business computer on the planet.
Launch our free Excel crash course. The best way to learn is by doing, which is why our FREE step by step tutorial on how to use Excel is the most efficient way to learn with your own spreadsheet.
Why do we use Excel?
Simply put, Excel is the easiest way to organize and manage financial information, which is why most businesses use it extensively. If offers total flexibility and customization in the way it’s used.
Another reason to use Excel is that it’s so accessible. With virtually zero training or experience, a user can open up a workbook, start inputting data and begin calculating and analyzing information.
Here are the top 5 reasons we use Excel:
- To organize financial data
- To organize contact information
- To organize employee information
- To organize personal information
- To be a calculator
What are the most important functions?
There are hundreds of formulas and combinations of formulas that can be used in Excel spreadsheets, but since this is an Excel for beginners guide, we have narrowed it down to the most important and most basic ones. We cover all of these functions and more in our Free Excel Crash Course.
The most important functions include:
- =SUM() – adds a series of cells together
- =AVERAGE() – calculates the average of a series of cells
- =IF() – checks if a condition is met and returns a value if YES and a value if NO
- =MIN() – returns the minimum value in a series
- =MAX() – returns the maximum value in a series
- =LARGE() – returns the k-th largest value in a series
- =SMALL() – returns the k-th smallest value in a series
- =COUNT() – counts the number of cells in a range that contain numbers
- =VLOOKUP() – looks for a value in the leftmost column of a table and returns in the same row from a column you specify
Here is a more detailed list of Excel formulas and functions. We recommend familiarizing yourself with all of them to become a proficient user.
What are the most important shortcuts?
If you use Excel frequently it’s important to be able to work as quickly as possible. Using Excel shortcuts is the best way to speed up your skills. By avoiding using the mouse, you can save cut down on the time it takes to click through each step of a procedure. Keyboard shortcuts are much faster and allow the user to move around the spreadsheet much more efficiently.
The most important Excel shortcuts include:
- F2 Edit active cell
- F4 Toggle references
- CTRL + 1 Format Cells
- CTRL + C Copy
- CTRL + V Paste
- CTRL + R Fill right
- CTRL + D Fill down
- ALT + = Auto Sum
- ALT, I, R Insert row
- ALT, I, C Insert column
Keyboard Shortcuts Sheet
Looking to be an Excel wizard? Increase your productivity with CFI’s comprehensive keyboard shortcuts guide.
How can I get better at Excel?
In order to improve your Excel skills, you need to practice. It’s not enough to simply read the functions and formulas in an article like this, you also have to watch and learn from the power users. Many of the functions and formulas, sadly, are not intuitive or obvious, so you’ll need to go over them many times on your own before they become natural for you.
Check out our free spreadsheet formulas course to watch an Excel power user in action!
After you’ve taken the course, try recreating everything on your own from scratch, and see if you can remember all of the formulas and functions.
What jobs use Excel spreadsheets?
There are many jobs that use Excel on a daily basis. In fact, it’s hard to think of a job that doesn’t use this program. Even though technology has changed the way we work in many careers, Excel has remained as one of the few tools that are so simple and powerful that it seems to remain no matter what other software comes out.
Just about every office job requires Excel. The broad categories of careers that use Excel are:
- Finance and accounting
- Marketing and social media
- Human Resources
- Operations
- Technology
At CFI we specialize in finance and accounting roles, so in our universe of jobs, there are many different careers that use Excel.
Explore our interactive career map to learn more about finance jobs beyond our dummies guide to Excel for beginners.
Some of the most common finance jobs that use Excel are:
- Investment banking
- Equity research
- Corporate banking
- Private equity
- Corporate development
- Investor Relations
What else do I need to know about Excel?
Hopefully, this Excel for beginners guide has given you a good start. Our free Excel crash course would be a great next step for you!
The best way to learn is to open up a new workbook and try using all the formulas and functions we’ve given you in your own spreadsheet.
Once you’re comfortable with the material in this article, take a look at the free crash course below and you’ll be a power user in no time. You can also check out some intermediate level Excel tips and formulas.
If you prefer to learn by reading, there are plenty of Excel books that are highly regarded. The Excel Bible by John Walkenback is an extremely comprehensive book that you may want to consider.
More Excel guides
If you liked our guide to Excel for beginners we think you’ll love these helpful CFI resources as well. Since the key to becoming great at Excel is lots of practice, we highly recommend you explore these additional resources to expand your knowledge and move past the introductory level. The return on the investment of your time spent will be well worth it!
Our most popular resources include:
- All Excel courses
- Excel templates
- Formulas list
- Shortcuts list
- Excel courses
- Advanced Excel formulas
- See all Excel resources
Excel is an electronic spreadsheet program that is used for storing, organizing, and manipulating data.
The information we’ve prepared refers to Microsoft Excel in general and is not limited to any specific version of the program.
What Excel Is Used For
Electronic spreadsheet programs were originally based on paper spreadsheets used for accounting. As such, the basic layout of computerized spreadsheets is the same as the paper ones. Related data is stored in tables — which are a collection of small rectangular boxes or cells organized into rows and columns.
All versions of Excel and other spreadsheet programs can store several spreadsheet pages in a single computer file. The saved computer file is often referred to as a workbook and each page in the workbook is a separate worksheet.
Spreadsheet Cells and Cell References
When you look at the Excel screen — or any other spreadsheet screen — you see a rectangular table or grid of rows and columns.
In newer versions of Excel, each worksheet contains roughly a million rows and more than 16,000 columns, which necessitates an addressing scheme in order to keep track of where data is located.
The horizontal rows are identified by numbers (1, 2, 3) and the vertical columns by letters of the alphabet (A, B, C). For columns beyond 26, columns are identified by two or more letters such as AA, AB, AC or AAA, AAB, etc.
The intersection point between a column and a row is the small rectangular box known as a cell. The cell is the basic unit for storing data in the worksheet, and because each worksheet contains millions of these cells, each one is identified by its cell reference.
A cell reference is a combination of the column letter and the row number such as A3, B6, and AA345. In these cell references, the column letter is always listed first.
Data Types, Formulas, and Functions
The types of data that a cell can hold include:
- Numbers
- Text
- Dates and times
- Boolean values
- Formulas
Formulas are used for calculations — usually incorporating data contained in other cells. These cells, however, may be located on different worksheets or in different workbooks.
Creating a formula starts by entering the equal sign in the cell where you want the answer displayed. Formulas can also include cell references to the location of data and one or more spreadsheet functions.
Functions in Excel and other electronic spreadsheets are built-in formulas that are designed to simplify carrying out a wide range of calculations – from common operations such as entering the date or time to more complex ones such as finding specific information located in large tables of data.
Excel and Financial Data
Spreadsheets are often used to store financial data. Formulas and functions that are used on this type of data include:
- Performing basic mathematical operations such as summing columns or rows of numbers
- Finding values such as profit or loss
- Calculating repayment plans for loans or mortgages
- Finding the average, maximum, minimum and other statistical values in a specified range of data
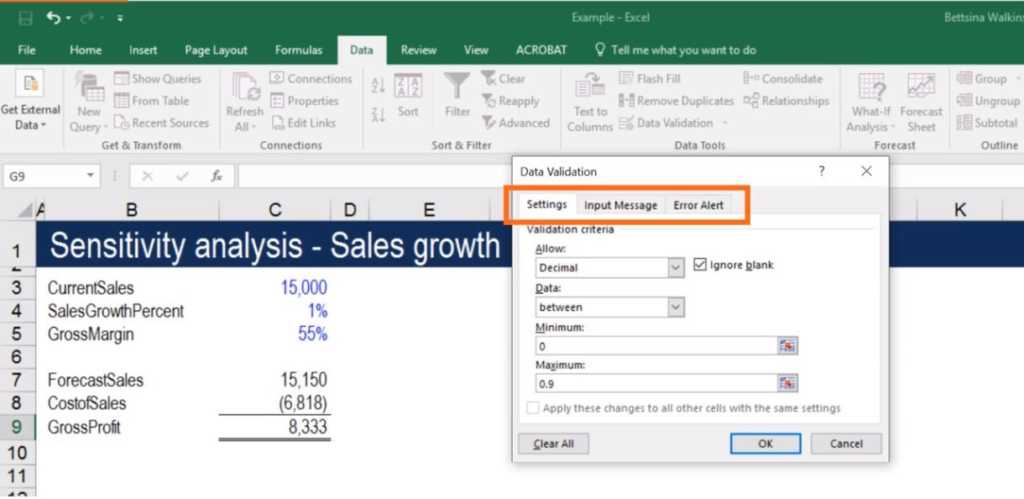
- Carrying out What-If analysis on data, where variables are modified one at a time to see how the change affects other data, such as expenses and profits
Excel’s Other Uses
Other common operations that Excel can be used for include:
- Graphing or charting data to assist users in identifying data trends
- Formatting data to make important data easy to find and understand
- Printing data and charts for use in reports
- Sorting and filtering data to find specific information
- Linking worksheet data and charts for use in other programs such as Microsoft PowerPoint and Word
- Importing data from database programs for analysis
Spreadsheets were the original «killer apps» for personal computers because of their ability to compile and make sense of information. Early spreadsheet programs such as VisiCalc and Lotus 1-2-3 were largely responsible for the growth in popularity of computers like the Apple II and the IBM PC as a business tool.
Excel Alternatives
Other current spreadsheet programs that are available for use include:
- Google Sheets: A free, web-based spreadsheet program
- Excel Online: A free, scaled-down, web-based version of Excel
- Open Office Calc: A free, downloadable spreadsheet program.
Thanks for letting us know!
Get the Latest Tech News Delivered Every Day
Subscribe
What is Excel?
Excel is a spreadsheet program from Microsoft and a component of its Office product group for business applications. Microsoft Excel enables users to format, organize and calculate data in a spreadsheet.
By organizing data using software like Excel, data analysts and other users can make information easier to view as data is added or changed. Excel contains a large number of boxes called cells that are ordered in rows and columns. Data is placed in these cells.
Excel is a part of the Microsoft Office and Office 365 suites and is compatible with other applications in the Office suite. The spreadsheet software is available for Windows, macOS, Android and iOS platforms.
Common Excel use cases
Excel is most commonly used in business settings. For example, it is used in business analysis, human resource management, operations management and performance reporting. Excel uses a large collection of cells formatted to organize and manipulate data and solve mathematical functions. Users can arrange data in the spreadsheet using graphing tools, pivot tables and formulas. The spreadsheet application also has a macro programming language called Visual Basic for Applications.
Organizations use Microsoft Excel for the following:
- collection and verification of business data;
- business analysis;
- data entry and storage;
- data analysis;
- performance reporting;
- strategic analysis;
- accounting and budgeting;
- administrative and managerial management;
- account management;
- project management; and
- office administration.
Excel terminology and components
Excel has its own terminology for its components, which new users may not immediately find understandable. Some of these terms and components include the following:
- Cell. A user enters data into a cell, which is the intersection of a column and row.
- Cell reference. This is the set of coordinates where a cell is located. Rows are horizontal and numbered whereas columns are vertical and assigned a letter.
- Active cell. This is the currently selected cell, outlined by a green box.
- Workbook. This is an Excel file that contains one or more worksheets.
- Worksheet. These are the different documents nested within a Workbook.
- Worksheet tab. These are the tabs at the bottom left of the spreadsheet.
- Column and row headings. These are the numbered and lettered cells located just outside of the columns and rows. Selecting a header highlights the entire row or column.
- Formula. Formulas are mathematical equations, cell references or functions that can be placed inside a cell to produce a value. Formulas must start with an equal «=» sign.
- Formula bar. This is the long input bar that is used to enter values or formulas in cells. It is located at the top of the worksheet, next to the «fx» label.
- Address bar. This bar located to the left of the formula bar shows the number and letter coordinates of an active cell.
- Filter. These are rules a user can employ to select what rows in a worksheet to display. This option is located on the top right of the home bar under «Sort & Filter.» An auto filter option can be selected to show rows that match specific values.
- AutoFill. This feature enables users to copy data to more than one cell automatically. With two or more cells in a series, a user can select both cells and drag the bottom right corner down to autofill the rest of the cells.
- AutoSum. This feature enables users to add multiple values. Users can select the cells they want to add and press the Alt and Equal keys. There is also a button to enable this feature on the top right of the home page, above «Fill» and to the left of «Sort & Filter.»
- PivotTable. This data summarization tool sorts and calculates data automatically. This is located under the insert tab on the far left.
- PivotChart. This chart acts as a visual aid to the PivotTable, providing graph representations of the data. It is located under the middle of the insert page, next to maps.
- Source data. This is the information that is used to create a PivotTable.
Advanced Excel capabilities
More advanced tools in Excel include the following:
- TREND function. This tool is used to calculate linear trend lines through a set of Y or X values. It can be used for time series trend analysis or projecting future trends. Trendlines can be used on charts.
- VLOOKUP. The Vertical Lookup, or VLOOKUP function, can be used to search for values in a larger data set and pull that data into a new table. VLOOKUP is a cell input command that looks like =VLOOKUP(). The parentheses include the data the user wants to look up, where to look for it, the column number with the value to return; or optionally, the user can specify an Approximate or Exact match indicated by True or False.
- Table Array. This is a combination of two or more tables with data and values linked and related to one another. This is part of VLOOKUP.
- Col_index_num. Another value when creating a table array that specifies the column from where data is being pulled.
- Range_lookup. This value in VLOOKUP provides information closest to what a user wants to find when nothing matches other variables. This is represented by a true or false label. False gives the exact value a user is looking for and True gives results from a variable data range.
- MAX and MIN functions. These functions provide the maximum and minimum values from selected data sets. MAX is used to find the maximum value in a function tab and MIN is used to find the minimum value.
- AND function. This function has more than one criteria set when searching variables. If a variable matches the criteria, the value will be returned as true; if not, it will be returned as false. The input for the function should look like this: =AND (logical1, [logical2], …).
Additional functions for use in Excel include subtract, multiply, divide, count, median, concatenate and other logical functions similar to AND, such as OR.
Excel and XLS files
An XLS file is a spreadsheet file that can be created by Excel or other spreadsheet programs. The file type represents an Excel Binary File format. An XLS file stores data as binary streams — a compound file. Streams and substreams in the file contain information about the content and structure of an Excel workbook.
Versions of Excel after Excel 2007 use XLSX files by default, since it is a more open and structured format. Later versions of Excel still support the creation and reading of XLS files, however. Workbook data can also be exported in formats including PDF, TXT, Hypertext markup language, XPS and XLSX.
Macro-enabled Excel files use the XLSM file extension. In this case, macros are sets of instructions that automate Excel processes. XLSM files are similar to XLM files but are based on the Open XML format found in later Microsoft Office software.
Excel competitors
Even though Excel might be one of the most recognizable spreadsheet programs, other vendors offer competing products. Examples include the following:
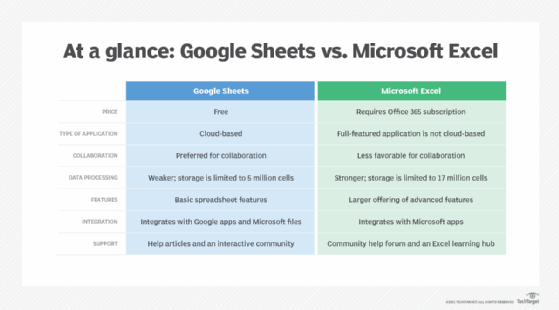
- Google Sheets. Google Sheets is a free competitor to Excel, with similar layouts and features. Users with a Gmail account can access Google Sheets. Google Sheets are saved in the cloud, meaning users can access their spreadsheets from anywhere and on numerous devices. Multiple users can also collaborate on the same spreadsheet.
- Numbers. Apple’s spreadsheet program comes free with every Mac and provides prebuilt templates, charts and graphs. Numbers excels at graphics and charts, but it does not handle large data sets as well as Microsoft Excel. Numbers is also exclusive for Apple’s devices. But it does enable users to save spreadsheets as Excel files, so a Windows user can still open a Numbers spreadsheet in Excel.
- Apache OpenOffice Calc. This free open source spreadsheet software features multiple user collaboration; natural language formulas that enable users to create formulas using words; DataPilot, which pulls data from corporate databases; and style and formatting features that enable different cell formatting options. The software uses a different macro programming language than Excel and has fewer chart options. OpenOffice Calc works on Windows and macOS platforms. OpenOffice Calc also uses the Open Document Format as its default, with only limited support for Microsoft’s XLSX format.
History and future of Excel
Microsoft released Excel in 1985 under the name Microsoft Multiplan. Microsoft’s spreadsheet program competed with similar products at the time, including Lotus 1-2-3 from the Lotus Development Corp. Although Lotus 1-2-3 was reportedly the first spreadsheet to introduce cell names and macros, Multiplan used a graphical user interface and enabled users to point and click using a mouse. Multiplan made it easier to manipulate, process and view spreadsheet data.
Initially, Multiplan lost popularity on Microsoft Disk Operating System (MS-DOS) systems when competing with Lotus 1-2-3. Two years after its initial release, in 1987, Microsoft introduced Excel version 2.0. By 1988, this new version, now on Windows platforms, began to outsell Lotus 1-2-3 and other similar spreadsheet programs.
In 1990, Microsoft released version 3 of Excel, with features such as toolbars, 3D charts, and drawing and outlining capabilities. Version 4 came along two years later and added the auto-fill function. In 1993, version 5 of Excel was released. This version included Visual Basic for Applications macros, which enabled regular tasks to be automated.
One of the next big updates to Excel was version 12, which was released in 2007. This update used a new Ribbon menu system. Improved functions included a SmartArt set of diagrams, better management of named variables and more flexibility for formatting graphs. Excel moved to using the more structured and open XLSX files as well. Version 15 released in 2013 included new tools such as Power View, Power Pivot and Flash Fill. This version also improved multithreading capabilities.
The current version of Excel, version 16, was released in 2019. Since its conception, Microsoft Excel has become one of the most widely used business applications and is often paired with other Microsoft apps such as Word, Outlook and PowerPoint. Although Microsoft no longer updates Excel as different versions, it rolls out new features and updates automatically over time.
Microsoft Excel is arguably one of the most popular spreadsheet applications and has long since played a role in businesses. However, with the popularity of other current spreadsheet software, Excel now has increased competition. The website askwonder.com claims that the collection of apps in Google Suite, which includes Google Sheets, is used by 2 billion users every month, whereas Microsoft Excel has an estimated 750 million to 1.2 billion monthly global users. Google and Microsoft do not publish monthly usage for either spreadsheet program, so it is difficult to estimate values.
Learn more about the different benefits of using Excel for HR in this article.
This was last updated in November 2021
Continue Reading About Excel
- Google announces G Suite overhaul with Google Workspace
- How to find the top 3 values using the Excel LARGE function
- Excel is the hammer for too many businesses’ nails
- Are there viable spreadsheet app alternatives to Microsoft Excel?
- What to keep in mind when creating data visualization in Excel
Dig Deeper on Application management
-

How to use the Excel LARGE function, with examples
-
ThoughtSpot launches integration with Google Sheets
By: Eric Avidon
-
Excel for HR: The essential formulas and functions
By: Eric St-Jean
-
spreadsheet
By: Katie Terrell Hanna


Introduction in Excel
In order to automate the various functions and management of data, Microsoft has developed an electronic spreadsheet application which is called Microsoft Excel. With Excel, you can collect large amounts of data that too you can put in the form of rows and columns. The data which we can enter through is alphabets, numbers, graphs, charts, and pictures.
With the Excel application, you can even add, delete, modify, link, and relocate the data. In Excel, you can have 256 columns and 65,536 rows per worksheet. With this tremendous data storage functionality, you can search, sort, and filter the data as per your requirement.
Why one should know Microsoft Excel?
Earlier data management and calculative work were done manually. But with excel, everything became automated. If we see all the business fields, including finance, statistics, marketing, engineering, and human resources, especially the businesses which deal with large amounts of data (numbers, statistics) use Excel
Some important features of Excel
- Hyperlink: With this, we can link one file to another file.
- Pivot Tables: Pivot Tables are used for creating and maintaining records like employee records and product databases.
- Clip art: Even we can add images, audio, and video clips in Excel.
- Charts: with Charts, we can put numerical data in the pictorial format, which is much easier to compare.
- Macros: With Macros, we can record an event that is used to perform repeated tasks.
- Sorting: The data can be sorted as and when needed in any direction
- Filters: With this, we can filter the required data from a huge set of data.
- Page layout: with the page layout option, we can set up the page as per our comfort level
- Arithmetic and Logical Functions: Excel provides various mathematical functions like ADD, SUBTRACT, Multiply, division, etc. It also provides logical functions like AND, OR, IF, etc.
- Visual Basic for Applications (VBA) is used for designing user-friendly interfaces.
Application of Excel
- Database Management
- Recording of Financial statements
- Performing calculations
- Inventory Management
- Analysis of data
- Creating user-friendly interfaces
Professionals and the use of Microsoft Excel
As said above, wherever you work, you will find every workplace has a priority for MS Excel. Ease of use and efficiency are the features that make MS Excel popular.
Investment Banking Analyst
The analysts are required to perform financial modeling, and for that, excel is essential. They use it for calculating ratios, drawing graphs, and comparison purposes.
Financial Analysts
These are the other set of people who breathe with excel.
Management Consultant
These people are required to perform complex regression analysis and segment indications for that purpose, and excel is the tool that they use.
Accountant
These are the people for whom Excel is the brain. The majority of work is dependent on calculation, whether it is in terms of calculation or analysis.
Marketing Professional
These people use Excel for carrying out market surveys and analyzing the market’s results. The tools mostly use charts, graphs, clip images, etc.
Business Analyst
As these people analyze the business as a whole, their decisions are turned into actions.
Apart from this, people in the Human resources department use it for employee database management, salary calculation, etc. Operations and logistics departments use it for keeping product records.
How do businesses use Excel?
Scheduling
Business creates employee and resource schedules which are coded and updated whenever there is any change.
Basic Accounting
In Accounting, information is recorded, calculations are performed, and this information can be changed as and when required.
Even businesses use it for tracking product sales on a daily, weekly, monthly, or quarterly basis.
Finding Return on Investment
For writing financial statements and calculating Return on Investment and other ratios by creating various financial statements in Excel.
Customer Data
For managing huge customer databases, businesses use excel.
Note: Become an MS Excel Expert
Learn how to organise, format, and calculate data smoothly. Develop skills to master excel tools, formulae, and functions. Analyze data from different perspectives.
Who should be Proficient in Excel?
- All the students as their future demand it.
- Charted Accountant (CA), CFA’s, Finance students
- Working professionals.
- For people who dream to work as Finance Analysts, Market Analysts, Research Analysts, or Investment bankers for them, Excel is the language that they should speak.
For those who are freshers and want to enter the job market then, Excel is the landing point for them.
Pre-requisites
There is no prerequisite for learning Excel. People from any background or at any stage should learn Excel.
Advantages
- Excel file is portable and can be sent through email
- Excel files can be protected through passwords so that only the intended users can see them.
- Excel can be directly connected to OLAP databases.
- As Excel is a part of Microsoft office, there is no need to buy it separately.
- All types of functions, including financial, are inbuilt therefore no need for additional programs.
- People can get training for learning excel.
Disadvantages
- If we use one file for huge data, it may execute slowly.
- You may unaware of the viruses which may be attached through macros with excel files.
- For ease of use, we may need to use different sheets where there are chances of loss of data.
- Also, there is a limitation on the number of columns and rows that we can use per sheet.
- Some users find it difficult to use
Useful 20 Keyboard shortcuts to speed up your work in Excel.
Excel shortcuts for both Windows and Mac, side-by-side use.
Some Important keyboard Short cuts
1 [Ctrl]O Open a workbook
2 [Ctrl]N Create a new workbook
3 [Ctrl]S Save a workbook
4 [Ctrl]P Print a workbook
5 [Ctrl]W Close a workbook
6 [Shift][F11] Insert a new worksheet
7 [Ctrl]9 Hide selected rows
8 [Ctrl][Shift]9 Display hidden rows in selection
9 [Ctrl]0 Hide selected columns
10 [Ctrl][Shift]0 Display hidden columns in selection
11 [Ctrl][Page Down] Move to the next worksheet in a workbook
12 [Ctrl][Page Up] Move to the previous worksheet in a workbook
13 Arrow keys Move one cell up, down, left, or right
14 [Ctrl] and an arrow key Move to the edge of the data region
15 [Home] Move to the beginning of a row
16 [Ctrl][Home] Move to the beginning of a worksheet
17 [Ctrl][End] Move to the end of the used portion of a worksheet
18 [Enter] Move down a cell in a selected range
19 [Shift][Enter] Move up a cell in a selected range
20 [Shift][Tab] Move one cell to the left in a selected range
Excel programming
Microsoft Excel also provides Visual Basic for Applications (VBA), which deals with the programming aspects of VB. VBA allows spreadsheet manipulation, which is impossible to perform manually. We can even design attractive user interfaces through any tasks that can be performed easily. And for this, we just need to write the event-driven code
With Microsoft Excel, accounting and financial tasks can be performed very easily.
Consider a small example where a bank wants to calculate interest for its 10000 customers in such case, if one does it manually, it is really miserable, but with VBA macro, once the coding is done, it is performed easily.
The functions of VBA are:
- Built-in functions provided by VBA
- Excel’s own functions
- Custom functions that one may develop for use