
What are Add-ins in Excel?
An add-ins is an extension that adds more features and options to Microsoft Excel. Providing additional functions to the user increases the power of Excel. An add-in needs to be enabled for usage. Once enabled, it activates as Excel is started.
For example, Excel add-ins can perform tasks like creating, deleting, and updating the data of a workbook. Moreover, one can add buttons to the Excel ribbon and run custom functions with add-ins.
The Solver, Data Analysis (Analysis ToolPakExcel’s data analysis toolpak can be used by users to perform data analysis and other important calculations. It can be manually enabled from the addins section of the files tab by clicking on manage addins, and then checking analysis toolpak.read more), and Analysis ToolPak-VBA are some essential add-ins.
The purposes of activating add-ins are listed as follows: –
- To interact with the objects of Excel
- To avail an extended range of functions and buttons
- To facilitate the setting up of standard add-ins throughout an organization
- To serve the varied needs of a broad audience
In Excel, one can access several Add-ins from “Add-ins” under the “Options” button of the “File” tab. In addition, one can select from the drop-down “Manage” in the “Add-ins” window for more add-ins.
By default, it might hide some add-ins. One can view the unhidden add-ins in the “Data” tab on the Excel ribbonThe ribbon is an element of the UI (User Interface) which is seen as a strip that consists of buttons or tabs; it is available at the top of the excel sheet. This option was first introduced in the Microsoft Excel 2007.read more. For example, it is shown in the following image.
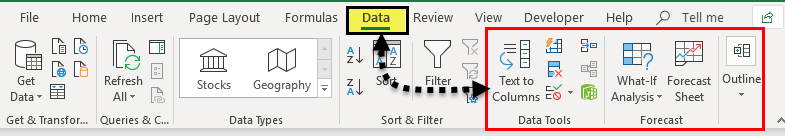
Table of contents
- What are Add-ins in Excel?
- How to Install Add-ins in Excel?
- Types of Add-ins in Excel
- The Data Analysis Add-in
- Create Custom Functions and Install as an Excel Add-in
- Example #1–Extract Comments from the Cells of Excel
- Example #2–Hide Worksheets in Excel
- Example #3–Unhide the Hidden Sheets of Excel
- The Cautions While Creating Add-ins
- Frequently Asked Questions
- Recommended Articles
How to Install Add-ins in Excel?
If Excel is not displaying the add-ins, they need to be installed. The steps to install Excel add-ins are listed as follows:
- First, click on the “File” tab located at the top left corner of Excel.

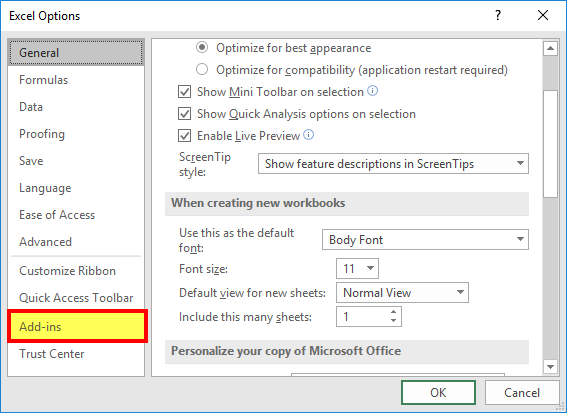
- Click “Options,” as shown in the following image.

- The “Excel Options” window opens. Select “Add-ins.”

- There is a box to the right of “Manage” at the bottom. Click the arrow to view the drop-down menu. Select “Excel add-ins” and click “Go.”

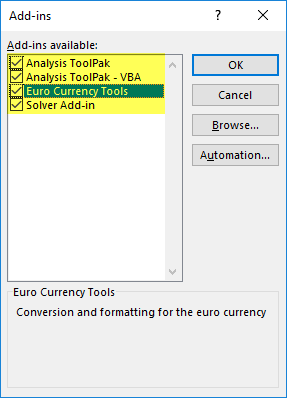
- The “Add-ins” dialog box appears. Select the required checkboxes and click “OK.” We have selected all four add-ins.

- The “Data Analysis” and “Solver” options appear under the “Data tab” of the Excel ribbon.


Types of Add-ins in Excel
The types of add-ins are listed as follows:
- Inbuilt add-ins: These are built into the system. One can unhide them by performing the steps listed under the preceding heading (how to install add-ins in Excel?).
- Downloadable add-ins: These can be downloaded from the Microsoft website (www.office.com).
- Custom add-ins: These are designed to support the basic functionality of Excel. They may be free or chargeable.
The Data Analysis Add-in
The “Data Analysis Tools” pack analyzes statistics, finance, and engineering data.

The various tools available under the “Data Analysis” add-in are shown in the following image.

Create Custom Functions and Install them as an Excel Add-in
Generally, an add-in is created with the help of VBA macrosVBA Macros are the lines of code that instruct the excel to do specific tasks, i.e., once the code is written in Visual Basic Editor (VBE), the user can quickly execute the same task at any time in the workbook. It thus eliminates the repetitive, monotonous tasks and automates the process.read more. Let us learn to create an add-in (in all Excel files) for a custom functionCustom Functions, also known as UDF (User Defined Functions) in Excel, are personalized functions that the users create through VBA programming code to fulfill their particular requirements. read more. For this, first, we make a custom function.
Let us consider some examples.
You can download this Excel Add-Ins Excel Template here – Excel Add-Ins Excel Template
We want to extract comments from specific cells of Excel. Then, create an add-in for the same.
The steps for creating an add-in and extracting comments from cells are listed as follows:
Step 1: Open a new workbook.
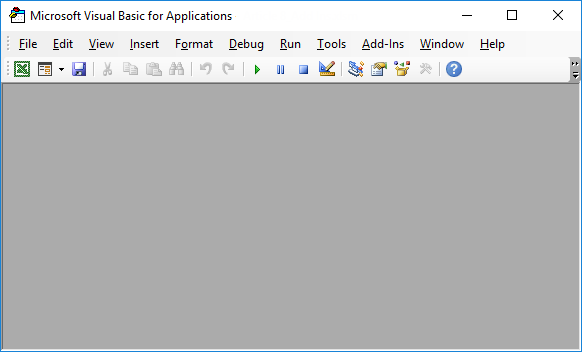
Step 2: Press the shortcutAn Excel shortcut is a technique of performing a manual task in a quicker way.read more “ALT+F11” to access the “Visual Basic Editor.” The following image shows the main screen of Microsoft Visual Basic for Applications.
Step 3: Click “Module” under the “Insert” tab, shown in the following image.

Step 4: Enter the following code in the “module” window.
Function TakeOutComment(CommentCell As Range) As String
TakeOutComment = CommentCell.Comment.Text
End Function

Step 5: Once the code is entered, save the file with the type “Excel add-in.”

Step 6: Open the file containing comments.
Step 7: Select ” Options ” in the “File” tab and select “Options.” Choose “Add-ins.” In the box to the right of “Manage,” select “Excel Add-ins.” Click “Go.”
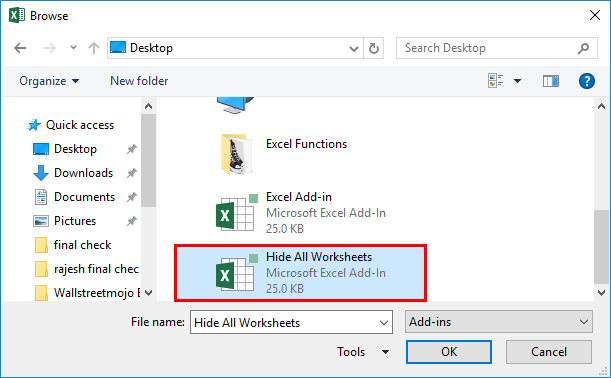
Click the “Browse” option in the “Add-ins” dialog box.

Step 8: Select the add-in file that had been saved. Click “Ok.”
We saved the file with the name “Excel Add-in.”

Step 9: The workbook’s name (Excel Add-in) that we had saved appears as an add-in, as shown in the following image.
This add-in can be applied as an Excel formula to extract comments.

Step 10: Go to the sheet containing comments. The names of three cities appear with comments, as shown in the following image.

Step 11: In cell B1, enter the symbol “equal to” followed by the function’s name. Type “TakeOutComment,” as shown in the following image.

Step 12: Select cell A1 as the reference. It extracts the comment from the mentioned cell.
Since there are no comments in cells A2 and A3, the formula returns “#VALUE!.”

Example #2–Hide Worksheets in Excel
We want to hide Excel worksheets except for the active sheet. Create an add-in and icon on the Excel toolbar for the same.
The steps to hide worksheets (except for the currently active sheet) and, after that, create an add-in and icon are listed as follows:
Step 1: Open a new workbook.
Step 2: In the “Visual Basic” window, insert a “Module” from the Insert tab. The same is shown in the following image.
Step 3: Copy and paste the following code into the module.
Sub Hide_All_Worksheets_()
Dim As Worksheet
For Each Ws In ActiveWorkbook.Worksheets
If Ws.Name <> ActiveSheet.Name Then
Ws.Visible = xlSheetVeryHidden
End If
Next Ws
End Sub

Step 4: Save this workbook with the type “Excel add-in.”
Step 5: Add this add-in to the new workbook. For this, click “Options” under the “File” tab. Select “Add-ins.” In the box to the right of “Manage,” select “Excel add-in” Click “Go.”
In the “Add-ins” window, choose “Browse.”

Step 6: Select the saved add-in file. Click “Ok.”
We have saved the file with the name “Hide All Worksheets.”
Step 7: The new add-in “Hide All Worksheets” appears in the “Add-ins” window.

Step 8: Right-click the Excel ribbon and select “Customize the Ribbon.”

Step 9: The “Excel Options” window appears. Click “Quick Access Toolbar.” Under the drop-down of “Choose commands from,” select “macrosA macro in excel is a series of instructions in the form of code that helps automate manual tasks, thereby saving time. Excel executes those instructions in a step-by-step manner on the given data. For example, it can be used to automate repetitive tasks such as summation, cell formatting, information copying, etc. thereby rapidly replacing repetitious operations with a few clicks.
read more.”
In the box following this drop-down, choose the name of the macro. Then, click “Add” followed by “OK.” The tasks of this step are shown with the help of black arrows in the following image.
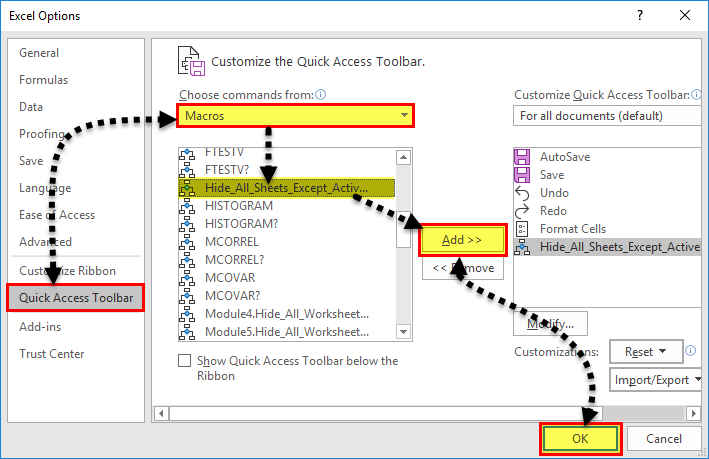
Step 10: A small icon appears on the toolbar. Clicking this icon hides all worksheets except for the currently active sheet.

Example #3–Unhide the Hidden Sheets of Excel
If we want to unhide the sheetsThere are different methods to Unhide Sheets in Excel as per the need to unhide all, all except one, multiple, or a particular worksheet. You can use Right Click, Excel Shortcut Key, or write a VBA code in Excel. read more hidden in the preceding example (example #2). Create an add-in and toolbar icon for the same.
The steps to unhide the sheets and, after that, create an add-in and toolbar icon are listed as follows:
Step 1: Copy and paste the following code to the “Module” inserted in Microsoft Visual Basic for Applications.
Sub UnHide_All_HiddenSheets_()
Dim Ws As Worksheet
For Each Ws In ActiveWorkbook.Worksheets
Ws.Visible = xlSheetVisible
Next Ws
End Sub

Step 2: Save the file as “Excel add-in.” Add this add-in to the sheet.
Right-click the Excel ribbon and choose the option “Customize the ribbon.” Then, in the “Quick Access Toolbar,” select “Macros” under the drop-down of “Choose commands from.”
Choose the macro’s name, click “Add” and “OK.” The tasks of this step are shown with the help of black arrows in the following image.
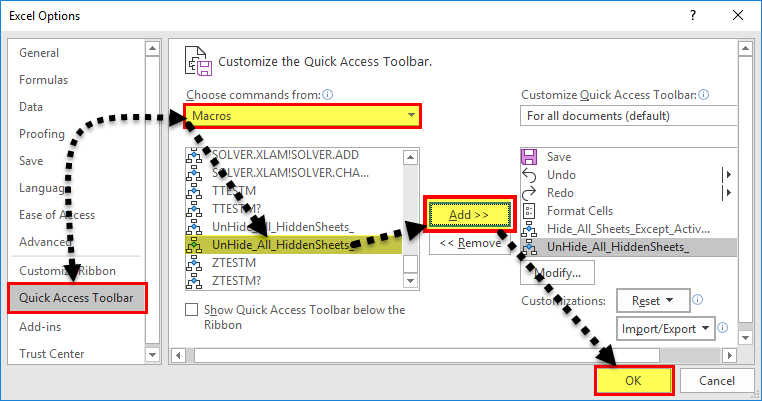
Step 3: Another icon appears on the toolbar. Clicking this icon unhides the hidden worksheets.

The Cautions While Creating Add-ins
The points to be observed while working with add-ins are listed as follows:
- First, remember to save the file in Excel’s “Add-in” extensionExcel extensions represent the file format. It helps the user to save different types of excel files in various formats. For instance, .xlsx is used for simple data, and XLSM is used to store the VBA code.read more of Excel.
- Be careful while selecting the add-ins to be inserted by browsing in the “Add-ins” window.
Note: It is possible to uninstall the unnecessary add-ins at any time.
Frequently Asked Questions
1. What is an add-in? where is it in Excel?
An add-in extends the functions of Excel. It provides more features to the user. It is also possible to create custom functions and insert them as an add-in in Excel.
An add-in can be created, used, and shared with an audience. One can find the add-ins in the “Add-ins” window of Excel.
The steps to access the add-ins in Excel are listed as follows:
a. Click “Options” in the “File” tab of Excel. Select “Add-ins.”
b. In the box to the right of “Manage,” select “Excel add-ins.” Click “Go.”
c. The “Add-ins” window opens. Click “Browse.”
d. Select the required add-in file and click “OK.”
Note: The add-ins already present in the system can be accessed by browsing. Select the corresponding checkbox in the “Add-ins” window and click “OK” to activate an add-in.
2. How to remove an Add-in from Excel?
For removing an add-in from the Excel ribbon, it needs to be inactivated. The steps to inactivate an add-in of Excel are listed as follows:
a. In the File tab, click “Options” and choose “Add-ins”.
b. From the drop-down menu of the “Manage” box, select “Excel add-ins.” Click “Go.”c.
c. In the “Add-ins” window, deselect the checkboxes of the add-ins to be inactivated. Click “OK.”
The deselected add-ins are inactivated. Sometimes, one may need to restart Excel after inactivation. It helps remove the add-in from the ribbon.
Note: Inactivation does not remove an add-in from the computer. For removing an inactivated add-in from the computer, it needs to be uninstalled.
3. How to add an Add-in to the Excel toolbar?
The steps to add an Add-in to the Excel toolbar are listed as follows:
a. In an Excel workbook, press “Alt+F11” to open the Visual Basic Editor. Enter the code by inserting a “module.”
b. Press “Alt+F11” to return to Excel. Save the file as “Excel add-in” (.xlam).
c. In File, select “Options” followed by “Add-ins.” Select “Excel add-ins” in the “Manage” box and click “Go.”
d. Browse this file in the “Add-ins” window. Select the required checkbox and click “OK.”
e. Right-click the ribbon and choose “Customize the Ribbon.” Click “Quick Access Toolbar.”
f. Select “Macros” from the drop-down of “Choose commands from.”
g. Choose the required macro, click “Add” and” OK.”
The icon appears on the toolbar. This icon works in all Excel workbooks as the add-in has been enabled.
Recommended Articles
This article is a step-by-step guide to creating, installing, and using add-ins in Excel. Here, we also discuss the types of Excel add-ins and create a custom function. Take a look at these useful functions of Excel: –
- What is the Quick Access Toolbar in Excel?
- “Save As” Shortcut in Excel
- Remove Duplicates in Excel
- How to Show Formula in Excel?
It is observed that over 50% of Excel users don’t use add-ins to save time or make their lives a little easier.


And we can’t blame them. Because they might be scared of coding or any technical complications. Here, we will talk about ChartExpo Add-in which is very easy to configure to create amazing visualizations.
Let’s dive in.
Table of Content:
- How to Add Excel Add-in: ChartExpo?
- How to access ChartExpo Add-in in Excel?
- Let’s Create Data Story With Excel Add-in ChartExpo:
Video Tutorial:
How to Add Excel Add-in: ChartExpo?
Note: If you are using excel version of 2013 make sure to install office service pack 1.
There are two ways to configure ChartExpo Excel Add-in:
- Directly from Microsoft App Store:
i. You can click here to install the ChartExpo add-in for your Excel application.
ii. Following page will appear in your browser, you can click on “Get it now” button to proceed with installation steps.

iii. Log in with your Microsoft account or create a new account.

iv. Now you will see a window which will ask you to enter your credentials.
v. After log in, another ChartExpo window will appear. Here you can provide the required information and click on “Continue” button. It will automatically add ChartExpo dd-in in your Excel application.

Now you can click on “Open in Excel” button to continue using this Add-in.

- Install From Excel Application
i. To get started, open your Excel application.
ii. Open the worksheet and click on the “Insert” menu.
iii. You’ll see the “My Apps”

iv. In office Add-ins window, click on “Store” and search for ChartExpo on my Apps Store.
v. Click on “Add” button to install ChartExpo in your Excel.

Once your ChartExpo is successfully installed now below you will learn how you can access and use it in Excel.
How to access ChartExpo Add-in in Excel?
- Click on the “Insert” menu on top toolbar.
- You’ll see the My Apps option as highlighted below.

- Select ChartExpo for Excel and click on the “Insert”

- The add-in will be added to the Excel application, as shown below but it will ask you to log in to continue.
- You can log in with your Microsoft account or Google account or create a new account in ChartExpo and start using the add-in.

- You’re only required to log in for the first time. Next time, ChartExpo won’t ask for log in again.

- Once ChartExpo is loaded. By default you will see list view of charts.

- Click on Category and you can access 6 different categories of charts by clicking on Category.

Voila! Your ChartExpo add-in is ready to use in your Excel application. You can explore all the charts available in this library and convert your data into amazing visualizations.
Why ChartExpo is a Favorite Library for 20,000+ Users?
ChartExpo is an Excel add-in that’s amazingly easy to use, especially when working with complex data.
We recommend this app because it has a free trial, and most importantly, it has advanced charts. Yes, it comes loaded with charts you’ll never see in your Excel, such as Sankey Diagrams, Word Cloud, and Gauge Chart, among others.
Its ultra-friendly user interface (UI) needs no video tutorial or a written manual to make its usage easier. And this means its learning curve is absolutely short. Yes, you read that right.
Look no further if you want to boost your productivity through the roof or save hours whenever working with complex data.
The last time we checked, ChartExpo had over 50-plus advanced charts you can use to create irresistible business reports and data stories.
And it gets better! This tool is incredibly light. So your Excel won’t crash or slow down, even when working with large data sets.
It creates a visual appeal: As humans are notorious for having an ever-shrinking attention span, ChartExpo can go a long way in communicating your results which boil down to creating a visual appeal to the end-user. The reality is that clients not only want to interact with hard numbers but also need to visualize the success story behind the results. ChartExpo helps users in combining elements of data, information, knowledge, and insights into a visual format that can be understandable by everyone.
Identify Trends Faster: The majority of human communication is visual as the human brain processes graphics magnitudes faster than it does text. Direct manipulation of analyzed data via ChartExpo makes it easy to understand and act on valuable information.
Identify Relationships More Effectively: ChartExpo enables users to identify otherwise overlooked cause-and-effect relationships throughout definable timeframes. This is especially useful in identifying how daily operations affect an organization’s goals.
Useful Data Storytelling: Humans best understand a data story when its development over time is presented in a clear, linear fashion. ChartExpo helps users to highlight relevant information, filter, and change the parameters promotes better understanding of the data by presenting multiple viewpoints of the data.
Simplify Complex Data: A large data set with a complex data story may present itself visually as a chaotic, intertwined hairball. ChartExpo can help untangle and make these messes of data more manageable, and can help users glean better insights.
Faster and easier access to important business insights:
ChartExpo can help businesses boost their ability to seek the information they need anytime, anywhere. And with the right solution, these businesses will be able to do so more efficiently than their competitors.
Visualizing your data helps quickly identify any errors in the data. If the data tends to suggest the wrong actions, ChartExpo help identify erroneous data when you try to visualize your data.
Let’s head to the data storytelling examples using our graph add-in for Excel: ChartExpo.
Let’s Create Data Story With Excel Add-in ChartExpo:
There are many charts available in this library. We will pick “Sankey Diagram” to convert your data into amazing visualization story.
Sankey Diagram
Sankey Diagrams (also known as Energy Flow Diagrams) are charts used to visualize data with flow-like attributes, such as energy flow, revenue flow, etc.
In other words, these charts depict the flow from one set of values to another. The widths of its arrows are proportional to the flow rate.
You can use this visualization to communicate sources and uses of the costs, materials, and resources represented.
Let’s take a look at an example with Sankey Charts.
Imagine you want to create a report data story of energy generation and usage of a country. You’ve collected secondary data from the country’s only power generation company. You intend to extract insights, such as the amount of energy wasted, domestic usage percentage, etc.
Let’s use the table below for our scenario.
| Energy Type | Main Source | Source Type | Energy Source | Usage | End-User | Megawatt |
| Agricultural waste | Bio-conversion | Solid | Thermal generation | Losses in process | Lost | 5 |
| Agricultural waste | Bio-conversion | Solid | Thermal generation | Electricity grid | Industry | 7.3 |
| Agricultural waste | Bio-conversion | Solid | Thermal generation | Electricity grid | Heating and cooling – commercial | 5.1 |
| Agricultural waste | Bio-conversion | Solid | Thermal generation | Electricity grid | Heating and cooling – homes | 3.7 |
| Agricultural waste | Bio-conversion | Solid | Thermal generation | Electricity grid | Lighting & appliances – commercial | 4.9 |
| Agricultural waste | Bio-conversion | Solid | Thermal generation | Electricity grid | Lighting & appliances – homes | 2 |
| Other waste | Bio-conversion | Solid | Thermal generation | Losses in process | Lost | 7.2 |
| Other waste | Bio-conversion | Solid | Thermal generation | Electricity grid | Industry | 5.4 |
| Other waste | Bio-conversion | Solid | Thermal generation | Electricity grid | Heating and cooling – commercial | 6.7 |
| Other waste | Bio-conversion | Solid | Thermal generation | Electricity grid | Heating and cooling – homes | 4.8 |
| Other waste | Bio-conversion | Solid | Thermal generation | Electricity grid | Lighting & appliances – commercial | 7.4 |
| Other waste | Bio-conversion | Solid | Thermal generation | Electricity grid | Lighting & appliances – homes | 2.5 |
| Marina algae | Bio-conversion | Solid | Thermal generation | Losses in process | Lost | 0.7 |
| Marina algae | Bio-conversion | Solid | Thermal generation | Electricity grid | Industry | 0.5 |
| Marina algae | Bio-conversion | Solid | Thermal generation | Electricity grid | Heating and cooling – commercial | 0.9 |
| Marina algae | Bio-conversion | Solid | Thermal generation | Electricity grid | Heating and cooling – homes | 0.5 |
Follow the simple and easy steps below to visualize your data using “Sankey Chart” in ChartExpo add-in for Excel.
- Click on Add-ins> ChartExpo > Insert > Sankey Chart

- Select data which available in the
- Click on Create Chart From Selection as shown.

- Your “Sankey Chart” should look like the one below.

You can add header, give different color to nodes, and change different properties of chart by clicking on “Edit Chart” button.

Now you will see pencil icons on the screen you can click on any icon to explore and change the properties accordingly.

FAQs:
How do you add Excel Add-ins?
- How to add Excel add-in step-by-step
- Click the File tab> Options> Add-Ins category.
- In the Manage box, click Excel Add-ins, and then click Go.
- Select the check box next to the add-in you want to activate in the Add-Ins Available box and click
What is a Microsoft Excel add-in?
An add-in is an application that increases more features and options to your Microsoft Excel spreadsheet. By providing additional functions, an add-in increases the power and reliability of the tool. Remember to enable your add-in for it to activate when Excel is started.
How do I enable add-ins in Excel 2016?
- Open a new Microsoft Excel worksheet.
- Select File > Options. When the Excel Options dialog box appears, click Add-Ins.
- In the Manage drop-down list, click Excel Add-ins and click Go.
- How to add Microsoft Excel add-ins made easy (using the steps above)
Wrap Up
Like we said, using graph add-ins for Excel will save you hours every day and supercharge your productivity. Besides, you’ll access pretty advanced charts and other functions you’ll never find in your beloved spreadsheet app.
How to add Excel add-ins does not have to be a struggle or even time-intensive. This blog is full of tips and strategies you should steal if you’re yet to get started with add-ins.
The Excel add-in we recommend to our readers is ChartExpo because it has a super-friendly user interface. Besides, it produces charts that are incredibly insightful and easy to read, even for non-technical audiences.
So whether you’re looking to create a compelling data story or get the most out of your data, ChartExpo add-in has everything you need.
Do you want to take your spreadsheet game to the next level?
Try ChartExpo today to supercharge your productivity and save a ton of time every day.
We all can admit that Microsoft Excel is the best tool in its class, but there are ways to improve it with some cool and free Excel add-ins from the store. Some of these add-ins do basic things, while others are more advanced. At the end of the day, though, we are certain the add-ins were going to list here will make using Microsoft Excel easier in certain situations.
We should point out that add-ins can be found everywhere on the web, but we will focus only on the ones located in the Office Add-ins store. We have chosen to go down this route to ensure that potential users are getting tools that are free from viruses and other problems.
Best free Microsoft Excel Add-ins
Here are some of the best Excel Add-ins. Data Analysis, Financial Modeling, etc. Professionals, Students, and Beginners will find them useful:
- iGlobe CRM Excel Reporting Tool
- Publisheet – Publish your sheets as web pages
- Symbols and Characters – Fast Symbol Lookup
- Functions Translator, a Microsoft Garage project
- Cryptosheets
- Excel Colorizer Add-in
- Random Sorter
- Microsoft Visio Data Visualizer
- Stock Quotes by ISIN
- Wikipedia
1] iGlobe CRM Excel Reporting Tool

OK, so what we have here is an add-in for every person who handles CRM data. We envision many CEOs taking advantage of the iGlobe CRM Excel Reporting Tool, but there’s a small catch. You’ll need to have iGlobe CRM Office 365, and once that is accomplished, you can move forward.
With this add-on, then, users can get a simple, better, and more accurate overview of your CRM data.
2] Publisheet – Publish your sheets as web pages

If you are that type of person who wants to publish your Excel spreadsheet on the web, you can use Publisheet to get it done with relative ease. Now, you will need to create a Publisheet account via the company’s website. Worry not because you can make use of the free plan, but it comes with a small caveat. You see, the free plan does not come with the ability to password-protect your pages.
3] Symbols and Characters – Fast Symbol Lookup
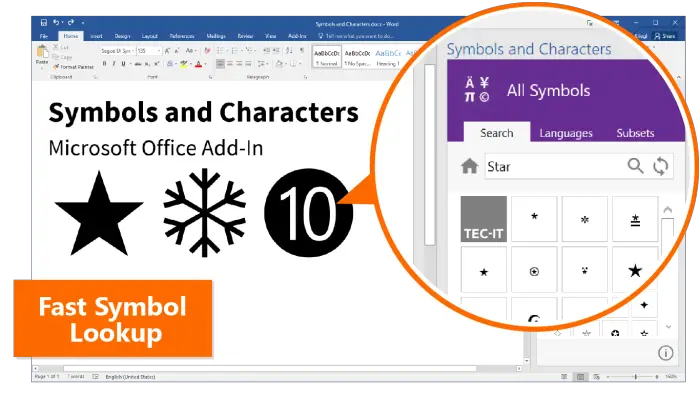
There may come a time when you want to add special characters and symbols to your Excel spreadsheet. Whenever that day comes, you will need to have the Symbols and Characters add-ins ready and waiting to go.
This add-in can suggest symbols based on your selection, or the user can manually search for what they want.
4] Functions Translator, a Microsoft Garage project

Users who want to translate functions to another language may have a difficult time if they are unable to speak the required language. But that’s not a problem no more with Functions Translator from Microsoft.
According to the software giant, Functions Translator can do the following:
- Enables you to translate all functions between all supported languages
- Enables you to translate complex formulas between all supported languages
- Provides you with bi-lingual dictionaries with function definitions (in English) for function lookup
- Enables you to give feedback on translations
To find out how well it works, try the add-in for yourself.
5] Cryptosheets
Want to track your cryptocurrency portfolio but are unwilling to do it manually? You may want to give Cryptosheets a test drive. This add-in for Microsoft Excel can collect and showcase real-time historical data from hundreds of sources on the web.
The tool does all the hard work, which means, the user doesn’t need to have programming skills in any shape or form.
6] Excel Colorizer Add-in
Adding color to a spreadsheet is a popular way to beautify a workbook. Now, we must admit that Excel has a built-in color feature, but the Colorizer add-in will make beautification much easier than before, especially if you’re not an expert.
7] Random Sorter
Have you ever felt the need to shuffle around cells and columns without losing data integrity? Well, you’re in the right place because we would like to recommend a Microsoft Excel add-in that goes by the name, Random Sorter.
Should the need arise, users can mix cells within rows or columns with ease. Folks can also choose to put all selected cells at random if they want to.
Here are some of the things you can do with Random Sorter right now if you choose to download it to your computer:
- Shuffle values within the selected rows or the columns
- Randomly mix entire rows
- Place entire columns at random
- Simply shuffle all cells within the selected range
When this add-in is in use, please consider that any formula within your range will be forcefully overwritten with values.
8] Microsoft Visio Data Visualizer
With the Visio Data Visualizer add-in for Excel, users can create quality Visio flowcharts, organization charts, and cross-functional flow charts directly from your Excel data. All you have to do is select a diagram, edit the linked data, and finally, refresh the add-in to have a look at your visualized data via a polished Visio diagram.
9] Stock Quotes by ISIN
If you want to get stock prices from international stock markets from within Microsoft Excel, then you should consider downloading the Stock Quotes by ISIN add-in. The developer says the quotes can be embedded anywhere in a workbook. Furthermore, updates are done each time the file is opened.
10] Wikipedia
Excel users who want to access Wikipedia data directly from within their workbook will find this official Wikipedia add-in quite useful. In fact, it is not only available for Excel but also for Microsoft Word and other Office tools as well.
Read: How to collapse the Ribbon automatically in Word, Excel, PowerPoint
What is Microsoft Excel Add-ins?
An Excel add-in is very similar to a browser extension. Download and add it to the program in a bit to give Excel additional functionality. Once you’ve installed the add-in, the features it brings to the table can now be accessed by any workbook.
Where to find the Excel add-ins Store?
To find the Excel add-ins section, you must click on the Insert tab. From there, look for the Add-ins section and select Get Add-ins. A small window will appear showcasing the Store and a list of add-ins to choose from.
Предыстория
Все началось около четырех лет назад. Работая над очередным проектом по автоматизации бизнес-процессов для крупной российской сети розничной торговли, я заинтересовался разработкой надстроек для офисных приложений, в частности, для Excel. Стоило мне несколько дней понаблюдать, как сотрудники компании-заказчика тратят уйму времени на рутинные повторяющиеся операции, как у меня появилось множество идей о том, как бы я мог упростить им жизнь.
В то время, у нас, как у разработчиков, было два способа «расширить» Excel под нетиповые задачи:
- VBA (Visual Basic for Applications);
- VSTO (Visual Studio Tools for Office).
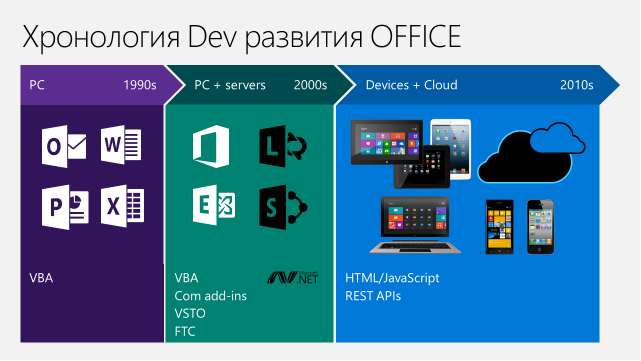
Думаю, всем разработчикам надстроек для Excel хорошо известны преимущества и недостатки обоих подходов. Большим преимуществом и того, и другого является очень богатое API, позволяющее автоматизировать практически любые задачи. К недостаткам же стоит отнести сложности в установке подобных расширений. Особенно это касается надстроек на базе VSTO, где, зачастую, для инсталляции требуются административные права, получение которых может быть проблематичным для конечных пользователей.
По ряду причин, обсуждение которых выходит за рамки данной статьи, я выбрал для себя вариант с VSTO. Так родилась наша первая надстройка для Microsoft Excel — XLTools. В первую версию продукта вошли инструменты, позволяющие:
- производить очистку данных в ячейках Excel (удалять лишние пробелы и непечатные символы, приводить регистр к единому виду, и т.д.);
- преобразовывать таблицы из «двумерного вида» в «плоский» (unpivot);
- сравнивать данные в столбцах;
- инструмент для автоматизации всех вышеперечисленных действий.
Появление Office Store
Буквально через год после выхода в свет первой версии надстройки XLTools, мы узнали, что Microsoft запускает новую платформу для продвижения расширений под Office – Office Store. Моя первая мысль – а можем ли мы опубликовать там нашу новую надстройку XLTools? Может к сожалению, а может к счастью, но ответ на этот вопрос – НЕТ. Ни VBA, ни VSTO надстройки не могут быть опубликованы в Office Store. Но стоит ли расстраиваться? К счастью, и здесь ответ – НЕТ, не стоит. Далее я объясню – почему.
Новая концепция Add-Ins для Office
Что же такое Office Store и для чего он нам нужен? Если кратко, то это платформа, которая помогает пользователям и разработчикам искать, скачивать, продавать и покупать надстройки, расширяющие стандартный функционал Office-программ, будь то Excel, Word, Outlook, OneNote или PowerPoint. Если раньше конечным пользователям приходилось искать нужные им надстройки в поисковиках, то сейчас для этого создано единое место – Office Store, доступ к которому возможен прямо из интерфейса офисных программ. Пункт меню «Вставка» -> «Мои надстройки»:

Как мы уже выяснили, опубликовать надстройки, разработанные с использованием VBA или VSTO, в Office Store не получится. С выходом Office 365 и Office Store, Microsoft предложила нам новый способ разработки надстроек с использованием JavaScript API для Office, подразумевающий разработку приложений с использованием веб-технологий, таких как HTML5, CSS, JavaScript и Web Services.
Новый подход обладает как преимуществами, так и недостатками. К преимуществам можно отнести:
- Простоту установки надстроек из Office Store;
- Кроссплатформенность из коробки (Excel 2013/2016, Excel Online, Excel for iPad);
- Возможность использования накопленного опыта веб-разработки (нет необходимости изучать новые технологии, если в команде уже есть веб-разработчики);
- Готовая инфраструктура, позволяющая продавать надстройки по фиксированной цене или по подписке.
Из недостатков нового подхода могу выделить только один, правда, пока, довольно весомый:
- Менее богатое API по сравнению с VSTO и VBA (надеюсь, эта проблема будет становиться все менее и менее актуальной с выходом новых версий API).
Разработка надстроек для Excel «по новым правилам»

Итак, с чего же начать, если мы хотим идти в ногу со временем и не упустить новую волну приложений для Office?
Есть два варианта. На текущий момент, разрабатывать приложения на базе JavaScript API мы можем в:
- Napa – легковесная веб-версия среды разработки для быстрого старта. Будет полезна разработчикам, у которых нет Visual Studio, или тем, кто хочет разрабатывать под операционной системой, отличной от Windows;
- Visual Studio, начиная с версии 2012, с установленным пакетом Office Developer Tools – более мощная и функциональная среда разработки. Те, кто раньше разрабатывал под VSTO, могут сразу начинать с этого варианта, т.к. Visual Studio у них уже есть.
В данной статье мы рассмотрим разработку с использованием Visual Studio, т.к. сам я использую именно ее. Если Вам интересно попробовать Napa, то ознакомиться с этим инструментом и начать работу с ним можно здесь.
Перед началом разработки стоит также обратить внимание на пару существенных отличий VBA/VSTO надстроек от надстроек для Office Store:
- Первое отличие заключается в том, что, разрабатывая надстройки на VBA или VSTO, мы могли создавать так называемые «пакетные» продукты, в состав которых входил целый ряд функций. XLTools является отличным примером – надстройка включает в себя множество опций для работы с ячейками, таблицами, столбцами, и т.д. При разработке надстроек для Office Store о таком подходе придется забыть. Планируя разработку, мы должны задуматься над тем, какие именно законченные, изолированные друг от друга функции мы хотим предоставить конечным пользователям. В случае с XLTools, те функции, которые изначально были реализованы в одной надстройке, сейчас представлены пятью отдельными приложениями в Office Store. Такой подход позволяет сделать решения более узконаправленными и повысить количество скачиваний надстроек целевыми пользователями;
- Второе отличие заключается в разнице между JavaScript API и VSTO/VBA API. Здесь стоит детально изучить возможности, предоставляемые JavaScript API. Для этого советую воспользоваться приложениями API Tutorial (Task Pane) и API Tutorial (Content) от Microsoft.
Разработка надстройки для Excel c использованием Visual Studio и JavaScript API
По умолчанию в Visual Studio есть предустановленные шаблоны проектов для разработки надстроек под Office Store, поэтому создание нового проекта занимает буквально секунды.
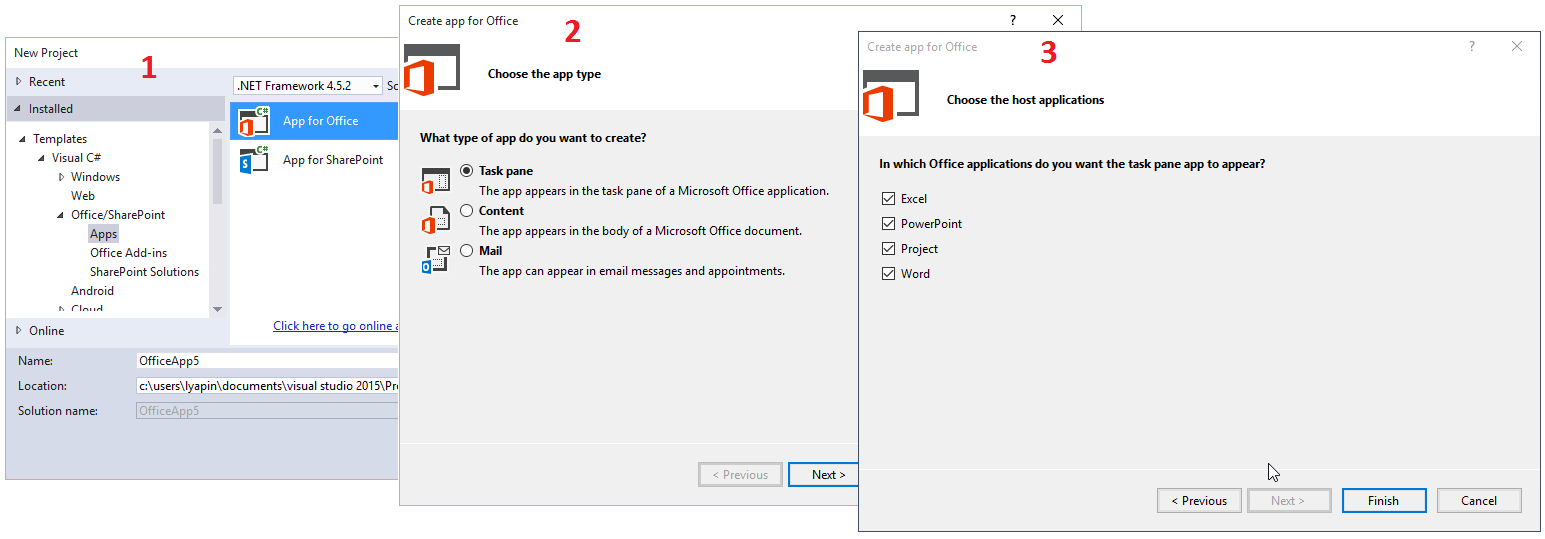
Сам проект состоит из файла-манифеста и веб-сайта. Файл манифеста выглядит так:
<?xml version="1.0" encoding="UTF-8"?>
<OfficeApp xmlns="http://schemas.microsoft.com/office/appforoffice/1.0" xmlns:xsi="http://www.w3.org/2001/XMLSchema-instance" xsi:type="TaskPaneApp">
  <Id>11111111-1111-1111-1111-111111111111</Id>
  <Version>1.0.1</Version>
  <ProviderName>WavePoint Co. Ltd.</ProviderName>
  <DefaultLocale>en-US</DefaultLocale>
  <DisplayName DefaultValue="XLTools.net Data Cleaning for Excel" />
  <Description DefaultValue=" Clean bulk data fast: remove extra spaces, change text case, convert text format to numbers, etc."/>
  <IconUrl DefaultValue="~remoteAppUrl/App/DataCleansing/Images/Logo32.png"></IconUrl>
  <SupportUrl DefaultValue="http://xltools.net/excel-apps/data-cleaning-app/"></SupportUrl>
  <Capabilities>
    <Capability Name="Workbook" />
  </Capabilities>
  <DefaultSettings>
    <SourceLocation DefaultValue="~remoteAppUrl/App/DataCleansing/Home.html" />
  </DefaultSettings>
  <Permissions>ReadWriteDocument</Permissions>
</OfficeApp>
Основное, что нужно отметить в этом файле:
- Id – должен быть уникальным для каждого приложения;
- Version – должна совпадать с версией, указываемой при публикации надстройки через Seller Dashboard (личный кабинет вендора/разработчика, через который осуществляется все управление надстройками, публикуемыми в Office Store);
- IconUrl и SupportUrl – ссылки должны быть работающими и указывать на расположение картинки-логотипа и страницы с описанием функционала надстройки. В случае, если ссылки будут указаны неверно, манифест не пройдет проверку при публикации через Seller Dashboard;
- Permissions – определяет уровень доступа надстройки к данным документа. Может принимать такие значения как Restricted, Read document, Read all document, Write document, Read write document;
- SourceLocation – путь к «домашней» странице приложения на веб-сайте.
Веб-сайт состоит из минимального набора HTML, JavaScript и CSS файлов, необходимых для работы приложения, и по умолчанию предоставляет базовый UI, на основе которого мы можем строить UI для нового решения. Стоит отметить, что одним из требований к сайту является работа по HTTPS. Это означает, что в случае публикации сайта на собственных серверах или на собственном домене, Вам потребуется SSL сертификат. В случае, если Вы планируете использовать, к примеру, Azure Website, этой проблемы можно избежать, т.к. все сайты, развернутые на поддомене azurewebsites.net, по умолчанию доступны как по протоколу HTTP, так и протоколу HTTPS.
Для взаимодействия с данными Excel в JavaScript API предусмотрен стандартный набор методов. Приведу примеры использования лишь некоторых, из числа тех, которые мы использовали при разработке надстройки «XLTools.net Очистка данных»:
- Добавление «привязки» к выбранному пользователем диапазону ячеек в Excel для дальнейшей работы с ними:
Office.context.document.bindings.addFromPromptAsync(Office.BindingType.Matrix, {
            id: "RangeToClean"
        }, function (asyncResult) {
            if (asyncResult.status == "failed") {
                    // Some specific code here
            }
            else {
                    // Some specific code here
            }
        });
- Получение данных из диапазона ячеек с использованием ранее созданной «привязки»:
Office.select("bindings#RangeToClean", onBindingNotFound).getDataAsync(
            {},
            doDataCleaning
        );
- Обновление данных в диапазоне ячеек с использованием ранее созданной «привязки»:
Office.select("bindings#RangeToClean").setDataAsync(range,function (asyncResult) {
            if (asyncResult.status == "failed") {
                    // Some specific code here
            }
            else {
                app.showNotification(UIText.ExecutedSuccessfully, '', 'success');
            }
        }).
Все методы JavaScript API хорошо документированы, их подробное описание можно посмотреть на сайте MSDN.
В зависимости от сценария, обработка данных может происходить как непосредственно на клиенте, т.е. в JavaScript-коде, так и на сервере. Для обработки данных на сервере можно добавить нужные сервисы прямо на сайт, к примеру, с использованием Web API. Общение клиента (надстройки) с веб-сервисами происходит так же, как мы привыкли это делать на любом другом сайте – при помощи AJAX-запросов. Единственное, что нужно учитывать – если Вы планируете использовать сторонние сервисы, расположенные на чужих доменах, то непременно столкнетесь с проблемой same-origin policy.
Публикация надстройки в Office Store
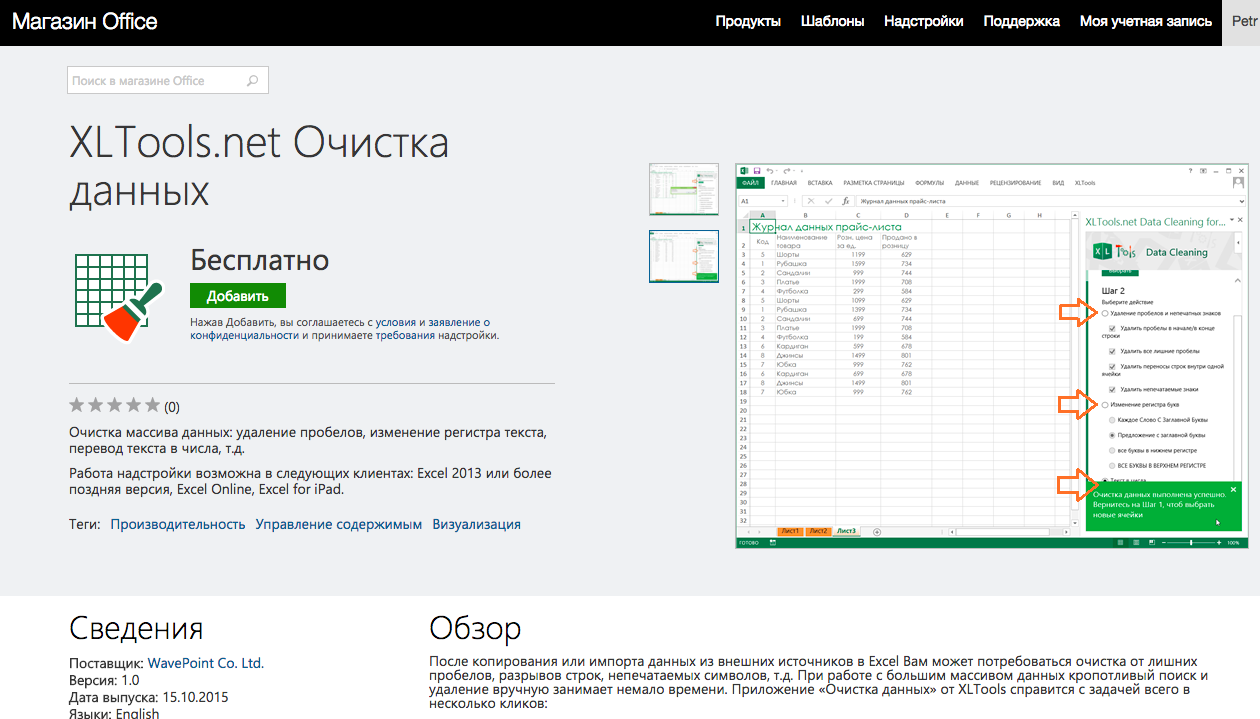
Для публикации надстройки в Office Store Вам необходимо зарегистрироваться на сайте Microsoft Seller Dashboard. После регистрации Вы получите доступ к личному кабинету, где сможете загрузить манифест Вашего приложения и заполнить всю необходимую информацию о нем. Исходя из личного опыта, могу сказать, что проверка приложения после отправки на утверждение занимает обычно от одного до трех рабочих дней. После проверки приложения сотрудниками Microsoft и его одобрения, оно становится доступно для скачивания миллионам пользователей по всему миру через Office Store:
Выводы
В заключение стоит сказать, что надстройки XLTools являются отличным примером того, как можно трансформировать существующие решения на базе технологий VBA/VSTO в кроссплатформенные решения для Office 365. В нашем случае, мы смогли перенести в Office Store добрую половину функций из Desktop-версии XLTools, реализовав шесть отдельных приложений.
Все они в настоящий момент доступны для скачивания через Office Store:
- XLTools.net SQL запросы — выполнение SQL запросов к данным в таблицах Excel;
- XLTools.net CSV Export for Excel — позволяет сохранить таблицу в Excel, как CSV файл с указанием нужного разделителя: запятая, точка с запятой или tab;
- XLTools.net Очистка данных — очистка массива данных: удаление пробелов, изменение регистра текста, перевод текста в числа, т.д.;
- XLTools.net Unpivot Table for Excel — помогает пользователям Excel трансформировать сложные двумерные таблицы в плоский вид;
- XLTools.net Отчёты SendGrid — выгрузка отчетов о доставке из аккаунта SendGrid в Excel;
- XLTools.net Columns Match — сравнение столбцов, поиск столбцов с одинаковыми данными, расчет процента соответствия данных в столбцах.
Так же хотелось бы отметить, что помимо привычных сценариев, с появлением Office Store и Office 365, у нас, как у разработчиков, появились новые возможности по разработке расширений с использованием Office 365 API, позволяющего получить доступ к данным таких сервисов как Mails, Calendars, SharePoint Online, OneDrive for Business и т.д. Кто знает, что мы сможем построить завтра с использованием этих возможностей. Время покажет!

Об авторе
Петр Ляпин -Технический директор ООО «ВейвПоинт»
Более 10 лет опыта внедрения проектов по автоматизации
бизнес-процессов. Работал со множеством российских и
зарубежных компаний. Основатель проекта XLTools.net.
An Excel add-in can be really useful when you have to run a macro often in different workbooks.
For example, suppose you want to highlight all the cells that have an error in it, you can easily create an Excel add-in that will highlight errors with a click of a button.
Something as shown below (the macro has been added to the Quick Access Toolbar to run it with a single click):

Similarly, you may want to create a custom Excel function and use it in all the Excel workbooks, instead of copy pasting the code again and again.
If you’re interested in learning VBA the easy way, check out my Online Excel VBA Training.
Creating an Excel Add-in
In this tutorial, you’ll learn how to create an Excel add-in. There are three steps to create an add-in and make it available in the QAT.
- Write/Record the code in a module.
- Save as an Excel Add-in.
- Add the macro to the Quick Access Toolbar.
Write/Record the Code in a Module
In this example, we will use a simple code to highlight all the cells that have error values:
Sub HighlightErrors()
 Selection.SpecialCells(xlCellTypeFormulas, xlErrors).Select
 Selection.Interior.Color = vbRed
End Sub
If you are writing code (or copy-pasting it from somewhere), here are steps:
Note: If you are recording a macro, Excel automatically takes care of inserting a module and putting the code in it.
Now let’s go ahead and create an add-in out of this code.
Save and Install the Add-in
Follow the below steps when you are in the workbook where you have inserted the code.
Now the add-in has been activated.
You may not see any tab or option appear in the ribbon, but the add-in gets activated at this stage and the code is available to be used now.
The next step is to add the macro to the Quick Access Toolbar so that you can run the macro with a single click.
Note: If you are creating an add-in that has a custom function, then you don’t need to go to step 3. By the end of step 2, you’ll have the function available in all the workbook. Step 3 is for such codes, where you want something to happen when you run the code (such as highlight cells with errors).
Save and Install the Add-in
To do this:
Now to run this code in any workbook, select the dataset and click on the macro icon in the QAT.
This will highlight all the cells with errors in red color. You can also use this macro in any workbook since you have enabled the add-in.
Caution: The changes done by the macro can’t be undone using Control + Z.
You can also create custom functions and then save it as an Excel add-in. Now, when you enable the add-in, the custom functions would be available in all your Excel workbooks.
You May Also Like the Following Excel Tutorials:
- Working with Cells and Ranges in Excel VBA.
- Working with Worksheets in VBA.
- Working with Workbooks in VBA.
- Using Loops in Excel VBA.
- Using IF Then Else Statement in Excel VBA.
- How to Create and Use Personal Macro Workbook in Excel.
- Useful Excel Macro Code Examples.
- Using For Next Loop in Excel VBA.
- Excel VBA Events – An Easy (and Complete) Guide.
- Excel VBA Error Handling
Excel is by far the most used application for data analysis, and mastering it is a must-have skill in many companies. It can also be a huge time-saver: an Excel master can be tens or hundreds of times more productive than a beginner. And add-ins can play a significant role in improving your efficiency with Excel, bring you the tools you need to perform well.
What is an Excel add-in?
Excel add-ins are small programs that can be installed to enhance the capabilities of Microsoft Excel by adding new custom features.
There are hundreds of Excel add-ins on the market, covering a wide range of functions.
In this post, we list and describe over 75 add-ins, plugins and apps that complement Microsoft Excel with additional features and options to be even more productive and impress with your abilities with Excel. Some of them are free and some are not, but each of them perform tasks that can greatly help you becoming an Excel rock star.
What are the best Excel add-ins?
Here are 75 of the best add-ins for Microsoft Excel (free or not):
-
Power-user
-
Tableau desktop
-
F9
-
Excel Stock Market Functions
-
Kutools
-
Advanced Formula Environment
-
PowerPivot
-
XLGL
-
ASAP Utilities
-
MonteCarlito
-
Intis Telecom
-
Analystix Tools
-
People Graph
-
Analysis ToolPack
-
Solver
-
Power Query
-
StatPlus:mac
-
FRED
-
Simtools
-
Formlist
-
NXPowerLite Desktop 8
-
Jensen
-
Anomaly Server
-
XLSTAT
-
Operis Analysis Toolkit (OAK)
-
Table Analysis Tools and Data Mining Client
-
Dose
-
Supply Chain add-in
-
Office Tabs
-
ParallelDots
-
vIcons
-
Random Number Generator
-
Random Sorter
-
Audit Tickmark Toolbar
-
QR4Office
-
Geographic Heat Map
-
Password Recovery
-
Ultimate Suite
-
Lucidchart
-
Supermetrics
-
GIGRAPH Network Visualization
-
Selection Diff Tool
-
XY Chart Labeler
-
Hoadley Finance
-
ModernCharts
-
Microsoft Dynamics
-
Risk Analyzer
-
Panel Chart
-
BulkQuotesXL Pro
-
Vertex42 Templates Gallery
-
Model Analyzer
-
Weather by Visual Crossing
-
Spreadsheet123
-
Capital Budgeting
-
Inventory
-
Bubbles
-
Excellent Analytics
-
SEOTools
-
SEOGadget
-
Checkbook Assistant
-
Loan Assistant
-
Flash Card Assistant
-
ActiveData
-
Mekko Chart Creator
-
Conditional Row Delete
-
Power Utility Pack
-
Exchange rates
-
Mini Calendar and Date Picker
-
Favorite Bookmarks
-
Functions Translator
-
RDBmail
-
Intrinio
-
Excel training and tips
-
Power Reconcile
-
Microsoft Flow for Excel
1. Power-user
Power-user is an add-in for Excel, PowerPoint and Word. It has dozens of impressive features designed for anyone who use the Office Suite on a frequent basis:
-
Ability to create new charts like Mekko and Sankey charts,
-
Robust Excel-PowerPoint links,
-
Powerful new functions like SumColor, CountColor, CountVisible, IsFormula, IsMerged, LastCell, LastRowNumber, LastColumnNumber, SumFromAllSheets, VlookupMax, SlicerItems, CAGR, etc.
-
Copy and paste visible cells only,
-
UnPivot a crosstab table, changing it into a database,
-
Quickly format numbers, currencies and dates in Excel,
-
Tools to clean your data from merged cells, remove empty cells or simplify formulas
-
Swap the position of cells or charts,
-
Easily format your tables with horizontal or vertical borders,
-
…and more!
But Power-user also brings amazing new features for PowerPoint and Word:
-
A rich library of 700 beautiful PowerPoint templates,
-
350 editable maps,
-
7,000 vector icons and flags,
-
1+ million high-quality pictures,
-
Dashboard tools such as Gauges, traffic lights, Harvey balls, etc.
-
Value chains, circular, relationship or pyramid diagrams,
-
An automatic Agenda builder,
-
A robust link to easily connect PowerPoint charts and tables to Excel data
-
Waterfall, Mekko, Sankey, Tornado or Gantt charts,
-
… powerful formatting tools to align titles, harmonize fonts or colors, clean a presentation, edit multiple charts, align or move shapes, change languages, etc.!
Click to watch the demo video of Power-user:
2. Tableau Desktop — $999 to $1,999
Tableau is a data visualization add-in. You have to start by connecting it to your data. It can come from an Excel spreadsheet, but also from one of the data sources provided with the add-on. Then you start creating reports or dashboards by using drag and drop on the Tableau work space. Tableau claims its software is one of the fastest on the market; a well-created Tableau report should allow to quickly filter or zoom on part of the data to answer a specific question. Tableau is available on both Windows and iOS.

3. F9 — On quotes only
F9 allows you to work on your accounting data, preparing and distributing financial reports to a group of contacts throughout your organization. Some of your data can be linked between Excel and your accounting system. F9 is available on working on PC only, for versions 2003 to 2019, but not on Mac iOS.
4. Excel Stock Market Functions — Free
This add-in provides new user-defined functions that can be used to retrieve stock markets data from the web directly into Excel. Using these functions, you can for instance download the market capitalization of a company by entering its market symbol, the dates of the period and the frequency of the quotes (ex: daily). This add-in is ideal to build a dashboard of your personal portfolio, and then just refresh it on a regular basis. Excel Stock Market Functions is available on Windows only.
5. Kutools — $39
Kutools provides a very large number of little tools and Excel functions that can turn out useful time-savers in several situations. The cons of this add-in is that is has a lot of features, but a large numbers of them you will probably never use. The pros is that several tools can be really useful, such as the possibility to paste data only to visible cells, to count cells by colors or to combine sheets. Kutools works with Excel 2007 to 2019 on PC.

6. Advanced Formula Environment — Free
This Excel add-in is provided by Microsoft itself. It offers a new, modernized environment for writing named formulas and Lambda functions. Compared to the usual formula bar, it allows syntax highlighting, inline errors, comments and formatting. It’s also perfect for importing Lambda functions. The app works with Microsoft Excel 2013 and later on PC, Mac or the web.

7. PowerPivot — Free
PowerPivot is a Microsoft add-in designed to turn Excel into a business intelligence software. Basically, PowerPivot could be described as «Microsoft Access for dummies». You can build tables with relationships that will be much faster than the time-consuming classical VLOOKUP function in Excel. However our personal experience with PowerPivot is that it still lacks stability and it often causes Excel files to be corrupt… Since Excel 2013, PowerPivot is built-in and doesn’t need to be downloaded. You can activate it like any add-in. For prior versions of Excel, you need to download it from the Microsoft website.
8. XLGL — $299
XLGL is an accounting and reporting tool that fetches data from accounting software Sage to update Excel spreadsheets. GL stands for the accounting term General Ledger. Using XLGL, you can use formulas to work with updated data on customer orders, employee hours, inventories, etc. It is also provided with report layouts. XLGL works on PC with Excel version 2007, 2010, 2013, 2016 and 2019.
9. ASAP Utilities — $49
ASAP Utilities is an Excel add-in focusing on saving time. Although many features are not rocket-science, some are interesting like the possibility to sort tabs alphabetically or by color, or the tool to insert cells before or after each cell in the selection. ASAP is one of the only add-ins available starting with Excel version 2000 and works with every version on PC up to Excel 2019.
10. MonteCarlito — Free
As the name suggests, MonteCarlito is designed to run Monte-Carlo simulations in Excel, as well as other statistical analysis to compute mean, median, standard error, variance, skewness, kurtosis, etc. It is quite an old and simple add-in, but MonteCarlito works with both Windows and Mac iOS versions of Excel.

11. Intis Telecom — FREE
The Intis Telecom plugin allows you to send SMS directly from Excel. Select a range with phone numbers in your spreadsheet and the plugin will send them the SMS of your choice. The plugin is free but requires to purchase credits to send SMS. Intis Telecom is compatible with Excel 2003 to 2019 on PC. It is not available on Mac.
12. Analystix Tools — Free
Analystix provides a free Excel add-in meant for financial analysis. It includes tools to calculate CAGR, WACC (weighted average cost of capital), Black & Scholes formula, as well as an histogram builder to visualize distribution and a date arranger. Analystix Tools works on Excel 2010 and later on PC.
13. People Graph — Free
This plugin lets your create and update people graphs, a typical tool for infographics. This add-in works on PC with Excel 2013 to 2019, on Excel 2016 for Mac, Excel Online and Excel for iPad.

14. Analysis ToolPack — Free
The Analysis ToolPack is a Microsoft add-in that allows statistical analysis such as correlation analysis, descriptive statistics or histograms. It is provided on every computer using Excel 2007 and later, Mac or PC. You just need to load the add-in.
15. Solver — Free
The Solver is a tool that is also provided by Microsoft with Excel 2007 and later. It can be used for what-if analysis, to find optimal value for a formula in a cell under constraints limiting other formula cells. Basically, the Solver will determine the maximum or minimum value that a formula can take while changing several other cells.
16. Power Query — Free
This Microsoft add-in is made to help access and explore data in Excel like with Business Intelligence tools, by allowing to import, transform or combine multiple data sources. Power Query requires Excel 2010 or 2013 on Windows.

17. StatPlus:mac — €189
StatPlus:mac is one of the very few Excel add-ins for statistics that works on Mac. It is a statistical analysis package allowing to analyze correlations, run regressions, time series or data processing analysis, to create statistical charts, etc. StatPlus is actually available on both PC (2007 to 2019) and Mac (2004 to 2016).

18. FRED — Free
Provided by the Federal Reserve Bank of St Louis, this free add-in provides access to macroeconomic data from multiple sources such as the BEA, OECD, BLS or Census. Time series can be inserted into Excel with a few clicks, and you can then automatically calculate growth rate or change the data frequency. You can even refresh your spreadsheet with the most up to date data and see your entire dashboard adapt to it. The FRED add-in works with Excel 2010 and 2013.
19. Simtools — Free
Simtools adds 32 statistical functions to perform Monte Carlo simulations and risk analysis in Excel spreadsheets. Functions cover cumulative probability, correlations among random variables, decision analysis, analyzing discrete probability distributions, regression analysis, or random generation of discrete distributions. Simtools works on PC with Excel 2003 and later.
20. Formlist — Free
Formlist is an auditing tool that provides procedure for displaying the formulas of any selected range of cells in Excel. It is a very simple add-in with limited possibilities, but it’s free, and it works on Excel 2003 and later for PC.
21. NXPowerLite Desktop 8 — $50
Not exclusively for Excel but working with PowerPoint, Excel, and Word, as well as JPEG or PDF files, NXPowerLite compresses files and optimize them for screen, print or mobile devices. It can also automatically compresses your email attachment files, a feature that you can also temporarily disable if you don’t want it. NXPowerPointLite does not work on Mac iOS.
22. Jensen — Free
Jensen has actually created multiple Excel add-ins performing various tasks, mainly for statistics analysis purposes. One is for Markov analysis, one for random variables, one for decision analysis, one for simulation, etc. These add-ins are quite old and were designed for Excel 2003 on Windows.
23. Anomaly Server — Free
This tool helps you identify anomalies and outliers in a data set. the US directly into Excel from data.gov. This Excel tool works with Excel 2016 and up for PC and Mac, as well as with Excel Online.
24. XLSTAT — $235 to $940
XLSTAT works as an add-on with about 100 features for advanced statistical analysis: linear or non-linear regressions, k-means, principal component analysis, etc. XLSTAT is highly compatible, working on PC for version 97 up to 2019 and on Mac with Excel 2011 and 2016.

25. Operis Analysis Toolkit (OAK) — £311.66
This Excel add-in aims at helping you understand complex spreadsheets and reduce the risk of errors. The main features are a workbook summary, a spreadsheet structure map, a formula walker and other solutions to compare, audit and search Excel workbooks. OAK is compatible with Excel on Windows, but not with Mac iOS.

26. Table Analysis Tools and Data Mining Client — Free
These 2 add-ins for Excel are provided by Microsoft for data mining. Table Analysis Tools for Excel leverages SQL Server 2012 data mining models from an Excel spreadsheet, while Data Mining Client lets you explore data mining models. These tools require Excel 2010 or 2013 on Windows.
27. Dose — €33.84
Dose is a great collection of tools for Excel. It contains many, many features such as a date picker, an auto back-up solution, powerful functions, tools to find duplicated, list files, manage rows, clean data, count words and more. The add-in is compatible with Excel 2007 to 2019 on PC.

28. Supply Chain add-in — Free but requires subscription
This Excel plugin helps you build powerful geographical visualizations. Not only can you create data-driven maps, but also geocoding, distance calculations, warehouse locations optimizations and more. It works with Excel 2016 and later on Windows, Mac and web.

29. Office Tabs — Free
The Office Tabs add-in creates an easy interface allowing to switch between the windows opened on any Microsoft Office application. It creates a tab bar on your standard PowerPoint, Excel or Word window, displaying a tab for each currently open document of the same application. Just like on your Internet browser, you can click on a document’s title to switch to it. You can also save all open documents in one click, instead of saving them separately. Office Tabs works on Office 365 and all Office version above 2003, but non on Mac iOS.

Nota Bene: this tool is comparable to the Tab Explorer feature included in the Power-user add-in
30. ParallelDots — Free for limited use
This powerful gives you access to an AI for text analysis. Among the great tools it provide, you can use the AI API for sentiment analysis, keywords generation, text classification (taxonomy), to find abusive content and more. The add-in requires Excel 2010, 2013, 2016 or 2019 (64 bit only) on Windows 7, 8 or 10.

31. vIcons — $99
vIcons is a library of 600 icons that can be inserted in Excel, Word or PowerPoint. Search icons using keywords or just pick them up in the library. vIcons works on Office 2007, 2010 and 2013 for Windows, but the add-in does not run on Mac.
Nota Bene: this is an equivalent to the Icons Library included in the Power-user add-in that contains over 4,000 vector icons.
32. Random Number Generator — $29.95
As the name suggest, this Excel add-in generates numbers randomly. It could be seen as an improvement of the RAND() Excel function, since you can choose the format of the data you want to generate: dates, boolean, integers, real numbers etc. It can also be used to generate strings of characters in order to create random passwords. Random Number Generator works on Windows computers with Excel version 2007, 2010, 2013, 2016 and 2019. It does not work on Mac.

33. Random Sorter — $29.95
Random Sorter can be really useful if you need sometimes to extract randomly 25% of your population, to make a poll for instance. The add-in will shuffle your data. Random Sorter works on Windows computers with Excel version 2007, 2010, 2013, 2016 or 2019. It does not work on Mac.

34. Audit Tickmark Toolbar — $25
This small toolbar can be useful for audit, accounting or finance, allowing to add tickmarks to show GL (for General Ledger account), PBC (Prepared By Client), PY (agrees to Prior Year), TB (agrees to Trial Balance), etc. The toolbar works with Excel 96 to 2019 on PC but is not available for Mac.
35. QR4Office — Free
The QR4Office plugin creates QR codes that will allow to open your document with a pre-defined url of your choice. You can use it to make your Excel file or PowerPoint presentations more interactive, so that people can check it with their smartphone or vote for a poll, for instance. QR4Office is available for versions of PowerPoint, Word and Excel later than 2013 on Windows, as well as version 2016 on Mac.

36. Geographic Heat Map — Free
The Heat Map Excel app lets you display data-based colors on the map of the USA or the World map. You can move your mouse on each state as well to display its name. This app works with Excel 2013 and later on PC, and with version 2016 on Mac.
NB: for a broader choice of 200 map of continents, regions, countries or counties, you can use instead the Power-user add-in and insert one of the many Data maps from this tool. See how it works here in video.

37. Password Recovery — $29
If you protect Excel files with passwords and you tend to forget them, this plugin can be of use to you. Success is not guaranteed though, and recovering a password can take up to 36 hours so don’t rely on this if you are in an emergency situation. Password Recovery works with Excel versions 2003 to 2010 on Windows. It is not available on Mac.

38. Ultimate Suite — $99
This suite regroups all add-ins from the office-addins website (a company that is independent from Microsoft). Those tools include Password Recovery, the Random Number Generator and Random Sorter, as well as tools to find and remove duplicates, to split columns, to clean data from multiple sources, find broken links or cells similar to your selection, etc. This package is available on Excel versions 2003 to 2010 on Windows but is not available for Mac.

39. Lucidchart — Subscription required
This app for Excel lets you create flowcharts, UML, wireframes, mockups, org charts and more in your workbook. The app works for Excel 2013 or later on Windows, and for Excel 2016 on Mac.

40. Supermetrics — $99/mo
Supermetrics is a great tool for people in digital marketing, looking for a solution to analyze data in Excel. It can connect to a great number of sources like Google Analytics, Google Ads, Social networks and more, allowing you to crunch the numbers for traffic and conversions directly in Excel. You can also use it to create dashboards, refreshing them and emailing them automatically. It is available for Excel 2016 and 365, online and offline.

41. GIGRAPH Network Visualization — Free
GIGRAPH creates network diagrams that can be used to visualize relationships between multiple persons or entities. Your data would need to be organized for one-way or two-way relationships, for instance with a ‘from’ and a ‘to’ columns. GIGRAPH is available on Windows computers with Excel 2013 Service Pack 1 or later, as well as Excel Online.

42. Selection Diff Tool — €3.99
If you need to compare two strings of text and identify the differences between them, this tool is made for you. This app works on Excel as well as on Word, where it can be of great help if you are reviewing a different version of a document that was not made using Track Change. The app does not work on Mac and is supported by Excel and Word 2013 and later.

43. XY Chart Labeler — Free
This plugin lets you take back control of the chart labels in Excel. Working with labels can be very annoying, and you have limited options. So this plugin lets you add labels to data points on your XY chart data series or move XY labels. The XY Chart Labeler actually works not only for XY charts. It is available on Windows and on Mac 2011, but not on Mac with Excel 2016.
44. Hoadley Finance — $AU176
For people working a lot on Excel in finance, this add-in can be a useful addition. It allows you to perform portfolio analysis, calculate option prices, volatility, value at risk, asset allocation, company valuation, and even more. Formulas can also be used to stream quotes values in real-time from Internet sources. The Hoadley Finance add-ins works with Excel 2003 to 2019, on Windows but not on Mac.
45. ModernCharts — $4.99/mo
This Excel app allows you to reveal what your data contains with a number of charting tools and options. It can be helpful to create infographic charts in Excel or PowerPoint, relying on a comprehensive chart library. The app is available on all versions above 2013, including on Mac.

46. Microsoft Dynamics — Free
Connect your Excel spreadsheet to your Microsoft Dynamics data, read it, analyze it or feed your dashboard, and publish data changes back into Microsoft Dynamics. On Word, you can manage templates that will be fed by data from Microsoft Dynamics. If your company is using this CRM, then you will need this app. It is available on Excel and Word 2016 versions and later.

47. Risk Analyzer — $49.95
This add-in lets your perform Monte Carlo risk analysis, histograms and tornado charts, what-if analysis, etc. It does not work on Mac iOS, but is compatible with Excel 2007 and above on Windows.

48. Panel Chart — $29.95
When you create Excel line charts with many series, it can easily become impossible to read as lines cross one another or as the size of the legend increases. with the Panel Chart add-in, you can separate lines by categories in different panels, so that you chart is much easier to read and understand. Panel Chart works on Excel 2007 and above on Windows, but is not available on Mac.

49. BulkQuotesXL Pro — $74.95
This Excel add-in allows you to download free quotes from multiple data sources directly into spreadsheets. The tool can access data from Yahoo! Finance historical prices and dividends, to Google Finance historical prices, to PiFin historical prices and to CBOE. BulkQuotesXL is available on Windows computer with Excel 2010 and later, but not on Mac.
50. Vertex42 Templates Gallery — Free
Vertex42 provides a gallery of over 150 professionally designed templates for Excel and Word. Templates include calendar, planners, budgeting, inventory, invoices or financial statements. The app works on Excel and Word 2013 and later for Windows.

51. Model Analyzer — €354
This Excel add-in brings multiple solutions for Excel modelling. You can centralize input and output variables in your spreadsheets, but also perform statistical analysis, such as what-if analysis (with tornado charts, spider charts and sensitivity tables), scenario analysis, multiple goal seek, break-even analysis or Monte-Carlo simulations. Model Analyzer is made for financial analysts, economists and researchers. It is only available on the 32 bit version of Excel 2007 and 2010. It is not compatible with Mac either.

52. Weather by Visual Crossing — $5/mo
This small add-in for Office lets you get weather and climate records and forecasts directly into Excel. The data is available down to the hour. It also includes geocoding allowing to get the weather for a specific address.
53. Spreadsheet123 — Free
Before starting to build spreadsheets from scratch, you might sometimes want to pick up a nice template and work on it. That’s exactly what you can do with Spreadsheet123, a library of templates with financial statements, budgeting, payroll, invoicing, time sheets, checklists or inventory management templates. Spreadsheet123 works with Excel and Word 2013 Service Pack 1 or later as well as Excel and Word online, but is not available on Mac.

54. Capital Budgeting — Free
This Jensen add-in is made to identify optimized portfolios. Define a potential portfolio by providing its initial investment, annual return, salvage value and life. The model will use the standard deviation to estimate risk and will identify the optimized portfolio.
55. Inventory — Free
This Jensen add-in computes inventories, with the possibility to integrate backorders, lost sales, finite or infinite replenishment rates. The model identifies the optimum lot size with cost breaks.
56. Bubbles — Free
This app lets you create nice and colorful bubble charts, to display 3 or 4 dimensions of information. Use the horizontal and vertical axes, bubble size and colors to display complex information in a simple way. Bubbles works on Excel 2013 and later on Windows, as well as Excel 2016 for Mac.

57. Excellent Analytics — Free
Excellent Analytics is the must-have add-in to dig into your Google Analytics data directly from Excel. Use it to crunch your Analytics data and identify how you can bring more traffic to your website.
58. SEOTools — €79
This add-in lets you integrate data from Google Analytics, Google Adwords, the Google Search Console, SEMrush, Youtube, Ahrefs, Moz and other platforms directly into Excel so you can work your SEO data and identify key trends on your website.
59. SEOGadget — Free
SEOGadget lets you analyze your analytics data into Excel. It can access data from Majestic SEO, Moz and Grepwords and bring it to Excel for you to work on it and identify how you can boost your website’s ranking. The tool works on Windows with Excel versions 2010 and above, but does not work on Mac iOS.
60. Checkbook Assistant — Free
This add-in can help you manage your personal finance, letting you do you checkbooks and bank statements with Excel. You can move rows up or down in a single click, so you can align your Excel records with your bank statements. The tool detects and highlights the first unprocessed row. The Checkbook Assistant works with Excel 2007 and later on Windows, but is not available for Mac.

61. Loan Assistant — $19.95
This plugin lets you easily compute loans, playing with the annual flat interest rate, load amount and balloon payment at the end of the load to calculate the actual payment per period and total interests to pay. The plugin can also create a load detail year by year with the due capital and interest payments, as well as the remaining capital. The Loan Assistant works with Excel 2007 and later on Windows, but is not available for Mac.

62. Flash Card Assistant — Free
Turn Excel into a Q&A software with this simple plugin. Define a list of questions and their answers, choose the order or make it random and run it to get questions asked like flash cards and make it a game in a private or professional situation. The plugin is free and works with Excel 2007 and later. It is not supported on Mac.

63. ActiveData — $249
ActiveData adds data analytics and time-saving worksheet and workbook management features into Excel. Features include join, merge, query, summarize, find duplicates, split data, etc. The tool works with Excel versions 2007 and later on Windows, but is not available for Mac.
64. Mekko Chart Creator — $29.95
Create Marimekko charts with this tool, so you can display 3 dimensions of data in an appealing way. This plugin works with Excel 2007 and later on Windows only.

Nota Bene: for more advanced Mekkos that are editable, you can use instead the Mekko feature of the Power-user add-in for PowerPoint, Excel and Word.
65. Conditional Row Delete — Free
This small add-in simplifies the process of deleting rows selectively, based for instance on the value in a specific column.
66. Power Utility Pack — Free
For Mac users, this add-in is one of the best available options. Created by Ron de Bruin, it contains a collection of utility tools that can be relevant time-savers in several situations.
67. Exchange rates — $35.94
This plugin helps you by converting currencies with with real-time rates from the Internet. Rates are accessed from the MSN Money Central Investor website. The tool works on Windows only, for any version of Excel above 2000.
68. Mini Calendar and Date Picker — Free
When working with dates in Excel, it can be a pain — and a possible source of errors — to type manually multiple dates. With this app you can now just pick a date in a calendar and it will be automatically formatted as date. The app works with Excel 2013 or later on Windows, on Excel 2016 on Mac and on Excel Online.

69. Favorite Bookmarks — Free
Use this add-in to bookmark your favorite workbooks, sheets or range, so you can find and open them anytime from other Excel spreadsheets. The tools is available on Windows only, for Excel versions 2007 and later.

70. Functions Translator — Free
This add-in from Microsoft helps you translate functions and formulas between languages supported by Excel. It works with Excel 2013 and later on Windows, Mac and Excel Online.

71. RDBmail — Free
This mail add-in for Excel from Ron de Bruin lets you automate the process of sending sheets, data or workbook. When you have a workbook open, you can just click on the buttons on the ribbon to send it in an Outlook email, with options to send the entire workbook, just the active worksheet, or to send is with values instead of formulas. RDBmail works with Excel 2007 to 2019 on Windows.

72. Intrinio — Free
Intrinio lets you screen all equities in the United States, using filters on 500 parameters to identify the equities that meet your requirements, such as current stock price, return on equity, dividend yield, price to earnings ratio, sector, employee count, etc. Intrinio only works on Windows with Excel 2013 or later.

73. Excel training and tips — Free
This app helps you learn some Excel with a list of formulas to learn, for beginners, intermediates or Excel experts, Q&A on formulas and other information you need to know if you are to use Excel frequently. The app works with Excel 2013 and later on Windows as well as with Excel 2016 for Mac.

74. Power Reconcile — Free but $9.99/mo subscription required
This add-on is very relevant for people in finance who need to reconcile reports between vendor and accounts payable. The report will be created automatically, highlighting perfect matches or partial matches, saving you potentially a lot of time compared to a manual reconciliation. It is compatible with Excel 2013 and later on PC or Mac as well as the web version.
75. Microsoft Flow for Excel — Free
This add-in by Microsoft helps you create workflows between different applications like Excel, Outlook, Planner, Twitter, Trello, MailChimp and others. These workflows can include approval process, mobile push notifications, email sending etc. It is compatible with Excel 2013 and later on PC, Mac or the web.

Conclusion:
Excel is among the most used software in the world, and a key tool for business in most companies. However immensely rich and complex, the standard version of Excel is still just a fraction of what can be done on it by using the variety of add-ins that have been created around it.
If you are interested in PowerPoint add-ins as well, check our list of 40+ add-ins, plugins and apps for Microsoft PowerPoint.
If you are interested in PowerPoint add-ins as well, check our list of 60+ add-ins, plugins and apps for Microsoft Word.