
Now a days, many jobs require advanced Excel skills. Naturally, you are interested to know what are these Advanced Excel Skills? Based on my experience of training more than 10,000 students in various online & physical training programs, the following 9 areas form the core of advanced Excel skills.
Advanced Formulas
Formulas make Excel smart. With out them, Excel is just a data keeping tool. But by using formulas, you can crunch data, analyze it and get answers to most complex questions. While anyone can use a simple SUM or IF formula, an advanced user of it would be able to seamlessly write & combine formulas like SUMIFS, SUMPRODUCT, INDEX, MATCH, LOOKUP formulas. Apart from knowing the formulas, advanced Excel users know how to debug them, audit them and how to use which formula for which occasion (and they also know few alternatives for any given formula problem).

Data, Power Query, Tables & Formatting
Advanced Excel users know how to gather, structure & present their data so that it looks impressive. Good understanding of Excel features like Power Query (Get & Transform Data), Tables, cell styles, formatting options is necessary to make awesome Excel workbooks.

Advanced users rely on Power Query to gather and change shape of your data easily!!!
Conditional Formatting
Conditional formatting is a powerful feature in Excel that is often underutilized. By using conditional formatting, you can tell Excel to highlight portions of your data that meet any given condition. For example: highlighting top 10 customers, below average performing employees etc. While anyone can set up simple conditional formatting rules, an advanced Excel user can do a lot more. They can combine formulas with conditional formatting to highlight data that meets almost any condition.

Expert Excel users can do magic with conditional formatting and a cup of coffee 💪
Advanced Charting
There is no use if all your analysis is buried in a massive spreadsheet. Advanced users of Excel know that by using charts, we can communicate effectively and present results in a stunning manner. The skills required for advanced charting are,
- Knowing how to pick right type of chart for any situation
- Ability to combine various charts in to one
- Use features like in-cell charts & conditional formatting charts
- Ability to set up dynamic & interactive charts
- Use sparklines

If a chart is worth 1,000 words, then advanced chart is like a book. Dense, fun and useful. 📊⭐
Pivot Tables & Pivot Reporting
Pivot tables & pivot reporting allows us to analyze massive amounts of data & answer questions with just a few clicks. Advanced users of Excel are very familiar with various features of Pivot tables & can use them really well. Some of the advanced pivot table features are – relationships, multi-tale pivots, grouping, slicers, measures (Power Pivot) & summary by different type of metrics.

Link tables with relationships and weave magic with multi-table pivots. 🔗💎
VBA & Macros
Excel’s own language – VBA, allows us to give instructions to Excel to get things done. This is a simple, but extremely powerful way to extend Excel’s functionality. Advanced users of Excel are familiar with VBA & can write macros to automate their day to day work, thus saving countless hours of time & money.

Expert Excellers can save time & money by automating tasks with VBA. ⏳💰💻
Using Excel Productively
It is not enough to know various features of Excel. An advanced user knows how to use Excel productively. This includes knowing important keyboard shortcuts, mouse shortcuts, work-arounds, Excel customizations & how to make everything looks slick.
![]()
Do you know what this shortcut does? 🤔
Data Tables, Simulations & Solver
Excel has many powerful & advanced features packaged in to it.
Data tables: help us model practical problems & analyze massive amount of data for a solution.
Solver: helps us model practical problems & find a solution by iterating thru all possibilities. For example, finding cheapest way to ship goods from one location to another.
Simulations: We can simulate real world data & situations in Excel using various random functions & statistical methods.
Forecasting: Create time-series forecasting to analyze seasonal trends and predict future values.
Trend analysis: We can use built in functions & charting features to understand trend& forecast values from available data.

Superb Excel users can set up solver models to solve tricky business problems. 🛠😎
Integrating Excel with other tools & Optimizing Excel
Advanced users of Excel know that when you combine the power of Excel with flexibility of other applications like MS Word, Outlook, PowerPoint, Access, SQL Server, Power BI or Web, you can achieve wonders.
They also know how to make Excel workbooks fast and bug-free.

Advanced Excel Skills include ability to combine data from multiple files in a snap.
📄📄📄➡📄
Become Advanced Excel User
To become an Advanced user in Excel, you need to have good knowledge of all the above aspects & more. This is where our training programs come in handy. Thru Chandoo.org, I have trained more than 10,000 people all over the world & made them advanced Excel users. You too can get this training and become advanced user of Excel. Click on any links to learn more.
- Excel School Program
- VBA Classes Program
- 50 Ways to Analyze Data
It’s really nice to manage huge data with just a few mouse clicks and Excel is definitely the one tool that will allow you to do this. In case you are still unaware of the magical tricks of Excel, here is an Advanced Excel tutorial to help you learn Excel in great depth.
Take a look at all the topics that are discussed in this article:
- Security
- MS Excel Themes
- Templates
- Graphics
- Printing Options
- Data Tables
- Charts
- Pivot Tables
- Pivot Charts
- Data Validation
- Filtering Data
- Data Sorting
- Cross Referencing in Excel
- Language Translation
So, here is the first and the most important aspect that you need to know in this Advanced Excel Tutorial.
Security
Excel provides security at 3 levels:
- File-level
- Worksheet-level
- Workbook-level
File-level Security:
File-level security refers to securing your Excel file by making use of a password so as to prevent others from opening and modifying it. In order to protect an Excel file, follow the given steps:
1: Click on the File tab
2: Select the Info option
3: Select Protect Workbook option
4: From the list, select Encrypt with Password option
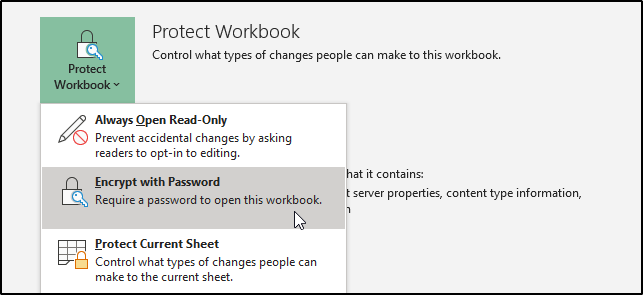
5: Enter a password in the dialog box that appears

6: Re-enter the password and then, click on OK
Keep the following points in mind while entering passwords:
- Do not forget your password as there is no password recovery available in Excel
- No restrictions are levied but, Excel passwords are case-sensitive
- Avoid distributing password protected files with sensitive information such as bank details
- Protecting a file with a password will not necessarily protect against malicious activities
- Avoid sharing your passwords
Worksheet-level Security:
To protect the data present in a worksheet from being modified, you can lock the cells and then protect your worksheet. Not just this, you can also selectively allow or disallow access to particular cells of your sheet to various users. For example, if you have a sheet that contains details of the sales for different products, and every product is handled by different individuals. you can allow each sales staff to modify the details of only that product which he is responsible for and not the others.
To protect your worksheet you must follow 2 steps:
1: Unlock cells that can be edited by the users
-
- In the sheet that you wish to protect, select all cells that can be edited by the users
- Open the Font window present in the Home tab
- Select Protection
- Uncheck the Locked option


2: Protecting the worksheet
-
- To protect the sheet, click on the Review tab and then select the Protect Sheet option
- You will see the following dialog box

-
- From the “Allow all users of this worksheet to” option, select any of the elements that you wish to
- Give some password of your choice and click on OK (The setting of a password is optional)
Unportecting a Worksheet:
In case you want to unprotect the sheet, you can do it by selecting the Unprotect Worksheet option from the Review tab. In case you have specified any password while protecting the sheet, Excel will ask you to enter the same in order to unprotect the sheet.
Workbook-level Security:
Workbook-level security will help you prevent other users from adding, deleting, hiding, or renaming your sheets. Here is how you can protect your workbooks in Excel:
1: From the Review tab, select Protect Workbook option, you will see the following dialog box:

2: Enter some password of your choice and click on OK (This is optional, if you do not enter any password, anyone can unprotect your workbook)
3: Re-enter the password and click on OK
When your workbook is protected, you will see that the Protect Workbook option will be highlighted as shown below:
 Also, if you right-click on any of the sheets, you will see that all the options such as Hide, Insert, Rename, etc will not be available anymore. Take a look at the image shown below:

MS Excel Themes
MS Excel provides a number of document themes to help you create formal documents. Using these themes, it will be very easy for you to harmonize different fonts, colors or graphics. You also have an option to either change the complete theme or just the colors or fonts, etc according to your choice. IN Excel, you can:
- Make use of standard color themes
- Create your theme
- Modify the font of themes
- Change effects
- Save your customized theme
Make use of standard color themes:
In order to choose a standard theme, you can do as follows:
- Select the Page Layout tab from the Ribbon
- From the Themes group, click on Colors
- Select any color of your choice

The first group of colors that you see. are the default MS Excel colors.
Create your theme:
In case you want to customize your own colors, click on Customize Colors option present at the end of the dropdown list shown in the image above, and you will see a dialog box as shown in the image below:

From the above dialog box, select any color of your choice for the Accents, Hyperlinks, etc. You can also create your own color by clicking on the more colors option. You will be able to see all the changes you make in the Sample pane present at the right side of the dialog box shown in the image above. Not just this, you can also give a name to the theme you create in the Name box and Save it. In case you do not want to save any of the changes you made, click on Reset and then click on Save.
Modify the font of themes:
Just like how you could change the theme colors, Excel allows you to change the font of themes. This can be done as follows:
- Click on Page Layout from the Ribbon tab
- Open the dropdown list of Fonts
- Select any font style you like

You can also customize your own font styles by clicking on the Customize Fonts option. you will the following dialog box opening when you click on it:

Give any Heading and Body font of your choice and then, give it a name. Once this is done, click on Save.
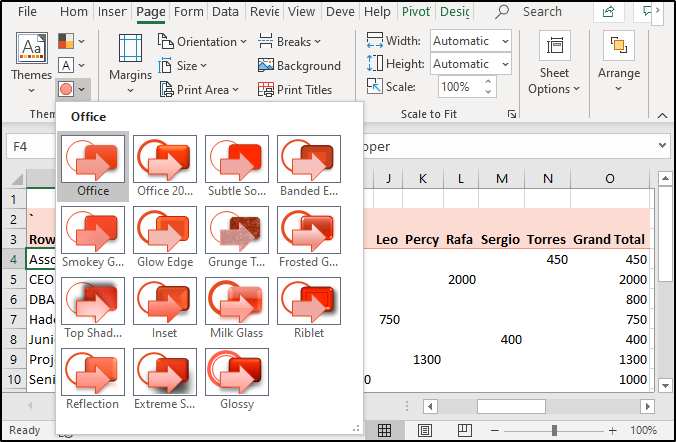
Change Effects:
Excel provides a huge set of theme effects such as lines, shadows, reflections, etc that you can add on. To add effects, click on Page Layout and open the Effects dropdown list from the Themes group then select any effect you wish to.

Save your customized theme:
You can save all the changes you make by Saving the current theme as follows:
1: Click on Page Layout, select Themes
2: Choose the Save Current Theme option
3: Give a name to your theme in the Name box
4: Click Save

Note: The theme that you Save will be saved in the Document Themes folder on your local drive in the .thmx format.
Templates
A Template, in general, is a pattern or a model that forms the base of something. Excel templates help you increase your production rates as they help you save time and effort to create your documents. In order to make use of Excel templates, you should click on File, then select New. Here, you will be able to see a number of Excel templates that you can choose for any type of document such as Calenders, Weekly attendance reports, Simple invoices, etc. You can also look for a template online. For example, if you choose the Personal Monthly Budget template, your template will look as shown in the image below:

Graphics
Unlike what many people think, Excel does not just allow you to play around with data, but it also allows you to add graphics to it. To add graphics, click on the Insert tab and you will be able to see a number of options such as adding images, shapes, PivotTables, Pivot Charts, Maps, etc.
Inserting Images:
In this Advanced Excel tutorial, I will show you all how to add images to your Excel documents. First, click on Insert and then open the Illustrations list, select Pictures.

Select any picture you wish to add to your document. In the image shown below, I have added the logo of Excel:

Similarly, you can also add shapes, icons, SmartArt, etc to your documents.
Printing Options:
To print your MS Excel Worksheets, click on File and then select the Print option. You will see a number of options before printing the document that allows you to print your document in different patterns and layouts. You can change page orientations, add margins, change printers, etc.
Data Tables
Data tables in Excel are created to experiment with different values for a formula. You can create either one or two variable Data tables in Excel. Data tables are one of the three types of What-if analysis tools available in Excel.
In this Advanced Excel Tutorial, I will be showing you all how to create both one-variable and two-variable Data tables.
Creating a One-Variable Data Table:
Say for example you purchased 16 glasses at the rate of $20 each. This way, you will have to pay a total of $320 for 16 glasses respectively. Now, in case you want to create a data table that will show you the prices for different quantities of the same item, you can do as follows:
1: Set up the data as follows:

2: Then, copy the result present in B3 to another cell

3: Write down different quantities of items as shown below:

4: Select the newly created range, click on the Data tab, select What-If Analysis from the Forecast group. Then select the Data Table option.

5: From the dialog box shown below, specify the column input cell. (This is because the new quantities are specified in columns)

6: Once this is done, you will see all the resultant values. Select all cells with the output values and specify the $ symbol to them:

Two-variable Data Table:
To create a two-variable Data Table for the same data that was taken in the previous example, follow the given steps:
1: Copy the result present in B3 to some cell and specify test row and column values as shown below:

1: Select the range, click on the Data tab
2: Select What-If analysis from the Forecast group
3: In the window that appears, enter the Row and the Column input cell as shown below:

4: Once you click OK, you will see the result for the complete table
5: Select all the output cells, and then specify the $ symbol

Charts
Charts give graphical representation to your data. These charts visualize numerical values in a very meaningful and easy-to-understand manner. Charts are a very essential part of Excel and they improved greatly with every new version of MS Excel. There are many types of Charts that you can use such as Bar, Line, Pie, Area, etc.
This Advanced Excel tutorial will help you learn how to create charts in Excel.
Creating Charts:
To insert a chart, follow the given steps:
1: Prepare your chart data

2: Select the prepared data, click on Insert present in the Ribbon tab

3: From the Charts group, select any chart of your choice

Pivot Tables:
Excel Pivot Tables are statistical tables that condense the data of tables having extensive information. These tables help you visualize your data based on any of the fields present in your data table. Using Pivot Tables, you can visualize your data by changing the fields’ rows and columns, add filters, sorting your data, etc.
Creating Pivot tables: To create a pivot table, follow the given steps:
1: Select the rage for which you want to create a pivot table
2: Click on Insert
3: Select Pivot Table from the Tables group
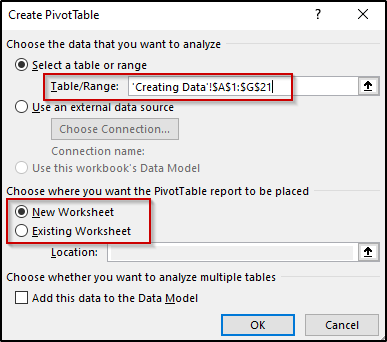
4: Check if the given range is correct
5: Select the place where you want to create the table i.e New Worksheet or the same
6: Excel will create an empty Pivot Table

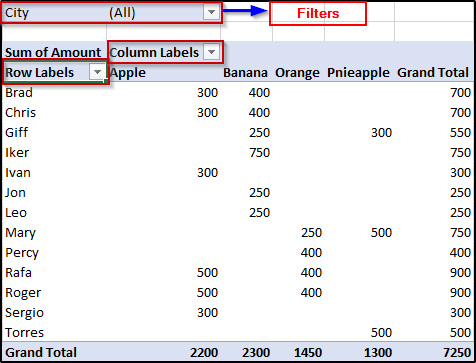
7: Drag and drop fields you wish to add in order to customize your pivot table

You will see the following table is created:
Pivot Charts
Excel Pivot Charts are built-in visualization tools for Pivot tables. Pivot Charts can be created as follows;
1: Create the Pivot Table

2: Click on the Insert tab
3: Select Pivot Charts from the Charts group
4: This will open up a window that will show you all the available Pivot Charts
5: Select any type graph and click on OK

As you can see, a Pivot Chart has been created for my Pivot Table.
Data Validation
One of the most important topics of this Advanced Excel Tutorial is Data Validation. This feature, as the name suggests, allows you to configure the cells of your Excel Worksheets to accept some particular type of data. For example, if you want a certain number of cells in your sheet and you want them to accept only dates, you can do it easily using the Data Validation feature of Excel. In order to do this, follow the given steps:
1: Select all the cells that you wish to assign a particular data type to:

2: Click on the Data tab present in the Ribbon
3: From the Data Tools group, select Data Validation
4: You will see a popup window with three options i.e Settings, Input Message, and Error Alert
Now, if you select any cell in the selected range, you will first see a message asking the user to enter whole numbers greater than 1.

In case the user fails to do so, he will see an appropriate error message as shown below:

Data Filtering
Filtering data refers to fetching some particular data that meets some given criteria. Here is the table that I will be using to filter out data:

Now, in case you want to filter out the data just for New York, all you have to do is select the City column, click on Data present in the Ribbon tab. Then, from the Sort&Filter group, select Filter.

Once this is done, the City column shows a dropdown list that holds the names of all the cities. To filter the data for New York, open the dropdown list, unselect the Selected All option and check New York and then click on OK. You will see the following filtered table:

Similarly, you can also apply multiple filters by just selecting the range you want to apply the filter to, and then selecting the Filter command.
Sorting
Data sorting in Excel refers to arranging the data rows on the basis of data present in the columns. For example, you can rearrange the names from A-Z or arrange numbers from ascending or descending orders respectively.
For instance, consider the table shown in the previous example. If you want to rearrange the names of the vendors starting from A, you can do as follows:
- Select all the cell you want to sort

- Click on Sort present in the Data tab and you will see a dialog box as shown below:

- Here, you have two options based on your wish to Expand your selection for the complete data or only for the current selection (I’m choosing the 2nd option)
- Once that is done, you will see the following dialog box:

- Here, you can add more columns, delete columns, change the order, etc. Since I want to sort the column from A-Z, I will click on OK.
Here is what the table looks like:

Similarly, you can sort your table using multiple levels and orders.
Cross Referencing in MS Excel
In case you want to look for data across multiple sheets in your workbook, you can make use of the VLOOKUP function. The VLOOKUP function in Excel is used to look up and bring forth required data from spreadsheets. V in VLOOKUP refers to Vertical and if you want to use this function, your data must be organized vertically. For a detailed explanation on VLOOKUP.
Using VLOOKUP to fetch data from multiple sheets:
In order to use the VLOOKUP function to fetch values present in different sheets, you can do as follows:
Prepare the data of bo the sheets as shown:
Sheet3:

Sheet4:

Now, in order to fetch the salaries of these employees from sheet4 to sheet3, you can use VLOOKUP as follows:

You can see that both sheet3 and sheet4 are selected. When you execute this command, you will get the following result:

Now, to fetch the salaries of all the employees, just copy the formula as shown below:

Macros
Macros are a must to be learnt in Excel. Using these Macros, you can automate the tasks that you perform regularly by just recording them as macros. A macro in Excel is basically an action or set actions that can be performed again and again automatically.
In this Advanced MS Excel Tutorial, you will be learning how you can create and make use of macros.
Creating a Macro:
In the following example, I have some information regarding a store and I will create a macro in order to create a data graph for the sales of the items along with their amounts and quantities.
- First, create the table as shown below:

- Now, click on the View tab
- Click on Macros and select the Record Macro option
- Enter some name for the macro you are going to create in the dialog box that appears and if you want, you can also create a shortcut for this macro
- Next, click on OK (Once this is done, Excel starts to record your actions)
- Select the first cell under the Amount column
- Type “=PRODUCT(B2, B3)” and hit enter
- Insert a $ sign from the Home tab Numbers group
- Then, copy the formula to the rest of the cells

- Now, click on Insert and choose any chart you prefer. Here is what the chart for the table shown in the image above looks like:

- Once the actions are completed, click on View and select Stop Recording option from Macros
When you do this, your macro will be recorded. Now every time you wish to perform all these actions, simply run the macro and you will be able to see the outputs accordingly. Also, make a note that each time you make changes to the values present in the cells, your macro will make changes accordingly when you run it and will show the updated results automatically.
Language Translation
Excel brilliantly allows users to translate the data into different languages. It can auto-detect the language present in your data and then convert it into any desired language that is present in Excel’s list of languages. Follow the given steps to perform language translation:
- Click on the Review tab
- Select Translate from Language group
- You will see a Translator window where you can either let Excel detect the language present in the sheet or give some specific language
- Then, from the ‘To‘ dropdown list, select any language you wish to convert the data into

As you can see, the text that I have has been converted to Hindi.
This brings us to the end of this article on Advanced Excel Tutorial. I hope you are clear with all that has been shared with you. Make sure you practice as much as possible and revert your experience.
Got a question for us? Please mention it in the comments section of this “Advanced Excel Tutorial” blog and we will get back to you as soon as possible.
To get in-depth knowledge on any trending technologies along with their various applications, you can enroll for live Edureka MS Excel Online training with 24/7 support and lifetime access.

Excel is an important, in-demand skill in countless industries. Advanced Excel skills include the ability to produce graphs and tables, use spreadsheets efficiently, and perform calculations and automation to process large volumes of data. With the rise of big data and data analytics, advanced Excel skills are a real asset both during the job hunt and everyday work tasks.
Whether you are considering a career in data analytics or looking to enhance your skills on the job, Excel training can be valuable in preparing you for a variety of promising roles.
Advanced Excel Topics
Below, we will address some of the top 10 Excel skills needed to break into the data analytics industry — as well as effective ways to learn these skills. The Columbia Engineering Data Analytics Boot Camp curriculum, for instance, can be a great way to hone your Excel skills; the data analytics boot camp covers intermediate Excel topics, which form the foundation for the following advanced Excel skills.
Excel Skill 1: Statistical Modeling
Excel provides a specialized toolkit enabling you to perform statistical modeling inside the popular spreadsheet program. These kinds of diverse applications are exactly why Excel skills remain important in the job market. The advanced Excel formulas involved in producing statistical models and performing advanced data analytics enable you to perform meaningful statistical analysis and produce useful models.
Excel’s statistical modeling functions include tools to create histograms, generate random numbers, find correlations between data sets, measure for rank and percentile, perform regression, and assess sampling. Using Excel to perform statistical modeling can reduce human errors sometimes involved in statistical analysis.
If you have only used Excel for basic budgeting or project management, you may be unaware of the statistical tools that can power up your Excel skills. While some of the advanced Excel tools for statistical modeling are built into the program’s basic functions, others are part of the add-on package for data analysis. Through Excel’s Data tab, you can add in the Analysis ToolPak to gain access to these important functions.
Excel Skill 2: Forecasting and Prediction
If you have historical and time-based data, you can use advanced Excel functions to create forecasts and predictions of future performance. You can create this data at higher and lower confidence levels for different degrees of probability — this can be important for businesses aiming to predict stock trajectories, forecast the growth of their sales efforts, or understand changes in the economy.
Excel’s Data tab has a substantial amount of advanced tools available for users, and Columbia Engineering Data Analytics Boot Camp can help you understand and make use of these more advanced functions. For example, if you’re working with two corresponding data series, you can insert a Forecast Sheet under the Data tab to create line or column charts with the relevant forecast. You can set your own end date for the forecast and choose from a number of options to fine-tune your results, including filling in missing points and assessing for seasonality.
Excel Skill 3: Pivot Tables
Pivot tables are perhaps one of the best-known and more powerful advanced Excel skills, as they can automatically give you quick summaries of the data in a massive Excel spreadsheet by grouping matching data. For example, pivot tables can quickly graph sales data by product, financial performance by investment type, or weight of various items in inventory. These tables, launched from the Tables section of the Insert tab, can be used to count, sort, total, or average data taken from one large spreadsheet.
With pivot tables, you may eliminate the need for individual formulas in producing meaningful data analysis — one of the most important Excel skills for employers because of its versatility and efficiency. After you have mastered these advanced Excel functions, you can create a pivot table in less than a minute, whether you have only a few rows of data or thousands of rows of information. You can create the specific fields to be addressed in the table, remove duplicates, count entries and provide a range of assessments of your data. Excel even includes recommended Pivot Tables keyed to the types of data presented in your spreadsheet.
Excel Skill 4: VBA and Macros
Visual Basic for Applications in Office (VBA) is a powerful, simple programming language created by Microsoft to extend and automate the capabilities of Excel and other Office software. VBA can be used to automate any function that you can perform in Excel and enables you to save the resulting code as a macro to be used repeatedly, which can dramatically ramp up efficiency and output when you have repetitive tasks or need to clean data across a range of spreadsheets.
Creating and applying macros can result in cutting a task down from days to hours, allowing you and your employer to save time. VBA programming allows you to have total control over the macros you produce — not only to automate advanced Excel functions but to create unique dialog boxes and other options for your particular business case.
Excel Skill 5: Model Historic Stock Trends
Excel offers a stock data type created specifically to pull in present and historical stock performance data. By modeling variations of a stock and the instruments based on it, like derivatives, you can receive a representation of the stock’s valuation at present and over time. By using the stock data type, you can bring in existing prices as well as the company name, number of employees, and other key data that can be used to perform stock modeling.
The advanced Excel function STOCKHISTORY provides access to historical data that can be formatted dynamically. By using the stocks data type and pulling in the start and end date (as well as specified properties), Excel users can pull in data over time on a specific exchange, in a certain currency, and with other specifications. This information may produce graphical representations of a particular stock’s history — as well as forecasting and prediction models to assess potential future outcomes.
Advanced Excel Skills for Your Resume
- Statistical Modeling
- Forecasting and Prediction
- Pivot Tables
- VBA and Macros
- Model Historic Stock Trends
Advanced Excel Formulas
There are a myriad of advanced Excel formulas — many of which enable you to quickly and effectively perform key tasks on the job. These advanced formulas often provide advanced automation or searching capabilities, which can save time and produce quick, efficient results.
The following are a few such formulas that may be covered at a data analytics boot camp:
Sum If
The SUMIF formula is used to add cells together when they share certain properties. For example, SUMIF can be used when those data cells have a certain number or word attached to them, indicating, for instance, a certain class or type of product. It can also be used to add information that is above or below a certain value — or that equates to a particular amount — highlighting outliers or grouping together certain kinds of information.
SUMIF is a useful formula to gather summary information about sales, enrollment, or other total figures for large data sets that encompass different types of information. The SUMIF formula takes in data including the range of cells to examine, the criteria to determine which cells should be added together, and the sum range to add together.
Conditional Formatting
In many industries, formatted Excel tables and spreadsheets are important to provide a visual representation of your data. After you’ve crunched the numbers, you need to present your information to others at your employer. In many cases, making the key data and takeaways stand out is critical to effective business communication and ensuring that your presentation is understood by listeners and readers.
Conditional formatting changes the color and appearance of a cell and its contents based on certain conditions about the type of information it contains. For example, in a financial or budgeting spreadsheet, you may want negative numbers to be highlighted in red. You may want to highlight any divergent information in yellow if they contain a certain word or error code.
By determining the type of information you want to highlight, Excel skills in conditional formatting can enable you to deliver your information visually as well as verbally. You can highlight top performers or areas that need improvement with just a few clicks and color changes.
If Error
Sometimes, you may encounter errors when performing advanced Excel functions. This may be for a number of reasons, including the absence of a certain type of data in particular rows, or it may indicate a problem that needs to be fixed. IFERROR is used to remove error codes and produce either a blank cell or a text you specify that indicates that the cell or area needs further review or attention.
However, Excel by default produces certain types of error codes that can stop calculations from running across a range of values while also presenting a disruptive, attention-grabbing appearance on the sheet for easy identification and correction.
Count If
The COUNTIF function in Excel is used to count cells that have certain properties. If you want to find out how many times a certain word or entry appears in a large spreadsheet, COUNTIF examines all of your data and produces a count of the criteria that you specify. This can be very important whenever you want to know the number of things that are labeled in a particular way. Whether you want to understand the distribution of your inventory, identify where your customers are located, or determine the number of employees in a particular department, COUNTIF enables you to get this information quickly by taking in the range of cells you wish to examine as well as the criteria you are using to search.
Index Match
The combination of the INDEX and MATCH functions in Excel provides a more advanced way to look up and assess information inside an Excel sheet or workbook. While functions like VLOOKUP and HLOOKUP allow you to search for information, they have limitations on where and how they search that can prevent you from easily obtaining the information you need. The MATCH function is nested inside the INDEX function and can be used to find a certain type of data, while INDEX is used to connect that information to the other data available in its row.
In other words, MATCH allows you to find the position of a value in a range, and then INDEX is used to return a specific value in relation to the original value. It is important for two-way lookups and case-sensitive lookups, and you can even use it to find the closest match from the data you have.
How to Learn Excel
There are a number of ways to learn advanced Excel skills. Your ideal learning model will likely depend on your professional timeline, your developmental needs, and your existing knowledge. For instance, those seeking a more systematic approach to learning Excel may pursue a data analytics bootcamp, a relevant college degree, or an applicable independent learning option.
Bootcamps
There are many advantages to learning Excel skills through a tech bootcamp. For one, most data analytics bootcamps provide a well-developed curriculum delivered by knowledgeable instructors, positioning you to pursue an exciting new job in the field.
Often, you are able to choose a full- or part-time course, giving you the option to learn while working or pursuing other endeavors. Bootcamps are generally predicated on practical, project-based learning that simulates real-world scenarios and teaches key skills quickly yet effectively. These courses also cater to a variety of prior skill levels. Columbia Engineering Data Analytics Boot Camp, for example, begins with intermediate Excel skills that you can build upon for advanced Excel knowledge. Bootcamps often provide a balance for learners, as they offer a healthy blend of high-level accountability and support.
Ready to advance your career? Consider learning Excel at Columbia Engineering Data Analytics Boot Camp.
Get Boot Camp Info
College Degrees
College degrees, such as those in business administration or data analysis, can also provide key Excel skills and advanced training. They may provide a thorough understanding of the skills you need as well as extensive projects for practice, however, they may also have more of a theoretical focus than the practical focus covered in many tech boot camps. They may also require many years of work and greater expense to achieve your goal. If you already have an undergraduate degree, you may not want to repeat the same work again when you just need some additional training.
Independent Learning Options
Those interested in fully autonomous learning may master Excel through independent learning resources. These options include (but are not limited to) free online courses, comprehensive videos, and educational apps. Such resources give learners full self-accountability in learning Excel, offering the chance to learn hard technical skills while also honing soft skills like time management and assignment compartmentalization.
Why Excel Skills Are Important in the Job Market
Excel is an important skill in countless roles. These skills are often necessary for success in many industries, and employers are likely to request advanced Excel skills when hiring for a data analytics profession. The data analytics industry is on the rise, so if you are wondering how to become a data analyst, Excel skills are one key way to achieve your goal.
Of course, data analysts are not the only profession that makes use of advanced Excel skills. These skills are key to a wide range of jobs, including:
- Finance and accounting
- Human resources
- Digital marketing
- Project management
- Inventory and product management
Begin Your Advanced Excel Training Today
There is great demand for Excel proficiency in today’s job market. With the demand from employers, it is important to have the advanced Excel skills that are in high demand for tech roles and other fast-growing industries. A data bootcamp is one great way to get the skills you need. To begin your journey to advanced Excel training today, find out more about how Columbia Engineering Data Analytics Boot Camp can empower your path to data analysis success.
Get Boot Camp Info
Advanced Excel skills are required in most managerial & analyst roles. Yet most people have no clue of how to learn Advanced Excel fast. They don’t know the key features of Microsoft Excel that can help them save time and money.
It’s about time you pick the Most Important & Useful features of Excel quickly. This post coveres the following topics in detail.
- What is Advanced Excel,
- Why should you learn it,
- How to learn Advanced Excel Fast!
Welcome To This Short Guide to Being an Expert in Advanced Excel Skills
Every organization uses Microsoft Excel in their day to day work. Most employees & managers know Excel to some extent. And they are able to survive the day by doing things in one way or another… often the long and inefficient way.
Learning to use Microsoft Excel well goes beyond the basics. That’s where the Advanced Excel skills come in handy.
Microsoft has bundled in hundreds of useful functions and features, that can do wonders, save a lot of time, and improve your efficiency & productivity.
Each new version of Excel is packed with ever richer functionality, and provides more ways to use Excel to its utmost at any workplace.
Microsoft is striving to add those features that can simplify complex things, and make it easier to do data entry, perform computations, and even analyze data & present the insights into actionable information useful for clients and colleagues or the management in nicely created reports and dashboards.
So how come very few people are familiar with these Advanced Excel Features & Functions?

Partly because Microsoft is a software company, and not so much an education company. They add new Excel formulas, features, shortcuts, buttons, charts types, and options, but Microsoft doesn’t spend the time in educating everyone about these new enhancements in the time they deserve.
Microsoft simply blog about it, updates the documentation, and then wait for you to figure it how somehow. Most greatly useful features languish, forgotten in the documentation, hardly ever used…
Also, partly to blame is our education system, which does not start teaching us the key Excel skills that are essential in the job. Almost every student now works on a laptop or a tablet, using documents & spreadsheets for every report, presentation or assignment they do. But our schools often leave you to figure how to be productive with these basic tools.
Very few schools or colleges have mandatory Excel or Word Training. It’s no wonder that when a fresh graduate joins the workforce, they often take ages to do simple things, stumbling and faltering along their journey to do even basic things in Excel, let alone the Advanced Excel Techniques that are required to be productive.
Why Should I learn Advanced Excel?
That’s a common question for people using Excel at workplace. If you don’t even know what Excel can do, why will you be interested in learning it. You need to see the features to believe it, and to see your own blind spots.

Increased Productivity With Advanced Excel Tips & Tricks
If you care about getting the job done faster, without any errors, then it is in your interest to improve your competence in Excel. You don’t have to learn all the 500 plus functions to master Excel. In fact, you can already be more productive if we can know and use more than 10-15% of the Advanced Excel features and functions we have listed below.
Better Job Prospects With Better Excel Skills
New job prospects & Career switch options also open up for those who can manipulate and juggle data easily in Excel. Many higher end analyst jobs in the financial and accounting, sales, marketing, management & consultancy areas require good analytical & decision making skills.
Better Presentations With Excel Charts, Reports & Dashboards
Plus, With Advanced Excel Charts & Reporting features, you can be a star in the boardroom too. Most client presentations will need some amount of data and analysis to be presented, which can easily be analyzed and tabulated in Microsoft Excel, provided you know how to do it quickly.
So now you know the key reasons why you should learn Advanced Excel, you may be wondering, what are the key features of Excel that can considered as “Advanced“.
What Really Are Advanced Excel Skills?
Knowledge of multiple useful features and functions, plus the ability to use them at short notice is what we can call as Advanced Excel skills. To name a few, you must be able to know and perform the following things in Excel well.

FASTER SETUP & DATA ENTRY WITHIN EXCEL
Setup Columns Quickly using Auto fill options. For example, you can fill Months or Quarters easily by filling in just the first value. Similarly, you can generate sequence numbers from any starting point to any ending number.
Do Quicker Data Entry by using Auto complete of repeating values as Excel picks up the filling values using pattern recognition
Generate Sequence Numbers quickly With Auto Fill & FlashFill options
LOADING EXTERNAL FILES & DATA
You must be able to Bring External data into Excel from any kind of source – be it Text files, CSV files, XML, Web Data or Database files. Plus, Excel now makes it easier to bring in data from the Cloud Apps like SalesForce, Zendesk, QuickBooks & over 200 app integrations, from PowerQuery, now built into Excel, from version 2013 onwards.
All is not good just by loading the data. You will have to clean & de-duplicate it. Fill in blanks, handle null or missing values, and then fix the dates to become useable. You’ve often got to convert dates formatted as YYYYMMDD or DDMMYY into something that’s more humane – DD-MMM-YY or MM/DD/YY. Obviously the actual settings will depend on your country, regional settings & preferences. But it is often required. This requires you to use PowerQuery, or use Text functions to extract the date, month or year from strangely formatted dates.
EASIER DATA FORMATTING
After cleaning the data comes the job of making it easier to read and identify the key data points.
Here comes the Data Formatting options. Formatting Data makes it easier to read and present data. With Conditional formatting options, it is easier to highlight data based on any simple or complex condition or criteria. By highlighting data, you can make it easy to the winners and losers & spot issues and errors. Highlight the highest values, lowest values, values between a range, values outside a range, or set up your own rules, based on calculations.
LEVERAGE ON IN-BUILT EXCEL FUNCTIONS
Good knowledge of Advanced Excel Functions is essential to get more mileage out of Excel. Microsoft’s Excel functions are divided into multiple categories:

Lookup Functions like VLookup, Index, Match, Offset, Indirect allow you to find anything from within Excel tables and Master data. Pick the employees name based on Code, or find out who secured the highest or lowest sales numbers.
Statistical Functions like Median, Mode, Standard Deviation, Variance allow you to analyze data statistically. You can find out the median, standard deviation or variance, allowing you better insights into the data as to what happened, why it happened, and what is most likely going to happen.
Analysis Functions like Correlation & Regression, Trend Analysis & Forecasting further the statistical functions into forecasting, and allowing you to make better projections, and better decisions based on the happening trends.

Logical functions like If, Sumif, Countif, Iferror allow you do things conditionally – check if a condition is met, add or count based on conditions being met or not met, and even check and handle errors from happening.
Date & Time functions for finding todays date, time, difference between dates, hours, year, month, days, weekdays. This allows you to do time based calculations, buckets of date ranges, and even create ageing analysis based on range values.
Database functions that treat the entire data set as a database, and allow you to aggregate results using Dsum, DAverage, Dmax, Dstdev. This can be useful when working with big data
Text Functions to extract, clean and manipulate data – Left, Right, Mid, Char, Len, Fixed, Trim, TextJoin help in fixing erroneous data, and picking certain batch codes, lot numbers, region or product codes from within serial numbers.
Financial Functions like PV, NPV, PMT, IRR, Accrued Interest, Future Value, Mirr etc. are useful for analyzing the current, present and future value of things. Interest calculation, accruals, monthly installments, interest rates etc. can be easily worked out by using these advanced Financial functions of Excel.
PIVOT TABLES FOR QUICK ANALYSIS
Use the Pivot Table feature of Microsoft Excel, which is the fastest way to get some high level summary from your data set. Pivots allow you to slice and dice the data in numerous ways, and analyze it using different dimensions easily, without writing any formulas or macros. A pivot table is the first thing people turn to when they want some quick analysis or summary on the data.
With the help of Slicers, Timelines, Report Filter Pages, you can look at the same data in multiple ways, multiple dimensions, and in multiple filter flavors.
These are all great ways to analyze information quickly with Excel – a strong reason to learn Advanced Pivot Table techniques of Microsoft Excel.

In fact, knowledge of Pivot tables is often tested in interview questions for jobs requiring a good amount of business analytics. Even in days where most companies world class ERP software with hundreds of canned reports, often raw data is extracted from these ERP packages and combined with external market data, manual forecasts and then analyzed using Pivots.
Competence in Advanced Pivot Table analysis techniques are are must if you want to get into business analytics. Strangely, for the amazing things pivots can do, they are surprisingly easy to master. I often see managers and senior executives surprised at the simplicity, and lament that they missed out on this easy feature for the past several years, relying on junior executives to churn out the reports.
No harm in getting the ground staff to run the reports, but sometimes they do not have the acumen or sensory acuity of understanding the big picture. The juniors often report the obvious, without being able to get that helicopter view of the data.
Pivots are the easy, low hanging fruit that you should begin with, for it brings the biggest bang for the buck. You can easily master it in an afternoon, or in a pivot table masterclass and win an edge with this winning Advanced Excel trick up your sleeve.
CHARTS TO VISUALIZE INFORMATION

Create Charts from raw or summarized data to visualize the information quickly. Multiple columns and thousands of rows make it very difficult to see the big picture and spot a trend.

A visual is worth a thousand words. An Excel chart can depict the past sales of many months or quarters, returned products or problem tickets created/solved each month, and it becomes much easier to spot a trend by looking at a high level chart more than by looking at a sea of rows and columns
There are multiple kinds of charts in Excel that can make boring data look stunning. Choose from Bar & Column charts, Pie & Donuts charts, Waterfall charts or Line Charts. You can also create combination charts showing column and lines at the same time, allowing you to measure 2 different metrics at one time.
Excel charts are easy to master, and there’s a lot to choose from. You can easily format them, add legend, titles, colors, and just about tweak every aspect with a mouse click. Mastering such Excel Charting tips can take you far in the boardroom, with better looking charts & visuals.
MACROS IN EXCEL TO RECORD & AUTOMATE STEPS
Macros are the one Advanced Excel Feature that allows you to extend Microsoft’s products and take them to newer heights. You can create your own functions & automations in Excel to perform multiple steps in a short time, at a single button click.
Macros are heavily used in Banks, financial institution, and in accounts departments of almost each and every company. They are the staple of the data enthusiasts who like to do things just once.
Excel VBA Macros allow you to load new data automatically each month, collate and tabulate multiple sheets & multiple workbooks, and create reports & charts automatically for each new period.
Macros are recorded or written and edited in a special language created by Microsoft – Visual Basic for Applications (VBA) in short.
While learning VBA may take some time, this is the secret weapon that separates the wizards of Excel from the amateurs. Once an Excel macro is written and tested, it can easily be deployed to the masses. Your colleagues and users needn’t know the complexities or the logic of how things are done.

For example, you could create your own custom Financial Accounting Software, just by using Excel. Using Forms, you can get the users to key in the sales, expenses, and generate invoices or receipts at a click. And a Cash Flow Statement, a Profit & Loss Statement, or a Balance Sheet could be generated at any time, collating all the data keyed in so far.
This allows the users to get more done with Excel, and everyone doesn’t have to learn the technicalities of generating such reports at any time.
VBA Macro writing and editing skills are considered Advanced, because it requires you to learn the specific way Excel refers objects like workbooks, sheets, rows and columns. VBA is a full blown programming language – allowing you to write loops, conditions, procedures, functions, and tag them to buttons, mouse movements etc.
This one advanced Excel skills can make you indispensable in the whole department. I have known several people who have a clout in the company because of their deep knowledge of the system, and that they have written the backend systems that the company uses in its day to day operations. Such deep knowledge is always in demand.
SHARING & PROTECTION OF DATA
Today Microsoft Excel is improved and enhanced to allow multiple colleagues and friends to work together on the same file. You can track changes of who did what, and you can even protect the information in such a way that only those authorized to see or edit can do so, protecting information from prying eyes.

With Advanced Data Protection techniques in Microsoft Excel, you can hide sheets, write protect them to make them view only, or allow only certain rows, columns or cells to be editable. This gives a tremendous advantage while working with multiple people and multiple sheets.
With the integration of OneDrive, you can truly collaborate with your team, having multiple edits and track changes as they happen. It is much easier to edit, pick the changes you like, or remove/revoke changes that you do not approve of.

If you haven’t visited the Review menu of Excel, you’d be surprised with the multiple options available under the hood, that allow for Collaboration, Sharing, Editing & Protection of Documents.
SIMPLE, COMPLEX, ADVANCED TEMPLATES
Almost everything you do in Excel has been done before. So if you are making a calendar, or a cash flow report, a monthly report, attendance report, Result of Students, Invoices or Statement of accounts, Expense claims or Employee Leave forms for the team, there is a ready made template to do so.
Not just one, you have hundreds of templates to choose from. These ready made templates are available to any Microsoft Office user to use and save time.

On top of this, you can create your own company wide or departmental templates, that can be used month after month, quarter after quarter without any changes. Consolidation becomes a breeze if you all use the same template.
Plus, tracking & merging of multiple changes can be done with the hidden Track & Merge option. You can’t find this button in the standard toolbar, and need to enable it separately. A golden gem of a function. Even seasoned pros have been unaware of this super cool advanced excel functionality.
Print Beautiful Reports & Charts With Advanced Excel Techniques of Page Setup
With Advanced Page setup, you can decide what you want printed and what not. You can add headers, footers, page numbers, logos etc. straight out of the box. But Excel goes beyond this into giving you fine control over the rows, columns, and area that will be printed.

You can control whether you want to print grid lines, draft copy or are you printing the final copy. The current date or time can be printed too, along with a lot of meta data – file names, sheet names, page numbers etc. provide you with a fine control. Printing order – collated or by page, and auto fit to handle orphan printing of some columns can be a real paper saver.
Trees will love you for learning and using the page setup options within Excel well.
ADVANCED SORTING & FILTERING
Almost everyone figures out how to sort data on any column – in either ascending or descending order. But Excel allows you to perform custom formatting – based on your values, and your defined order.
Sorting for multiple, unlimited levels is a boon too. This breaks the limited 3 level sorting of previous versions, allowing you to sort as many levels as you please.
Filters have improved much in the past 10 years. Now you can easily filter the Top 10 or Bottom 10 values, filter by color, filter by values, and even filter by specific text or dates. There filter feature helps you to actually define the period of data or values that you want to focus on, and eliminate the rest. Master this simple feature, and get to your important data points quickly.
Filtering the values to focus on at any given time removes clutter and makes it easy to visualize information in Excel.
FORMATTING DATA INTO TABLES – A SUPER SIMPLE WAY TO ADD MAMMOTH FUNCTIONALITY, For Free!
Microsoft added the functionality to treat data as a table in Excel 2007. But the name they gave to the button that begins this functionality is a showstopper.

When you look at “Format As Table”, all you’ll see is multiple coloured data tables. And many an Excel enthusiasts pull away, thinking its just colors… They fail to learn the mammoth hidden functionality of Excel beneath this mis-labeled button.
But once you go over this hump, you are on your way to explore gold with Formatted Tables.
Since 2007, Excel Tables have come a long way. Now they have smart range names, auto fill and auto spill ranges, and use range names in calculations. There are several magic cells in Excel Tables, that can perform additional tasks too.
Becoming adept at using Table features of Excel will speed up your analysis.
Further, tables can be filtered, sorted, sliced. For date based data, you can add a Timeline, which is a slicer based of dates, but much better.
There you have it… These are just some of the advanced features of Excel. Learning about additional things like Custom Formatting, Range Naming, Working With multiple Worksheets, or combining data from multiple workbooks, consolidation, What-if analysis, Scenario Manager, Data Tables, Data Validation etc. will take your Advanced Excel knowledge to a much higher level. There is simply too much functionality to talk about in one article.
Suffice is to say that if you want to get done more, cheaper & faster, then learn some of these Advanced Excel Features, pronto!
How long does it take to learn excel?
There is no simple answer when you are beginning to learn a new skills. To learn Advanced Excel tricks is going to be the same too. It also depends on your interest, commitment, and the amount of time you are wiling to spend in learning it.
I would say that learning Advanced Excel tips and tricks is more of a journey.
You learn some concept, begin to apply it, and then learn some more. While learning, you will come across new concepts, see new problems, and seek newer ways to handle these challenges. This step by step approach will open your eyes, develop a keener sense of Excel capability, and develop your Excel muscle step by step, day by day!
I have been a student of Microsoft Excel for the past 30 years. And still I find new things, and new ways of doing the same things. It has been a fun and exciting journey and I love challenges in Excel.
Every once in a while, someone will send me a long and complex looking formula, and dissecting it, understanding it, and learning from it makes us all better. Helping others with their Excel has been one good way that has helped me grow my Excel competence.
Can you teach yourself Excel?
Yes, of course you can teach yourself Excel. And you can even learn Excel at home. All the same, I would recommend a step by step approach in self-learning of Advanced Excel . Based on your interest, it is safe to divide Excel Training into a few sections.
First begin with understanding Range Names, Conditional Formatting, Tables and Pivot Tables.
Then pick up more complex Logical & Lookup Functions to delve deeper.
After this, you can then focus on Financial or Statistical or Date Functions based on interest or usage within your organization.
No point in learning Excel for the sake of learning. You must apply it first. So find a challenging situation within your company or department, and seek to build a solution to fix it is a good way to get started in building your Excel muscles.
It is safe to say that if you begin learning Excel techniques by using this method, in 2-3 months you will see a big improvement in your understanding of Excel.
And in 6 months time you can be at a pretty advanced level in your Excel usage and your added competence will give you more confidence within your organization.
How Can I Learn Advanced Excel Faster?
If you find this route of self-learning difficult or too long, it may be better to develop and learn advanced excel skills in a more systematic and methodical manner.
I would recommend going for a formal training on Microsoft Excel. Based on your level, and interest, you can choose an Advanced Excel Training in your city or suburb. This is the best way to learn advanced Excel.
Most Advanced Excel courses are 2-3 days long, depending on their coverage.
Make sure you join a workshop where lots of exercises and hands-on is provided, and not just a demo of Excel functionality.
It’s because we all learn better by doing it ourselves, rather than just watching someone else do it.
Plus, doing the exercises yourself will expose you to the common pitfalls and mistakes, which can then be rectified with the trainer/facilitator, and with worked examples and samples, you will gain a better understanding of the topics.
Since 2003, ExcelChamp & Intellisoft Systems has been providing short courses on Excel at all levels:-
- Basic Excel Training,
- Advanced Excel Course,
- Excel Training for HR Professionals,
- Excel for Data Analysts
We also have Excel training for creating management charts and reports – called the Excel Dashboard MasterClass. For those looking to automate Excel, you may choose to enroll in the 3 Day Practical, hands-on, VBA Macro Programming workshop.
What is Advanced Excel Training?
A short Excel training of 2-3 days will cover the key concepts. In such a formal Excel training program, the notes, handouts, exercises & sample examples are readily available for you to begin using immediately.
I personally find learning anything in a short course to be more beneficial. It covers the concepts quickly, and then I can focus on the details based on my interest areas.
Plus the best thing for a formal training is that we have a trainer or facilitator available to ask questions along the way.
Learning in a sheltered environment is better as newbies often stop when they stumble upon initial concepts and often give up completely.
What are the Topics in Advanced Excel Training?
Make sure your chosen Excel training at least covers the most important topics, at the very least. Our 2 day Advanced Excel course in Singapore covers all these, and much more, with practical examples and exercises.
- Absolute & Relative Referencing
- Using Range Names
- Advanced Formulas & Functions
- Advanced Charting Techniques
- Using Tables
- Using Pivot Tables & Pivot Charts
- Sharing & Protection of Data/sheets
- Consolidating Data From Multiple Sheets/Books
- Recording and Running Simple Macros
This much can be covered in a 2 full day training if you can attend such a short course. And it can be an eye opener to the rich functionality of Excel.
What is the Best Excel Training Course?
If you are looking for the Best Excel training, look at some key things to consider, like time, speed, convenience & availability. If you can attend classroom training, I’d absolutely recommend it.
But if you are not able to find one in your town, you can opt for online training for Analyzing Business Data by Mastering Pivot Tables to get started first. There are plenty of Online Trainings for Microsoft Excel available. You can also checkout YouTube videos on Excel.
At ExcelChamp.Net, we provide both Classroom and e-learning via Zoom classes for Advanced Excel. You can choose from several dates available. These are extremely popular, and we have over 20+ years of running Excel classes.
All of our trainers come with years of industry experience. They have a passion for training and sharing their tips and tricks of Excel with you. You’d absolutely love our best advanced excel training course.
How Do I Get Excel Certified?
Most Advanced Excel courses will come with a certificate of Attendance. This is sufficient for most people, for real competence in Excel is more important that a certificate. Intellisoft offers such certificate of attendance for all of its 2 day Excel courses & workshops in Singapore.
To boost your resume & build your LinkedIn profile, a well recognized official certification in Excel is required!
There are 2 major certifications you can choose from
Microsoft Certified Professional (MCP) in several Microsoft technologies. For Excel, you can go for the Microsoft Office Specialist (MOS) certification. There are 2 levels – Associate and an Expert level. Better to go for the MOS Excel Associate level first, which is an easier Excel Exam. Then opt for the Expert MOS certificate in Excel. Beware that Microsoft certifications are pretty expensive.
Another option is to go for the extremely popular certification from the International Computer Driving License (ICDL Foundation). In Asia, this certificate is available at the Foundation and Advanced levels.
At Intellisoft Training, we are the official partners with Microsoft, and ICDL Asia, and are authorized to administer both the certifications in Excel. You can choose the Microsoft one, or the ICDL one, based on your preference.
The ICDL Certification is widely recognized by the Singapore government ministries. It is a tad cheaper in terms of the exam assessment fee too.
Plus, the Singapore government subsidizes the Advanced Excel Training Fee & Certification fee, allowing permanent residents and Singapore citizens to get certified in Advanced Excel skills. It is considered an Essential skill for office use, and is considered a must have for all office executives, analysts & managers. Do contact us for more information on this.
Next Steps: For Enhancing Your Spreadsheet Skills With Advanced Excel Training
With so much demand for Advanced Excel skills, so rich & useful functionality in Excel, and an easy path to victory with Excel, what are you waiting for. Grab the next chance to explore Excel in greater depths. Enroll in a classroom training, an e-learning training, or attend a Zoom class. Whatever it takes, just get started, right away.
Excel is the secret Swiss Army knife in your data analysis toolbox.
Just imagine, how far you can go with a proper, formal Advanced Excel Training! The opportunities are limitless, and so is your future!
Cheers,
Vinai Prakash
Founder & Master Trainer of ExcelChamp.Net
Home / Top 25 EXCEL SKILLS – All Levels (Basic | Intermediate | Advanced) + Test
Check Top 10 Excel Skills out of the Top 25
These days no matter on which profile you are working, from accountant to data analyst, HR to product manager, having Excel skills have huge benefits.
When we talk about Excel skills, we can further categorize them in 3 levels:
- Basic Excel Skills
- Intermediate Excel Skills
- Advanced Excel Skills
And in this tutorial, we will be covering all these three levels in detail, one by one, so let’s get started.
Below you have the top ten basic Excel skills to learn by anyone who is just starting out with Excel needs to learn.
1. Saving and Opening a Workbook
Saving and opening an Excel workbook is just like as you do in any other application.

When you click on the file tab it shows you the option to save the file.

And when you click on the save button it opens the save as dialog box from where you can specify the location and you can also select the file format to use.

Basically, Excel has different file extensions that you can use for saving a workbook. You can use the above steps if you are saving a file for the first time and if you have a file that is already saved in the system, you just need to press Control + S to save the changes.
In the same way, if you want to open a file that is saved on your system you can go to the FILE tab and click on the open.

It shows you the open dialog box from where you can locate the file and open it.
2. Managing Worksheets
Every workbook consists of worksheets where you can add your data and analyze it and once you open an Excel workbook you can see there are tabs at the bottom of the window.

To insert a new worksheet simply click on the plus button or you can also use the shortcut key Shift + F11.

And if you want to delete a worksheet just right-click on the worksheet tab and then select the delete option or you can also use the shortcut key Alt ➜ H ➜ D ➜ S.

But there’s one thing that you need to take care that once you delete a worksheet you can’t get it back.
3. Formatting Cells
In Excel, you have a bunch of options on the home tab for formatting.

- The font group gives you the option to format the font by making it bold, italic, and underline. You can change the font size, and color of the font and cell color.
- From the alignment group, you can define the alignment of the text, add indent, merge-unmerge cells, and wrap the text.
- And from the number group, you can apply accounting format, text format, number format with or without comma style, etc.
Apart from the above options, you can also open the format cell options by right-clicking on a cell and selecting the format option or you can also use the shortcut key Control + 1.

4. Printing
When you go to the File tab, you can find there is a print button that further includes all the printing options that you can use for printing data from a worksheet.
You can also use the shortcut key Control + P to open the print option and once you open it you can see the following options there:

- Print Area
- Range of Pages to Print
- Collision
- Page Orientation
- Page Type
- Margins
- Scaling
5. Excel Functions (Basic)
The biggest power of Excel is its functions that you can use to perform a lot of calculations below you have a list of the top ten Basic Excel Functions:
- SUM: With this function, you can sum values from multiple cells, or you can also input values directly into the function.
- COUNT: This function returns the count of numeric values in a cell. You can refer to the cells where you have values or simply insert the values into them.
- AVERAGE: It returns the average of numeric values. You can refer to the cells where you have the values or simply insert them into the function.
- TIME: It returns a valid time serial number as per Excel’s time format. You need to specify hours, minutes, and seconds.
- DATE: It returns a valid date (date serial number) as per Excel’s time format by using the day, month, and year specified.
- LEFT: It extracts specific characters from a cell/string starting from the left (start). You need to specify the text and number of characters to extract.
- RIGHT: It extracts specific characters from a string starting from the right (last). You need to specify the text and number of characters to extract.
- VLOOKUP: It looks up a value in a column and can return that value or a value from the corresponding columns using the same row number.
- IF: IF function (tests a condition) returns a value when the specific condition is TRUE and returns another value if that condition is FALSE.
- NOW: It returns the current date and time (using your system’s settings) in the cell where you insert it.
And here are the Top 100 Excel Functions for you to learn more.
- String (Text) Functions
- Date Functions
- Time Functions
- Logical Functions
- Math Functions
- Statistical Functions
- Lookup Functions
- Information Functions
- Financial Functions
6. Charts
Once you start working on data probably you need to present it to someone, and a chart is one of the best ways to this.
In Excel, you have a whole list of charts that you can create. Once you go to the Insert tab, and in the charts group you can find all the charts which are available to use.

But to create a chart in Excel you need to have data in the right format, and then you need to select the right type of chart (make sure to check out this guide on chart types). For example, below you have 12 months of data for the sales quantity.

You can create a column chart to present this monthly data.

But you can also use a line chart if you want to show the trend for the 12 months.

But below you have product-wise data.

And in this case, the perfect chart would be a pie chart where you can present the quantity share of these products.

You can also use the recommended charts button to let Excel recommend a chart type according to the data you have.

You just need to select the data and click on the recommended chart button.

You can customize a chart in different ways. Once you select the chart you will have Chart Design and Format tabs where you have all the options for customization.

7. Sorting Data
Excel gives you a powerful option to sort data. To open the sort option, you need to go to the Data Tab and then click on the Sort button.

Now here you have 3 things to define:

- Sort by: The column to use as the base of sorting.
- Sort on: In the sort drop-down, you have 4 different options to sort values on. You can use cell value, cell color, font color, and conditional formatting.
- Order: The order of sorting or a custom order.
You can also use more than one level of sorting. If you want to add a new level simply click on the Add Level and then define all the three things that we have discussed above.

Related: Sort By Date, Date and Time & Reverse Date Sort
8. Find and Replace Option
Just like any other application, Excel has its own find and replace option. The shortcut key to open the find is Control +F and to find and replace it is Control + R.
In the “Find what” input bar, enter the value that you want to find, and in the “Replace with” enter the value with which you want to replace.

Now if you want to replace or find all the values, use the replace all or find all buttons, otherwise, you can use the “Find Next” and “Replace” buttons for a single value.
And once you click on the options button, you’ll see that there are some advanced options that you can use.

- Perform case-sensitive find and replace.
- Find and replace in the entire workbook.
- Find and replace using the cell format.
- And you can also find values from comments and notes.
9. Paste Special Option
The paste special option gives you complete control over how you want to paste values in a cell.
To open the page special option, you need to go to the Home tab and then click on the dropdown “Paste” and click on the paste special (You can also open the page special from the right-click menu).

In the paste special dialog box, you have multiple options that you can use.

Let’s say, you have a cell where you have a formula, but you only want to copy and paste the value from that cell. In this case, simply copy that cell and use the “Values” option from the paste special options on the destination cell.

Or if you want to copy and paste the format from one cell to another you can use the “Formats” option.
Related: Format Painter | Transpose
10. Keyboard Shortcuts
From Excel 2007 to Excel 2019, you can locate a keyboard shortcut by pressing the ALT key. On pressing it, it shows the shortcut keys for the options which are there on the ribbon, just like below.

And from here you can download (Excel Shortcuts Cheat Sheet) which covers the top eighty two keyboard shortcuts for Excel.
More Tutorials on Basic Excel Skills
Now once you master the basic stuff the next thing you need to understand is the Intermediate Excel Skills. Basically, these skills include options and methods to manage and work data in an efficient way.
11. Go To Special
The GO TO SPECIAL option helps you navigate to a specific cell or a range of cells within the worksheet. To open it you need to go to the Home Tab ➜ Editing ➜ Find and Select ➜ Go To special.

As you can see it has different options that you can use and select the different kinds of cells.

For example, if you want to select all the cells which are blank, you need to select the blank and click OK, and it will instantly select all the blank cells.
In the same way, if you want to select cells that have formulas and return numbers, you need to select formulas and then tick-mark numbers, and then click OK.

12. Pivot Table
Pivot Tables are one of the best ways to analyze data. You can create a summary table out of a large data set. To create a pivot table, follow the below steps:
- First, go to the Insert Tab and click on the pivot table button.

- You’ll have a dialog box to specify the source data, but as you have already selected the data it takes the range automatically.

- Once you click OK, you will have a sidebar just like below where you can define the rows, columns, and values for the pivot table that you can simply drag and drop. And now, add “Age” to the rows, “Education” to the column, and “First Name” to the values.

Once you define all, you’ll have a pivot chart like the one below.

More on Pivot Tables
- Rank in a Pivot Table
- Update Pivot Table Range Automatically
- Pivot Table Calculated Field
- Grouping Dates in Pivot Table
- Link multiple Pivot Tables to One Slicer
- Add a Date Timeline to the Current Pivot Table
- Refresh All Pivot Tables
- Running total in Pivot Table
13. Named Range
Named Range is about giving a name to a cell or range of cells. In Excel, every cell has its address which is a combination of row and column.
Related: Excel R1C1 Style
But with the named range you can give that cell or the range of cells a specific name (Generic) and then you can use that name to refer to it.
Let’s say you have a tax percentage in cell A1 and now instead of using the reference, you can give a name to it and then use that name in every calculation.
- To create a named range, you need to go to the Formula Tab ➜ Define Names ➜ Define name.

- Now in the define name dialogue box, you need to define the following things:

- Name of the range.
- Scope to use that range in the entire workbook or just in the worksheet.
- Comment if you want to add any.
- And then the address of the cell or the range.
Now once you click OK, Excel will assign that name to cell A1 and you can use that in formulas to refer to cell A1.

In the same way, you can also create a named range for the range of cells and then you can refer to it in the formulas.
14. Drop Down Lists
A drop-down list is basically a predefined list of values that can help you quickly enter the data in a cell. To create a dropdown list, you need to go to the Data Tab ➜ Data Tools ➜ Data Validation ➜ Data Validation.

Now in the data validation dialog box, you need to select the list from the allow, and then in the source you need to refer to the range from where you want to take values (You can also insert values directly into the source input box).

In the end, click OK
Now when you go back to the cell, you’ll have a dropdown list from which you can select the value to insert into the cell.

More on Drop Down Lists
- Dependent Drop-Down List
- Dynamic Drop-Down List
15. Conditional Formatting
The basic idea of conditional formatting is to use conditions and formulas for formatting and the best part is there are more than 20 options that you can apply with a single click.

Let’s say you want to highlight all the duplicate values from a range of cells, you just need to go to the Home Tab ➜ Conditional Formatting ➜ Highlight Rules ➜ Duplicate Values.

And you also have data bars, color skills, and icons to apply.
Make sure to explore all the options and check out this guide if you want to learn to use formulas in conditional formatting.
16. Excel Table
Excel table converts normal data into a structured table where you can sort, filter, and analyze data easily.

To convert your normal data into an Excel table all you need to do is use the keyboard shortcut key Control + T or you can also go to the Insert tab ➜ Table.

Excel tables by Microsoft | Rename an Excel Table | Excel Slicer
17. Idea Button
If you’re using Office 365 you can have access to the new Idea Button introduced by Microsoft that can help you to analyze your data in an easy way by recommending the possible ways to create:
- Pivot Tables
- Trendline Charts
- Frequency Distribution Chart
You simply need to select the data and then click on the idea button which is on the home tab.

It takes a few seconds to analyze the data and then show you a list of possible outcomes.

18. Using Sparklines
Sparklines are tiny charts you can insert into a cell, based on a range of data.
To insert a sparkline you need to go to the Insert Tab ➜ Sparklines.

There are 3 types of sparklines that you can insert into a cell.
- Line
- Column
- Win-Loss

When you click on the sparkling button it shows you a dialog box where you need to select the data range and the destination range of the sparkling.

Apart from this, you have options to customize a sparkline by changing its color, adding markers, and much more from the sparkline tab.

19. Text to Column
With the text-to-column option, you can split a single column into multiple columns using a separator. It’s one of the best ways to clean and transform your data.
Look at the below table where you have a column with names and between first name and last name there is a space.

You can split this column into two different columns (first name and last name) using text to column by using space as a separator.
- First, go to the Data Tab and click on the Text to Column.

- Now, from the dialog box select delimiter and click next.

- After that, tick-mark the space. As you can see it has separated values from the column using the space.

- In the end, click next and then finish.
The moment you click the finish, it converts that one column of full names into two different columns (first and last name).

20. Quick Analysis Tool
As the name suggests the Quick Analysis Tool allows you to analyze the data with one or two clicks. What I’m trying to say is, it has some of the selected options that can help you to analyze and present the data.
Below you have student data with their score the moment you select it you get a small icon at the bottom of the screen which is the button for the quick analysis tool.

Now when you click on it, it shows you a few tabs from which you can select options. Now let’s explore each tab one by one.
- Formatting: This tab allows you to add conditional formatting to the selected table, like, as data bars, color scale, icon sets, and other conditional formatting rules.

- Charts: This tab shows you some of the recommended charts which you can insert with the selected data or you can also click on more charts to select a specific chart.

- Total: From this tab, you can quickly add some of the basic formulas, like average count, running total, and many more.

- Table: From this tab, you can insert a pivot table with the selected data, and you can also apply an Excel table to it.

- Sparklines: This tab allows you to add sparklines which are basically tiny charts that you can create within a cell.

Advanced Excel Skills
Advanced Excel skills are more about solving complex problems and making you efficient to do all the work done in Excel, and below you have top advanced Excel skills that you need to master.
21. Advanced Excel Formulas
An ADVANCED EXCEL FORMULA (Excel Formulas List) means combining different functions to calculate a specific value that is not possible to calculate otherwise. Below is a list of some of the most important ones:
Advanced Formula Examples
22. Advanced Excel Charts
As you have already seen that you can create most of the charts in Excel with a few clicks, but apart from all those charts you can also create some advanced charts.

Advanced Excel Charts are for a specific purpose and need you to spend a few minutes learning how to create and how they presented data. Below you have a list (tutorials) for some of the Advanced charts that you can learn to create in Excel.
23. Visual Basic for Applications
VBA is an object-oriented programming language for Microsoft office applications, and you can use it in Excel to write VBA codes to automate the activities that you normally perform manually.

24. Power Query
If you work with data, I’m sure you face this situation where you need to clean and transform data before you use it.

Now the thing is cleaning data and transforming data is a tedious process and you need to spend a big chunk of your time on it every day. But with the power query, you can do this entire process of cleaning and transform with a few clicks.
Power query basically works as an ETL where you can extract data from different sources, transform it, and then load it back to the worksheet. Check out this complete tutorial on Power Query and do not forget to learn to combine multiple Excel files.
25. Power Pivot
Power Pivot is basically a data modeling technique that you can use to import data of millions of rows, from multiple sources, and then perform calculations (DAX).

To get started with Power Pivot:
- Introduction to Power Pivot
- Power Pivot – Overview and Learning
Learn More
- Excel Tips and Tricks
- Excel Watch Window
- Excel Formula Bar