
Solver is a Microsoft Excel add-in program you can use for what-if analysis. Use Solver to find an optimal (maximum or minimum) value for a formula in one cell — called the objective cell — subject to constraints, or limits, on the values of other formula cells on a worksheet. Solver works with a group of cells, called decision variables or simply variable cells that are used in computing the formulas in the objective and constraint cells. Solver adjusts the values in the decision variable cells to satisfy the limits on constraint cells and produce the result you want for the objective cell.
Put simply, you can use Solver to determine the maximum or minimum value of one cell by changing other cells. For example, you can change the amount of your projected advertising budget and see the effect on your projected profit amount.
Note: Versions of Solver prior to Excel 2007 referred to the objective cell as the «target cell,» and the decision variable cells as «changing cells» or «adjustable cells». Many improvements were made to the Solver add-in for Excel 2010, so if you’re using Excel 2007 your experience will be slightly different.
In the following example, the level of advertising in each quarter affects the number of units sold, indirectly determining the amount of sales revenue, the associated expenses, and the profit. Solver can change the quarterly budgets for advertising (decision variable cells B5:C5), up to a total budget constraint of $20,000 (cell F5), until the total profit (objective cell F7) reaches the maximum possible amount. The values in the variable cells are used to calculate the profit for each quarter, so they are related to the formula objective cell F7, =SUM (Q1 Profit:Q2 Profit).
1. Variable cells
2. Constrained cell
3. Objective cell
After Solver runs, the new values are as follows.
-
On the Data tab, in the Analysis group, click Solver.

Note: If the Solver command or the Analysis group is not available, you need to activate the Solver add-in. See: How to activate the Solver add-in.
-
In the Set Objective box, enter a cell reference or name for the objective cell. The objective cell must contain a formula.
-
Do one of the following:
-
If you want the value of the objective cell to be as large as possible, click Max.
-
If you want the value of the objective cell to be as small as possible, click Min.
-
If you want the objective cell to be a certain value, click Value of, and then type the value in the box.
-
In the By Changing Variable Cells box, enter a name or reference for each decision variable cell range. Separate the non-adjacent references with commas. The variable cells must be related directly or indirectly to the objective cell. You can specify up to 200 variable cells.
-
-
In the Subject to the Constraints box, enter any constraints that you want to apply by doing the following:
-
In the Solver Parameters dialog box, click Add.
-
In the Cell Reference box, enter the cell reference or name of the cell range for which you want to constrain the value.
-
Click the relationship ( <=, =, >=, int, bin, or dif ) that you want between the referenced cell and the constraint.If you click int, integer appears in the Constraint box. If you click bin, binary appears in the Constraint box. If you click dif, alldifferent appears in the Constraint box.
-
If you choose <=, =, or >= for the relationship in the Constraint box, type a number, a cell reference or name, or a formula.
-
Do one of the following:
-
To accept the constraint and add another, click Add.
-
To accept the constraint and return to the Solver Parameters dialog box, click OK.
Note You can apply the int, bin, and dif relationships only in constraints on decision variable cells.You can change or delete an existing constraint by doing the following:
-
-
In the Solver Parameters dialog box, click the constraint that you want to change or delete.
-
Click Change and then make your changes, or click Delete.
-
-
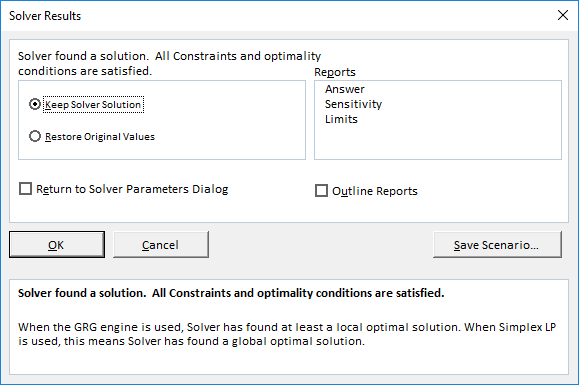
Click Solve and do one of the following:
-
To keep the solution values on the worksheet, in the Solver Results dialog box, click Keep Solver Solution.
-
To restore the original values before you clicked Solve, click Restore Original Values.
-
You can interrupt the solution process by pressing Esc. Excel recalculates the worksheet with the last values that are found for the decision variable cells.
-
To create a report that is based on your solution after Solver finds a solution, you can click a report type in the Reports box and then click OK. The report is created on a new worksheet in your workbook. If Solver doesn’t find a solution, only certain reports or no reports are available.
-
To save your decision variable cell values as a scenario that you can display later, click Save Scenario in the Solver Results dialog box, and then type a name for the scenario in the Scenario Name box.
-


-
After you define a problem, click Options in the Solver Parameters dialog box.
-
In the Options dialog box, select the Show Iteration Results check box to see the values of each trial solution, and then click OK.
-
In the Solver Parameters dialog box, click Solve.
-
In the Show Trial Solution dialog box, do one of the following:
-
To stop the solution process and display the Solver Results dialog box, click Stop.
-
To continue the solution process and display the next trial solution, click Continue.
-
-
In the Solver Parameters dialog box, click Options.
-
Choose or enter values for any of the options on the All Methods, GRG Nonlinear, and Evolutionary tabs in the dialog box.
-
In the Solver Parameters dialog box, click Load/Save.
-
Enter a cell range for the model area, and click either Save or Load.
When you save a model, enter the reference for the first cell of a vertical range of empty cells in which you want to place the problem model. When you load a model, enter the reference for the entire range of cells that contains the problem model.
Tip: You can save the last selections in the Solver Parameters dialog box with a worksheet by saving the workbook. Each worksheet in a workbook may have its own Solver selections, and all of them are saved. You can also define more than one problem for a worksheet by clicking Load/Save to save problems individually.
You can choose any of the following three algorithms or solving methods in the Solver Parameters dialog box:
-
Generalized Reduced Gradient (GRG) Nonlinear Use for problems that are smooth nonlinear.
-
LP Simplex Use for problems that are linear.
-
Evolutionary Use for problems that are non-smooth.
Important: You should enable the Solver add-in first. For more information, see Load the Solver add-in.
In the following example, the level of advertising in each quarter affects the number of units sold, indirectly determining the amount of sales revenue, the associated expenses, and the profit. Solver can change the quarterly budgets for advertising (decision variable cells B5:C5), up to a total budget constraint of $20,000 (cell D5), until the total profit (objective cell D7) reaches the maximum possible amount. The values in the variable cells are used to calculate the profit for each quarter, so they are related to the formula objective cell D7, =SUM(Q1 Profit:Q2 Profit).
 Variable cells
 Constrained cell
 Objective cell
After Solver runs, the new values are as follows.
-
In Excel 2016 for Mac: Click Data > Solver.
In Excel for Mac 2011: Click the Data tab, under Analysis, click Solver.
-
In Set Objective, enter a cell reference or name for the objective cell.
Note: The objective cell must contain a formula.
-
Do one of the following:
To
Do this
Make the value of the objective cell as large as possible
Click Max.
Make the value of the objective cell as small as possible
Click Min.
Set the objective cell to a certain value
Click Value Of, and then type the value in the box.
-
In the By Changing Variable Cells box, enter a name or reference for each decision variable cell range. Separate the nonadjacent references with commas.
The variable cells must be related directly or indirectly to the objective cell. You can specify up to 200 variable cells.
-
In the Subject to the Constraints box, add any constraints that you want to apply.
To add a constraint, follow these steps:
-
In the Solver Parameters dialog box, click Add.
-
In the Cell Reference box, enter the cell reference or name of the cell range for which you want to constrain the value.
-
On the <= relationship pop-up menu, select the relationship that you want between the referenced cell and the constraint.If you choose <=, =, or >=, in the Constraint box, type a number, a cell reference or name, or a formula.
Note: You can only apply the int, bin, and dif relationships in constraints on decision variable cells.
-
Do one of the following:
To
Do this
Accept the constraint and add another
Click Add.
Accept the constraint and return to the Solver Parameters dialog box
Click OK.
-
-
Click Solve, and then do one of the following:
To
Do this
Keep the solution values on the sheet
Click Keep Solver Solution in the Solver Results dialog box.
Restore the original data
Click Restore Original Values.
Notes:
-
To interrupt the solution process, press ESC . Excel recalculates the sheet with the last values that are found for the adjustable cells.
-
To create a report that is based on your solution after Solver finds a solution, you can click a report type in the Reports box and then click OK. The report is created on a new sheet in your workbook. If Solver doesn’t find a solution, the option to create a report is unavailable.
-
To save your adjusting cell values as a scenario that you can display later, click Save Scenario in the Solver Results dialog box, and then type a name for the scenario in the Scenario Name box.
-
In Excel 2016 for Mac: Click Data > Solver.
In Excel for Mac 2011: Click the Data tab, under Analysis, click Solver.
-
After you define a problem, in the Solver Parameters dialog box, click Options.
-
Select the Show Iteration Results check box to see the values of each trial solution, and then click OK.
-
In the Solver Parameters dialog box, click Solve.
-
In the Show Trial Solution dialog box, do one of the following:
To
Do this
Stop the solution process and display the Solver Results dialog box
Click Stop.
Continue the solution process and display the next trial solution
Click Continue.
-
In Excel 2016 for Mac: Click Data > Solver.
In Excel for Mac 2011: Click the Data tab, under Analysis, click Solver.
-
Click Options, and then in the Options or Solver Options dialog box, choose one or more of the following options:
To
Do this
Set solution time and iterations
On the All Methods tab, under Solving Limits, in the Max Time (Seconds) box, type the number of seconds that you want to allow for the solution time. Then, in the Iterations box, type the maximum number of iterations that you want to allow.
Note: If the solution process reaches the maximum time or number of iterations before Solver finds a solution, Solver displays the Show Trial Solution dialog box.
Set the degree of precision
On the All Methods tab, in the Constraint Precision box, type the degree of precision that you want. The smaller the number, the higher the precision.
Set the degree of convergence
On the GRG Nonlinear or Evolutionary tab, in the Convergence box, type the amount of relative change that you want to allow in the last five iterations before Solver stops with a solution. The smaller the number, the less relative change is allowed.
-
Click OK.
-
In the Solver Parameters dialog box, click Solve or Close.
-
In Excel 2016 for Mac: Click Data > Solver.
In Excel for Mac 2011: Click the Data tab, under Analysis, click Solver.
-
Click Load/Save, enter a cell range for the model area, and then click either Save or Load.
When you save a model, enter the reference for the first cell of a vertical range of empty cells in which you want to place the problem model. When you load a model, enter the reference for the entire range of cells that contains the problem model.
Tip: You can save the last selections in the Solver Parameters dialog box with a sheet by saving the workbook. Each sheet in a workbook may have its own Solver selections, and all of them are saved. You can also define more than one problem for a sheet by clicking Load/Save to save problems individually.
-
In Excel 2016 for Mac: Click Data > Solver.
In Excel for Mac 2011: Click the Data tab, under Analysis, click Solver.
-
On the Select a Solving Method pop-up menu, select one of the following:
|
Solving Method |
Description |
|---|---|
|
GRG (Generalized Reduced Gradient) Nonlinear |
The default choice, for models using most Excel functions other than IF, CHOOSE, LOOKUP and other “step” functions. |
|
Simplex LP |
Use this method for linear programming problems. Your model should use SUM, SUMPRODUCT, + — and * in formulas that depend on the variable cells. |
|
Evolutionary |
This method, based on genetic algorithms, is best when your model uses IF, CHOOSE, or LOOKUP with arguments that depend on the variable cells. |
Note: Portions of the Solver program code are copyright 1990-2010 by Frontline Systems, Inc. Portions are copyright 1989 by Optimal Methods, Inc.
Because add-in programs aren’t supported in Excel for the web, you won’t be able to use the Solver add-in to run what-if analysis on your data to help you find optimal solutions.
If you have the Excel desktop application, you can use the Open in Excel button to open your workbook to use the Solver add-in.
More help on using Solver
For more detailed help on Solver contact:
Frontline Systems, Inc.
P.O. Box 4288
Incline Village, NV 89450-4288
(775) 831-0300
Web site: http://www.solver.com
E-mail: info@solver.com
Solver Help at www.solver.com.
Portions of the Solver program code are copyright 1990-2009 by Frontline Systems, Inc. Portions are copyright 1989 by Optimal Methods, Inc.
Need more help?
You can always ask an expert in the Excel Tech Community or get support in the Answers community.
See Also
Using Solver for capital budgeting
Using Solver to determine the optimal product mix
Introduction to what-if analysis
Overview of formulas in Excel
How to avoid broken formulas
Detect errors in formulas
Keyboard shortcuts in Excel
Excel functions (alphabetical)
Excel functions (by category)
What is Solver in Excel?
The solver in excel is an analysis tool that helps find solutions to complex business problems requiring crucial decisions to be made. For every problem, the goal (objective), variables, and constraints are identified. The solver returns an optimal solution which sets accurate values of the variables, satisfies all constraints, and meets the goal.
For example, the solver helps create the most appropriate project schedule, minimize an organization’s expenses on transportation of its employees, maximize the profits generated by a given marketing plan, and so on.
The solver can solve the following types of problems:
- Optimization problems where profits need to be maximized and costs need to be minimized
- Arithmetic equations
- Linear and nonlinear problems
In optimization problems, the solver in excel helps to minimize or maximize the objective based on certain variables. Being known as a “what-if analysisWhat-If Analysis in Excel is a tool for creating various models, scenarios, and data tables. It enables one to examine how a change in values influences the outcomes in the sheet. The three components of What-If analysis are Scenario Manager, Goal Seek in Excel, and Data Table in Excel.read more” tool, the solver is enabled by the “add-insAn add-in is an extension that adds more features and options to the existing Microsoft Excel.read more” option or the Developer tab of Excel.
Table of contents
- What is Solver in Excel?
- The Functioning of the Excel Solver
- How to add “Solver Add-In” in Excel?
- The Terminologies of the Solver in Excel
- The Types of Solving Methods
- How to use the Solver in Excel?
- Example #1
- Example #2
- The Applications of the Solver Excel Model
- Frequently Asked Questions
- Recommended Articles
The Functioning of the Excel Solver
For solving a problem, the user has to input certain parameters based on which the solver operates. The tasks of the user followed by the functions of the solver are listed as under:
- Identify the goal (objective) of the problem–This tells the solver what has to be done, thereby lending a direction to the solver.
- Choose the variables of the problem–This tells the solver the areas it has to work upon. The solver in excel returns the most appropriate values of the variables that meet the goal.
- Set the constraints of the problem–This tells the solver to work within the limits defined by the constraints. The solver returns a solution that meets the goal and, at the same time, does not go beyond these limitations.
Hence, the entire solution is focused on the goal of the problem. The solver returns the best possible solution for a problem keeping in mind the set of controls.
How to add “Solver Add-In” in Excel?
The “solver add-in” is not enabled by default in Excel. The two ways to activate the “add-in” are stated as follows:
a. With the “add-ins” option of the File menu
b. With the Developer tabEnabling the developer tab in excel can help the user perform various functions for VBA, Macros and Add-ins like importing and exporting XML, designing forms, etc. This tab is disabled by default on excel; thus, the user needs to enable it first from the options menu.read more
You can download this Solver Excel Template here – Solver Excel Template
a. The steps under “add-ins” option of the File menu are listed as follows:
- Click on the File menu.

- Select “options” from the various options listed in the menu.

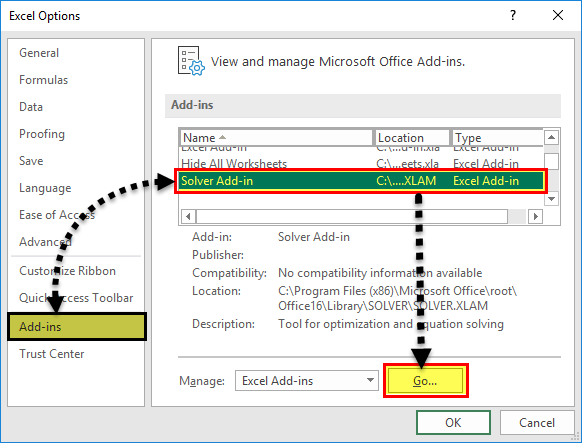
- Click on “add-ins.” Select “solver add-in” and click “go.”

- Select the checkbox for “solver add-in” and click “Ok.”


b. The steps under the Developer tab option are listed as follows:
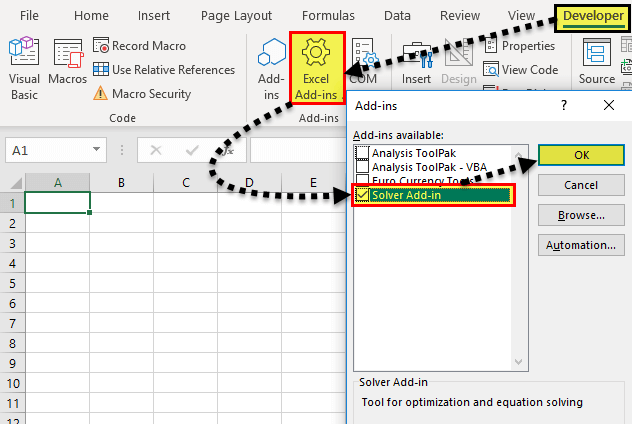
- In the Developer tab, click on “Excel add-ins” in the “add-ins” group. Select the checkbox “solver add-in” and click “Ok.”
- Once installed, the “solver” button appears in the “analysis” group of the Data tab.

The Terminologies of the Solver in Excel
The solver model consists of the objective cells, variable cells, constraints, and formulas that interconnect these components. The excel solver finds an optimal solution to the formula mentioned in the objective cell by changing the variable data cells, given the restrictions of the constraint cells.
Let us understand the terminologies used in the “solver parameters” dialog box. This will be helpful when running the solver. The terms are defined as follows:
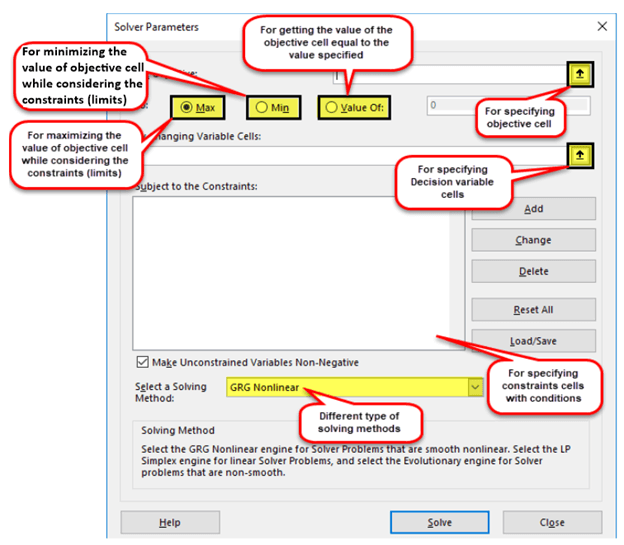
- Objective cell: This is a single cell which contains a formula. The formula is decision-based and subject to the restrictions of the constraint cells. The value of the objective cell can be minimized, maximized, or set equal to the specified target value.
- Decision variable or variable cells: These are the cells in which the solver returns the values based on the objective of the problem. Since these data cells are variable, they can be changed with respect to the objective. In Excel, up to 200 variable cells can be specified.
- Constraint cells: These are the limitations within which the given problem is solved. In other words, they are the conditions that should be satisfied.
The Types of Solving Methods
The three methods to solve the data in the excel solver are listed as follows:
- GRG nonlinear
The acronym “GRG” stands for “generalized reduced gradient nonlinear.” This method helps solve nonlinear problems. A nonlinear problem may have more than one feasible region. Alternatively, it may have a set of similar values for the variable cells with all the constraints being satisfied.
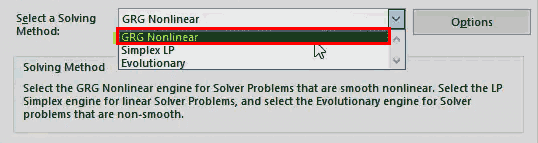
2. Simplex LP
The acronym “LP” stands for linear problems. This method helps solve linear programming problems and works faster than the GRG nonlinear method. In a linear programming problem, a single objective has to be maximized or minimized subject to certain conditions.
The simplex LP and GRG nonlinear method both are used for smooth problems.

3. Evolutionary
This method helps solve non-smooth problems, which consist of discontinuous functions. The non-smooth problems are the most challenging optimization models to solve.

How to use the Solver in Excel?
Let us consider some examples to understand the solver tool of Excel.
You can download this Solver Excel Template here – Solver Excel Template
Example #1
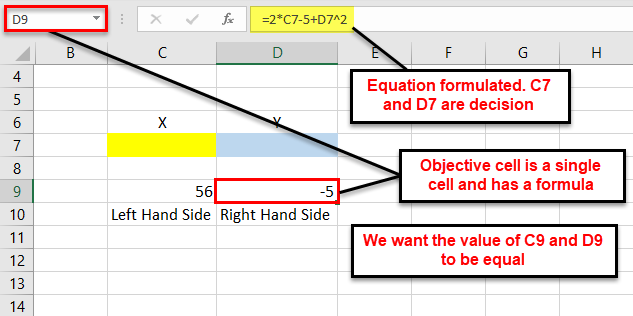
We want to find the value of X and Y in the following arithmetic equation with the help of the solver tool.
56=2X-5+Y2
Step 1: Formulate the equation on an Excel sheet, as shown in the following image.
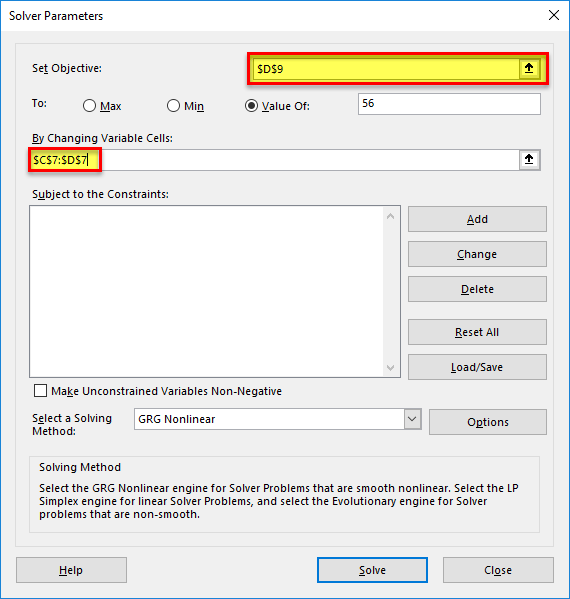
Step 2: Click the “solver” button in the “analysis” group of the Data tab. The “solver parameters” dialog box opens. Enter cell “$D$9” in the objective cell, as shown in the succeeding image. The variable cells are “$C$7:$D$7.”
In the “value of” box, type 56. This is because the right-hand side value of the given equation should be equal to 56.
Step 3: Select GRG nonlinear in the “select a solving method” box. Click “solve.”
Note: The GRG nonlinear is the default solving method.
Step 4: The “solver results” box appears. This box may take some time to display depending on the complexity of the model. Select “keep solver solution” and click “Ok,” as shown in the following image.
Step 5: The results are shown in the following image. The solver has calculated X as 30.5 and Y as 0. The right-hand and left-hand sides both are equal now.

Example #2
The succeeding image provides the details of an organization that manufactures a television set, stereo, and speaker. The raw materials used are chassis, picture tube, speaker cone, power supply, and electronics. The leftover stock of raw materials is given in G10:G14.
We want to maximize the overall profits given the limited availability of the raw materials.
The variable cells, constraint cells, and the objective cell are highlighted.
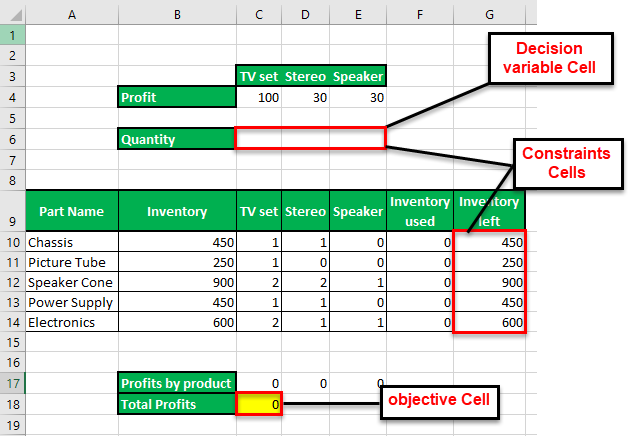
Step 1: Calculate the “used inventory” in F10:F14. The formula is shown in the following image.

Step 2: Click the “solver” button in the “analysis” group of the Data tab. In the “solver parameters” dialog box, click “add” to the right of the “subject to the constraints” box.
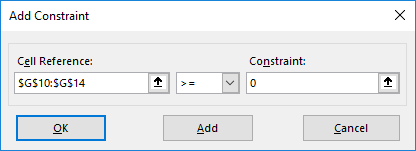
Step 3: The “add constraint” box appears, as shown in the succeeding image. The constraints are defined as follows:
- The leftover stock of raw materials should be greater than or equal to zero. So, enter “$G$10:$G$14” in the “cell referenceCell reference in excel is referring the other cells to a cell to use its values or properties. For instance, if we have data in cell A2 and want to use that in cell A1, use =A2 in cell A1, and this will copy the A2 value in A1.read more” box. In the box to the right, type the comparison operator “>=.” In the “constraint” box, enter “0.”
- The quantity of the three products (television set, stereo, and speaker) should be greater than or equal to zero. So, enter “$C$6:$E$6>=0” as done for the preceding point.
After entering every constraint, click the “add” button to add it to the “solver parameters” box. Once all constraints have been entered, click “Ok.”
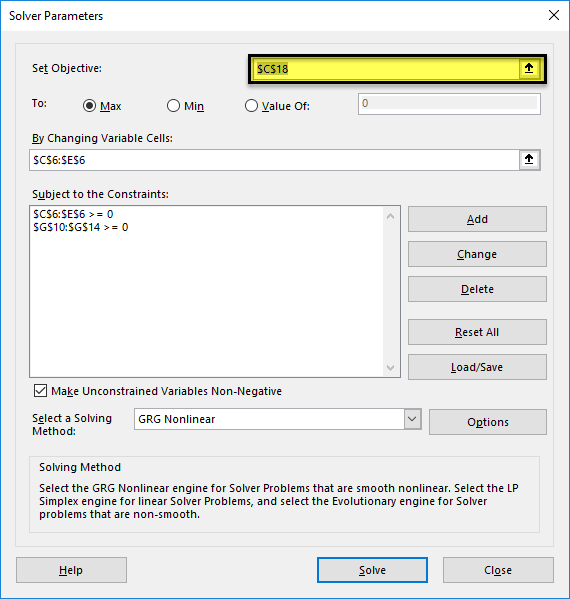
Step 4: In the “solver parameters” box, enter “$C$18” in the “set objective” box. Select the “max” option. In the “by changing variable cells” box, enter “$C$6:$E$6.” Select the solving method as GRG nonlinear. Click “solve.”
Step 5: The output is shown in the following image. The organization must produce 250 television sets, 50 stereos, and 50 speakers to make a profit of $28,000. The product-wise profits are also displayed in C17:E17.
This is an optimal solution given the constraints. With these numbers, the organization will be able to utilize its resources efficiently.

The Applications of the Solver Excel Model
The major applications of the excel solver are listed as follows:
- It helps take decisions at the top level of management. For instance, an organization may want to maximize the profits and minimize the costs given the limited resources of inventory and manpower.
- It helps solve the day-to-day problems of life which can be converted into arithmetic equations. For instance, a housewife may require an optimal monthly budget to be created which can meet the family’s financial needs, given the limitations.
Frequently Asked Questions
1. Define the solver in Excel.
The solver can solve optimization problems, arithmetic equations, and linear and nonlinear programming models. It helps minimize or maximize the output based on the associated variables and the given constraints.
The solver tool consists of three components which are stated as follows:
• Objective cell – This contains a formula which is to be solved.
• Variable cells – These cells contain variable data which can be adjusted to attain the objective.
• Constraint cells – These are the conditions to be met by the solution of the problem.
The solver solves the problems with the help of three methods GRG nonlinear, simplex LP, and evolutionary. The first two methods are used for smooth problems, while the last helps solve non-smooth problems.
2. What is the purpose of using the solver in Excel?
The objectives of using the solver are listed as follows:
• To find an optimal solution to a problem
• To help minimize or maximize the formula value
• To work on variable data provided the constraints are adhered to
• To perform a comprehensive analysis necessary for making decisions
3. What are the solver parameters in Excel?
The “solver parameters” is a dialog box which appears on clicking the “solver” button in the Data tab. It consists of the following components:
• “Set objective” – This is the objective cell categorized into “max,” “min,” and “value of.” The “max” and “min” help maximize or minimize the formula value respectively. The “value of” category helps set the desired target value.
• “By changing variable cells” – This consists of a range of variable data cells that are changed to achieve the goal.
• “Subject to the constraints” – These are the constraints that can be added, modified, and deleted depending on the requirement.
• “Load/save” button – This saves the current model and displays the stored parameters.
• “Select a solving method” – This consists of the method to solve the problem. Any one of the three methods (GRG nonlinear, simplex LP, and evolutionary) can be selected.
• “Solve” button – This is clicked once all the data has been entered in the tool. It takes the user to the “solver results” dialog box.
Note: If the variable cells are non-adjacent, select the range by pressing and holding the “Ctrl” key.
Recommended Articles
This has been a step-by-step guide to the Solver in Excel. Here we discuss how to use Solver in Excel along with examples and downloadable Excel templates. You may also look at these useful functions in Excel –
- VBA Refresh Pivot TableWhen we insert a pivot table in the sheet, once the data changes, pivot table data does not change itself; we need to do it manually. However, in VBA, there is a statement to refresh the pivot table, expression.refreshtable, by referencing the worksheet.read more
- Sum by Color in ExcelIn Excel, Sum by Color refers to adding a range of cells as per their specific background colour & you can do it by using the SUBTOTAL or GET.CELL function. read more
- Delete Pivot Table ExcelTo delete a pivot table in Excel, you must first select it. Then go to the Analyze menu tab under the Design and Analyze menu tabs and select actions. Then, from the Select option’s drop-down option, select Entire Pivot Table to delete it.read more
- Equations in ExcelIn Excel, equations are the formulas we type into cells. We begin by writing an equation with an equals to symbol (=), which Excel knows as calculate.read more
Solver is a Microsoft Excel add-in program you can use for what-if analysis. Use Solver to find an optimal (maximum or minimum) value for a formula in one cell — called the objective cell — subject to constraints, or limits, on the values of other formula cells on a worksheet.
Contents
- 1 What is Solver in Excel with example?
- 2 What is a Solver explain?
- 3 Where is the Solver in Excel?
- 4 How do I use Solver report in Excel?
- 5 What is the difference between Solver and goal seek in Excel?
- 6 What is Solver in open office?
- 7 How does Solver help in solving a particular goal seek problem in Excel?
- 8 Can Excel solve equations?
- 9 How do I turn off Solver in Excel?
- 10 What is the use of what-if analysis?
- 11 Why is Solver taking so long?
- 12 How do you write Solver?
- 13 What are the advantages of Goal Seek?
- 14 How do you analyze data using Goal Seek and Solver in a pivot table?
- 15 What is excel in open office?
- 16 What is solver in Libre Calc?
- 17 What is subtotal in OpenOffice Calc?
- 18 Where is Excel Solver 2019?
- 19 How do you multiply on Excel?
- 20 Is there a solver function in Google Sheets?
What is Solver in Excel with example?
Excel Solver allows specifying up to 200 variable cells. In this example, we have a couple of cells whose values can be changed: Projected clients per month (B4) that should be less than or equal to 50; and. Cost per service (B5) that we want Excel Solver to calculate.
What is a Solver explain?
A solver is a piece of mathematical software, possibly in the form of a stand-alone computer program or as a software library, that ‘solves’ a mathematical problem. A solver takes problem descriptions in some sort of generic form and calculates their solution.
Where is the Solver in Excel?
The Excel Solver function is located on the Data Ribbon and the keyboard shortcut on Windows is Alt, A, Y21. Once the dialog box appears you will notice several options you can work with. Set the “Objective” cell.
How do I use Solver report in Excel?
- Define and solve a problem. A list of reports appears in the Reports box of the Solver Results dialog box.
- Click to select one or more reports.
- Select any other options you want in the Solver Results dialog box, and click OK.
What is the difference between Solver and goal seek in Excel?
Goal Seek determines what value needs to be in an input cell to achieve a desired result in a formula cell. Solver determines what values need to be in multiple input cells to achieve a desired result.
What is Solver in open office?
A Solver component modifies a set of input cells in a spreadsheet, observing the impact on result and constraint formula cells. The goal is to find an optimal set of input values, for which the result is minimized, maximized or approximated to a target value, while the constraints remain within specified limits.
How does Solver help in solving a particular goal seek problem in Excel?
Solver helps you find a projection or solution to your problem using a group of cells and a formula cell (called an objective cell). These cells contain a formula for your main calculation and values set as maximum and minimum called constraints.
Can Excel solve equations?
The Solver in Excel can perform many of the same functions as EES and MathCAD. It can be used to solve single equations (for example x2+3x-22=5) or multiple equations (for example x3-14x=z, z12-1=x2+1).
How do I turn off Solver in Excel?
If you press ESC while Solver is solving, the Show Trial Solution dialog box appears. Do one of the following: Click Stop to stop the solution process. TheSolver Results dialog appears with a message that Solver stopped at your request.
What is the use of what-if analysis?
Overview. What-If Analysis is the process of changing the values in cells to see how those changes will affect the outcome of formulas on the worksheet. Three kinds of What-If Analysis tools come with Excel: Scenarios, Goal Seek, and Data Tables.
Why is Solver taking so long?
If you use a large, arbitrary bound (upper or lower), a solver can take excessive time, or even fail to converge. However, if you set Inf or -Inf as the bound, the solver can take less time, and might converge better.Minor point: Some solvers use memory for each constraint, primarily via a constraint Hessian.
How do you write Solver?
We choose the Add button again (either from the Add Constraint dialog above, or from the main Solver Parameters dialog) to define the non-negativity constraint on the decision variables. (Alternatively, we can check the Make Unconstrainted Variables Non-Negative option in the Solver Parameters dialog.)
What are the advantages of Goal Seek?
It allows the user to determine the desired input value for a formula when the output value is already known. This feature can help the user determine things like the interest rate a borrower needs to qualify for (the input) if she only knows how much she can afford to pay each month (the output).
How do you analyze data using Goal Seek and Solver in a pivot table?
Using Goal Seek in Excel
Click OK. This will open the Goal Seek Status dialogue box. Goal Seek Status dialogue box will inform you when a solution is found.
What is excel in open office?
OpenOffice Excel online for XLS spreadsheets is an extension that allows to create, edit and view any Microsoft Excel spreadsheet in both xls and xlsx formats. It is a spreadsheet processor integrated with our file manager to manage only XLS file types with this desktop app.
What is solver in Libre Calc?
The multivariable solver integrated into LibreOffice is activated by the Menu Tools ▸ Solver. The solver engine by default supports only linear equations, but the NLPSolver extension allows you to handle non-linear problems. You will find a full explanation of its functioning on [1].
What is subtotal in OpenOffice Calc?
As the name suggests, SUBTOTAL totals data arranged in a array—that is, a group of cells with labels for columns and/or rows. Using the Subtotals dialog, you can select arrays, then choose a statistical function to apply to them.
Where is Excel Solver 2019?
Click the Solver command button in the Analyze group at the end of the Ribbon’s Data tab. Excel opens the Solver Parameters dialog box.
How do you multiply on Excel?
How to multiply two numbers in Excel
- In a cell, type “=”
- Click in the cell that contains the first number you want to multiply.
- Type “*”.
- Click the second cell you want to multiply.
- Press Enter.
- Set up a column of numbers you want to multiply, and then put the constant in another cell.
Is there a solver function in Google Sheets?
With the Solver Add-on, created by Frontline Systems, developers of the Solver in Microsoft Excel (www.solver.com), you can define and solve many types of optimization problems in Google Sheets, just as you can with the Excel Solver and with Frontline’s Solver App for Excel Online.
Excel Solver is an add-in optimization tool that is used to find the desired outcome based on changing assumptions of the model. It can find the minimum or maximum value in a cell by changing the values in another cell, ultimately leading to the «best» outcome for the problem. It is generally used for simulating different business and engineering models using what-if analysis.

Enabling the Excel Solver Add-in
The Solver Add-in is generally installed in Excel by default. However, you need to enable it to use it by following the steps below:
- Open the Start menu and click on the Excel icon, followed by double-clicking on the Blank workbook option to create a blank workbook.

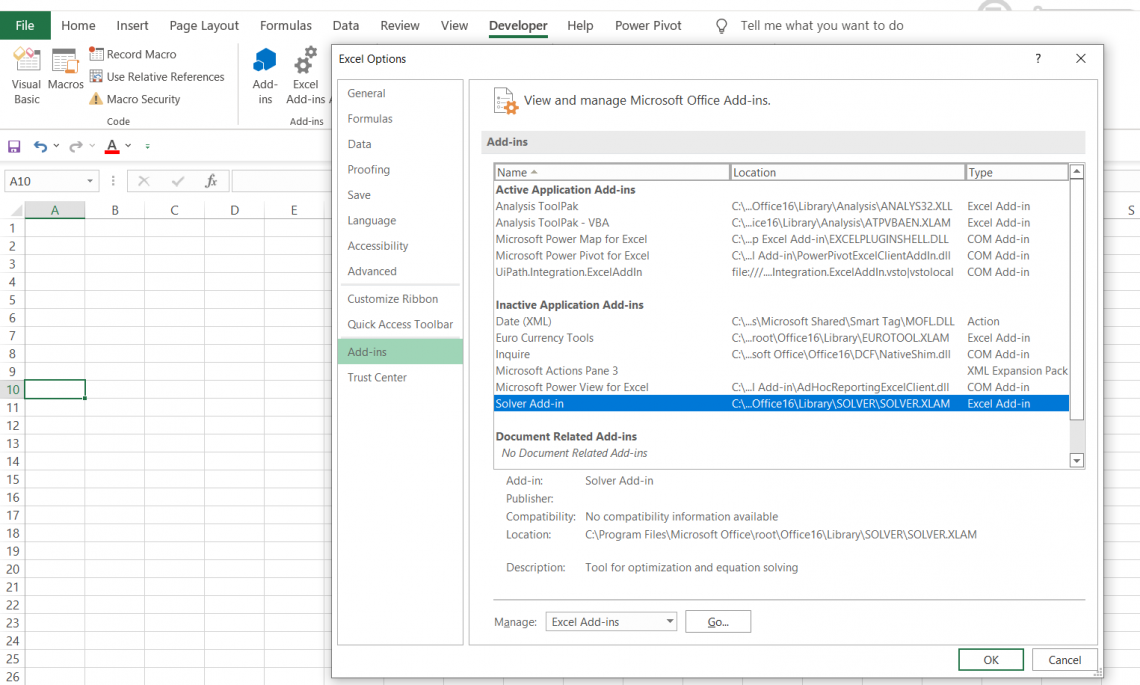
- Click on File and then on Options to navigate yourself to the Add-Ins tab. You will find the Solver Add-in placed within the Inactive Application Add-ins column. First, click on Solver Add-In and then on Go.

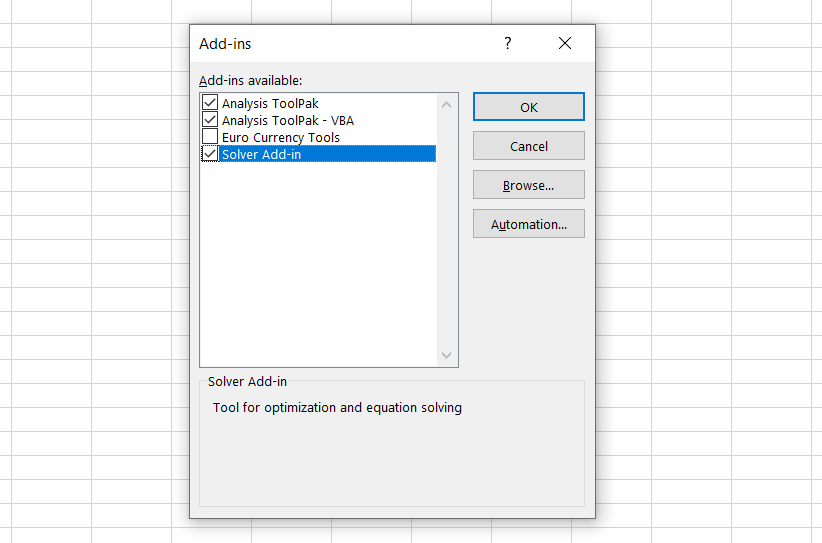
- This will open a new dialog box. Just check the box for Solver Add-Ins and press on OK.

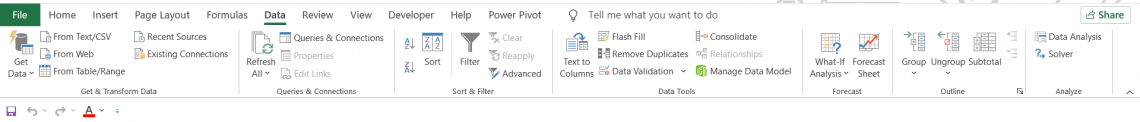
- Now go to the Data tab, where you will find the Solver in Analyze section.


Components of Solver Parameters
The tool requires three different parameters which are set up to find the solution for the problem:
- Objective cell: It represents the goal or objective of our problem. It contains a formula, and it is used to calculate a maximum, minimum, or target value.
- Variable cell: They contain the adjustable data used to obtain the objective cell value.
- Constraints: These are the limitations set up to restrict the solutions from deviating from objective value. Simply put, constraints are the conditions that must be met to obtain objective cell value.
The Solver Parameters window looks as below:

Different types of Solver methods
There exist three different types of Solver methods:
- GRG Nonlinear: GRG is an acronym for «Generalized Reduced Gradient.» This method examines the slope of the objective functions as the input values change to find the optimum solution.
It is fast, but the downside is that it is highly dependent on the initial conditions, meaning that the optimum value will be near the initial conditions laid out. Nevertheless, it is the most used method to solve nonlinear problems. - Simplex LP: LP stands for «linear programming.» The Simplex LP method is used to solve linear problems where the value of one entity is proportional to another entity.
- Evolutionary: The Evolutionary algorithm is slower than the GRG Nonlinear algorithm when used for nonlinear relationships. However, it is more robust and finds a globally optimum solution. Like the theory of natural selection, it weeds out the input values that are not close to the target values to finally reach a stage where the solution represents the closest relation to the target value.
Linear Solutions
Linear equations are the ones that can be solved using methods to find linear solutions. Common examples of linear solutions are age, force and pressure, wages, and hourly rate problems.
The parent and child age difference for different instances of time and their calculation of present age is an example of a linear problem.
You can solve such linear equations in Excel by using the Simplex LP method of Solver. As a result, its application is limited compared to GRG Nonlinear and Evolutionary methods because it cannot be used for nonlinear equations. However, the solutions obtained by the Simplex LP method are always globally optimum solutions making it a robust method.
Nonlinear Solutions
Solver works best in situations in which nonlinear relationships exist. But, what exactly are nonlinear relationships? A nonlinear relationship exists between two entities when the change in the value of one entity does not correlate with the change in the value of another entity. On the contrary, linear relationships exist when two entities are proportional to each other.
Linear equations can’t solve nonlinear problems. The most common example is the traveling salesman problem (TSP).

The TSP is a nonlinear optimization problem. It answers how to visit n cities in the fewest possible trips, where each city has an associated cost. Because these problems are easy to describe yet challenging to solve practically, they have garnered people’s attention. The solutions to such problems are not easy and become more complex if more destinations are added while calculating the best route in these nonlinear optimization problems.

One way to solve this problem is by using Solver methods GRG Nonlinear or Evolutionary methods.
To find an optimal solution for the TSP, one must first create a model with two columns: one for all possible trips and another for total costs. Then, Solver will then assign values for different trip distances and expenses until it finds an answer that satisfies both columns in the model at once.
Case Study for Excel Solver — LP Simplex Method
Excel solver can be used to work on different financial planning tasks, for example, monthly mortgage payments, savings for retirement and business problems. The calculations behind these complex tasks are elaborate and time-consuming. The tool helps to make such calculations easier based on the availability of inputs from the user.
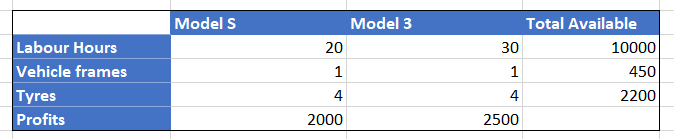
Let’s consider an example of Tesla and its two car models — Model S and Model 3. It requires 20 hours of labor per unit to make Model S, while 30 hours per unit of Model 3. At the start of the fiscal year, Tesla must decide how many cars to manufacture, given the limited resources. Let’s say it has only 10,000 hours of labor, 300 vehicle frames, and 2,200 vehicle tires available.
Tesla can earn a profit of $2,000 on its Model S while generating a profit of $2,500 on the Model 3. Both the cars require one vehicle frame and four tires on top of the labor hours for making the cars. Considering the above assumptions, Tesla must decide how many vehicles they will need to produce in the fiscal year to maximize their profit.
The first step is to build a mathematical representation of the business problem and portray it on the spreadsheet.
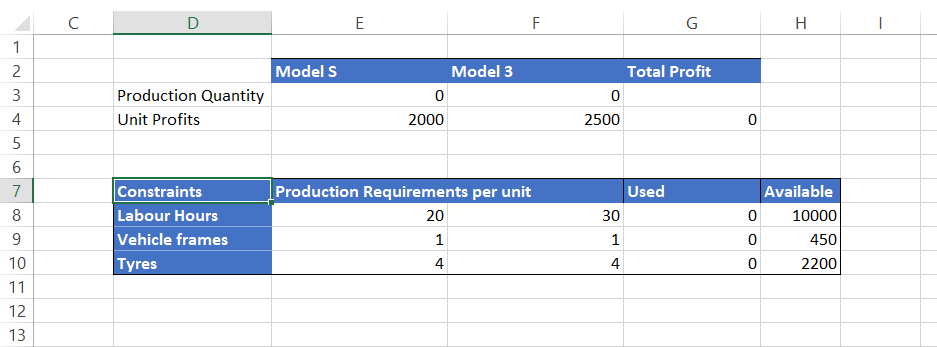
We must determine the values in cells E3 and F3, which are the variables in finding the maximum profit using the available resources. Cell G4 contains the formula =(E4*E3) + (F4*F3) that will calculate the maximum profit Tesla can earn. Cells E8:E10 and F8:F10 are the production requirements per unit for respective models of Tesla. To compute the total individual resources that will be used to manufacture the cars, we have used the below formulas in cells G8:G10:
- G8 = (E8*E3) + (F8*F3)
- G9 = (E9*E3) + (F9*F3)
- G10 = (E10*E3) + (F10*F3)
These formulas will be used to compare with the available resources to avoid Tesla from overusing its resources. Speaking in excel terms, cells G8:G10 will represent the left-hand side of the constraint functions, while cells H8:H10 will form the right-hand side of the constraint function in the Solver tool.
Since the spreadsheet model is implemented, let’s move to the Solver to find the optimum solution for our business problem. To run it, just click on the Data in Menu tab, where you will find it in the Analyze section. You can also use the excel shortcut key Alt + A + Y3.
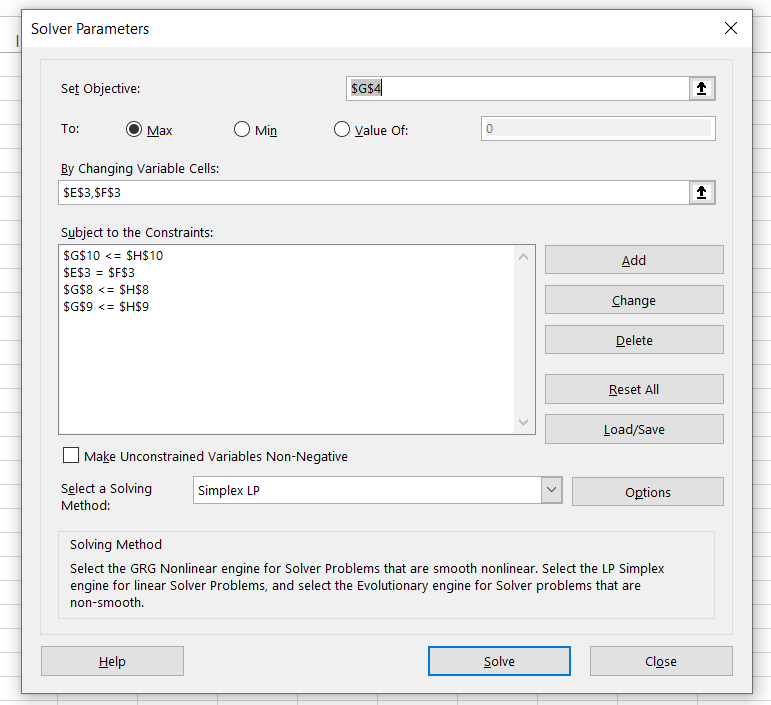
We need to define different components in the parameters window. The first key component to be outlined is the objective cell, whose value can be maximum or minimum or a specific value. The second component is the variable cells. Based on the changes in the variable cell values, the value in the objective cell reciprocates. The third component is the limitations of the model called constraints. It means that we want our excel model to stick to these limitations, making them a barrier for our calculations.
For example, for manufacturing both car models, we have 10,000 hours of labor available. Hence, one of the constraints can be set up as labor hours should not exceed 10,000. Similarly, we have set up a few more constraints such as vehicle frames <= 450, tires <= 2,200, and the number of Model S will equal the number of Model 3 in the fiscal year as per the requirement.
Once all the parameters are set up, select the solving method as Simplex LP. Then, make sure you tick the box that says, ‘Make Unconstrained Variables Non-Negative’ and click on Solve.
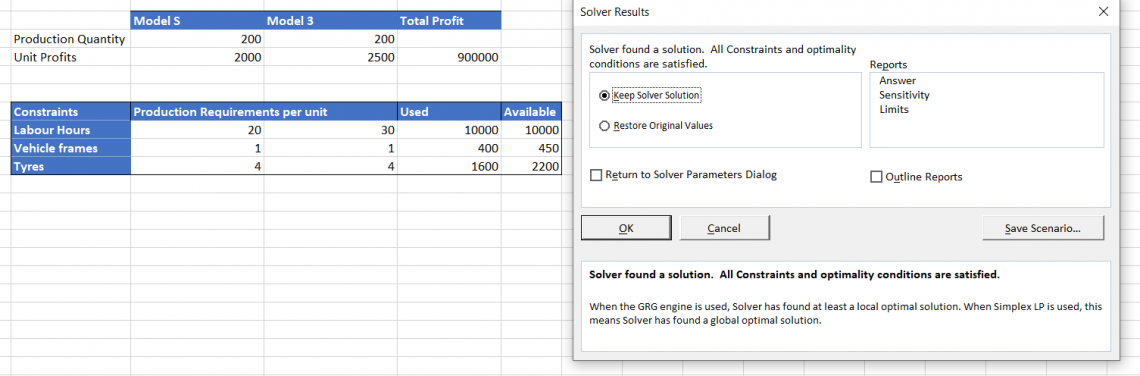
A dialog box should pop up that says, ‘Solver has found a solution.’ This means that Excel has given us the output adhering to all our constraints. From this, we can determine that Tesla can produce 200 cars each of Model S and Model 3 while consuming 10,000 hours of labor work completely. The other resources, i.e., Vehicle frames and tires, are in excess and are to be stored in inventory.
Case Study for Excel Solver – GRG Nonlinear Method
Let’s formulate the model upon which we need to run our Solver in the spreadsheet. In this hypothetical example, we will try to find the solution for a simple nonlinear problem
Suppose that we (Wall Street Oasis) intend to introduce a new course called ‘Credit Analyst’ in the market. For this, we need to invest $5,000 (no, not our actual cost but a nominal figure for this example), which represents the expenses towards the investment experts team and other miscellaneous costs. We need to estimate the selling price of the course that helps us recover our investment in one year.
Our spreadsheet model for the problem is as below:
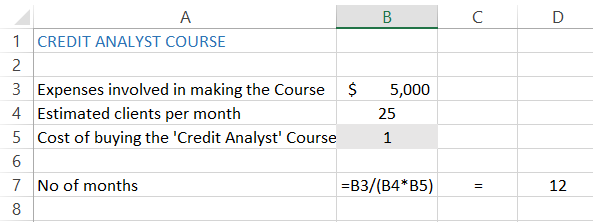
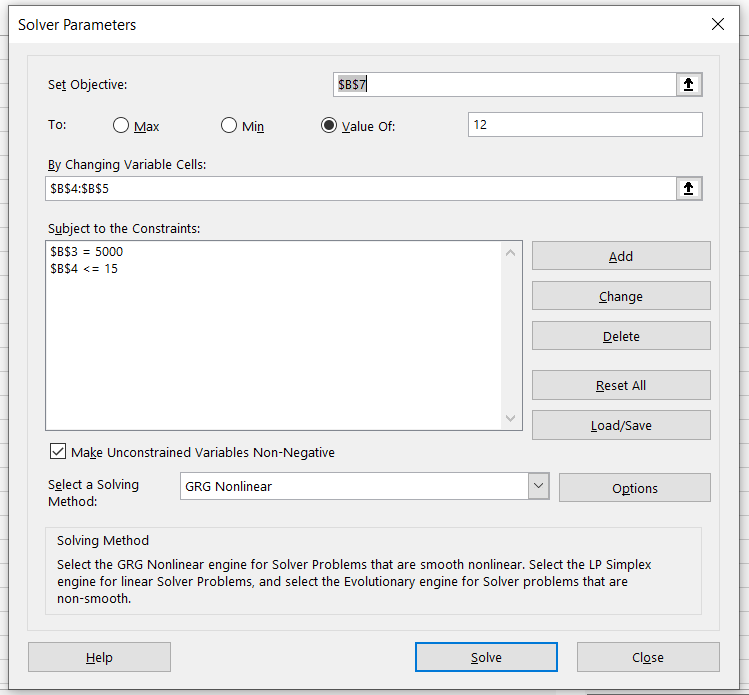
Now let’s run the Solver tool to find the solution for our problem. Use the keyboard shortcuts Alt + A + Y3 to open the solver parameter window. Our Objective cell will be the one that contains the formula, which is cell B7 here. Since we know the number of months to pay for expenses, we will select the ‘Value of’ radio button and set the value as 12.
Our variables are estimated clients per month and buying costs that we will set up for our course, based on the fact that the number of clients each month won’t be constant. We have also set up our constraints which we do not intend to cross, i.e., in this case, the course price of $5,000 and unique clients each month (base case scenario), which are <= 15.
Once all the parameters are set up, select the solving method as GRG Nonlinear method. You will get the solution for the problem as below:
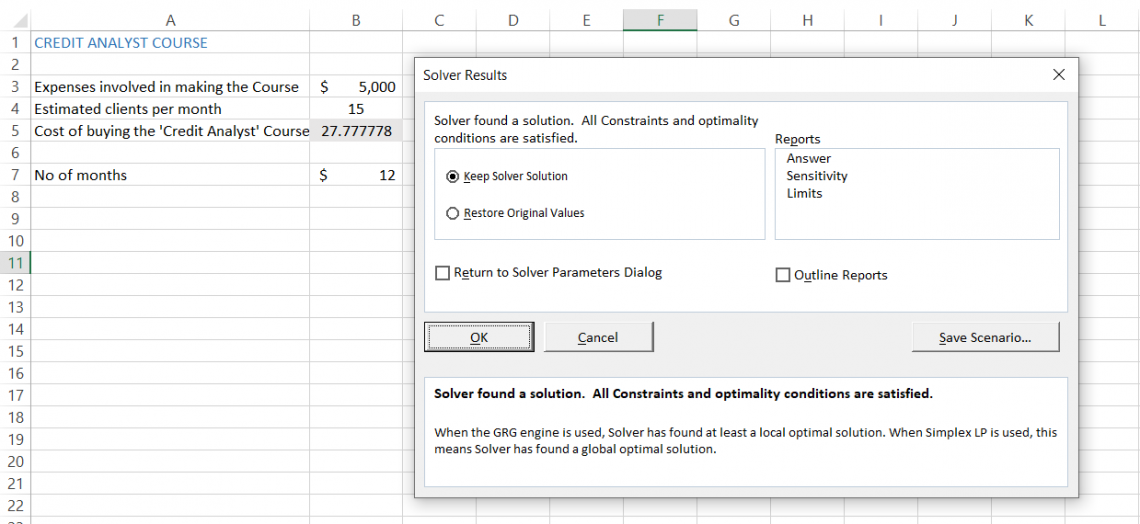
As you can see, the tool satisfies all the conditions and gives us a selling price on the ‘Credit Analyst’ course of approximately $27. (That is the actual price of most of the mini-courses! Check them out here!) All the assumptions made are modeled upon base case scenarios and can be tweaked to find the best- and worst-case scenarios.
Note: Always remember to avoid keeping your variable cells empty. In this case, we had assigned the value of $1 to cell B5 to avoid getting an error while using the Solver.
Case Study for Excel Solver – Evolutionary Method
Let’s assume that a movie theater showcases six different movies. The customers can watch a single movie (check the image below for individual prices) or buy the entire bundle at $48.50 and $60.70 for teenagers and adults, respectively. So, of course, the movie theater owner wants to find the optimum price of the bundle and individual movies to maximize their profit.
We have created the spreadsheet model based on the data below:
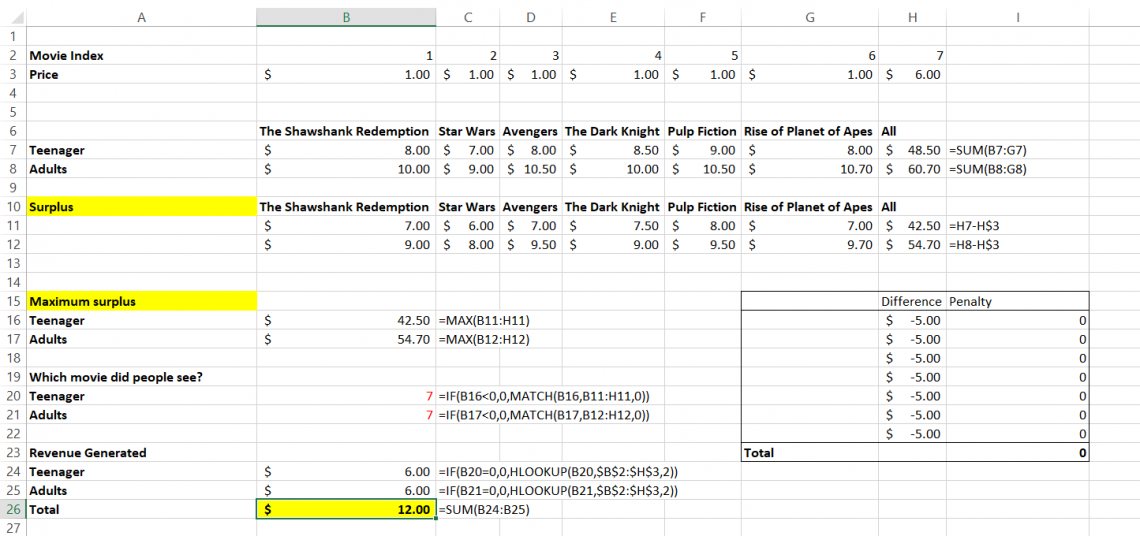
A bit complicated? Maybe, but we will make it easier for you to understand. Our objective cell is B26, while our variables are in range B3:H3. Range B7:H7 shows us how much it will cost teenagers to watch individual movies and buy the entire bundle ($48.5). Range B8:H8 gives the pricing guide for adults to purchase a ticket at the movie theater and the purchase price of the whole bundle, which is $60.70.
Next, we determine how much surplus is charged for the individual movies and the entire bundle. Here we have subtracted the ticket prices by our variable range B3:H3.
Next, we find the max from ranges B11:H11 and B12:H12, respectively. This portrays our maximum surplus price from each movie and bundle. See that penalty table in our spreadsheet? It is an additional constraint check that will lower our maximum revenue if the individual price of the movies is greater than the entire bundle.
The final step is to find the revenue generated from both age categories to achieve maximum profit with optimum prices. We have set up our constraints as below:
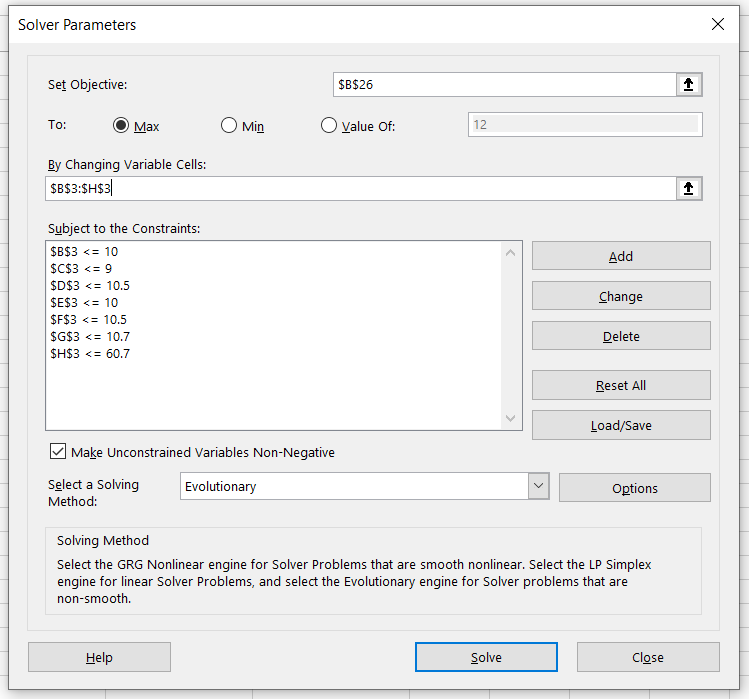
The constraints set up are such that the maximum price of the individual movies or the bundle should not exceed the complete pricing guide for teenagers & adults while buying the movie ticket.
Now select the Evolutionary method of solving and click on Solve. The Solver gives the following result:
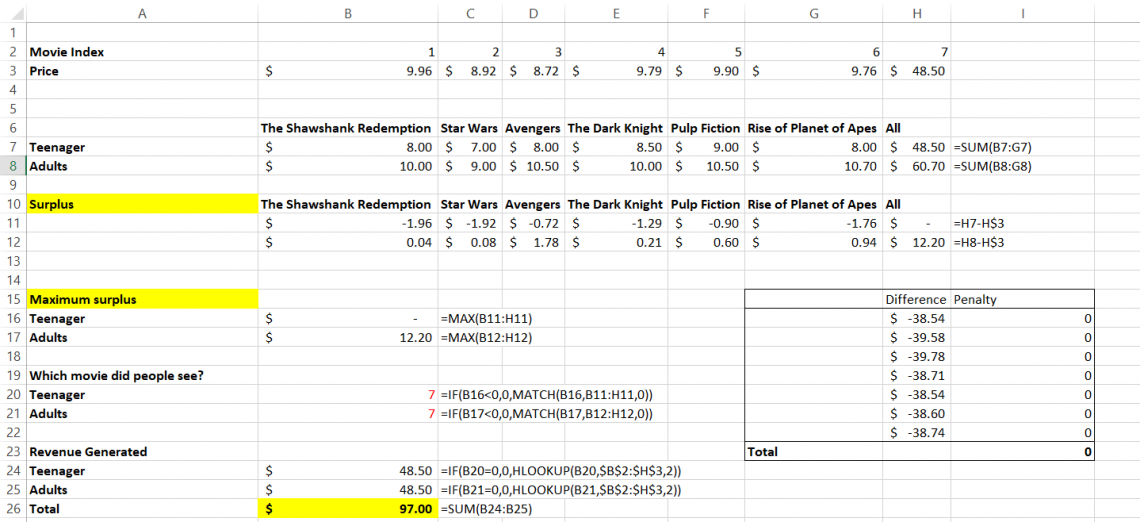
Thus, the movie theatre owner can generate maximum revenue of $97.00, while the optimum prices for the individual movie tickets are in cell B3:H3.
Multi-objective and Mixed-integer Nonlinear Problems
A typical Solver problem has a single objective: to minimize or maximize a target cell. However, many modeling applications require multi-objective and mixed-integer nonlinear problems.
A multi-objective optimization problem has two or more objectives, and a mixed-integer nonlinear programming problem combines two types of constraints: linear and nonlinear.
To determine how to solve a multi-objective or mixed-integer nonlinear problem using Excel 2010, you can use the Gurobi Optimizer add-in that will identify the optimal solution based on your specific model.
Next, we’ll explore how to implement the Solver tool for solving multi-objective and mixed-integer nonlinear problems in Excel 2019.
Solution for Multi-Objective Nonlinear Problem
Let’s assume that a company needs to install a coffee vending machine on its first floor consisting of five cubicles. The coordinates for the cubicles are as below:
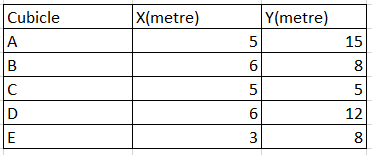
The first objective is to minimize the distance of vending machines from each cubicle, while the second objective is to install the vending machines as far as possible from the washroom on the same floor.
The coordinates of the washroom are given in the cell L11:M11 (x = 6, y = 14), while our variable cells are L7:M7. These variables will determine where the coffee vending machine must be set up so it’s close to each cubicle.
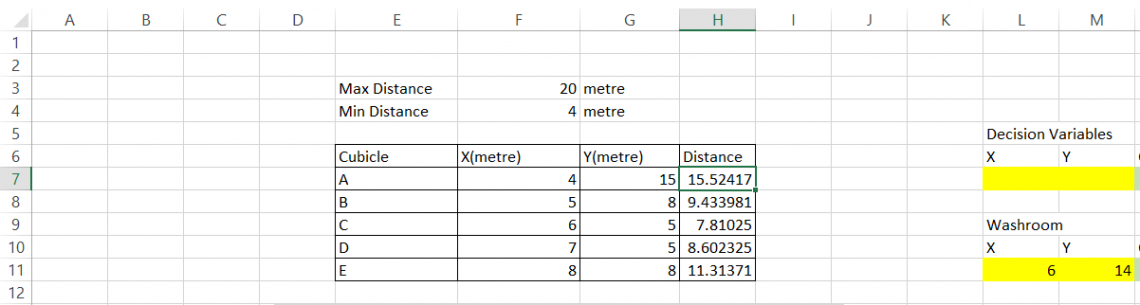
Next, we find the distance between the cubicles and the variables in L7:M7. This will be calculated in the range H7:H11 by using the formula =SQRT(($L$7 — F7)^2 + ($M$7 — G7)^2) in cell H7 and dragged up to cell H11.
Since the distance between the vending and the cubicles is calculated, we need the total length for all cubicles to vending machines by using the formula =SUM(H7:H11) in cell N7. This is our first objective function, while cell N11 gives our second objective function that consists of the formula =SQRT((L7 — L11)^2 + (M7 — M11)^2). This is the distance between the coffee vending machine and the washroom.
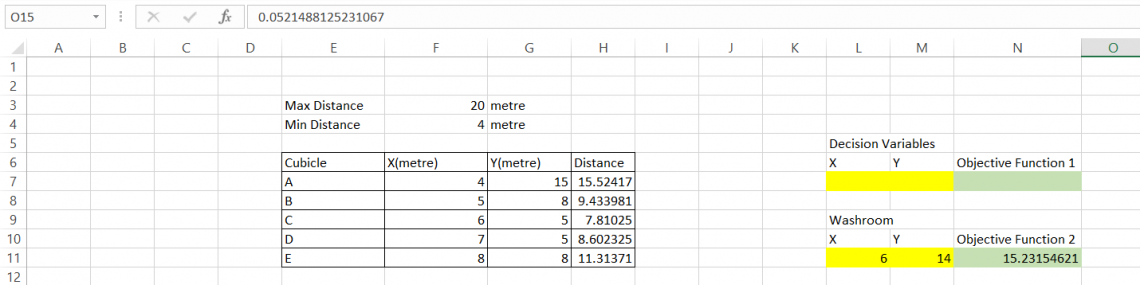
Now we determine the minimum distance of vending machines from each cubicle in cell O14 by using the formula =N7/N11.
Next, we calculate the maximum distance between the vending machine and the washroom in cell O15 using the formula =N11/N7. First, we use the Solver with the O14 cell as the objective value. Our variable cells will be L7:M7. Our constraints will be H7:H11 <= 20 and H7:H11 >= 4 as given in the data.
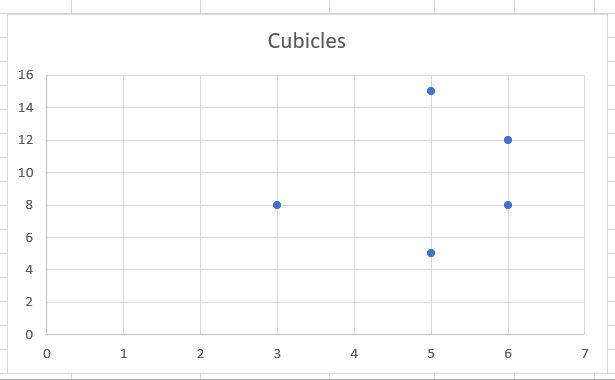
When we run Solver, the distance obtained for goal 1 is 2.80m, for which the coordinates are x = 5, y = 1. Similarly, when O15 cell is the objective value, with similar variables and constraints, the distance obtained is 0.05m, for which the coordinates are x = 7.8 and y = 13.8.
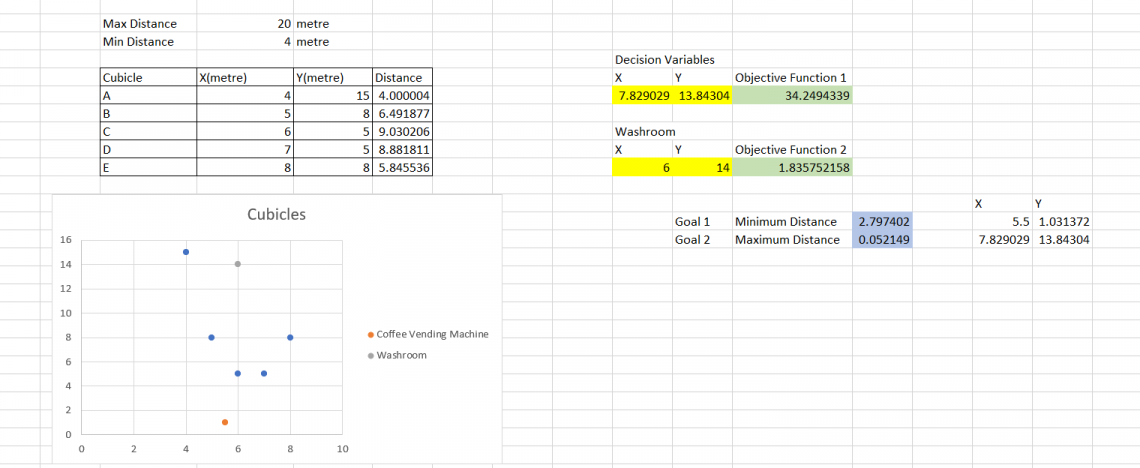
The scatter plot for the two goals is given below:
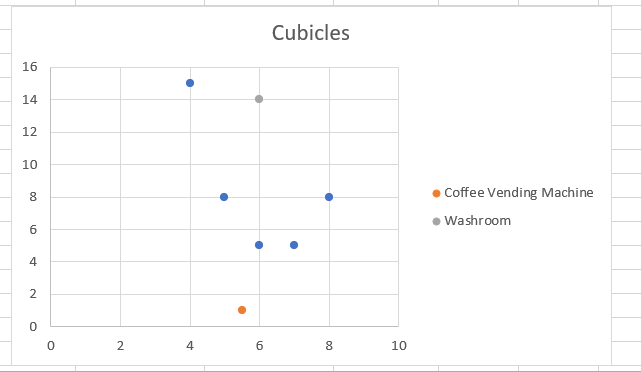
In this way, a multi-objective nonlinear problem can be solved. Furthermore, optimum solutions can be solved by adding more constraints to the situation to get a «good» answer.
Excel Solver is a tool that can find the desired outcome by changing assumptions in a model. The program has many uses and is often used for business, engineering, and science applications.
For instance, it can find optimal production levels and product pricing decisions for a company. It can also help customers determine the best payment plan by calculating various loan payments and down-payment alternatives.
Solving problems with Solver is particularly relevant for businesses or organizations that need to maximize profit or minimize cost. This type of software relies on mathematical equations to find the solution. However, it may not be appropriate for all kinds of problems because it assumes no constraints other than the ones given in the problem description.
Full Guide to Solver in Excel: How to Use + Install (2023)
We make many assumptions when creating financial models in Microsoft Excel.
These assumptions also have limitations 🚧
If you want to find optimal solutions from a model, you must change these assumptions.
It will take hours to get the answer if you try to change these assumptions manually ⏳
That’s where the Excel Solver feature comes in handy!
In this lesson, I will explain this complex Excel feature in a very easy manner.
You can download the workbook and follow along with me.
What is the Solver add-in?
The Solver add-in is an Excel optimization tool.
You can use the Excel solver to perform a what-if analysis with multiple variables in your model.
It will find an optimal solution for a formula by changing the related variables.
We can add constraints on how much one variable can vary when we change the others.
The solver is useful for Linear programming problems in business, programming, and engineering.
Because of this, Solver is also known as a “Linear Programming Solver.”
However, you can solve both non-smooth or continuous functions as well as smooth non-linear issues with the Excel Solver.
How to add the Solver add-in
The Solver add-in, like the Analysis ToolPak of Excel, is a Microsoft Excel add-in program.
As a result, it is not immediately available in Excel by default.
We must install it 🤔
Let’s look at how to add the Solver add-in to our Excel workbook.
- Go to the file tab in your Excel file.

- Select options at the bottom of the left-hand sidebar.

- Select Add-ins from the Excel options window.

- Then in the Manage box, select excel add-ins and click “Go…”.

- Select the Solver Add-in check box from the Add-ins available box. Then, click OK.

Now the Excel Solver Add-ins are loaded to Microsoft excel 👌
Now, go to the Data tab.

You can see the Excel solver command in the analysis group of the Data tab.
You can click Solver to open the Solver parameters dialog box.

How to use Solver in Excel
It is important to learn different parts of the Solver parameter dialog box before we use it 🧑🏻🎓
Set Objective
The set objective is the first input for the Excel Solver parameter dialog box.
In the set objective box, we have to select the cell reference for the objective cell.
The objective cell must have a formula.
Then you can set the objective cell to one of the following.
- Max
- Min
- Value of – If you select “Value of”, you must specify the target value in the box.

By changing variable cells
In this “by changing variable cells”, you have to select all the variable cells to get the optimal solution.
The variable cells are directly or indirectly related to the target cell.
Currently, you can include up to 200 variable cells for the Excel solver function.
If the variable cells are non-adjacent cells, you have to separate them with commas.

Subject to the constraints
Excel Solver can find the optimal solution within constraints or limits.
We can add constraints in this constraint box.

To add constraints, click add button.
Then “Add constraint” box will pop up.
You can select the variable cell for the cell reference box and add the limit in the constraint box.
You must specify the relationship between the cell reference box and the constraint box also.

Do you want to delete or change an existing constraint? 👇🏻
Select that constraint from the Excel Solver parameters dialog box.
Then click the change button to change the existing constraint.
Or click the delete button to delete that.
Select a solving method
In Excel solver, we can select one of the solving methods from the following 3.
- GRG non-linear – For solver problems that are smooth nonlinear.
- Simplex LP – For linear programming problems.
- Evolutionary – For solver problems that are non-smooth.

Now you are familiar with the Excel solver add-in options window 💪🏻
Let’s use Excel Solver to find a solution for a linear programming model.
Linear programming with Solver add-in
In the below example, we have to find how many units we have to sell in order to get the desired outcome of profit.

Let’s learn step by step how to use the Excel Solver solution to our linear programming problem.
- Go to the data tab and click solver to open the Excel Solver.
- Select the objective cell reference.
Our goal is to set the total profit in cell B7 to $900.
So, B7 is the objective cell.
As we need to match the value of the objective cell to $900, we have to select the option of “Value of”.
Then type 900, next to the “value of” option.

- Select the variable cells.
The variable for the target value is the quantity for each cell.
So, in this case, the variable cells are B2, C2, and D2.

- Click the “Add” tab to add constraints for each variable.
Choose each product’s quantity cell as a cell reference.
Then choose the referenced cell’s maximum amount as the constraint.
Next, choose the link between the referred cell.
Here we select “less than or equal sign” because the constraint is maximum quantity.
Again, we need the quantities as whole numbers.
So, we set another constraint for each variable cell as an Integer.


After entering all constraints, the solver displays all constraints for the particular solution.

- Select the “Simplex LP” as we are solving a linear solver problem and click the “Solve” button at the bottom of the window.

- Then, you can see the Solver results dialog box with options to “keep solver solution” and to “restore original values”.
Select the “keep solver solution” and click “OK”.

To get a total profit of $900, we have to sell 149 in vanilla flavour, 114 in chocolate flavour, and 75 in banana flavour.

That’s it – Now what?
Now you have learned Excel Solver a hidden gem of an Excel 💎
You can use this to solve many problems in financial models.
But, before you use Excel Solver for your model, you must make sure all your functions such as IF, SUMIF, and VLOOKUP are correctly applied in the model.
Otherwise, the Solver will take hours to get the solution and may give incorrect results.
Click here to access my free 30-minute online course where you can learn about IF, SUMIF, and VLOOKUP if you haven’t already.
Frequently asked questions
When you need to change only one input to get the desired outcome of a formula, you can easily use Excel’s inbuilt feature Goal Seek.
We have to specify the formula cell, the target value for the formula cell, and the cell to change in order to get the target value.
Only 200 decision variables are currently supported by Excel solver.
This restriction applies to both linear and nonlinear models.
Another problem is that we cannot ensure that we will obtain the solver model’s optimal solution if it is not linear.
Kasper Langmann2023-01-10T18:48:32+00:00
Page load link