
From Wikipedia, the free encyclopedia
Word error rate (WER) is a common metric of the performance of a speech recognition or machine translation system.
The general difficulty of measuring performance lies in the fact that the recognized word sequence can have a different length from the reference word sequence (supposedly the correct one). The WER is derived from the Levenshtein distance, working at the word level instead of the phoneme level. The WER is a valuable tool for comparing different systems as well as for evaluating improvements within one system. This kind of measurement, however, provides no details on the nature of translation errors and further work is therefore required to identify the main source(s) of error and to focus any research effort.
This problem is solved by first aligning the recognized word sequence with the reference (spoken) word sequence using dynamic string alignment. Examination of this issue is seen through a theory called the power law that states the correlation between perplexity and word error rate.[1]
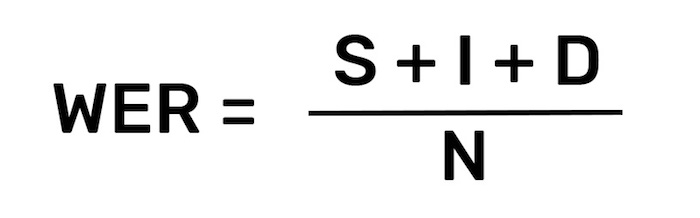
Word error rate can then be computed as:

where
- S is the number of substitutions,
- D is the number of deletions,
- I is the number of insertions,
- C is the number of correct words,
- N is the number of words in the reference (N=S+D+C)
The intuition behind ‘deletion’ and ‘insertion’ is how to get from the reference to the hypothesis. So if we have the reference «This is wikipedia» and hypothesis «This _ wikipedia», we call it a deletion.
When reporting the performance of a speech recognition system, sometimes word accuracy (WAcc) is used instead:

Note that since N is the number of words in the reference, the word error rate can be larger than 1.0, and thus, the word accuracy can be smaller than 0.0.
Experiments[edit]
It is commonly believed that a lower word error rate shows superior accuracy in recognition of speech, compared with a higher word error rate. However, at least one study has shown that this may not be true. In a Microsoft Research experiment, it was shown that, if people were trained under «that matches the optimization objective for understanding», (Wang, Acero and Chelba, 2003) they would show a higher accuracy in understanding of language than other people who demonstrated a lower word error rate, showing that true understanding of spoken language relies on more than just high word recognition accuracy.[2]
Other metrics[edit]
One problem with using a generic formula such as the one above, however, is that no account is taken of the effect that different types of error may have on the likelihood of successful outcome, e.g. some errors may be more disruptive than others and some may be corrected more easily than others. These factors are likely to be specific to the syntax being tested. A further problem is that, even with the best alignment, the formula cannot distinguish a substitution error from a combined deletion plus insertion error.
Hunt (1990) has proposed the use of a weighted measure of performance accuracy where errors of substitution are weighted at unity but errors of deletion and insertion are both weighted only at 0.5, thus:

There is some debate, however, as to whether Hunt’s formula may properly be used to assess the performance of a single system, as it was developed as a means of comparing more fairly competing candidate systems. A further complication is added by whether a given syntax allows for error correction and, if it does, how easy that process is for the user. There is thus some merit to the argument that performance metrics should be developed to suit the particular system being measured.
Whichever metric is used, however, one major theoretical problem in assessing the performance of a system is deciding whether a word has been “mis-pronounced,” i.e. does the fault lie with the user or with the recogniser. This may be particularly relevant in a system which is designed to cope with non-native speakers of a given language or with strong regional accents.
The pace at which words should be spoken during the measurement process is also a source of variability between subjects, as is the need for subjects to rest or take a breath. All such factors may need to be controlled in some way.
For text dictation it is generally agreed that performance accuracy at a rate below 95% is not acceptable, but this again may be syntax and/or domain specific, e.g. whether there is time pressure on users to complete the task, whether there are alternative methods of completion, and so on.
The term «Single Word Error Rate» is sometimes referred to as the percentage of incorrect recognitions for each different word in the system vocabulary.
Edit distance[edit]
The word error rate may also be referred to as the length normalized edit distance.[3] The normalized edit distance between X and Y, d( X, Y ) is defined as the minimum of W( P ) / L ( P ), where P is an editing path between X and Y, W ( P ) is the sum of the weights of the elementary edit operations of P, and L(P) is the number of these operations (length of P).[4]
See also[edit]
- BLEU
- F-Measure
- METEOR
- NIST (metric)
- ROUGE (metric)
References[edit]
Notes[edit]
- ^ Klakow, Dietrich; Jochen Peters (September 2002). «Testing the correlation of word error rate and perplexity». Speech Communication. 38 (1–2): 19–28. doi:10.1016/S0167-6393(01)00041-3. ISSN 0167-6393.
- ^ Wang, Y.; Acero, A.; Chelba, C. (2003). Is Word Error Rate a Good Indicator for Spoken Language Understanding Accuracy. IEEE Workshop on Automatic Speech Recognition and Understanding. St. Thomas, US Virgin Islands. CiteSeerX 10.1.1.89.424.
- ^ Nießen et al.(2000)
- ^ Computation of Normalized Edit Distance and Application:AndrCs Marzal and Enrique Vidal
Other sources[edit]
- McCowan et al. 2005: On the Use of Information Retrieval Measures for Speech Recognition Evaluation
- Hunt, M.J., 1990: Figures of Merit for Assessing Connected Word Recognisers (Speech Communication, 9, 1990, pp 239-336)
- Zechner, K., Waibel, A.Minimizing Word Error Rate in Textual Summaries of Spoken Language
Word Error Rate (WER) is a common metric used to compare the accuracy of the transcripts produced by speech recognition APIs. Speech recognition APIs are used to surface actionable insights from large volumes of audio data in addition to powering robust IVRs and voice-command-enabled devices such as the Amazon Echo. Product developers and data scientists can choose from many speech recognition APIs. How are they to judge which will be a good fit for their application? When evaluating speech recognition APIs, the first metric they’ll consider is likely to be WER. However, a metric has no value unless we understand what it tells us. Let’s break down WER to find out what it means and how useful a metric it is.
How to Calculate WER
Word error rate is the most common metric used today to evaluate the effectiveness of an automatic speech recognition system (ASR). It is simply calculated as:
S stands for substitutions (replacing a word). I stands for insertions (inserting a word). D stands for deletions (omitting a word). N is the number of words that were actually said Note: WER will be calculated incorrectly if you forget to normalize capitalization, punctuation, numbers, etc. across all transcripts
Imagine you are using speech recognition to find out why customers are calling. You have thousands of hours of calls, and you want to automatically categorize the calls. On playback, one such call starts as follows:
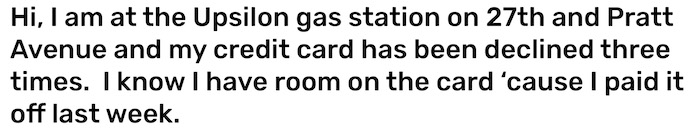
However, when the machine transcribes this same call, the output may look like this:
![]()
If you compare this transcript with the one above, it’s clear that the machine’s one has problems. Let’s analyze them in terms of our WER formula.
-
In line one, we see that the word «Upsilon», has been interpreted as «up silent». We will say that this represents (1) substitution-a wrong word in place of the correct word-and (1) insertion-adding of a word that was never said.
-
On line two, we have (1) substitution: «brat» instead of «Pratt.»
-
On line three we have (1) substitution: «designed» instead of «declined.»
-
On line four we have (2) substitutions: «cart» instead of «card» and «because» instead of cause. On this line we also have (1) deletion: the word «it» is gone.
The original phone call contained 36 words. With a total of 9 errors, the WER comes out to 25%.
What WER Really Means
How well a speech recognition API can transcribe audio depends on a number of factors, which we will discuss below. Before we do, we must ask ourselves the most important question one can ask when assessing a speech recognition system: «is the transcript usable for my purposes?» Let’s consider our example. This is a good transcription if you are trying to figure whether customers are calling to solve issues with credit cards or debit cards. However, if your goal is to figure why out each person called your call center (to deal with a declined card, lost card, etc.) then this phone call would likely get mis-sorted. This is because the system did not properly transcribe a keyword: «declined.» When a speech recognition API fails to recognize words important to your analysis, it is not good enough-no matter what the WER is. Word error rate, as a metric, does not give us any information about how the errors will affect usability for users. As you can see, you the human can read the flawed transcript and still manage to figure out the problem. The only piece of information you might have trouble reconstructing is the name and location of the gas station. Unfamiliar proper names are troublesome for both humans and machines.
A Low WER can be Deceptive-Depending on the Data
Depending on the data we want to look at, even low word error rate transcripts may prove less useful than expected. For example, notice how on line 4, «’cause» was transcribed as «because» and the object pronoun «it» was omitted. These two errors may not matter, especially if your goal is to find out why customers are calling. If the speech recognition API had not made these errors, we would have a 19.4% WER-almost as good as it gets for general, off-the-shelf speech recognition. But, as you can see, a low(er) error rate does not necessarily translate into a more useful transcript. This is because adverbs like «because» and object pronouns like «it» are not of much interest to us in this case.
«You can have two systems with similar accuracy rates that produce wildly differently transcripts in terms of understandability. You can have two different systems that are similar in terms of accuracy but maybe one handles particular vocabulary that’s germane to your application better than the other. There’s more than just accuracy at the heart of it.»
—Klint Kanopka Stanford Ph.D. Researcher
While WER is a good, first-blush metric for comparing the accuracy of speech recognition APIs, it is by no means the only metric which you should consider. Importantly, you should understand how the speech recognition API will deal with your data. What words will it transcribe with ease? What words will give it trouble? What words matter to you? In our example, the words «declined» and «credit card» are likely the ones we want to get right every time.
What Affects the Word Error Rate?
A 25% word error rate is about average for «off the shelf» speech recognition APIs like Amazon, Google, IBM Watson, and Nuance. The more technical, the more industry-specific, the more «accented» and the more noisy your speech data is, the less likely that a general speech recognition API (or humans) will do as well.
Technical and Industry-specific Language
There’s a reason that human transcriptionists charge more for technical or industry-specific language. It simply takes more time and effort for human brains to reliably recognize niche terms. The language that is normal to call center manager, a lawyer or a business executive is rare elsewhere. As a result, speech recognition systems trained on «average» data also struggle with more specialized words. As you’d guess, the technical language was created for a reason and accordingly, it’s the language that businesses care the most about.
Accented Language
Accent is a highly relative, very human concept. This author has a strong accent in Dublin, but almost none in New York. The speech recognition systems built by large companies such as Google, Nuance and IBM are very familiar with the sort of English one hears on TV: «general American English» and RP (received pronunciation-the form of British English spoken by the Queen, the BBC and Oxford graduates). They are not necessarily familiar with the «real» English spoken in Palo Alto, CA; Athens, Georgia; New Dehli, India or Edinburgh, Scotland. However, companies are interested in the «real» language since a very tiny subset of their employees are TV anchors.

In New Delhi-English is spoken natively and non-natively by a large percentage of the population. Photo Credit: Raghu Nayyar.
Therefore, if your data has a wider variety of accents (it almost certainly does), or is limited to a set of accents not well represented in the data used to create general speech recognition APIs, then you probably need a custom-built model to really get a good look at your data.
Noisy Data
Wouldn’t it be nice if everyone who called us to do business did so from a sound studio? Wouldn’t you love that crisp, bassy, noise-free audio? Better yet, how about they didn’t call us over the phone, since VoIP and traditional phone systems compress audio, cut off many frequencies and add noise artifacts? The real world is full of noise. Phone calls are inherently bad quality, people call while rushing to work, or walking by a seemingly endless line of jackhammers, fire engines and screaming 4-month-olds.

Somehow, human transcribers do okay with such noisy data, and speech recognition APIs, if properly trained, can do okay too. However, as you can imagine, when companies advertise super-low word error rates, these are not the WERs they get when transcribing audio captured at Iron Maiden concerts held in the middle of 16 lane interstate highways.
Choosing an Speech Recognition API
Speech recognition APIs are fantastic tools that allow us to look into vast amounts of audio data in order to learn meaningful things about our customers, our operations and the world in general. WER is one metric that allows us to compare speech recognition APIs. However, as it is the case in any science, there is no one «best» metric.
I like analogies, so here is one: Asking which is the best metric to judge the quality of a bicycle could end in disaster. If your say «weight is the best metric, the lighter the better,» then people like me who use their bikes to carry heavy groceries, 2 months of laundry and the occasional 2×4 would be in trouble. If you said «the number of pannier racks on a bike» is a good metric, then Tour de France cyclists would become a lot more winded, faster. All in all, you need to choose what’s right for you.

This bike is a robust touring bike with pannier racks-great for shopping and 10,000 mile tours, bad for Tour de France. Photo credit: Derek Thomson
When you want to decide which speech recognition API to use, ask yourself:
-
Are there particular audio types that you need the speech recognition API to perform well on (phone call, TV, radio, meetings)?
-
Are there certain words or accents that the speech recognition API should do well on?
-
Can you customize the API to perform better on your data?
For more, check out our step by step guide on how to evaluate an ASR provider or have us evaluate the ASR provider for you.
If you’ve spent any time at all using an automatic speech recognition service, you may have seen the phrase “word error rate,” or WER, for short. But even if you’re brand new to transcriptions, WER is the most common metric you’ll see when comparing ASR services. Luckily, you don’t have to be a math whiz to figure it out – you just need to know this formula:
Word Error Rate = (Substitutions + Insertions + Deletions) / Number of Words Spoken
And that’s it! To go a bit more in depth, here’s how to effectively determine each of these factors:
- Substitutions are anytime a word gets replaced (for example, “twinkle” is transcribed as “crinkle”)
- Insertions are anytime a word gets added that wasn’t said (for example, “trailblazers” becomes “tray all blazers”)
- Deletions are anytime a word is omitted from the transcript (for example, “get it done” becomes “get done”)
Word Error Rate in Practice
Let’s take a look at an example audio.
The correct text is below:
We wanted people to know that we’ve got something brand new and essentially this product is, uh, what we call disruptive, changes the way that people interact with technology.
Now, here’s how that sentence was translated using Google’s speech to text API:
We wanted people to know that how to me where i know and essentially this product is what we call scripted changes the way people are rapid technology.
To correctly calculate WER, we take a look at the substitutions, insertions, and deletions between the two.

Add up the substitutions, insertions, and deletions, and you get a total of 11. Divide that by 29 (the total number of words spoken in the original file) to get a word error rate of about 38 percent. In some cases, the entire meaning of the sentence was changed.

Recently, we ran a test. We took 30 popular podcasts of varying topics and number of speakers, and transcribed them with Rev AI, Google, and Speechmatics. The overall WER for each service is below:
- Rev AI: 17.1%
- Google (video model): 18.3%
- Speechmatics: 21.3%
As these results suggest, you’ll get a different word error rate from whichever service you choose. And though WER is an important and standard metric, it’s not the only thing you should focus on.
The Power of Speaker Diarization
Are all of your transcriptions just one person narrating into a recorder? Great! You’ve somehow found the sweet spot of perfect audio.
What’s more likely, however, is that your files contain multiple speakers. Those speakers may sometimes cut each other off or talk over each other. They may even sound fairly similar.
One of the cool features of Rev AI is speaker diarization. This recognizes the different speakers in the room and attributes text to each. Whether it’s two people having an interview or a panel of four speakers, you can see who said what and when they said it. This is particularly useful if you’re planning to quote the speakers later. Imagine attributing a statement to the incorrect person – and even worse, getting the crux of their message wrong because of a high WER rate. You just may have two people upset with you: the actual speaker and the person you incorrectly cited.

Not all ASR services offer diarization, so keep that in mind if you’re often recording multiple people talking at once. You’ll want to be able to quickly discern between them.
Other Factors to Consider
WER can be an incredibly useful tool; however, it’s just one consideration when you’re choosing an ASR service.
A key thing to remember is that your WER will be inaccurate if you don’t normalize things like capitalization, punctuation, or numbers across your transcripts. Rev AI automatically transcribes spoken words into sentences and paragraphs. This is especially important if you are transcribing your audio files to increase accessibility. Transcripts formatted with these features will be significantly easier for your audience to read.
Word error rate can also be influenced by a number of additional factors, such as background noise, speaker volume, and regional dialects. Think about the times you’ve recorded someone or heard an interview during an event. Were you able to find a quiet, secure room away from all the hubbub? Did the speaker have a clear, booming voice? Chances are, there were some extenuating circumstances that didn’t allow for the perfect environment – and that’s just a part of life.
Certain ASR services are unable to distinguish sounds in these situations. Others, like Rev AI, can accurately transcribe the speakers no matter their volume or how far away they are from the recorder. Not everyone is going to have the lung capacity of Mick Jagger, and that’s fine. While we don’t require a minimum volume, other ASR services may. If you tend to interview quieter talkers or are in environments where you can’t make a lot of noise, be mindful of any requirements before making your selection.
Final Thoughts
Now that you’re comfortable calculating word error rate, you can feel more confident in your search for an ASR service. See how the power of a low WER can help your business reach new heights. Try Rev AI for free and get five hours of credit simply for signing up.
Try it free
Как работают системы распознавания речи
Время на прочтение
5 мин
Количество просмотров 5.1K
В русскоязычном сегменте интернета не так много информации о том, как устроены системы распознавания речи. В этой статье мы, команда проекта Amvera Speech (ООО «Клэрити»), расскажем нюансы технологии и опишем путь создания собственного решения. В конце статьи – бесплатный телеграм-бот для теста системы распознавания речи, построенной на архитектуре, описанной в статье.
Сложности, с которыми сталкиваются разработчики систем распознавания речи:
Есть распространенное мнение, что распознавание речи — давно решенный кейс, но это не совсем так. Действительно, задача решена для определенных ситуаций, но универсального решения пока не существует. Это происходит из-за ряда проблем, с которыми сталкиваются разработчики:
-
Зависимость от домена
a) Разные дикторы
b) «акустический» канал записи звука: кодеки, искажения
c) Разное окружение: шум в телефоне, в городе, фоновые дикторы
d) Разный темп и подготовленность речи
e) Разная стилистика и тематика речи
-
Большие и «неудобные» наборы данных
-
Не всегда интуитивно понятная метрика качества
Метрика качества
Качество распознавания измеряется по метрике WER (Word Error Rate).
![]()
Insertions – вставки слов, которых нет в исходной аудиозаписи
Substitutions – замены слов на некорректные
Deletions – система слово не распознала и сделала пропуск
Пример расчета
Исходные данные: Стационарный (неразборчивая речь) телефон зазвонил поздней ночью
Гипотеза: Стационарный синийi айфонs прозвонилs поздней ночью
WER = 100*(1+2+0)/5 = 60% (т.е. ошибка равна 60%).
При этом есть как простые заблуждения при подсчете метрики, так и более сложные.
Пример простых заблуждений при подсчете метрики
-
Е/е с точками. Система переводит речь в текст и везде использует букву Е без точек, в то время как эталон, с которым сравнивается транскрипция, содержит Е с точками. Это неправомерно увеличивает количество Substitutions и увеличивает WER на 1%.
-
разное написание таких слов, как алло, але, алле и т.д.
-
строчные и заглавные буквы
-
усреднение по текстам, а не подсчет общего количества слов. Бывает, что в одном тексте WER 0,6, в другом 0,5, а в третьем – 0,8. Неверно будет вывести WER как среднее арифметическое из этих значений. Правильнее – подсчитать общее количество слов на всех текстах и на основе этого рассчитать WER.
Более сложные заблуждения могут быть вызваны тем, что на разных тестовых выборках WER будет разным. Иногда на одной конкретной аудиодорожке испытываемое решение работает лучше или хуже, чем решения конкурентов. Но делать из этого общий вывод о качестве работы решения – некорректно. Необходимы результаты на большом объеме данных.
Типы систем распознавания речи
Системы распознавания речи бывают двух видов – гибридные и end2end. End2end переводят последовательность звуков в последовательность букв. Гибридные системы содержат акустическую и языковую модель, работающие независимо. Решение Amvera Speech построено на гибридной архитектуре.
Устройство гибридной системы распознавания речи
Принцип работы гибридной системы распознавания речи:
-
Нейронная сеть классифицирует каждый конкретный фрейм звука,
-
HMM моделирует «динамику», «лексикон», «лексику», опираясь на постериоры NN,
-
Алгоритм Viterbi (Viterbi decoder, beam-search) занимается поиском по HMM оптимального пути, с учетом постериоров классификатора.

Первым шагом в гибридной модели распознавания речи выделяются признаки. Как правило, это MFCC коэффициенты.
Затем акустическая модель решает задачу классификации фреймов. Далее используется Viterbi-decoder (поиск по лучу). Он использует предсказание акустической модели и статистику языковой модели, которая по ngram показывает вероятность встречаемости звуков и слов. Затем производится рескоринг и выдается наиболее вероятное слово.

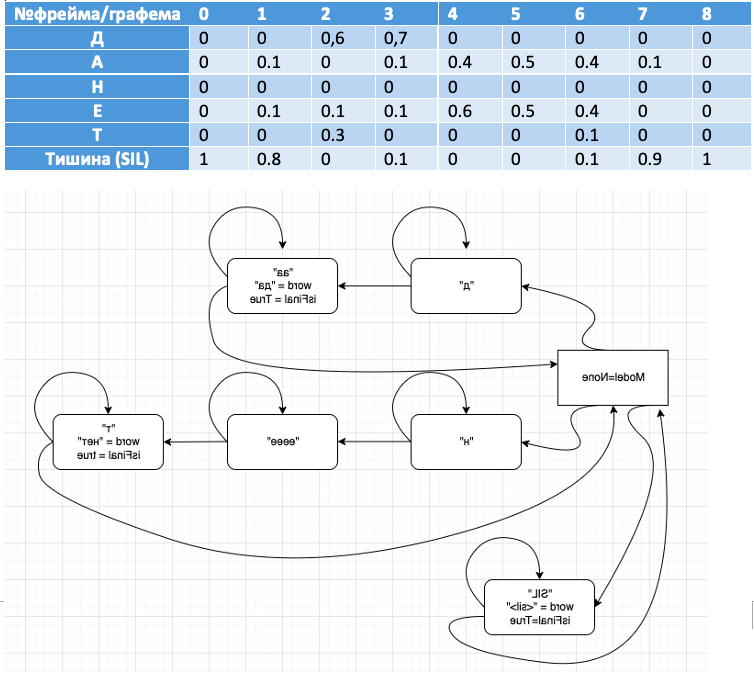
Ниже – иллюстрация классификации фреймов. Продемонстрированы фонемы в фреймах для слов «да и нет». Вероятность каждой из фонем записана в соответствующую ячейку.
|
№ фрейма/графема |
0 |
1 |
2 |
3 |
4 |
5 |
6 |
7 |
8 |
|
Д |
0 |
0 |
0,6 |
0,7 |
0 |
0 |
0 |
0 |
0 |
|
А |
0 |
0.1 |
0 |
0.1 |
0.4 |
0.5 |
0.4 |
0.1 |
0 |
|
Н |
0 |
0 |
0 |
0 |
0 |
0 |
0 |
0 |
0 |
|
Е |
0 |
0.1 |
0.1 |
0.1 |
0.6 |
0.5 |
0.4 |
0 |
0 |
|
Т |
0 |
0 |
0.3 |
0 |
0 |
0 |
0.1 |
0 |
0 |
|
Тишина (SIL) |
1 |
0.8 |
0 |
0.1 |
0 |
0 |
0.1 |
0.9 |
1 |
Визуализируем принцип работы вычислительного графа
Представьте, что у вас в первом фрейме классификатор обнаружил фонему «д», и так 10 раз подряд. Цикл будет выполняться, пока не обнаружится фонема «а», и если слово содержится в словаре, оно будет записано.
Аналогично, алгоритм отработает слово «нет» и закончит работу, когда в
канале наступит тишина «SIL».

Совместим визуализацию поискового графа в связке с фреймами для большей наглядности:
Обучение гибридной системы распознавания речи
Рассмотрим общий принцип обучения классификатора акустической модели, принцип сопоставления фреймов с фонемами, количество классов и способы улучшения решения.
Обучение классификатора акустической модели:
-
Возьмем графемы.
Пример – М, А, Ш, А
-
Представим их в виде фонем, получится m* i1 sh a0
Для русской речи на обучающей выборке в 80 часов фонемы на 1 процент лучше, при 4 тысячах часов – разницы уже нет.
-
Используем бифоны/биграфемы
Моделируют влияние соседних фонем
Левые: SIL (sil)M (м)А (а)Ш (ш)А SIL
Правые: SIL M(a) A(ш) Ш(а) А(sil) SIL
-
Можно использовать трифоны
SIL (sil)M(a) (м)А(ш) (а)Ш(а) (ш)А(sil) SIL
-
Либо использовать многостейтовые фонемы/графемы/трифоны …
Как фрейму приписать фонему?
Проще всего это описать фразой «натянуть сову на глобус».

Для этого используем связку алгоритмов Flat-start+Viterbi forced alignment:
-
берем пару звук-текст
-
получаем фонемную запись
-
разбиваем звук на равные части по числу фонем, приписывая соответствующие лейблы
-
обучаем классификатор (обычно GMM).
-
делаем forced alignment, получаем уточненные labels
-
Повторяем пункт 4
После нескольких итераций, получаем labels, пригодные для обучения нейронной сети.
Классы
Если используются {би, три} {фоны, графемы}, то:
Проблема 1: классов слишком много
Бифоны: 57 фонем^2 – 3249
Двустейтовые бифоны: (2 стейта*57 фонем )^2=12996
Трифоны: 57фонем^3 = 185193
Проблема 2: размеры классов не сбалансированы
Решение – кластеризация
Объединяет похожие классы (5-10 тыс. классов)
Балансирует размеры классов
(класс называют сеноном для фонемных, ченоном для графемных моделей)
Улучшаем распознавание
Используем MMI или MPE/sMBR
-
Строится CE-модель
-
Строится «числитель» — множество вариантов распознавания, приводящих к правильному ответу
-
Строится «знаменатель» — много неправильных вариантов распознавания
-
Loss = f(числитель)/f(знаменатель) т.е. «поднять» правильные и «опустить неправильные»
Достоинства: sMBR несколько поднимает качество
Недостатки: стремится оттянуть выдачу label, следовательно портит time-разметку и latency.
Достоинства гибридной архитектуры распознавания речи
-
Акустическая модель отделена от языковой. Языковую модель легко дополнить дополнительной информацией (новые слова и т.д.).
-
Можно быстро получить NBest списки для улучшения с помощью языковой модели.
-
Для обучения достаточно несколько десятков часов аудиозаписей.
Недостатки гибридной архитектуры распознавания речи
-
Не умеют распознавать слова, которых нет в словаре.
-
Не модно.
Как итог — мы рассмотрели принцип устройства классической гибридной архитектуры распознавания речи.
Бонус для дочитавших: наш телеграм бот @AmVeraSpeechBot. В боте вы можете проверить качество работы нашего решения (Amvera Speech) по распознаванию речи на основе классической гибридной архитектуры. Просто отправьте в бот короткую аудиодорожку или голосовое сообщение – и получите текстовую расшифровку.
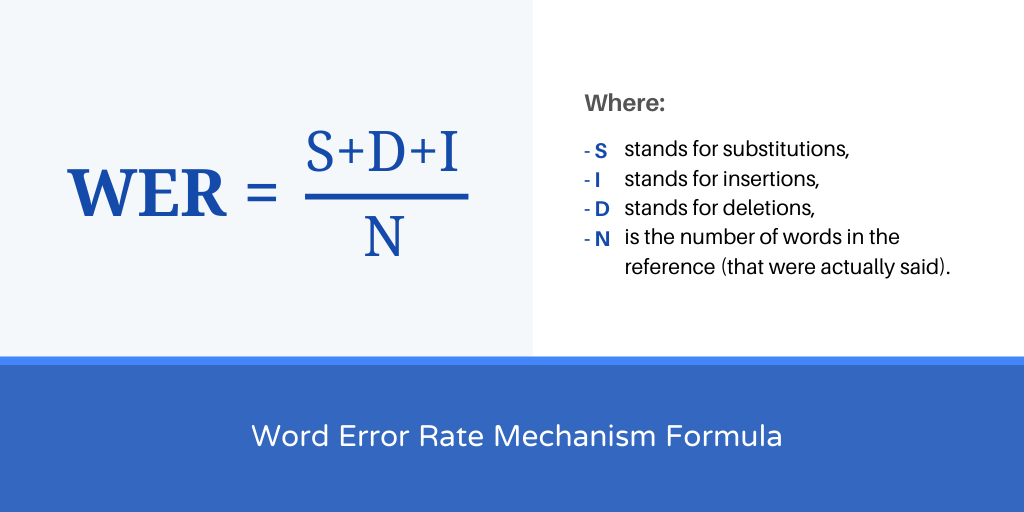
The Word Error Rate (short: WER) is a way to measure performance of an ASR. It compares a reference to an hypothesis and is defined like this:
$$mathit{WER} = frac{S+D+I}{N}$$
where
- S is the number of substitutions,
- D is the number of deletions,
- I is the number of insertions and
- N is the number of words in the reference
Examples
REF: What a bright day
HYP: What a day
In this case, a deletion happened. «Bright» was deleted by the ASR.
REF: What a day
HYP: What a bright day
In this case, an insertion happened. «Bright» was inserted by the ASR.
REF: What a bright day
HYP: What a light day
In this case, an substitution happened. «Bright» was substituted by «light» by
the ASR.
Range of values
As only addition and division with non-negative
numbers happen, WER cannot get negativ. It is 0 exactly when the hypothesis is
the same as the reference.
WER can get arbitrary large, because the ASR can insert an arbitrary amount of
words.
Interestingly, the WER is just the Levenshtein distance for words.
I’ve understood it after I saw this on the German Wikipedia:
begin{align}
m &= |r|\
n &= |h|\
end{align}
begin{align}
D_{0, 0} &= 0\
D_{i, 0} &= i, 1 leq i leq m\
D_{0, j} &= j, 1 leq j leq n
end{align}
$$
text{For } 1 leq ileq m, 1leq j leq n\
D_{i, j} = min begin{cases}
D_{i — 1, j — 1}&+ 0 {rm if} u_i = v_j\
D_{i — 1, j — 1}&+ 1 {rm(Replacement)} \
D_{i, j — 1}&+ 1 {rm(Insertion)} \
D_{i — 1, j}&+ 1 {rm(Deletion)}
end{cases}
$$
But I have written a piece of pseudocode to make it even easier to code this algorithm:
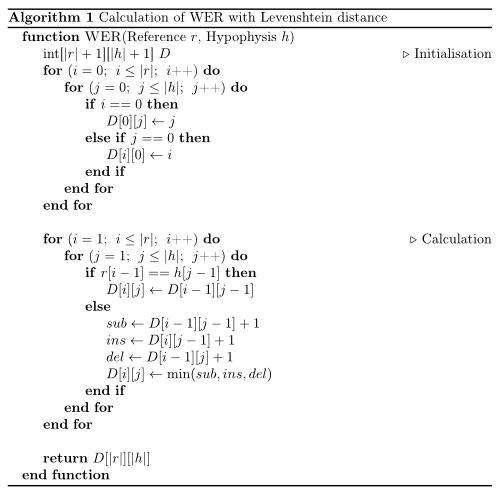
Python
#!/usr/bin/env python


def wer(r, h):
    """
    Calculation of WER with Levenshtein distance.

    Works only for iterables up to 254 elements (uint8).
    O(nm) time ans space complexity.

    Parameters
    ----------
    r : list
    h : list

    Returns
    -------
    int

    Examples
    --------
    >>> wer("who is there".split(), "is there".split())
    1
    >>> wer("who is there".split(), "".split())
    3
    >>> wer("".split(), "who is there".split())
    3
    """
    # initialisation
    import numpy

    d = numpy.zeros((len(r) + 1) * (len(h) + 1), dtype=numpy.uint8)
    d = d.reshape((len(r) + 1, len(h) + 1))
    for i in range(len(r) + 1):
        for j in range(len(h) + 1):
            if i == 0:
                d[0][j] = j
            elif j == 0:
                d[i][0] = i

    # computation
    for i in range(1, len(r) + 1):
        for j in range(1, len(h) + 1):
            if r[i - 1] == h[j - 1]:
                d[i][j] = d[i - 1][j - 1]
            else:
                substitution = d[i - 1][j - 1] + 1
                insertion = d[i][j - 1] + 1
                deletion = d[i - 1][j] + 1
                d[i][j] = min(substitution, insertion, deletion)

    return d[len(r)][len(h)]


if __name__ == "__main__":
    import doctest

    doctest.testmod()
Explanation
No matter at what stage of the code you are, the following is always true:
- If
r[i]equalsh[j]you don’t have to change anything. The error will be the same as it was forr[:i-1]andh[:j-1] - If its a substitution, you have the same number of errors as you had before when comparing the
r[:i-1]andh[:j-1] - If it was an insertion, then the hypothesis will be longer than the reference. So you can delete one from the hypothesis and compare the rest. As this is the other way around for deletion, you don’t have to worry when you have to delete something.
The transcription industry has evolved a lot over the past 10 years. Academic and Healthcare firms remain the largest transcription customers. However, other industries such as financial, legal, manufacturing, and education also make up a significant percentage of the customer base.
Automatic Speech Recognition (ASR) software have made our daily routines more convenient. For instance, Alexa can now tell you how the weather will look like today.
Perhaps like most industries, transcription industry has been affected by ASR. This software are increasingly being used by various players that require transcripts. ASR is a cheap transcription solution. However, there is a big problem with the accuracy of ASR transcripts.
According to research comparing the accuracy rates of human transcriptionists and ASR software, human transcriptionists had an error rate of about 4% while commercially available ASR transcription software’s error rate was found to be 12%.
In a nutshell, the error rate of ASR is three times as bad as that of humans.
In 2017, Google announced that its voice recognition software had attained a Word Error Rate (WER) of about 4.7%. Is it really possible?
Let’s understand how ASR works and what are its implications in our transcription and translation industry.
What is Word Error Rate Mechanism (WER): By Definition
Word Error Rate (WER) is a common metric used to compare the accuracy of the transcripts produced by speech recognition APIs.
How to calculate WER (Word Error Rate Mechanism)
Here is a simple formula to understand how Word Error Rate (WER) is calculated:
- S stands for substitutions,
- I stands for insertions,
- D stands for deletions,
- N is the number of words in the reference (that were actually said).
What Affects the Word Error Rate?
For speech recognition APIs like IBM Watson and Google Speech, a 25%-word error rate is about average for regular speech recognition. If the speech data is more technical, more “accented”, more industry-specific, and noisier, it becomes less likely that a general speech recognition API (or humans) will be more accurate.
Technical and Industry-specific Language
Human transcriptionists charge more for technical and industry-specific language, and there’s a reason for it. Reliably recognizing industry terms is complex and does take effort. Due to this, speech recognition systems trained on “average” data are found struggling with more specialized words.
Speaking with Different Accents and Dialects
What is construed as a strong accent in Dublin is normal in New York. Large companies like Google, Nuance and IBM have built speech recognition systems which are very familiar with “General American English” and British English. However, they may not be familiar with the different accents and dialects of English spoken in different cities around the world..
Disruptive Noise
Noisy audio and background noise is unwelcome but is common in many audio files. People rarely make business calls to us from a sound studio, or using VoIP and traditional phone systems compress audio that cut off many frequencies and add noise artifacts.
ASR Transcription Challenges and Word Error Rate Mechanism
Enterprise ASR software is built to understand a given accent and a limited number of words. For example, with some large companies their ASR software can recognize the National Switchboard Corpus, which is a popular database of words used in phone calls conversations that have already been transcribed.
Unfortunately, in the real world, audio files are different. For example, they may feature speakers with different accents or speaking different languages.
Also, most ASR software use WER to measure transcription errors. This measure has its shortfalls, such as:
- WER ignores the importance of words, giving the same score for each error in a document. In the real world, this isn’t accurate as some errors in a transcript matter compared to others.
- WER disregards punctuation and speaker labels.
- The test ignores the uhhs… and the mmhs…, duplicates and false starts that can interfere with the reading of your transcript.
Recent Research Findings on ASR
Researchers from leading companies like Google, Baidu, IBM, and Microsoft have been racing towards achieving the lowest-ever Word Error Rates from their speech recognition engines that has yielded remarkable results.
Gaining momentum from advances in neural networks and massive datasets compiled by them, WERs have improved to the extent of grabbing headlines about matching or even surpassing human efficiency.
Microsoft researchers, in contrast, report that their ASR engine has a WER of 5.1%, while for IBM Watson, it is 5.5%, and Google claims an error rate of just 4.9% (info source).
However, these tests were conducted by using a common set of audio recordings, i.e., a corpus called Switchboard, which consists of a large number of recordings of phone conversations covering a broad array of topics. Switchboard is a reasonable choice, as it has been used in the field for many years and is nearly ubiquitous in the current literature. Also, by testing against the audio corpus (database of speech audio files), researchers are able to make comparisons between themselves and competitors. Google is the lone exception, as it uses its own, internal test corpus (large structured set of texts).
This type of testing leads is limited as the claims of surpassing human transcriptionists are based on a very specific kind of audio. However, audio isn’t perfect or consistent and has many variables, and all of them can have a significant impact on transcription accuracy.
Is ASR Software’s WER Good Enough For Your Industry?
Stats reference:- An article written and shared by Andy Anderegg on Medium
ASR transcription accuracy rates don’t come close to the accuracy of human transcriptionists.
ASR transcription is also affected by cross talk, accents, background noise in the audio, and unknown words. In such instances, the accuracy will be poorer.
If you want to use ASR for transcription, be prepared to deal with:
- Inaccurate Transcripts
Accurate transcription is important, especially in the legal, business, and health industries. For instance, an inaccurate medical transcript can lead to a misdiagnosis and miscommunication.
ASR software produce more transcription errors than human transcriptionists. It is not uncommon to get a completely unintelligible transcript after using ASR. - Minimal Transcription Options
ASR software doesn’t have formatting or transcript options. The result will be transcripts that are not suited to your needs.
On the other hand, human transcriptionists can produce word to word or verbatim transcripts. - Different Speaking Styles
English is widely spoken in many parts of the world. However, there are considerable differences in the pronunciation and meaning of different words. People from different regions have their own way of speaking which is usually influenced by local dialects. Training voice recognition software to understand the various ways that English is spoken has proven to be quite difficult.
Transcription software also struggle when audio files have background noises. While AI has gotten incredibly good at reducing background noises in audio files, it is still far from perfect. If your file has background noises, you shouldn’t expect 100% accurate transcripts from using transcription software. - Ambiguous Vocabularies and Homophones
Transcription software also struggle to understand the context in speech. As a result, they cannot automatically detect missing parts of conversations in files. The inability to comprehend context can also lead to serious translation errors, which can have dire consequences in various industries. When words are spoken with a clear pause after every word, transcription software can easily and accurately transcribe the content. Therefore, the software would be best for dictations that revolve around short sentences.
However, in reality, humans speak in a more complex fashion. For example, some people talk softly while others talk faster when they are anxious. Transcription tools struggle to produce accurate transcripts in such contexts.
The Cost of Ignoring Quality Over Price
If you chose ASR transcription because it’s cheap, you will get low-quality transcripts full of errors. Such a transcript can cost you your business, money and even customers.
Here are two examples of businesses that had to pay dearly for machine-made transcription errors.
In 2006, Alitalia Airlines offered business class flights to its customers at a subsidized price of $39 compared to their usual $3900 price. Unknown to the customers, a copy-paste error had been made and the subsidized price was a mistake. More than 2000 customers had already booked the flight by the time the error was corrected. The customers wouldn’t accept the cancellation of their purchased tickets, and the airline had no choice but to reduce its prices leading to a loss of more than $7.2 million.
Another company, Fidelity Magellan Fund, had to cancel its dividend distribution when a transcription error saw it posting a capital gain of $1.3 billion rather than a loss of a similar amount. The transcription had omitted the negative sign causing the dividend estimate to be higher by $2.6million.
ASR transcription may be cheaper than human transcription. However, its errors can be costly. When you want accurate transcripts, human transcriptions are still the best option.
So, What Should You Do?
What is the way forward? Should you transition to automatic transcription or stay with the reliable manual transcription services provider?
Automatic transcription is fast and will save you time when you are on a deadline. However, in almost all cases, the transcripts will have to be brushed up for accuracy by professional transcriptionists.
Trained human transcriptionists can accurately identify complex terminology, accents, different dialects, and the presence of multiple speakers. The type of project should help you determine what form of transcription is best for you. If you are looking for highly accurate transcripts or work in a specialized industry like legal, academia, or medical, then working with a transcription company specialized in human transcription will be your best option.
Our Promise To You!
Unlike our peers, who have moved towards automated technology to gain a competitive cost advantage and maximize profits at the cost of accuracy, we stand our ground by only employing US-based human transcriptionist to whom we can trust for quality and confidentiality.
Our clients generally belong to different niche like legal, academic, businesses and more where quality matters above all. We have an unwavering commitment to client satisfaction, rather than mere concern for profit.
Время прочтения: 10 мин.
Вопрос оценки качества работы систем распознавания речи возникает как перед разработчиками собственных решений, так и перед конечными пользователями. Насколько качественна система распознавания речи? Насколько она эффективная на разных типах данных?
И очень хочется использовать не просто субъективный подход, а использовать какие-то объективные и количественные параметры.
В моем случае стояла задача произвести транскрибацию большого количества телефонных разговоров. При этом варианты выбора возможных решений были ограничены. Фактически рассматривалось три варианта: библиотека Python VOSK и собственное решение, далее условно обозначенное как S2T, и SmartSpeech от SberDevices. Но цель моего исследования не сравнение инструментов как таковое, а показать общий подход к данной задаче.
Существует ряд общепринятых метрик для проведения такой оценки.
Первое с чем нужно определиться – по какому критерию будет производится оценка, т.е. что именно будет оцениваться: например, точность распознавания речи, скорость обработки, устойчивость к шуму в источнике данных.
Далее нужно определить некий показатель (метрику) определяющую конкретное свойство для выбранного критерия. Например, процент точно распознанных слов, время обработки фрагмента речи, максимальный уровень шума и т.п.
После чего необходимо создать валидационный датасет. Или несколько датасетов, сгруппированных по доменам (например, телефонные звонки, аудиокниги). Т.к. очевидно, что на разных типах данных системы распознавания речи могут давать очень разный результат. Аудиокниги записываются в студии на специальном оборудовании в идеальных условиях, читаемый текст соответствует литературной норме именно письменной речи, и текст читает профессиональный диктор. В то время как телефонные звонки содержат разговорную речь, неполные предложения, часто не законченные, сигнал содержит помехи, и полоса частот более узкая и т.д.
Часто системы распознавания речи имеют разные модели для разных типов исходных данных, в частности для телефонных разговоров.
Частота дискретизации аудио (8 или 16 kHz) также важна. Вообще она должна быть такой же, как родная частота модели распознающей системы. Модели для работы с телефонными звонками как правило используют 8 kHz, и это нужно учитывать.
Для стабильности результатов тестирования длительность таких датасетов должна быть порядка 2-3 часов аудио.
Текст для расчета метрик должен быть нормализован. Т.е. все тексты приводятся к нижнему регистру. А все цифры должны быть записаны в виде текста. Т.к., например, SmartSpeech записывает числа именно числами, а VOSK такого не умеет. Какие-то системы могут расставлять знаки препинания, другие нет. А использование буквы «ё» может быть неоднозначно.
В связи с чем и необходимо привести все тексты к единообразному виду. Нормализация вообще может быть произведена по-разному, можно и наоборот, скажем, приводить все числа к представлению в виде цифр, а не текста, тут нет какого-то единственного верного решения.
Метрики
Существует ряд общепринятых метрик для подобных задач. Наиболее распространенные метрики для оценки точности распознавания речи:
- Word Recognition Rate (WRR) — точность распознавания, которая определяется как процент правильно распознанных слов, и родственная ей, Word Error Rate (WER) — процент неправильно распознанных слов. Вычисляется на основе расстояния Левенштейна.
- Метрика WER представляет собой «стоимость» для преобразования одной строки (эталонной) во вторую (гипотеза, результат транскрибации) с наименьшим числом операций замены (S), удаления (D) и вставки (I) слов.

где S — количество операций замены слов,
I — количество операций вставки слов,
D — количество операций удаления слов,
T — количество слов в эталонной фразе,
H — количество верно распознанных слов.
Чем метрика WER ближе к нулю, тем выше точность распознавания.
Упрощенно метрику WER можно понимать, как количество ошибок в словах (это не совсем так). Т.е., например, WER = 50% — это половина слов распознана неверно, WER = 10% — каждое десятое слово распознано неверно.
Обращаю внимание, показатель WER может быть и больше 100%. Это может произойти за счет операций вставок. Для иллюстрации рассмотрим такой искусственный пример:
Эталон: «Я стразу отправила запрос в военкомат»
Гипотеза: «Я сразу отправила запрос в военкомат по месту регистрации». WER = 416%.
Применяется также: ошибка распознавания соответствий — Math Error Rate (MER) и показатель потери информации Word Information Lost (WIL).

где T0 — количество слов в гипотезе распознавания.
- Метрика Character Error Rate (CER) вычисляется так же как WER, но не для слов, а для отдельных символов.
- Для оценки качества существуют так же другие менее распространенные метрики, учитывающие разные операции с разной стоимостью. Т.е., например, замена имеет меньший вес, чем вставка или удаление. Или учитывающие разные слова или буквы с разным весом (такой подход используется при оценке систем автоматизированного перевода).
- Для оценки скорости распознавания может быть использована метрика Real Time Factor (Коэффициент реального времени) – показатель отношения времени распознавания к длительности распознаваемого сигнала, также известного как Speed Factor (SF). Данный показатель можно рассчитать, используя формулу:

где Трасп – время распознавания сигнала, Т – его длительность. Коэффициент измеряется в долях от реального времени.
Для вычисления метрик существуют готовые решения.
Python библиотека JiWER. В её основе лежит библиотека Levenshtein для вычисления расстояния Левенштейна.
Или библиотека FastWER.
Не такое эффективное, как вышеуказанные библиотеки, но рабочее решение:
Исходный код:
import numpy as np

def levenshtein_distance(r, h):

    rows = len(r)+1
    cols = len(h)+1
    distance = np.zeros((rows,cols),dtype = int)

    for i in range(1, rows):
        for k in range(1,cols):
            distance[i][0] = i
            distance[0][k] = k

    for col in range(1, cols):
        for row in range(1, rows):
            if r[row-1] == h[col-1]:
                cost = 0 # если в позиции [i,j] один и тот же символ, то стоимость  = 0
            else:
                cost = 1
            distance[row][col] = min(distance[row-1][col] + 1,      # стоимость deletions
                                 distance[row][col-1] + 1,          # стоимость insertions
                                 distance[row-1][col-1] + cost)     # стоимость substitutions

    return distance[row][col]

def wer(r, h):
    return levenshtein_distance(r.split(), h.split()) / len(r.split()) * 100

def cer(r, h):
    return levenshtein_distance(r, h) / len(r) * 100
Вообще, неверно было бы просто посчитать метрику WER для нескольких текстов и взять среднее арифметическое из их значений (тексты разной длины будут давать одинаковый вклад в ошибку). Можно попробовать рассчитать WER для всего корпуса текстов, объединив их в один, но тут есть препятствие — вычислительная сложность алгоритма O(n^2), и для больших текстов быстро растет. Т.е. если для текста из 10 слов потребуется порядка 100 операций, для текста из 100 слов 10000 операций, а для текста из 1000 слов уже порядка 1000000 операций.
Поэтому я использовал не только среднее значение метрики WER (CER), но и ее среднеквадратичное отклонение, и форму распределения метрики как случайной величины.
Итак, с теорией на этом закончу, перехожу к нашей задаче. Напомню, мне необходимо было транскрибировать большое количество звонков. И для этого сначала нужно было выбрать инструмент, который будет для этого использоваться.
Я сделал выборку для исследования из 90 звонков, общей длительностью 180 минут. Нужно отметить, что в случае с телефонными разговорами у меня нет 100% верной текстовой версии разговора, поэтому использовал ручную транскрибацию для получения эталонного текста.
Т.е. звонки были прослушаны и транскрибированы людьми вручную, а полученный таким образом текст использовался в качестве 100% верного эталонного текста при вычислении метрик.
Хотя это, конечно, дает смещенную оценку метрик WER (CER), так как люди тоже совершают ошибки при транскрибации (около 5% для русской речи). Но, так как в нашем случае все инструменты сравнивались между собой по одной и тоже методике и на одних и тех же данных, этим можно пренебречь.
Но, если сравнивать значения полученных метрик с результатами других исследований, то это нужно иметь ввиду.
Я в основном ориентировался на метрики CER и WER, как наиболее общепринятые, понятные интуитивно и простые для вычисления.
На графике ниже представлена ядерная оценка плотности распределения метрик WER и CER для данной выборки.

Средние значения: S2T = 22.6%, VOSK = 22.15, SmartSpeech=22.9
Средние значения: S2T = 7.2%, VOSK = 8.1, SmartSpeech=2.9
Чем левее находится пик на графике и уже разброс показателя — тем лучше. Видно, что при близких по значению средних показателях метрики разброс значений значительно отличается.
В моем случае наилучшие результаты продемонстрировал SmartSpeech. Библиотека VOSK и S2T значительно уступают, при этом VOSK оказался на последнем месте.
Некоторые критические замечания
WER – хороший и интуитивно понятный показатель качества распознавания речи для аналитических языков (таких как английский, испанский, итальянский), в которых морфология достаточно проста. Но для синтетических языков, которые имеют богатую морфологию словообразования (русский, турецкий, арабский т.д.), WER оказывается завышен и вообще является менее показательным. Связанно это с тем, что такие языки могут синтезировать достаточно длинные словоформы, состоящие из нескольких морфем, определяющие грамматические признаки; при этом конец словоформы в беглой речи произносить менее четко, что часто приводит к неопределенности.
Например:
Эталон: «Перезвоню через пол часа»
Гипотеза: «Перезвоним через пол часа»
WER: 25%, CER: 8.33%
Эталон: «Я могу поговорить с Ларисой Михайловной»
Гипотеза: «Я могу поговорить с Лариса Михайловной»
WER: 16.67%, CER: 5.13%
Собственно, метрика WER наиболее популярна, т.к. публикации на эту тему существуют в основном именно на английском языке.
Для синтетических языков (таких как русский) могут применяться другие метрики, такие как: ошибки распознавания символов (CER), фонем, слогов, морфем. Именно поэтому я больше ориентируюсь на метрику CER, а не более общепринятую WER.
Но есть более интересные подходы. В частности, для русского языка с учетом его структуры хорошей метрикой является флективная ошибка распознавания слов (IWER – Inflectional Word Error Rate), которая определяется следующим образом:

Здесь вес Сhard приписывается всем неверным заменам слов, которые приводят к замене лексемы слова (являются грубыми ошибками), а Shard количество таких грубых ошибок. Csoft это вес негрубых ошибок, т.е. где было неверно распознано окончание словоформы, но основа при этом была распознана верно; Ssoft — количество негрубых ошибок.
Такой подход лучше, но тоже не идеален. Например, сотрудник в телефонном разговоре говорит: «Я могу приступать», а фраза распознается как «Я могу преступать».
Слова отличаются одной буквой, и грамматически верны оба случая, но они несут разный смысл. «Приступать» — означает начало действия, в то время как «преступать» — может означать нарушение установленных норм, закона. С другой стороны, у человека скорее всего вообще не будет никакой сложности верно интерпретировать слово из контекста.
Тем не менее и метрика WER и IWER его «заминусуют» так же как, например, слово «самовар». Т.е. для гипотезы «Я могу преступать» WER = 33.3% и для «Я могу самовар» тоже WER = 33.3%. Это ошибка в корне слова, так что будет учтена с максимальным весом в случае использования IWER.
В данном материале мною были рассмотрены основные и альтернативные метрики качества применяемые для оценки работы систем автоматизированного распознавания речи. Ошибки в распознавании слов, символов; их специфика с учетом особенностей русского языка. Так же рассмотрен процесс подготовки данных для оценки качества работы таких систем.
Коэффициент ошибок в словах ( WER ) — это общий показатель производительности системы распознавания речи или машинного перевода .
Общая сложность измерения производительности заключается в том, что распознанная последовательность слов может иметь длину, отличную от длины контрольной последовательности слов (предположительно правильной). WER происходит от расстояния Левенштейна и работает на уровне слов, а не на уровне фонем . WER — ценный инструмент для сравнения различных систем, а также для оценки улучшений в рамках одной системы. Этот вид измерения, однако, не дает подробных сведений о природе ошибок перевода, и поэтому требуется дальнейшая работа для определения основного источника (источников) ошибки и концентрации любых исследовательских усилий.
Эта проблема решается путем первого выравнивания распознанной последовательности слов с эталонной (произносимой) последовательностью слов с помощью динамического выравнивания строк. Рассмотрение этого вопроса осуществляется с помощью теории, называемой степенным законом, которая устанавливает корреляцию между недоумением и частотой ошибок в словах.
Затем коэффициент ошибок в словах можно рассчитать как:
где
- S — количество замен,
- D — количество удалений,
- I — количество прошивок,
- C — количество правильных слов,
- N — количество слов в справочнике (N = S + D + C)
Интуиция за «удалением» и «вставкой» заключается в том, как перейти от ссылки к гипотезе. Поэтому, если у нас есть ссылка «Это википедия» и гипотеза «Эта _ википедия», мы называем это удалением.
При сообщении о производительности системы распознавания речи иногда вместо этого используется точность слов (WAcc) :
Обратите внимание, что, поскольку N — это количество слов в ссылке, коэффициент ошибок по словам может быть больше 1,0, и, таким образом, точность слова может быть меньше 0,0.
Эксперименты
Обычно считается, что более низкая частота ошибок в словах показывает более высокую точность распознавания речи по сравнению с более высокой частотой ошибок в словах. Однако по крайней мере одно исследование показало, что это может быть неправдой. В ходе эксперимента Microsoft Research было показано, что, если бы люди были обучены принципу «что соответствует цели оптимизации для понимания» (Wang, Acero and Chelba, 2003), они бы показали более высокую точность понимания языка, чем другие люди, продемонстрировавшие меньшее количество ошибок в словах, что показывает, что истинное понимание разговорной речи зависит не только от высокой точности распознавания слов.
Прочие показатели
Однако одна проблема с использованием общей формулы, такой как приведенная выше, заключается в том, что не учитывается влияние, которое различные типы ошибок могут иметь на вероятность успешного результата, например, некоторые ошибки могут быть более разрушительными, чем другие, а некоторые могут исправляться легче, чем другие. Эти факторы, вероятно, будут специфичными для тестируемого синтаксиса . Еще одна проблема заключается в том, что даже при наилучшем выравнивании формула не может отличить ошибку замены от комбинированной ошибки удаления и вставки.
Хант (1990) предложил использовать взвешенную меру точности производительности, при которой ошибки подстановки взвешиваются на единицу, а ошибки удаления и вставки взвешиваются только на 0,5, таким образом:
Однако ведутся споры о том, можно ли правильно использовать формулу Ханта для оценки производительности отдельной системы, поскольку она была разработана как средство сравнения более справедливо конкурирующих систем-кандидатов. Еще одна сложность заключается в том, позволяет ли данный синтаксис исправлять ошибки и, если да, то насколько легко этот процесс для пользователя. Таким образом, есть некоторые достоинства аргумента в пользу того, что показатели производительности должны разрабатываться в соответствии с конкретной измеряемой системой.
Однако какая бы метрика ни использовалась, одна из основных теоретических проблем при оценке производительности системы состоит в том, чтобы решить, было ли слово «произнесено неправильно», то есть виноват пользователь или распознаватель. Это может быть особенно актуально в системе, которая предназначена для работы с людьми, для которых данный язык не является родным, или с сильными региональными акцентами.
Темп, с которым следует произносить слова в процессе измерения, также является источником различий между испытуемыми, так же как и потребность испытуемых в отдыхе или вдохе. Все эти факторы, возможно, необходимо каким-то образом контролировать.
Для текстового диктовки обычно считается, что точность производительности ниже 95% неприемлема, но это опять же может зависеть от синтаксиса и / или предметной области, например, есть ли у пользователей временное давление для выполнения задачи, есть ли альтернативные методы завершения и так далее.
Термин «частота ошибок одного слова» иногда называют процентом неправильных распознаваний для каждого отдельного слова в системном словаре.
Изменить расстояние
Коэффициент ошибок по словам также может называться нормализованным расстоянием редактирования по длине . Нормализованное расстояние редактирования между X и Y, d (X, Y) определяется как минимум W (P) / L (P), где P — это путь редактирования между X и Y, W (P) — это сумма веса элементарных операций редактирования P, а L (P) — количество этих операций (длина P).
Смотрите также
- BLEU
- F-мера
- МЕТЕОР
- NIST (метрическая система)
- ROUGE (метрическая система)
Ссылки
Ноты
- ^ Клаков, Дитрих; Йохен Петерс (сентябрь 2002 г.). «Проверка корреляции коэффициента ошибок по словам и недоумения». Речевое общение . 38 (1–2): 19–28. DOI : 10.1016 / S0167-6393 (01) 00041-3 . ISSN 0167-6393 .
- ^ Wang, Y .; Acero, A .; Челба, К. (2003). Является ли коэффициент ошибок в словах хорошим показателем точности понимания разговорной речи . Семинар IEEE по автоматическому распознаванию и пониманию речи. Сент-Томас, Виргинские острова США. CiteSeerX 10.1.1.89.424 .
- ^ Нейссендр. (2000)
- ^ Вычисление нормализованного расстояния редактирования и приложения: AndrCs Marzal и Enrique Vidal
Другие источники
- McCowan et al. 2005: Об использовании средств поиска информации для оценки распознавания речи
- Хант, М.Дж., 1990: Показатели качества для оценки распознавателей связанных слов (Речевая коммуникация, 9, 1990, стр. 239-336)
- Зехнер, К., Вайбель, А. Минимизация количества ошибок в словах в текстовых обзорах разговорной речи