
Introduction and Disclaimers
A few years ago I wrote an article for this site titled “How to use Managed C++ to Automate Excel” using Microsoft’s Visual Studio (VS) 2003.
How to use Managed C++ to Automate Excel
Since that time Microsoft has come out with VS 2005 and VS 2008. There were some significant differences between VS 2003 and VS2005/VS2008. For one thing, Microsoft now refers to what was “Managed” code in VS2003 to “C++/CLI” code in VS2005 and VS2008. In addition, there have been some significant (to me at least) syntax changes between Managed code and C++/CLI code. One of the biggies is that the asterisk symbol (*) is no longer used in C++/CLI code. Instead the caret (^) or “hat” is used to denote a “tracking handle” which, in a lot of ways, kind of behaves like a pointer. I’m not going to try and go into the details of how they work (that’s not the purpose of this article and besides, I’m not smart enough to make it clear to you). Other syntax changes include implicit boxing and the ability to directly index. Both of these changes eliminate a lot of clunky code.
VS 2008 comes with Visual Studio Tools for Office. I haven’t looked closely at this feature yet but it seems to be directed toward .NET Framework 3.5. All the machines that I support use .NET Framework 2.0 so I’m sticking to the way that I migrated from earlier versions of VS. There is a lot of information about automating Excel at: msdn — Excel Tasks
I suggest you research that site. You won’t find many (if any at all) C++ examples there but if you are vaguely familiar with C# or VB, you may be able to interpret the C# or VB code to C++.
I will try and follow the same structure as I used in my previous article to demonstrate how to automate Excel. The main difference is that the code used herein will be C++/CLI compliant and will run in VS2008 (probably VS2005 as well). In my current job, I am responsible for developing and maintaining 17 Windows Forms applications and, with a very few exceptions, all are written in pure C++/CLI. My point is that I am able to do most everything in C++/CLI that I can do in native code. The exceptions are that I occasionally use a couple of native library functions for which I haven’t discovered an exact C++/CLI equivalent.
As a final disclaimer, I’ll repeat what I said in my previous article about my code. It works. It’s probably not the most efficient, or elegant, or even the most logical. I didn’t take the time to do a lot of digging and research when I converted my project from VS2003 to VS2005 and then to VS2008. But the code I came up with works with VS 2008 C++/CLI. I apologize in advance to all the “purists” out there who may be offended by what they might view as my ugly inefficient code and I’ll be happy to accept any suggestions for improvement, as long as you have tested them and they work!
Project Overview
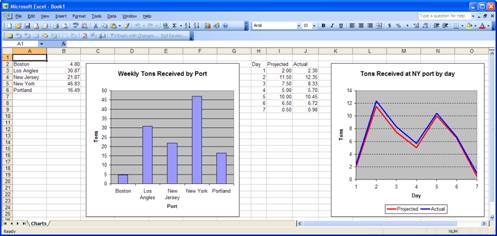
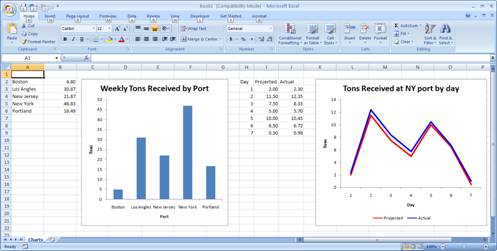
The purpose of this article is to show you how I got Excel to work using MC++ in a Windows Forms Application so I’m not going to try and make this example very elaborate. I’ll be using made-up data in an imaginary circumstance. We will create a .NET Windows Forms Application and put a button on the form that will cause Excel to run and display a Workbook with three Worksheets. I’ll show you a way to delete and add Worksheets to the Workbook and a way to create bar charts and line charts and place them and their supporting data onto a Worksheet. This is what the finished product will look like if you are using Office 2003:
If you are using Office 2007, it will look like this (I’ll be using Office2007 in all my remaining examples):

Project Setup
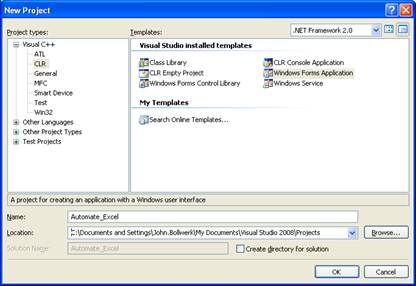
- I’m using Visual Studio 2008 and targeting .NET Framework 2.0. Start a new project in Visual Studio. I selected as my Project Type Visual C++ CLR and Windows Forms Application as the Template.

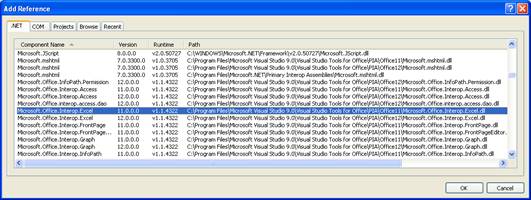
- You will need to add an Office Primary Interop Assembly (PIA) for Excel to your References. You can find it by bringing up your project’s properties window and clicking the “Add New Reference” button. On the .Net tab, scroll down to “Microsoft.Office.Interop.Excel”. There are two assemblies on my machine, 11.0.0.0 and 12.0.0.0. I use 11.0.0.0 and it works with Office 2003 and Office 2007. I haven’t tried 12.0.0.0 but 11.0.0.0 works for me and that’s good enough for me. So select the one you want to try and click “OK”.

- While you have the properties window open, select “Configuration Properties” in the left window then select ”Safe MSIL Common Language Runtime Support (/clr:safe)” as the “Common Language Runtime support” option.

- Add the following line to your header file (Form1.h):
using namespace Microsoft::Office::Interop::Excel;
- I also added a line in the header file:
#define Excel Microsoft::Office::Interop::ExcelThis avoids having to type “”Microsoft::Office::Interop::Excel when I refer to an Excel method or property.
- To avoid confusing the compiler between a System application and an Excel application, you will also have to change the lines in the main method in the Automate_Excel.cpp from:
Application::Run(gcnew Form1());
return 0;
To:
System::Windows::Forms::Application::EnableVisualStyles();
System::Windows::Forms::Application::SetCompatibleTextRenderingDefault(false);

System::Windows::Forms::Application::Run(gcnew Form1());

return 0;
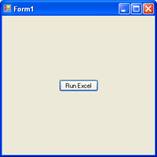
- Put a button on Form1. I named mine
butExceland set the Text property to “Run Excel”. - Double-click the button to create an event handler in the Form1.h file:
private: System::Void butExcel_Click(System::Object^ sender, System::EventArgs^ e) {
}

If you compile and run, all you have at this point is:
In the next section we will create a method that will run Excel and call this method from the butExcel_Click event handler.
Code to make Excel Run
- Add a method to your project that will create and run an Excel application.
void Form1::RunExcel()
{
            Excel::Application^ exApp = gcnew Excel::ApplicationClass();
            Workbook^   exWb  = exApp->Workbooks->Add(Type::Missing);
            .
            .
            .
            exApp->Visible = true;
}
Note: If you didn’t add the #define line I told you about in step 5 above to your header file, you will have to type “Microsoft::Office::Interop::Excel::Application” instead of “Excel::Application”.
- Put a call to this method in the
butExcelevent handler:
private: System::Void butExcel_Click(System::Object^ sender, System::EventArgs^ e) {
    RunExcel();
}
- Now compile and run. Clicking the Run Excel button should cause Excel to start and open a Workbook with three empty Worksheets in it.
Note: Working with Excel is the only place I’ve encountered extensive use of the Type::Missing argument. It causes the called method to use a default parameter value. You can probably find out more about them by using the Object Browser and/or going to Microsoft’s web site at the URL I mentioned in the beginning of this article.
Delete, Rename, Select, and Add a Worksheet
- Let’s say you only want two worksheets in your Workbook. You can delete a Worksheet by referring to its order in the Sheets collection. Worksheet numbering starts at one (1) not zero (0). This line will delete the second (Sheet2) Worksheet:
safe_cast<Worksheet^>(exApp->ActiveWorkbook->Sheets[2])->Delete();
- Although I don’t do it in this example, you can add one or more Worksheets with the following line of code which adds two (2) Worksheets to the Workbook.
exWb->Worksheets->Add(Type::Missing,Type::Missing,2,Type::Missing);
- If you have several Worksheets and you want to work with a particular one, you need to make the one you want to work with your active Worksheet. You can do that with this line of code that makes the second Worksheet active:
safe_cast<Worksheet^>(exApp->ActiveWorkbook->Sheets[2])->Select(Type::Missing);
- You can create a variable reference to the active Worksheet’s tracking handle to be able to easily rename it and to pass it to the methods that will create charts. The active sheet is the first sheet after Workbook creation (I do this in the
RunExcel()method shown below).Worksheet^ exWs = safe_cast<Worksheet^>(exApp->ActiveSheet);
- To rename the active Worksheet do this:
exWs->Name = "Charts";
The Controlling Method
I use the
RunExcel()method to set up and control what happens in Excel. Here is the method in its entirety:void Form1::RunExcel() { Excel::Application^ exApp = gcnew Excel::ApplicationClass(); Workbook^ exWb = exApp->Workbooks->Add(Type::Missing); safe_cast<Worksheet^>(exApp->ActiveWorkbook->Sheets[3])->Delete(); safe_cast<Worksheet^>(exApp->ActiveWorkbook->Sheets[2])->Delete(); Worksheet^ exWs = safe_cast<Worksheet^>(exApp->ActiveSheet); exWs->Name = "Charts"; LoadData(); MakeBarChart(exWs, 2, 1); MakeLineChart(exWs, 2, 8); exApp->Visible = true; }
Here is what’s happening in the above steps:
- This step creates the application. If you didn’t use a define statement for Excel you will have to use the full path (
Microsoft::Office::Interop::Excel) to reference Excel: - The application created in step 1 is empty; there is no Workbook in it. This step adds a Workbook that contains three Worksheets (three get automatically added).
- Since I only plan to use one sheet, I delete the last two. Delete the last one first, works better that way.
- I will be passing a reference (tracking handle) for the Worksheet to the methods that build my charts so here I create a reference to the active Worksheet. When you add the Workbook to the application, the first Worksheet, Sheet1, is the default active Worksheet. You can make another Worksheet active with:
safe_cast<Worksheet^>(exApp->ActiveWorkbook->Sheets->Item[3])->Select(Type::Missing);
Where the number 3 is the third Worksheet in the collection.
- This step creates the application. If you didn’t use a define statement for Excel you will have to use the full path (
- This line renames the active Worksheet.
- Call the method to load data. You need to get data from somewhere. In my real world application I read it from a file and store it in a global SortedList until I process it and am ready to put it onto my Worksheet. You can store data in a SortedList, Hashtable, Array, or some other data structure until you need it or you can put it on the Worksheet as you read it into your application, whichever works best for you. You can also obtain data from a database server using SQL commands. For this example, I use
LoadData()to put some fake data into three global SortedLists. - This is a call to the method that will build a bar chart. I pass it a reference to the Worksheet where I want the chart and its data placed and I pass the row and column numbers where I want to start placing the data.
- This calls the method to build the line chart. Same information gets passed as in step 7.
- After all the work is done, you have to cause the application to be visible.
Load Data
Since this article deals with Excel, I’m going to phony-up data in a method called LoadData(). I’m putting names of ports and tons of materials received in a SortedList that I’ll use for generating a bar chart. I’m also building two SortedLists for use with the line charts, one for tons projected and one for tons actual. For what it’s worth, here’s the code:
void  Form1::LoadData()
{
      slTonsRcvd              = gcnew SortedList();         slByDayNYProjected      = gcnew SortedList();         slByDayNYActual         = gcnew SortedList();
      slTonsRcvd->Add("New York",   46.826);
      slTonsRcvd->Add("New Jersey", 21.865);
      slTonsRcvd->Add("Boston",     4.8);
      slTonsRcvd->Add("Los Angles", 30.87);
      slTonsRcvd->Add("Portland",   16.4876);

      slByDayNYProjected->Add(1, 2.0);
      slByDayNYProjected->Add(2, 11.5);
      slByDayNYProjected->Add(3, 7.5);
      slByDayNYProjected->Add(4, 5);
      slByDayNYProjected->Add(5, 10);
      slByDayNYProjected->Add(6, 6.5);
      slByDayNYProjected->Add(7, .5);

      slByDayNYActual->Add(1, 2.3);
      slByDayNYActual->Add(2, 12.345);
      slByDayNYActual->Add(3, 8.331);
      slByDayNYActual->Add(4, 5.702);
      slByDayNYActual->Add(5, 10.45);
      slByDayNYActual->Add(6, 6.718);
      slByDayNYActual->Add(7, .98);
}
Make a Bar Chart
Here is the bar chart I want to produce, appropriately sized, the data I produce it from, and the position on the Worksheet where I want it to appear. The chart shows a fictitious amount of cargo in tons delivered to various ports:
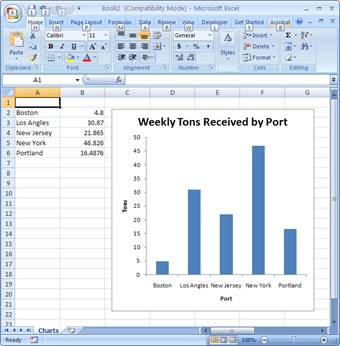
I want the data to be in the first two columns of the Worksheet and I want the chart to be next to the data. I want the Tons column to be formatted as a decimal to two places but show as an integer on the chart. I want a chart title and titles on both the X and Y axes.
Here is the method I used to produce that chart, explanations follow the code:
void  Form1::MakeBarChart(Worksheet ^ws, int row, int col)
{
      int         xPos = (col+2)*48;            int         yPos = row*9;                 double      tons = 0;
      String^     port;

            ws->Range["B1", Type::Missing]->EntireColumn->NumberFormat = "#,##0.00";

            safe_cast<Range^>(ws->Columns)->ColumnWidth = 12;

            IDictionaryEnumerator^ ide = slTonsRcvd->GetEnumerator();
      while (ide->MoveNext()) {
            port = ide->Key->ToString();
            tons = Convert::ToDouble(ide->Value);
            ws->Cells[row, col]     =  port;
            ws->Cells[row, col+1]   = tons;
            row++;
      }

            ChartObjects^ chObjs = safe_cast<ChartObjects^>(ws->ChartObjects(Type::Missing));

            ChartObject^ chObj = chObjs->Add(xPos, yPos, 300, 300);

            Chart^ ch = chObj->Chart;

            Range^ rn = ws->Range["A2:B6", Type::Missing];

            ch->ChartWizard(rn->CurrentRegion,                                            Constants::xlColumn,                                        Type::Missing,                                              XlRowCol::xlColumns,                                        1,                                                          Type::Missing,                                              false,                                                      "Weekly Tons Received by Port",                             "Port",                                                     "Tons",                                                     Type::Missing);
            safe_cast<Axis^>(ch->Axes(XlAxisType::xlValue, XlAxisGroup::xlPrimary))->
                                                      TickLabels->NumberFormat = "#,##0";
}
I use some variables simply to make the code easier (for me) to deal with. So let’s go through step-by-step.
- I want to display my Tons data to two decimal places. So in the first step, I do a numeric format on the entire column. If you don’t want the entire column formatted, you can specify a range. For example to format only rows 1 through 10 you would substitute ”B1:B10” for ”B1”. If you did not want to display any decimal places you could use «#,##0» as your format string as I did in step 9.
- I set the column width of the entire Worksheet to a width of 12. If you want to adjust the width of a single column, you can do it with:
safe_cast<Range^>(ws->Columns["B1",
Type::Missing])->EntireColumn->ColumnWidth = 12;
- In step 3, I just enumerate through a SortedList containing the port name as the key and the tons as the value. I plunk each key/value pair into the appropriate cells in the Worksheet.
- This step creates a Chart object Collection for the Worksheet but doesn’t do anything with it. That gets done next.
- Here we add a Chart object to the Chart Object Collection and specify its position and size in points. The arguments are integer: X position, Y position, Width and Height. You have to play around with these numbers to get the chart positioned and sized exactly where and how you want it.
- I create a Chart reference variable that I can use with the Chart Wizard method.
- I found that using a Range reference variable makes it easier to deal with in the Chart Wizard method. The Range should cover only the cells that your data resides in. In the next chart example I’ll include series titles in that range.
- This is the Chart Wizard method. You can find the Chart Wizard Method described on Microsoft’s site at here:
- The first argument, Source, is where the data for the chart is located in the Worksheet.
- Gallery is an integer that specifies the chart type that you want to draw. Logically, it should be an enum of XlChartType but my object browser does not show a chart type for a plain old bar chart. So, I dug around and found that the integer value for a bar chart is 3 and that there is an Excel constant
xlColumnthat has a value of 3, so I use that as a value just to remind me that this is a column bar chart. You will see in the Line Chart example that there really is a chart type ofxlLine. - I’m not sure exactly how Format argument works and Microsoft’s explanation isn’t very clear to me. Since I’m able to get what I want on the chart with its default, I use that.
- My understanding of PlotBy is that it tells Excel how your data is arranged on the Worksheet, by columns as mine is or by rows. The XlRowCol is an enum that can be either xlRow or xlColumn.
- Categorylabels tells Excel where in your specified range to look for X-axis labels. Here, I’m telling it to look in the first column of the range that I specify in the source argument.
- Series labels deals with chart legend labels and I show an example of that in the line chart example.
- Has Legend tells Excel if you want to show a legend.
- The next three arguments tell Excel what you want for titles. Title is the chart title, Category is the X-axis title, and Value is the Y-axis title.
- I don’t have a need for the last “extra title” argument and I haven’t tried using it.
- I did not want decimal places to show on the chart’s Y-axis values. So after a lot of hacking, I came up with a line of code that would format those values to integers.
If you run the application at this point and click the “Run Excel” button here’s what you should get (using Office 2007, Office 2003 should give similar results):

Make a Line Chart
The line chart is intended to compare the amount of tons projected to arrive at a port against the amount that actually arrived over a seven day period. The data columns have titles and there is a legend at the bottom that identifies which line is which. I will modify the line color and thickness and reposition the legend.
Here is the code that will produce the chart:
void  Form1::MakeLineChart(Worksheet ^ws, int row, int col)
{
      int         xPos = (col+5)*48;            int         yPos = row*9;                 double      tonsA = 0;                    double      tonsP = 0;                    String^     day;                          String^     title = "Tons Received at NY port by day";

            ws->Range["I1:J1", Type::Missing]->EntireColumn->NumberFormat = "#,##0.00";

            ws->Range["H1",    Type::Missing]->EntireColumn->ColumnWidth = 5;
      ws->Range["I1:J1", Type::Missing]->EntireColumn->ColumnWidth = 9;

            ws->Cells[row, col]       = "Day";
      ws->Cells[row, col+1] = "Projected";
      ws->Cells[row, col+2] = "Actual";

            IDictionaryEnumerator^ ide = slByDayNYProjected->GetEnumerator();
      while (ide->MoveNext()) {
                        day = ide->Key->ToString();
            tonsP = Convert::ToDouble(ide->Value);
            ws->Cells[row+1, col] = day;
            ws->Cells[row+1, col+1] = tonsP;
                        tonsA = Convert::ToDouble(slByDayNYActual[ide->Key]);
            ws->Cells[row+1, col+2] = tonsA;
            row++;
      }

            ChartObjects^ chObjs = safe_cast<ChartObjects^>(ws->ChartObjects(Type::Missing));

                  ChartObject^  chObj = chObjs->Add(xPos, yPos, 350, 300);

            Chart^ ch = chObj->Chart;

            Range^ rn = ws->Range["I2:J9", Type::Missing];

            ch->ChartWizard(rn->CurrentRegion,                                XlChartType::xlLine,                            Type::Missing,                                  XlRowCol::xlColumns,                            1,                                              1,                                              true,                                           title,                                          "Day",                                          "Tons",                                         Type::Missing);
            ch->ChartType = safe_cast<XlChartType>(XlChartType::xlLine);

            ch->Legend->Position = XlLegendPosition::xlLegendPositionBottom;

            safe_cast<Axis^>(ch->Axes(XlAxisType::xlValue,
                         XlAxisGroup::xlPrimary))->TickLabels->NumberFormat = "#,##0";

            safe_cast<Series^>(ch->SeriesCollection(1))->Border->Weight =
XlBorderWeight::xlThick;
      safe_cast<Series^>(ch->SeriesCollection(2))->Border->Weight =
XlBorderWeight::xlThick;

            safe_cast<Series^>(ch->SeriesCollection(1))->Border->ColorIndex = 3;
      safe_cast<Series^>(ch->SeriesCollection(2))->Border->ColorIndex = 32;
}
If you compile and run, you will get the following Excel Charts:
I have changed and added some variables to accommodate the data and to handle the long string used for a title. Here is the step-by-step explanation:
- Here I format the two columns of numbers to show two decimal places.
- I shrink the column width for the three data columns to reduce the distance between charts (just because I want to). J
- This chart has column titles and a legend. The column two titles over the tons data will be the legend titles. See steps 8 and 9.
- Here I enumerate through a SortedList that has the day as its key and projected tons as its value. I use the key from this
SortedListto get the actual tons value from a second SortedList that also has the day as its key. I put the data into the appropriate Worksheet cells. Again, there’s probably a more efficient or clever way to do this, but this way works for me. - Same as bar chart.
- Same as bar chart except the X position has been changed to move the chart over to the right and the chart width is made wider to keep the chart title from wrapping.
- Same as bar Chart.
- Note that the range includes the column titles. This is because I want to use them for the legend.
- The Chart Wizard:
- Source argument is data source to include the title row.
- This time there is an XlChartType enum that can be used for the
Galleryargument. Unfortunately, it doesn’t produce the type of line that it is supposed to. It produces a line with markers instead of a plain line. So, in step 10 the ChartType is set again, this time it works. Seems to me that Microsoft needs to do some work in this area! - Plot By and Category Labels are the same as in bar charts
- Series Labels is where we tell Excel to use the first row of our data columns as the title for the legend that goes with the data in that particular column.
- Since we want a legend, we set Has Legend value to true.
- I use a variable for the chart title. The rest of the arguments are just like those in the bar chart.
- Here is where I again set the Chart Type. I don’t have a clue as to why this has to be done or why it works. Anyone know?
- The default position of the legend is at the right side of the chart. I want mine at the bottom and this is how it gets moved. The
XlLegendPositionenum can be found using the Object Browser. - Again, I want the Y-axis numbers to show as integers.
- This step adjusts the line thickness. The
XlBorderWeightenum can also be found in the Object Browser. - And finally, I want the colors of the lines to be a true red and blue so I set the colors. To get the value to use I opened Excel and built a chart with legend (Object Browser was no help with this one). Then started the macro recorder and double clicked the legend to bring up the Format Legend dialog box. I selected the color I wanted from the legend’s color chart, closed the dialog box and stopped the recording. I then opened the macro in the macro editor and used the VB .ColorIndex value shown therein. I tried using RGB values but got a run-time exception.
Conclusion
A word of caution! When I was using Office 2003, I found that when I closed Excel, sometimes the EXCEL.EXE remained alive in memory. The next time I opened or started Excel I had two EXCEL.EXE instances running and Excel displayed Book2 (or Book3 or however as many processes were running) in its title instead of Book1. This continued until I killed all the EXCEL.EXE processes that were running using Windows Task Manager by selecting each EXCEL.EXE shown in the Processes tab’s window and clicking the End Process button. Thus far, I have not seen this behavior with Office 2007.
The transition from Managed code in VS2003 to C++/CLI in VS 2005 and VS2008 was a bit painful due to syntax changes. But, to me, the resulting code is cleaner, easier to read, understand, and maintain. Now if Microsoft would just provide C++/CLI examples everywhere that they provide C# and VB examples, life would be easier!
This member has not yet provided a Biography. Assume it’s interesting and varied, and probably something to do with programming.
Microsoft Office Excel is the most frequently-used Microsoft application and one of the leading spreadsheet programs available. A spreadsheet program is a program that uses a huge grid to display data in rows and columns. The spreadsheet program can then be used to do calculation, data manipulation, and various similar tasks, against this data.
Microsoft Office Excel is one of the powerful Office tools that provides uncomplicated data management. It is loaded with features such as graphing, charting, pivot tables, and calculation. Even though Excel is loaded with numerous features for users, there may be some functionality that cannot be achieved by using the standard Microsoft Excel environment. In Microsoft Office Excel 2007, automation is a great mechanism for populating business documents (for example, reports) with data from backend system. This can be achieved by using VSTO 3.0 and Visual Studio 2008. Microsoft Office Excel 2007 is more programmable than ever before with support for Visual Studio Tools for Office.
VSTO is aimed at Microsoft Office Excel users who want to develop Excel-based applications for other Microsoft Office Excel users. VSTO 3.0 is shipped with all of the newly-enhanced Excel objects, including improved features for building Microsoft Office based solutions.
VSTO 3.0 is loaded with new features, including support for Windows form controls from within Microsoft Office tools customization. It provides the support for using .NET frameworks, objects and classes for Microsoft Office tools customization. For example, System.Data is the .NET frameworks object that can be used inside the Excel solution to process database operations. This new feature is tightly integrated with the Visual Studio 2008 IDE and gives you the comfort of design time customization of Excel documents for data display and UI customization.
Similar to other Microsoft Office Tools, with Microsoft Office Excel 2007 customization using VSTO 3.0, you have two levels of customization— document-level customization and application-level customization. Document-level customization is a solution created for document-level programming and is specific to the document that is part of that particular solution. Application-level customization is a solution created for application-level programming and is specific to the application, and therefore common to all documents based on that application.
In a simple Hello World demonstration, let’s learn about the document level customization approach. We’ll step through a simple task, showing how to create an Excel document that will display a Hello World message on startup.
Hello World example using Visual Studio 2008
- Open Visual Studio 2008, and create a new Excel 2007 Workbook project.
- Select New Project. Under Office select 2007, and then select the Excel 2007 Workbook template and name the project ExcelHelloWorld, as shown in the following image:

- The document selection dialog box is displayed. At this point, you need to choose the template for your design. In this example, you select a new blank template and click on the OK button. Refer to the following screenshot:
The solution will be created with all of the supporting files required for our development of an Excel solution. Each solution is created with three worksheets, with default names: Sheet1, Sheet2, and Sheet3 for the workbook you’re going to customize , as shown in the following image. The number of sheets in a new workbook depends on the settings in Excel. The following image also shows you the Excel-supported controls, placed on the leftmost side of the Visual Studio 2008 toolbox panel. You can also see the visual representation of Excel 2007 inside Visual Studio 2008.
- Let’s write our Hello World message in a cell when we load the Excel 2007 document. Write the following code inside the ThisWorkbook.cs file.
// The Startup event of workbook in our Excel solution
// Startup event common to all Office application
// Startup event will be fired at the start of the application
private void ThisWorkbook_Startup(object sender,
System.EventArgs e)
{
// Creating the instance of active WorkSheet of Excel Document
Excel.Worksheet AuthorWorkSheet = ThisApplication.ActiveSheet
as Excel.Worksheet;
// Get the range using number index through Excel cells
by setting AuthorExchange to an Excel range object starting at
(1,1) and ending at (1,1)
Excel.Range AuthorExcelRange = ThisApplication.
get_Range(AuthorWorkSheet.Cells[1, 1],
AuthorWorkSheet.Cells[1, 1]);
// Setting the value in the cell
AuthorExcelRange.Value2 = "Hello! this is my VSTO program for
Excel 2007";
}
The following screenshot results after adding and executing the preceding code:


Manipulation
Microsoft Office Excel is one of the most comprehensive data management tools for all kinds of users. It is a tool that can be easily understood and quickly learnt. The most important feature of Microsoft Office Excel is its capability to manipulate data from different sources.
Excel is one of the most powerful and user-friendly data manipulation applications. You could use Excel to predict what’s ahead for your business by creating detailed financial forecasts. This powerful application has pivot table functionality that allows you to drop in your data and rearrange it to answer all kinds of business data analysis type questions. Excel helps you to build various useful analytical tools such as your monthly sales report and product sales growth analysis more easily and flexibly. Excel offers you formulae and functions that will help you to perform complex financial calculations without any manual errors. Excel can provide you with a graphical presentation of your business data by using charts and graphs.
Want to know your growth levels for a specific product sales range? Check which parts of your business are performing worse? The pivot table provides more information from your business in depth.
Every application in this computer world works with data. The data can be in any form and can belong to different sources. The key question for data management is where to place the data. You manage the data in two ways: data managed outside the program and data managed inside the program. The data managed outside the program includes data managed in a database, a file system, and so on. Data managed inside the program includes data in different worksheets within the workbook, embedded images, and so on.
Data manipulation
For users who are not satisfied with the default features in Microsoft Office Excel, VSTO programming makes Excel more flexible, and provides a development tool for the creation of custom solutions for data manipulation and data analysis.
Custom programming using VSTO 3.0 improves most part of the Microsoft Office Excel solution. Custom programming using VSTO 3.0 provides a wide range of advantages, including saving time by automating most of the frequently-performed tasks, reducing errors due to manual operations, as well as enforcing standards for data processing, and building the capability to seamlessly integrate with other applications seamlessly.
Reading worksheet cells
There are many ways to manipulate data and write to the cells in an Excel worksheet. Let’s see some of these ways. We can read worksheet cells directly through the Cells property of the sheets, rows, and columns, and can set a value directly by using the cell’s row and column index. Open Visual Studio 2008 and create a new Excel solution. Refer to the previous example for full instructions of how to do this. Write the following code inside the ThisWorkbook.cs file. In this sample explanation, you are writing data into the worksheet by using the Cells object.
// The Startup event of workbook in our Excel solution
private void ThisWorkbook_Startup(object sender,
System.EventArgs e)
{
// Set value for Cells row and column index
// Text data in Sheet1 cells
Globals.Sheet1.Cells[3, 3] = "Set my data";
}
We can also read the worksheet and write data to the cells by using the Range object. In this case, you are creating the range and setting the text data for the range in the Excel worksheet.
Open Visual Studio 2008 and create a new solution, as before. Write the following code inside the ThisWorkbook.cs file . In this demonstration, you read the worksheet through the range of cells and set the value by reading through cell ranges.
private void ThisWorkbook_Startup(object sender,
System.EventArgs e)
{
// Setting value in ExcelSheet cells through reading range object
Excel.Range AuthorExcelSheetRange = Globals.Sheet1.Range["A2",
"B2"];
// Text data for the range A2 to B2
AuthorExcelSheetRange.Value2 = "Set my data";
}
Let’s see a demonstration of how to read data from an external data file and display this inside our Excel cells. In this demonstration, you will see how the data from the text (.txt) file is displayed in the spreadsheet.
Opening a text file as a workbook using VSTO
We’ll now see how to open the text file as a workbook by using VSTO and C# programming. This saves time and makes the user more comfortable in accessing the text file while processing the data. Open Visual Studio 2008 and create a new solution, as before. Write the following code inside the ThisWorkbook.cs file:
// Opening Text file as workbook
private void ThisWorkbook_Startup(object sender,
System.EventArgs e)
{
// In the workbook objects, file path as parameter in Opentext
property this.Application.Workbooks.OpenText(@"C:TechBooks.txt",
// Value 1 is, the row from which it will read data in the text
file missing, 1,
// Checks for delimits for text parsing
Excel.XlTextParsingType.xlDelimited,
// Text Enumeration value
Excel.XlTextQualifier.xlTextQualifierNone,
missing, missing, missing, true, missing, missing, missing,
missing, missing, missing, missing, missing, missing);
}
Connecting with Microsoft SQL Server 2008 database
Microsoft SQL Server 2008 is a relational database management system developed by Microsoft Corporation. Microsoft SQL Server is used to manage a huge volume of data along with relation and Metadata information for this data. VSTO provides support for manipulating the data from your database inside Excel using ADO.NET classes.

The preceding figure demonstrates how an Excel 2007 object is used to interact with the Microsoft SQL Server database. Let’s see how to connect with a relational database management system, retrieve data from the database, and finally display it in our Excel spreadsheet. This demonstration shows you how to retrieve data from a Microsoft SQL Server 2008 database and place the retrieved data into the worksheet cells.
Open Visual Studio 2008 and create a new solution, as usual. Write the following code inside the ThisWorkbook.cs file.
// Namespace for SQL Server connection
using System.Data.SqlClient;
// Startup event of the workbook
private void ThisWorkbook_Startup(object sender,
System.EventArgs e)
{
// Opening SQL connection for Microsoft SQL Server 2008
// WINNER the database server contains the databse called Products
SqlConnection MySQLConnection = new SqlConnection(@"Data
Source=WINNER;Initial Catalog=Products;
Integrated Security=True");
// Passing SQL command text
SqlCommand MySQLCommand = new SqlCommand("SELECT * FROM
Books", MySQLConnection);
MySQLConnection.Open();
// SQL reader to read through data from Database
SqlDataReader MySQLReader = MySQLCommand.ExecuteReader();
// Get the active sheet of current application
Excel.Worksheet MyWorkSheet = this.Application.ActiveSheet as
Excel.Worksheet;
// Header for the columns set in the Value2 properties
((Excel.Range)MyWorkSheet.Cells[1, 1]).Value2 = "Book Name";
((Excel.Range)MyWorkSheet.Cells[1, 2]).Value2 = "Author Name";
// Indexer
int i = 2;
// Loop to read through the database returned data
while (MySQLReader.Read())
{
// Writing the data from the database table column BookName
((Excel.Range)MyWorkSheet.Cells[i, 1]).Value2 =
MySQLReader["BookName"];
// Writing the data from the database table column Author
((Excel.Range)MyWorkSheet.Cells[i, 2]).Value2 =
MySQLReader["Author"];
i++;
}
// Dispose the SQL command
MySQLCommand.Dispose();
// Closing SQL connection after using it.
MySQLConnection.Close();
}
The following screenshot displays data retrieved from Microsoft SQL Server 2008 database and the data being displayed in the worksheet cells.

In this demonstration, you learned how to connect with a Microsoft SQL Server 2008 database in order to get data and populate it in a workbook. This is just one of the ways of manipulating data outside of a workbook.
I want know how to take information from a GridView and show it in Excel as a chart. Any pointers?
![]()
GusP
2,4542 gold badges22 silver badges32 bronze badges
asked Jun 4, 2009 at 12:19
You save its datasource —
datasetname.WriteXml(filename);
Excel can read XML files.
answered Jun 4, 2009 at 12:23
![]()
NinethSenseNinethSense
8,7042 gold badges23 silver badges23 bronze badges
You need to manipulate an Excel workbook.
Maybe this link will provide a good entry point for your task. What is needed is VSTO (Visual Studio Tools for Office) to perform Excel-Automation tasks.
![]()
GusP
2,4542 gold badges22 silver badges32 bronze badges
answered Jun 4, 2009 at 12:25
![]()
crauschercrauscher
6,47814 gold badges59 silver badges84 bronze badges
- Remove From My Forums
-
Question
-
I have list of tables in my database.
how to retrieve list of tables including data into databound control and
how to export the tables data to excelsheet individually..
a)Gets the list of tables within the database
b)Gets data
c)Exports the data to excel worksheets (there are 2 methods defined (1) range method (2) cell by cell
d.) Saves the excel sheet
plz provide the code for above requirements as soon as possible
-
Moved by
Friday, November 26, 2010 7:00 AM
(From:.NET 3.0/3.5 Windows Workflow Foundation)
-
Moved by
Answers
-
Hi Bhanu,
After reading your post, I knew your issue, but I feel that it is more likely an ADO.net problem.a)Gets the list of tables within the database
You can use the sql below to get the tables of your DataBase
use YourDataBaseName
select name
from
sys.tables, and then you can use ADO.net to bind the dataset to a control(DropdownList,ListBox) on the
page. And below is the article for you to reference:http://www.aspfree.com/c/a/ASP.NET/ASPNET-Dropdown-List-Control-Eight-Ways-to-Bind-Data/
b)Gets data
You can also use ADO.net to get data from DataBase by using similar sql:
select * from tablename
and then bind the result to a control such as datagridview on the page.
Here are the articles about binding data to GridView:
http://www.c-sharpcorner.com/UploadFile/john_charles/DatabindinginASPNETusingGridViewcontrol04222009111712AM/DatabindinginASPNETusingGridViewcontrol.aspx
http://www.aspnettutorials.com/tutorials/database/db-grid-aspnet2-vb.aspx
c)Exports the data to excel worksheets (there are 2 methods defined (1) range method (2) cell
by celld.) Saves the excel sheet
Below is my code I have ever used to export data from DataTable to Excel, I think it can help
you,protected void Button1_Click(object sender, EventArgs e) { int col = 0; int row = 1; string data = null; int i = 0; int j = 0; exApp = new Excel.Application(); wb = exApp.Workbooks.Add(Type.Missing); ws = wb.Worksheets.get_Item(1) as Excel.Worksheet; SqlConnection conn = new SqlConnection("Data Source=.;Initial Catalog=sample;Integrated Security=SSPI;"); SqlCommand cmd = new SqlCommand("select * from StudentInfo", conn); SqlDataAdapter da = new SqlDataAdapter(cmd); DataSet ds = new DataSet(); cmd.CommandType = CommandType.Text; conn.Open(); da.Fill(ds); conn.Close(); for (col = 0; col < ds.Tables[0].Columns.Count; col++) { ws.Cells[row, col + 1] = ds.Tables[0].Columns[col].ColumnName.ToString(); } range = exApp.Cells[row, col + 1]; range.Columns.Font.Bold = true; range.Columns.AutoFit(); row++; for (i = 0; i < ds.Tables[0].Rows.Count; i++) { for (j = 0; j < ds.Tables[0].Columns.Count; j++) { data = ds.Tables[0].Rows[i][j].ToString(); ws.Cells[row, j + 1] = data; } row++; } Excel.FormatCondition formatCondition = null; string formatFormula = "=$A1="A""; Excel.Range formatRange = null; formatRange = ws.get_Range("B1:C1") as Excel.Range; formatRange.FormatConditions.Add(Excel.XlFormatConditionType.xlExpression, Type.Missing, formatFormula, Type.Missing, Type.Missing, Type.Missing, Type.Missing, Type.Missing); formatCondition = formatRange.FormatConditions.Item((formatRange.FormatConditions.Count)) as Excel.FormatCondition; formatRange.FormatConditions.Item(1).Interior.ThemeColor = Excel.XlThemeColor.xlThemeColorAccent6; formatRange.FormatConditions.Item(1).Interior.PatternColorIndex = Excel.XlColorIndex.xlColorIndexAutomatic; formatRange.FormatConditions.Item(1).Interior.TintAndShade = 0; formatRange.FormatConditions.Item(1).StopIfTrue = false; string strCurrentDir = Server.MapPath("~/ExportedExcels/"); string strFile = "subbu.xlsx"; ws.SaveAs(strCurrentDir + strFile, Microsoft.Office.Interop.Excel.XlFileFormat.xlWorkbookDefault, Type.Missing, Type.Missing, Type.Missing, Type.Missing, Type.Missing, Type.Missing, Type.Missing, Type.Missing); wb.Close(Type.Missing, Type.Missing, Type.Missing); exApp.Workbooks.Close(); exApp.Visible = true; GC.Collect(); GC.WaitForPendingFinalizers(); GC.Collect(); GC.WaitForPendingFinalizers(); exApp.Application.Quit(); exApp.Quit(); System.Runtime.InteropServices.Marshal.FinalReleaseComObject(exApp); string strMachineName = Request.ServerVariables["SERVER_NAME"]; string ExcelFilePath = Server.MapPath("~/ExportedExcels/" + strFile); System.IO.FileInfo file = new System.IO.FileInfo(ExcelFilePath); if (file.Exists) { // set appropriate headers Response.Clear(); Response.AddHeader("Content-Disposition", "attachment; filename=" + file.Name); Response.AddHeader("Content-Length", file.Length.ToString()); Response.ContentType = "application/octet-stream"; Response.WriteFile(file.FullName); Response.Flush(); Response.End(); // string strScript = "<script language=JavaScript>window.open('" + file.FullName + "','dn','width=1,height=1,toolbar=no,top=300,left=400,right=1,scrollbars=no,locaton=1,resizable=1');</script>"; } }Hope these can help you and feel free to follow up after you have tried these.
Best Regards,
Bruce Song
Please remember to mark the replies as answers if they help and unmark them if they provide no help.
Welcome to the All-In-One Code Framework! If you have any feedback, please tell us.-
Proposed as answer by
Bruce Song
Wednesday, December 1, 2010 10:11 AM -
Marked as answer by
Bruce Song
Friday, December 3, 2010 7:49 AM
-
Proposed as answer by
Часть 6. Создание приложений на платформе Microsoft Office
Основные требования
Создание дополнительных модулей
Работа с документами Word и Excel
Настройка и расширение «ленты»
Создание панелей задач
Использование Word Content Controls
Расширения на основе Outlook Forms
Создание SharePoint workflow
Новые механизмы защиты и развертывания приложений на основе Microsoft Office
Компоненты VSTO 2008
Новая, третья версия Visual Studio Tools for Office (называемая также VSTO 2008) позволяет создавать решения на основе ключевых продуктов из состава Microsoft Office 2003 и Microsoft Office 2007. Поддерживаются языки программирования C# и Visual Basic .NET. В VSTO 3.0 есть ряд новых и расширенных функций, которые мы кратко рассмотрим далее. Visual Studio Tools for Office входит в состав следующих изданий Visual Studio: Visual Studio 2008 Professional, Team Edition for Architects, Team Edition for Database Professionals, Team Edition for Developers и Team Edition for Testers.
Поддержка создания решений на основе Microsoft Office появилась в Visual Studio в 2003 году: первая версия Visual Studio Tools for Office поддерживала только Excel 2003 и Word 2003 и позволяла реализовывать расширения на уровне документов (document-level code behind), используя управляемый код.
В VSTO 2005 появилась поддержка InfoPath, а также возможность создания модулей расширения для Outlook. Помимо этого в VSTO 2005 была реализована поддержка создания панелей задач (ActionsPane) для ряда продуктов, входящих в семейство Microsoft Office 2003.
В VSTO 2005 Second Edition была добавлена поддержка Office 2007, включая возможность создания расширений для PowerPoint и Visio. Этот продукт был доступен для бесплатной загрузки для легальных пользователей Microsoft Visual Studio.
Как уже было отмечено, VSTO 3.0 входит в состав Visual Studio 2008 начиная с версии Professional и обеспечивает поддержку разработки модулей расширения на уровне документов и приложений как для Office 2003, так и для Office 2007. Обеспечены возможность создания Workflow для Microsoft SharePoint и развертывание по технологии ClickOnce.
Основные требования
Для того чтобы вы смогли создавать решения с помощью Visual Studio Tools for Office, на компьютере, используемом для разработки, должны быть установлены следующие компоненты:
- поддерживаемые версии Microsoft Office. В зависимости от типа проекта могут потребоваться различные версии продукта, но все они должны быть установлены локально, на компьютере разработчика (табл. 1);
- для всех установленных продуктов семейства Microsoft Office потребуется установка PIA (Primary Interop Assemblies), которые обеспечивают доступ к программной модели продуктов семейства Office из кода, написанного на управляемых языках программирования и выполняемого под управлением CLR (Common Language Runtime);
- для того чтобы решения на базе Microsoft Office, создаваемые средствами Visual Studio Tools for Office, можно было отлаживать и выполнять, PIA должны быть установлены в глобальном кэше сборок (Global Assembly Cache, GAC);
- если перед установкой Microsoft Office на компьютере была установлена библиотека .NET Framework версии 2.0 или более поздней, вы можете установить PIA в глобальный кэш сборок, выбрав в Office опцию Complete Installation. В противном случае вам потребуется отдельно установить PIA;
- отметим, что PIA, входящие в состав Visual Studio Tools for Office, устанавливаются локально и используются только для сборки разрабатываемых проектов;
- как часть установки Microsoft Office необходимо установить Visual Basic for Applications (VBA).
Для установки Visual Studio Tools for Office на компьютере, где планируется разработка для Microsoft Office System 2007, необходимо выполнить следующие шаги:
- Установить .NET Framework 3.5 или более поздней версии — это необходимо сделать перед установкой Primary Interop Assemblies, которые помещаются в глобальный кэш сборок.
- Установить требуемую версию Microsoft Office, включая Primary Interop Assemblies. Отметим, что Visual Studio Tools for Office не поддерживает разработку для Microsoft Office 2003 и 2007 (или различных версий отдельных продуктов, например Word 2003 и Word 2007) на одном компьютере — для создания приложений для Microsoft Office 2003 и 2007 потребуется отдельный компьютер для каждой версии продукта.
- Установить версию Visual Studio, в состав которой входит Visual Studio Tools for Office. При необходимости получения локализованных сообщений также потребуется установить Language Package, который доступен на сайте Microsoft.
В случае использования Visual Studio Tools for Office для создания приложений для Microsoft Office 2003 вам потребуется установить .NET Framework 2.0, а также пакет обновлений для Office — Office Service Pack 2.
Если вы планируете создавать и расширять SharePoint Workflow, необходимо установить Visual Studio Tools for Office на компьютере, операционная система которого поддерживает Microsoft Office SharePoint Server 2007 — Windows Server 2003 или Windows Server 2008. В результате будут установлены шаблоны проектов, которые позволят вам создавать расширения для SharePoint Workflow.
После того как все необходимые компоненты, продукты и средства разработки установлены, можно приступать к разработке решений на базе Microsoft Office. К основным возможностям, предоставляемым Visual Studio Tools for Office, относятся: создание дополнительных модулей, работа с документами Word и Excel, расширение интерфейсного элемента «лента», создание панелей задач, использование Word Content Controls, разработка расширения на основе Outlook Forms и создание расширений для SharePoint Workflow.
Создание дополнительных модулей
Дополнительные модули на уровне приложений (application-level add-ins) позволяют расширять функциональность ключевых приложений, входящих в состав Microsoft Office. Дополнительные модули доступны в приложении независимо от того, какой документ в нем открыт, — это отличает механизмы расширения на основе дополнительных модулей от механизмов расширения на основе шаблонов документов, которые мы рассмотрим ниже.
В Visual Studio Tools for Office входят средства для создания дополнительных модулей на основе новых шаблонов проектов для большинства приложений, входящих в семейства Microsoft Office 2003 и Microsoft Office 2007, — Excel 2003 и 2007, InfoPath 2007, Outlook 2003 и 2007, PowerPoint 2003 и 2007, Project 2003 и 2007, Visio 2003 и 2007, Word 2003 и 2007. Использование новой программной модели существенно упрощает создание дополнительных модулей, так как не требует применения COM-технологий.
Шаблоны, входящие в состав Visual Studio
Tools for Office
Среди новинок для модулей расширений отметим возможность обеспечения доступа к объектам внутри ваших моделей расширений из других компонентов Microsoft Office — например из других модулей расширений или из кода на Visual Basic for Applications, включенного в состав документа. Таким образом, у разработчиков появляется возможность создания на уровне модулей расширения разделяемых сервисов, которые могут использоваться другими компонентами и сервисами.
Работа с документами Word и Excel
Создание расширений на уровне документов представляет собой способ добавления расширенной функциональности к тому или иному документу либо к электронной таблице. Поскольку расширения реализованы на уровне документов, они будут доступны только в тех документах или электронных таблицах, с которыми они ассоциированы.
В состав Visual Studio Tools for Office входит набор возможностей, упрощающих создание расширений на уровне документов для Word 2007 и Excel 2007. К таким возможностям относятся:
- создание расширений для документов и электронных таблиц в формате Office Open XML для Word 2007 и Excel 2007 или в двоичных форматах, поддерживаемых в Microsoft Office 2003 или более ранних версий;
- дизайн документов и шаблонов в Visual Studio и написание кода в среде разработчика;
- возможность добавления компонентов Windows Forms в документы и шаблоны;
- добавление компонентов-расширений (host-controls) для встроенных объектов Word и Excel, которые расширяют объектный модуль и обеспечивают возможность связи с данными.
Настройка и расширение «ленты»
Интерфейсный элемент «лента» (Ribbon) впервые появился в Microsoft Office 2007 и представляет собой объединение функциональных возможностей меню, списков, галерей и ряда других элементов. Лента поддерживает контекстное переключение, группировку задач и ряд других возможностей. В Microsoft Office 2007 поддерживаются программная настройка и расширение интерфейсного элемента «лента» для продуктов Microsoft Office Excel 2007, Microsoft Office Outlook 2007, Microsoft Office PowerPoint 2007 и Microsoft Office Word 2007.
Существует два способа настройки элемента «лента»: с помощью дизайнера Ribbon Designer, включенного в состав Visual Studio Tools for Office 2008, и через описание «ленты» на языке Ribbon XML.
Настройка элемента «лента» с помощью дизайнера поддерживает следующую функциональность:
- возможность добавления настраиваемой «ленты» к проекту Office с применением специального шаблона проекта — Ribbon (Visual Designer);
- визуальное создание новых вкладок с помощью дизайнера:
- перетаскивание компонентов на «ленту»,
- настройка расположения компонентов и их внешнего вида,
- добавление обработчиков событий двойным щелчком по компоненту «ленты»;
- установка свойств «ленты» и ее компонентов в окне свойств (Properties);
- добавление кода обработчиков событий на языке Visual C# или Visual Basic с полной поддержкой проверки типов и технологии IntelliSense.
Дизайнер также может использоваться для добавления компонентов к меню, которые открываются при нажатии на кнопку Office (Microsoft Office Button).
Настройка «ленты» с применением языка Ribbon XML позволяет более детально контролировать «ленту» и ее элементы и выполнять ряд задач, не поддерживаемых в дизайнере Ribbon Designer. В Visual Studio Tools for Office 2008 работа с «лентой» на уровне Ribbon XML поддерживается на уровне специального шаблона — Ribbon (XML), помимо этого имеется возможность экспорта любой «ленты», созданной средствами дизайнера, в шаблон для редактирования «ленты» на уровне языка XML.
В Visual Studio Tools for Office 2008 реализована типизованная объектная модель, которая может использоваться для управления компонентами «ленты» в режиме выполнения приложения. Например, можно динамически добавлять элементы меню или управлять отображением отдельных компонентов в зависимости от контекста, в котором в данный момент находится приложение. Объектная модель состоит из трех ключевых элементов: класса Ribbon, событийной модели и классов, отвечающих за отдельные компоненты «ленты».
Класс Ribbon наследует от класса OfficeRibbon и представляет собой класс, код которого разделен в файлах кода, создаваемого разработчиком, и файла, генерируемого дизайнером «ленты». Событийная модель поддерживает три события: Load, возникающее при начальной загрузке расширений «ленты», LoadImage, используемое для кэширования графических изображений, применяемых в «ленте», и Close, которое возникает при завершении работы экземпляра «ленты».
В пространстве имен Microsoft.Office.Tools.Ribbon определены следующие классы, отвечающие за отдельные компоненты «ленты» (табл. 2).
Каждый класс отвечает за отдельный тип компонента «ленты» и свойства, которые позволяют динамически управлять отображением компонента и рядом других его параметров. Помимо свойств каждый компонент «ленты» поддерживает ряд событий — они перечислены в табл. 3.
Все рассмотренные выше классы, события и другие элементы поддержки «ленты» в Visual Studio Tools for Office 2008 реализованы в пространстве имен Microsoft.Office.Tools.Ribbon. Здесь содержатся классы приведенные в табл. 4.
Создание панелей задач
Создание панелей задач — это еще один способ настройки приложений Microsoft Office с помощью Visual Studio Tools for Office 2008. Панели задач представляют собой интерфейсный элемент, который обычно располагается справа от основного окна приложения Microsoft Office. Панели задач позволяют расширять функциональность офисных приложений и часто используются как механизм обеспечения интеграции между офисными приложениями и приложениями, автоматизирующими какие-либо бизнес-задачи.
Панели задач обычно создаются либо на уровне документов (в этом случае они называются Actions Panes), либо на уровне приложений — в таком случае их называют Custom Task Panes. В табл. 5 приведены основные рекомендации по использованию Actions Panes и Custom Task Panes.
Панель задач типа Actions Pane создается на основе класса ActionsPane, который реализован в пространстве имен Microsoft.Office.Tools. Данный класс поддерживает обширную объектную модель с большим числом методов, свойств и событий, которые могут применяться разработчиками для управления различными аспектами создания и отображения панелей задач, а также обеспечения всего жизненного цикла панели — от ее инициализации до завершения работы всего приложения.
Панель задач, используемая на уровне приложения (Custom Task Pane), создается на основе класса CustomTaskPane, который также реализован в пространстве имен Microsoft.Office.Tools. Ниже показан пример создания панели задач с применением метода Add(UserControl, String). В данном примере используются свойства объекта CustomTaskPane для установки ряда значений по умолчанию и задаются обработчики событий DockPositionChanged и VisibleChanged, реагирующие соответственно на изменение местоположения панели и переключение панели с отображаемой на неотображаемую:
private MyUserControl myUserControl1;
private Microsoft.Office.Tools.CustomTaskPane myCustomTaskPane;
private void ThisAddIn_Startup(object sender, System.EventArgs e)
{
myUserControl1 = new MyUserControl();
myCustomTaskPane = this.CustomTaskPanes.Add(myUserControl1,
“New Task Pane”);
myCustomTaskPane.DockPosition =
Office.MsoCTPDockPosition.msoCTPDockPositionFloating;
myCustomTaskPane.Height = 500;
myCustomTaskPane.Width = 500;
myCustomTaskPane.DockPositionRestrict =
Office.MsoCTPDockPositionRestrict.msoCTPDockPositionRestrictNoHorizontal;
myCustomTaskPane.Visible = true;
myCustomTaskPane.VisibleChanged +=
new EventHandler(myCustomTaskPane_VisibleChanged);
myCustomTaskPane.DockPositionChanged +=
new EventHandler(myCustomTaskPane_DockPositionChanged);
}
private void myCustomTaskPane_DockPositionChanged(object sender, EventArgs e)
{
Microsoft.Office.Tools.CustomTaskPane taskPane =
sender as Microsoft.Office.Tools.CustomTaskPane;
if (taskPane != null)
{
if (taskPane.DockPosition ==
Office.MsoCTPDockPosition.msoCTPDockPositionFloating)
{
taskPane.Height = 500;
taskPane.Width = 500;
}
}
}
private void myCustomTaskPane_VisibleChanged(object sender, EventArgs e)
{
Microsoft.Office.Tools.CustomTaskPane taskPane =
sender as Microsoft.Office.Tools.CustomTaskPane;
if (taskPane != null)
{
if (taskPane.Visible)
{
taskPane.DockPosition =
Office.MsoCTPDockPosition.msoCTPDockPositionRight;
}
}
}
Использование Word Content Controls
Компоненты, называемые Content Controls, применяются в Microsoft Office Word 2007 для структурирования документов. Такой компонент задает область документа, которая может иметь только определенное содержание: текст, дату, графические изображения и т.п. Компоненты Content Controls используются для ограничения возможностей пользователей по вводу неверной информации в определенные области документа.
В состав Visual Studio Tools for Office входит следующий набор средств, упрощающий разработку компонентов Content Controls:
- написание кода, использующего классы на управляемом коде для каждого компонента, входящего в состав Word 2007;
- обработка событий для каждого компонента;
- связь компонентов с элементами XML-документов, включаемых в состав документов, базами данных и объектами на управляемом коде;
- добавление компонентов к документам с помощью специального дизайнера:
- перетаскивание компонентов в документы,
- установка свойств документов,
- создание обработчиков событий по двойному щелчку мышью;
- программное добавление компонентов к документам в режиме выполнения.
Поддержка компонентов Content Controls реализована в пространстве имен Microsoft.Office.Tools.Word в виде классов, каждый из которых представляет собой компонент отдельного типа. Поддерживаются компоненты, приведенные в табл. 6.
Класс ContentControl представляет собой основу для одного из перечисленных выше компонентов — конкретный тип компонента задается свойством Type. Поддерживается создание компонентов как в режиме разработки приложения, так и в режиме выполнения.
Выше мы отметили возможность связи компонентов с различными источниками данных. Рассмотрим ее более подробно. Наличие связи компонентов с данными позволяет отображать данные, которые будут обновляться при обновлении данных в источнике, а также вносить изменения в данные, которые будут передаваться источнику. Поддерживаются следующие опции связи с данными:
- привязка компонентов к полям баз данных или объектам на управляемом коде — поддерживается та же функциональность, что и в Windows Forms;
- привязка компонентов к элементам XML-документов (они называются Custom XML Parts), которые встроены в основной документ.
При использовании модели связи с данными Windows Forms поддерживается связь компонента с одним элементом данных — например с колонкой в таблице базы данных. Помимо этого существует возможность связи с данными с применением окна Data Sources в Visual Studio. В табл. 7 показаны компоненты и поддерживаемые ими типы источников данных.
Для связи компонентов с элементами XML-документов используется свойство XMLMapping соответствующего компонента. В следующем примере показано, как связать компонент типа PlaintextContentControl с элементом Price в ветви Product из XML-документа, входящего в состав основного документа:
plainTextContentControl1.XMLMapping.SetMapping
(«/Product/Price», String.Empty, null);
При связывании компонентов с элементами XML-документов автоматически поддерживается так называемое двунаправленное связывание. Таким образом, если пользователь редактирует текст, соответствующий XML-элемент автоматически обновляется. Точно так же если значения XML-элементов обновляются, то обновляется и содержимое связанного с ними компонента. Связь с XML-элементами поддерживается для компонентов ComboBoxContentControl, DatePickerContentControl, DropDownListContentControl, PictureContentControl и PlainTextContentControl.
Все компоненты поддерживают событийную модель, которая может применяться для выполнения каких-либо действий, связанных с использованием данных. Событийная модель состоит из событий, приведенных в табл. 8.
Расширения на основе Outlook Forms
Visual Studio Tools for Office позволяет создавать регионы форм, которые расширяют функциональность стандартных или дополнительных форм Microsoft Office Outlook. В Visual Studio Tools for Office поддерживаются следующие возможности по созданию регионов форм:
- добавление регионов к проекту с применением специального шаблона — Form Region;
- задание расположения и типа региона и других характеристик с применением специального мастера — Form Region Wizard;
- визуальная разработка регионов с помощью специального дизайнера:
- перетаскивание компонентов в регионы,
- управление расположением компонентов и их характеристиками,
- создание обработчиков событий по двойному щелчку мышью;
- добавление кода на Visual C# или Visual Basic с полной поддержкой проверки типов и технологии IntelliSense;
- отладка проектов с использованием средств, которые автоматически запускают Outlook и генерируют файлы и конфигурационные настройки, позволяющие Outlook обнаружить и загрузить регионы форм.
Использование нового мастера — New Outlook Form Region — позволяет импортировать любой регион формы, созданный средствами Microsoft Office Outlook. При применении Microsoft Office Outlook для дизайна регионов форм можно использовать поля Outlook и компоненты, входящие в состав Outlook, которые недоступны через Visual Studio Toolbox. Помимо этого предоставляется возможность повторного применения регионов, разработанных для других проектов на основе Outlook. После того как регион импортирован, появляется возможность написания кода для обработчиков событий с применением штатных средств, предоставляемых Microsoft Visual Studio.
В табл. 9 показаны все возможные подходы к настройке и расширению интерфейса офисных приложений, поддерживаемые в Visual Studio Tools for Office.
Создание SharePoint workflow
Visual Studio Tools for Office позволяет создавать workflow для SharePoint — использование workflow дает возможность ассоциировать документы, хранящиеся в Microsoft Office SharePoint Server 2007, с процессами. Создание SharePoint workflow облегчают следующие возможности Visual Studio Tools for Office:
- для создания проектов для SharePoint workflow можно применять шаблоны SharePoint 2007 Sequential Workflow и SharePoint 2007 State Machine Workflow;
- отладка логики workflow нажатием клавиши F5. Visual Studio Tools for Office автоматически ассоциирует workflow с библиотекой документов по умолчанию на локальном портале SharePoint и запускает экземпляр workflow.
С помощью мастера New Office SharePoint Workflow пользователи могут указать конфигурацию для отладки. Мастер поддерживает следующие опции:
- указание сайта SharePoint, библиотеки и списков, которые могут использоваться при отладке SharePoint workflow;
- указание, какие действия запускают workflow.
Для создания проекта по разработке SharePoint workflow необходимо выполнить следующие шаги:
- В диалоговой панели New Project в панели Project Types выбрать язык программирования — Visual Basic или Visual C# — и одну из ветвей (все они содержат одинаковые шаблоны для SharePoint workflow):
- Workflow;
- Office;
- ветвь 2007 в ветви Office.
- В зависимости от типа создаваемого workflow выбрать шаблон — либо SharePoint 2007 Sequential Workflow, либо SharePoint 2007 State Machine Workflow — и задать имя проекта.
- В панели мастера New Office SharePoint Workflow задать опции отладки — они будут использоваться Visual Studio Tools for Office при развертывании workflow при его отладке из среды Visual Studio.
- На странице Specify the workflow name and site for debugging необходимо указать SharePoint Server имя, которое будет применяться для идентификации шаблона на сайте.
- Далее необходимо указать адрес портала, который будет использоваться для выполнения разрабатываемого workflow. Портал должен располагаться на локальном компьютере. По умолчанию применяется адрес: http://localhost/Docs.
- Нажмите кнопку Next.
- Если текущий портал не содержит списка history list, мастер создаст его автоматически, так как он используется для протоколирования всех событий, связанных с выполнением workflow, — например создание workflow, создание или завершение задания и т.п.
- На странице Select the lists you will use when debugging укажите библиотеку или список, которые будут использоваться для отладки workflow. Например, если разрабатываемый код предназначен для управления документом, следует указать библиотеку документов.
- Далее необходимо включить опцию Automatically Associate Workflow, которая позволит автоматически добавлять шаблон workflow к указанной библиотеке или к списку при отладке. В противном случае шаблон нужно будет добавлять вручную, используя страницу администратора Add a Workflow на сайте SharePoint.
- Задайте список задач, который вы собираетесь использовать. В нем отображаются задачи в рамках workflow, доступные каждому участнику процесса.
- Задайте список, который будет отображать все события, возникающие при выполнении workflow.
- Нажмите кнопку Next.
- На странице You can specify the conditions for how your workflow is started можно указать опции, которые будут использоваться при запуске workflow.
- После того как работа с мастером завершена, вы попадаете в дизайнер Designer for Windows Workflow Foundation, в котором происходит написание кода для workflow.
Непосредственная разработка workflow начинается с создания расписания — workflow schedule, которое представляет собой набор активностей, отражающих выполняемые действия. К расписанию добавляются требуемые активности — в зависимости от того, для решения каких задач предназначается workflow. При необходимости добавляются обработчики событий. К наиболее часто обрабатываемым событиям относятся события onWorkflowActivated и onWorkflowItemChanged.
Для тестирования workflow необходимо установить «точку остановки», например, на обработчике события onWorkflowActivated. После этого нужно выполнить действия над документом, приводящие к активации шагов workflow.
Новые механизмы защиты и развертывания приложений на основе Microsoft Office
Разработчикам предоставляется возможность использования технологии ClickOnce для обеспечения безопасности и развертывания решений, созданных средствами Visual Studio Tools for Office для платформы Microsoft Office 2007, включая расширения на базе документов и расширения на базе офисных приложений. В Visual Studio Tools for Office поддерживаются следующие средства развертывания приложений:
- мастер Publish Wizard для публикации и развертывания настроек и расширений;
- автоматическое определение наличия обновлений для созданных расширений — поддерживаются проверка наличия обновлений в заданные интервалы времени, загрузка и установка обновлений, а также откат к более ранним версиям расширений;
- возможность загрузки и выполнения решений на основе Office даже в тех случаях, когда пользователь не подключен к сети.
Модель безопасности, реализованная в технологии ClickOnce, разработана таким образом, чтобы быть совместимой с будущими версиями среды выполнения Visual Studio Tools for Office, Microsoft .NET Framework и Microsoft Office. В Visual Studio Tools for Office поддерживаются следующие ключевые возможности по обеспечению безопасности:
- для Microsoft Office 2007 предоставляется возможность обеспечения безопасности решений с применением независимой от версий модели безопасности ClickOnce;
- использование Trust Center в Microsoft Office для выбора оптимальных для вашего решения настроек безопасности, включая подписание манифеста развертывания сертификатами безопасности, отображение информации о безопасности на уровне ClickOnce и программное добавление элементов в список пользователей;
- задание политик безопасности для каждого пользователя.
Компоненты VSTO 2008
Ключевые компоненты VSTO 2008 располагаются в каталоге Program FilesMicrosoft Visual Studio 9.0Visual Studio Tools for Office. В корне находятся адаптеры для загрузки в Visual Studio в режиме дизайна Excel 2003/2007 и Word 2003/2007. Здесь также расположены «переходник» для использования компонентов, написанных на управляемых языках, в режиме дизайна и библиотека типов для дизайнера. Подкаталог PIA содержит сборки для реализации взаимодействия управляемого и неуправляемого кода (Primary Interop Assembly) как для версии Office 2003 (каталог Office11), так и для Office 2007 (каталог Office12). В каталоге vspkgs находятся расширения Visual Studio для реализации различных дизайнеров, а в каталоге VSTOTemplates есть шаблоны всех типов проектов, поддерживаемых в Visual Studio Tools for Office 2008.
В следующем разделе мы рассмотрим новинки в Visual Studio 2008, связанные с созданием сервисов, использованием Windows Communication Foundation и Windows Workflow Foundation.
КомпьютерПресс 4’2009