
You can create a SmartArt graphic that uses a Venn diagram layout in Excel, Outlook, PowerPoint, and Word. Venn diagrams are ideal for illustrating the similarities and differences between several different groups or concepts.
Overview of Venn diagrams
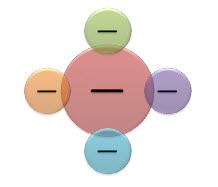
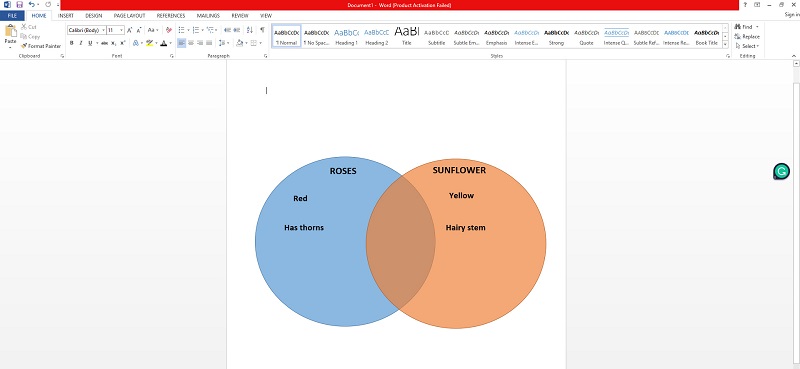
A Venn diagram uses overlapping circles to illustrate the similarities, differences, and relationships between concepts, ideas, categories, or groups. Similarities between groups are represented in the overlapping portions of the circles, while differences are represented in the non-overlapping portions of the circles.

1 Each large group is represented by one of the circles.
2 Each overlapping area represents similarities between two large groups or smaller groups that belong to the two larger groups.
What do you want to do?
-
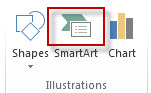
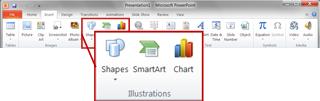
On the Insert tab, in the Illustrations group, click SmartArt.

An example of the Illustrations group on the Insert tab in PowerPoint 2013
-
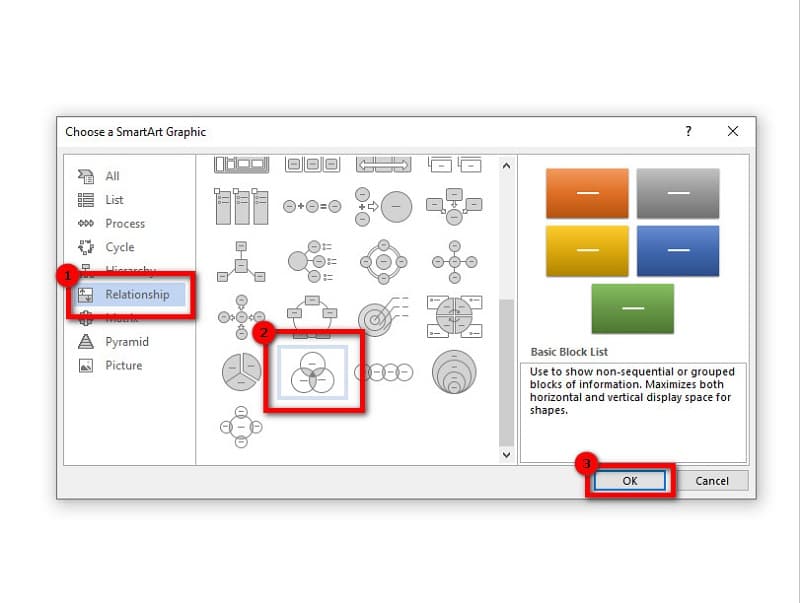
In the Choose a SmartArt Graphic gallery, click Relationship, click a Venn diagram layout (such as Basic Venn), and then click OK.

Add text to the main circles
-
Select a shape in the SmartArt graphic.
-
Do one of the following:
-
In the Text pane, click [Text] in the pane, and then type your text (or select a bullet and type your text).
-
Copy text from another location or program, click [Text] in the Text pane, and then paste your text.
-
Click a circle in the SmartArt graphic, and then type your text.
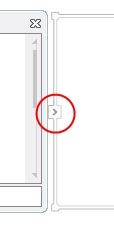
Note: If you do not see the Text pane, you can open it by clicking the control on the left side of the SmartArt graphic.
-
Add text to the overlapping portions of the circles
You cannot add text to the overlapping portions of a Venn diagram from the Text pane. Instead, you can insert text boxes and position them over the overlapping areas.
In Excel, Outlook, and Word:
-
On the Insert tab, in the Text group:
-
In Excel click Text Box.
-
In Outlook, click Text Box, and then click Draw Text Box.
-
In Word, click Text Box, and then at the bottom of the gallery, click Draw Text Box.
-
-
Then do the following:
-
Click and drag in an overlapping circle. Draw the text box the size you want.
-
To add text, click inside the box and type.
-
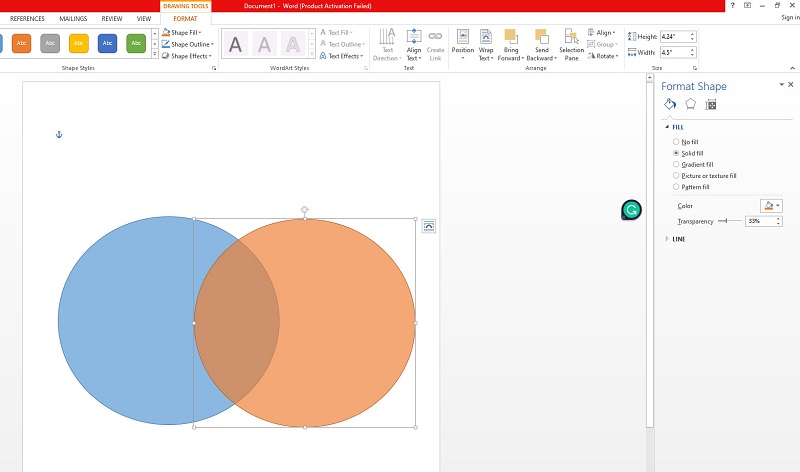
To change the background color from white to the color of the overlapping circle, right-click the text box, and then select Format Shape.
-
In the Format Shape pane, under Fill, select No fill.
-
To delete the lines around the text box, with the text box still selected, click Line in the Format Shape pane, and then select No line.
Notes:
-
To position the text box, click it, and then when the pointer becomes crossed arrows (
), drag the text box to where you want it. -
To format text in the text box, select the text, and then use the formatting options in the Font group on the Home tab.
-
-
 ), drag the text box to where you want it.
In PowerPoint:
-
On the Insert tab, in the Text group, click Text Box.
-
Click and drag in an overlapping circle. Draw the text box the size you want.
-
To add text, click inside the box and type.
-
Click the existing circle that is located closest to where you want to add the new circle.
-
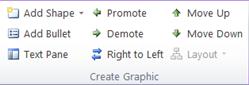
Under SmartArt Tools, on the Design tab, in the Create Graphic group, click the arrow next to Add Shape.
If you don’t see the SmartArt Tools or Design tabs, make sure that you’ve selected the SmartArt graphic. You may need to double-click the SmartArt graphic in order to open the Design tab.
-
Do one of the following:
-
To insert a circle after the selected circle, that will overlap the selected circle, click Add Shape After.
-
To insert a circle before the selected circle, that will overlap the selected circle, click Add Shape Before.
-
Notes:
-
When you want to add a circle to your Venn diagram, experiment with adding the shape before or after the selected circle to get the placement you want for the new circle.
-
To add a circle from the Text pane, click an existing circle, move your pointer before or after the text where you want to add the circle, and then press Enter.
-
To delete a circle from your Venn diagram, click the circle you want to delete, and then press Delete.
-
To move a circle, click the circle, and then drag it to its new location.
-
To move a circle in very small increments, hold down CTRL while you press the arrow keys on your keyboard.
-
Right-click the Venn diagram that you want to change
-
Click a layout option in the Layouts group on the Design tab under SmartArt Tools. When you point to a layout option, your SmartArt graphic changes to show you a preview of how it would look with that layout. Choose the layout that you want.
-
To show overlapping relationships in a sequence, click Linear Venn.
-
To show overlapping relationships with an emphasis on growth or gradation, click Stacked Venn.
-
To show overlapping relationships and the relationship to a central idea, click Radial Venn.
-
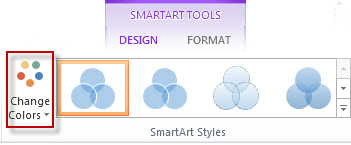
To quickly add a designer-quality look and polish to your SmartArt graphic, you can change the colors of your Venn diagram. You can also add effects, such as glows, soft edges, or 3-D effects.
You can apply color combinations that are derived from the theme colors to the circles in your SmartArt graphic.
Click the SmartArt graphic whose color that you want to change.
-
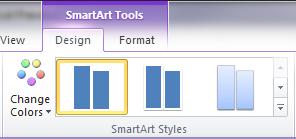
Under SmartArt Tools, on the Design tab, in the SmartArt Styles group, click Change Colors.
If you don’t see the SmartArt Tools or Design tabs, make sure that you’ve selected the SmartArt graphic.
Tip: When you position your pointer over a thumbnail, you can see how the colors affect your SmartArt graphic.
Change the line color or style of a circle’s border
-
In the SmartArt graphic, right-click the border of the circle you want to change, and then click Format Shape.
-
In the Format Shape pane, if necessary, click the arrow next to Line to expose all the options, and then do one of the following:
-
To change the color of the circle’s border, click Color
, and then click the color that you want. -
To change the line style of the circle’s border, select the line styles that you want, such as Transparency, Width, or Dash Type.
-
 , and then click the color that you want.
Change the background color of a circle in your Venn diagram
Click the SmartArt graphic that you want to change.
-
Right-click the border of a circle, and then click Format Shape.
-
In the Format Shape pane, under Fill, click Solid fill.
-
Click Color
, and then click the color that you want.-
To change the background to a color that is not in the theme colors, click More Colors, and then either click the color that you want on the Standard tab or mix your own color on the Custom tab. Custom colors and colors on the Standard tab are not updated if you later change the document theme.
-
To increase the transparency of the shapes in the diagram, move the Transparency slider or enter a number in the box next to the slider. You can vary the percentage of transparency from 0% (fully opaque, the default setting) to 100% (fully transparent).
-
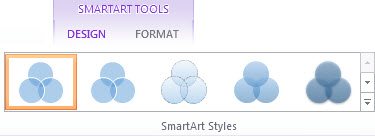
A SmartArt Style is a combination of various effects, such as line style, bevel, or 3-D rotation that you can apply to the circles in your SmartArt graphic to create a unique look.
Click the SmartArt graphic that you want to change.
-
Under SmartArt Tools, on the Design tab, in the SmartArt Styles group, click the SmartArt Style that you want.
To see more SmartArt Styles, click the More button
.
 .
.Note: When you position your pointer over a thumbnail, you can see how the SmartArt Style affects your SmartArt graphic.
Tip: If you’re using PowerPoint 2013 or PowerPoint 2016, you can animate your Venn diagram to emphasize each circle. For more information, see Animate a SmartArt graphic.
See Also
Choose a SmartArt graphic
Learn more about SmartArt Graphics
Add shapes
What do you want to do?
-
On the Insert tab, in the Illustrations group, click SmartArt.
-
In the Choose a SmartArt Graphic gallery, click Relationship, click a Venn diagram layout (such as Basic Venn), and then click OK.
Add text to the main circles
-
Select the SmartArt graphic.
-
Under SmartArt Tools, on the Design tab, in the Create Graphic group, click Text Pane.
If you do not see SmartArt Tools or the Design tab, make sure that you have selected a SmartArt graphic. You may need to double-click the SmartArt graphic to open the Design tab. -
Do one of the following:
-
Click [Text] in the Text pane, and then type your text.
-
Copy text from another location or program, click [Text] in the Text pane, and then paste your text.
-
Click a circle in the SmartArt graphic, and then type your text.
-
In the Text pane, under Type your text here, select a bullet and type your text.
Note: You can also open the Text pane by clicking the control.
Add text to the overlapping portions of the circles
You cannot add text to the overlapping portions of a Venn diagram from the Text pane. Instead, you can insert text boxes and position them over the overlapping areas.
To insert a text box, do the following:
-
On the Insert tab, in the Text group, click Text Box.
-
Drag to draw a text box.
-
Select the text box and type your text.
-
Position the text box over the overlapping area of the circles.
-
Click the SmartArt graphic that you want to add another circle to.
-
Click the existing circle that is located closest to where you want to add the new circle.
-
Under SmartArt Tools, on the Design tab, in the Create Graphic group, click the arrow next to Add Shape.
If you don’t see the SmartArt Tools or Design tabs, make sure that you’ve selected the SmartArt graphic. You may need to double-click the SmartArt graphic in order to open the Design tab.
-
Do one of the following:
-
To insert a circle after the selected circle, that will overlap the selected circle, click Add Shape After.
-
To insert a circle before the selected circle, that will overlap the selected circle, click Add Shape Before.
-
-
When you want to add a circle to your Venn diagram, experiment with adding the shape before or after the selected circle to get the placement you want for the new circle.
-
To add a circle from the Text pane, click an existing circle, move your pointer before or after the text where you want to add the circle, and then press ENTER.
-
To delete a circle from your Venn diagram, click the circle you want to delete, and then press DELETE.
-
To move a circle, click the circle, and then drag it to its new location.
-
To move a circle in very small increments, hold down CTRL while you press the arrow keys on your keyboard.
-
Right-click the Venn diagram that you want to change, and then click Change Layout.
-
In the Choose a SmartArt Graphic dialog box, click Relationship in the left pane, and in the right pane do one of the following:
-
To show overlapping relationships in a sequence, click Linear Venn.
-
To show overlapping relationships with an emphasis on growth or gradation, click Stacked Venn.
-
To show overlapping relationships and the relationship to a central idea, click Radial Venn.
-
Note: You can also change the layout of your SmartArt graphic by clicking a layout option in the Layouts group on the Design tab under SmartArt Tools. When you point to a layout option, your SmartArt graphic changes to show you a preview of how it would look with that layout.
To quickly add a designer-quality look and polish to your SmartArt graphic, you can change the colors of your Venn diagram. You can also add effects, such as glows, soft edges, or 3-D effects.
You can apply color combinations that are derived from the theme colors to the circles in your SmartArt graphic.
Click the SmartArt graphic whose color that you want to change.
-
Under SmartArt Tools, on the Design tab, in the SmartArt Styles group, click Change Colors.
If you don’t see the SmartArt Tools or Design tabs, make sure that you’ve selected the SmartArt graphic.
Tip: When you position your pointer over a thumbnail, you can see how the colors affect your SmartArt graphic.
Change the line color or style of a circle’s border
-
In the SmartArt graphic, right-click the border of the circle you want to change, and then click Format Shape.
-
In the Format Shape dialog box, do one of the following:
-
To change the color of the circle’s border, click Line Color in the left pane, in the Line Color pane, click Color
, and then click the color that you want. -
To change the line style of the circle’s border, click Line Style in the left pane, in the Line Style pane, and then select the line styles that you want.
-
Change the background color of a circle in your Venn diagram
Click the SmartArt graphic that you want to change.
-
Right-click the border of a circle, and then click Format Shape.
-
In the Format Shape dialog box, in the left pane click Fill, and then in the Fill pane click Solid fill.
-
Click Color
, and then click the color that you want.-
To change the background to a color that is not in the theme colors, click More Colors, and then either click the color that you want on the Standard tab or mix your own color on the Custom tab. Custom colors and colors on the Standard tab are not updated if you later change the document theme.
-
To increase the transparency of the shapes in the diagram, move the Transparency slider or enter a number in the box next to the slider. You can vary the percentage of transparency from 0% (fully opaque, the default setting) to 100% (fully transparent).
-
A SmartArt Style is a combination of various effects, such as line style, bevel, or 3-D rotation that you can apply to the circles in your SmartArt graphic to create a unique look.
Click the SmartArt graphic that you want to change.
-
Under SmartArt Tools, on the Design tab, in the SmartArt Styles group, click the SmartArt Style that you want.
To see more SmartArt Styles, click the More button
.
-
When you position your pointer over a thumbnail, you can see how the SmartArt Style affects your SmartArt graphic.
If you’re using PowerPoint 2010, you can animate your Venn diagram to emphasize each circle. For more information about how to animate a SmartArt graphic, see Animate your SmartArt graphic.
-
Click the Venn diagram that you want to animate.
-
On the Animations tab, in the Animation group, click the More button
, and then click the animation that you want. -
To make each circle in the Venn diagram enter in sequence, on the Animations tab, in the Animation group, click Effect Options, and then click One by One.
Note: If you copy a Venn diagram that has an animation applied to it to another slide, the animation is also copied.
See Also
Choose a SmartArt graphic
Диаграммы Венна — это графические представления, которые могут помочь вам сравнить, сопоставить и признать отношения между идеями, продуктами и наборами данных. Диаграммы Венна используют два круга, которые сравнивают и противопоставляют идеи между двумя темами. Кроме того, это может помочь вам решить сложные математические задачи, с которыми вы можете столкнуться. Только несколько инструментов могут помочь вам создать диаграмму Венна на вашем компьютере; Одним из наиболее часто используемых приложений для создания диаграмм Венна является Microsoft Word. Поэтому, если вы хотите изучить шаги по как сделать диаграмму венна в ворде, внимательно прочитайте этот пост.

- Часть 1. Как сделать диаграмму Венна с помощью Microsoft Word
- Часть 2. Плюсы и минусы использования Word для создания диаграммы Венна
- Часть 3. Бонус: бесплатный онлайн-конструктор диаграмм
- Часть 4. Часто задаваемые вопросы о том, как сделать диаграмму Венна в Word
Часть 1. Как сделать диаграмму Венна с помощью Microsoft Word
Microsoft Word — самый популярный коммерческий текстовый процессор, которым пользуются многие. Microsoft разрабатывает Microsoft Word, компонент Microsoft Office, но его можно приобрести как отдельный продукт. Кроме того, поскольку разработчик продолжает обновлять его, в него добавлено множество функций. С помощью Microsoft Word вы можете создавать различные диаграммы и добавлять изображения со своего устройства или из Интернета; вы даже можете добавить скриншоты и диаграммы. Есть и другие функции, которые вы можете попробовать в Microsoft Word. Новичкам не составит труда использовать это приложение, потому что оно имеет очень простой пользовательский интерфейс.
Кроме того, Microsoft Word имеет встроенный словарь для проверки орфографии; слова с ошибками обозначаются красной линией под ними. Кроме того, он предлагает функции на уровне текста, такие как жирный шрифт, подчеркивание, курсив и зачеркивание. Microsoft предлагает множество функций, которые могут помочь вам создать лучший документ, который вы когда-либо могли создать.
И это не заканчивается там. Знаете ли вы, что вы также можете использовать Microsoft Word для создания диаграммы Венна? Да, Вы прочли это правильно. С Microsoft Word вы можете легко и значительно создавать диаграммы Венна.
Как вручную создать диаграмму Венна в Word
1
Если Microsoft Word еще не установлен на вашем рабочем столе, загрузите его и немедленно запустите приложение. И в главном пользовательском интерфейсе программного обеспечения перейдите к Вставка > Иллюстрации > Фигуры.
2
И тогда появится выпадающее меню, где вы можете выбрать формы а также линии которые вы можете использовать на диаграмме Венна. Выберите овал придайте форму и нарисуйте круг на странице. Скопируйте и вставьте первый круг, который вы создали, чтобы они были одинакового размера.
3
Если круги имеют цвет заливки, вам нужно уменьшить непрозрачность, чтобы текст, который вы будете вставлять, все еще был виден. Чтобы уменьшить непрозрачность, щелкните правой кнопкой мыши фигуру и Формат Форма вариант. На Наполнять панель, настройте прозрачность в соответствии со своими предпочтениями.
4
Добавьте текст с помощью текстового поля, чтобы Вставка > Текст > Текстовое поле. Введите текст, который нужно включить, затем отрегулируйте их положение.
5
Когда вы закончите создание диаграммы Венна, сохраните документ.
Как сделать диаграмму Венна в Word, используя графику SmartArt
1
В Microsoft Word перейдите к Вставлять вкладка Затем, под Иллюстрации панель, перейти к СмартАрт, появится всплывающее окно.
2
И во всплывающем окне перейдите к Отношения, Выбрать Базовый Венни нажмите ХОРОШО.
3
Базовая диаграмма Венна состоит из трех круговой диаграммы Венна. Удалите другой круг, чтобы получить диаграмму Венна из двух кругов. Затем дважды щелкните слово Текст изменить текст. Или вы можете использовать текстовую панель, чтобы изменить текст.
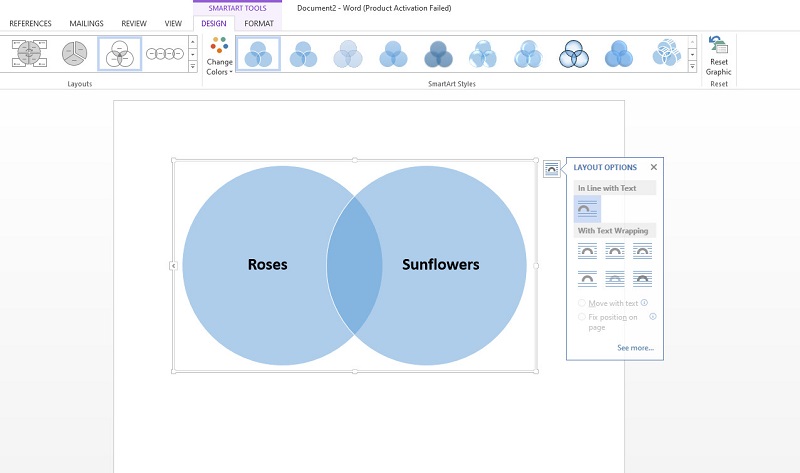
4
Затем выберите нужный рисунок и нажмите кнопку «Добавить фигуру», чтобы увеличить диаграмму Венна. И когда вы закончите изменять свою диаграмму Венна, перейдите к Файл и сохраните документ.
Как вставить диаграмму Венна в Word
Если у вас есть готовая диаграмма Венна, сохраненная на вашем компьютере, вы можете использовать ее в создаваемом документе.
1
Перейти к Файли создайте новый пустой документ.
2
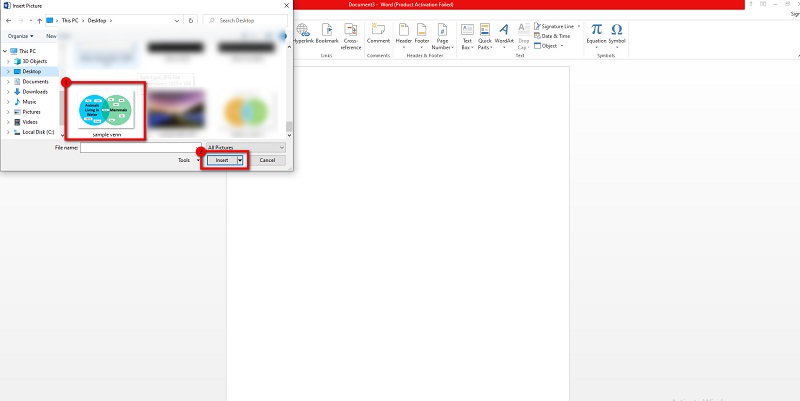
Затем нажмите «Вставить», затем в разделе «Иллюстрации» выберите Картинки. Вы также можете искать диаграммы Венна, которые хотите использовать, в Интернете, щелкнув Онлайн картинки.
3
Найдите изображение диаграммы Венна, которое вы хотите вставить из ваших файлов, затем нажмите Открытым.
Часть 2. Плюсы и минусы использования Word для создания диаграммы Венна
ПЛЮСЫ
- Вы можете легко построить диаграмму Венна.
- Вы можете изменить цвет диаграммы Венна.
- Легко сохранить и поделиться.
- В нем есть готовые схемы, которые вы можете использовать.
МИНУСЫ
- Перемещение текста и изображений в Word довольно сложно.
- Вам нужно вставить текстовые поля, чтобы вставить текст.
Часть 3. Бонус: бесплатный онлайн-конструктор диаграмм
Если вам нужна альтернатива Microsoft Word для создания диаграмм Венна, у нас есть решение для вас.
MindOnMap — один из самых известных онлайн-конструкторов диаграмм, который можно использовать для создания отличных диаграмм Венна. Это приложение для создания диаграмм может помочь вам создать диаграмму Венна, используя его блок-схему. Кроме того, в нем есть готовые шаблоны, которые можно использовать для создания диаграмм. И если вы хотите добавить изюминку в проект, который вы создаете, вы можете добавить в свои диаграммы уникальные значки, символы и смайлики. Кроме того, это удобное приложение для начинающих, поскольку оно имеет простой в использовании пользовательский интерфейс. С помощью MindOnMap вы также можете вставлять изображения или ссылки, которые можно использовать в своем проекте. Это онлайн-приложение также поддерживает стандартные форматы файлов, такие как PNG, JPEG, SVG, документ Word и PDF. Следуйте приведенным ниже инструкциям, чтобы узнать, как создать диаграмму Венна с помощью MindOnMap.
Как создать диаграмму Венна с помощью MindOnMap
1
Для начала откройте браузер и найдите MindOnMap в поле поиска. И в главном интерфейсе нажмите кнопку Создайте свою ментальную карту кнопка.

2
Затем нажмите Новый и выберите Блок-схема возможность создать свою диаграмму Венна.

3
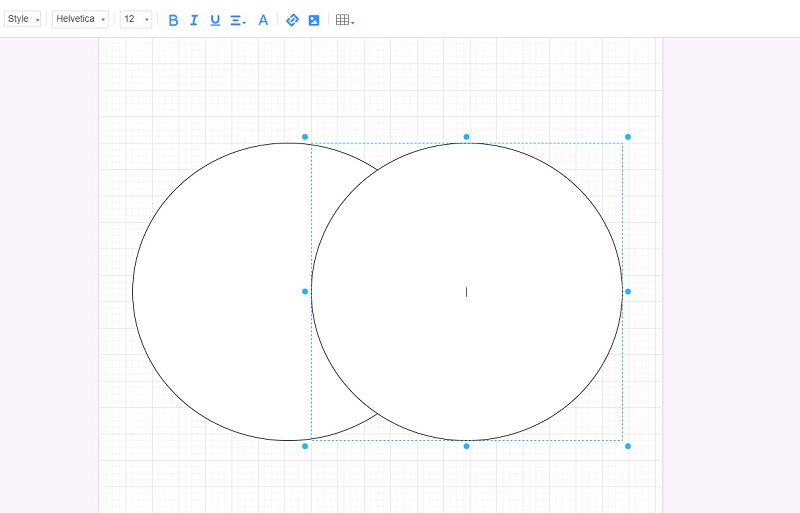
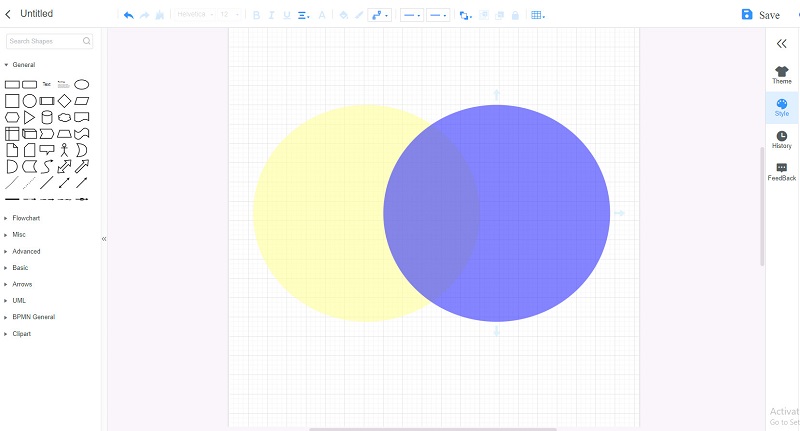
На Блок-схема вариант, нажмите кнопку Эллипс форма под Общий панель. Нарисуйте первый круг, скопируйте и вставьте его, чтобы у ваших двух кругов был точный размер.
4
Затем выберите цвет, который вам нравится для ваших кругов в Наполнять вариант. Затем выберите оба круга и перейдите к стилю. Изменить Непрозрачность на ваше усмотрение.
5
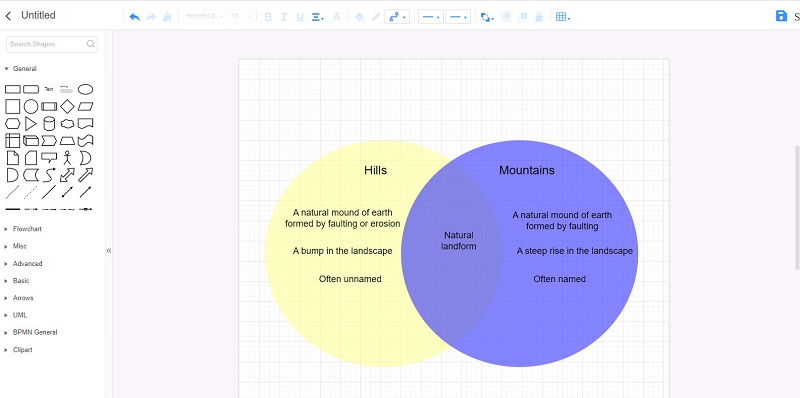
Вставьте текст на свой Диаграмма Венна нажав на Текст опция под символами.
6
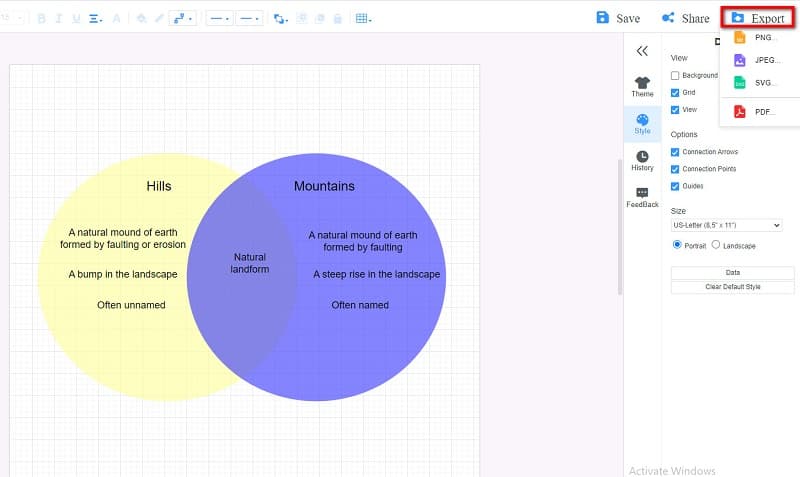
Экспортируйте результат, щелкнув значок Экспорт кнопку, затем выберите нужный формат.
Часть 4. Часто задаваемые вопросы о том, как сделать диаграмму Венна в Word
Является ли Microsoft Word бесплатным?
Да. Microsoft Word можно бесплатно загрузить в виде приложения для настольных компьютеров на Windows или Mac. Однако Microsoft Word не является полностью бесплатной программой. Вам необходимо приобрести его, чтобы пользоваться всеми функциями.
Есть ли шаблон диаграммы в Word?
На панели «Иллюстрации» перейдите к графическому элементу SmartArt. Там вы найдете множество диаграмм, которые вы можете использовать.
Является ли Microsoft Word лучшей программой Microsoft для создания диаграмм Венна?
Microsoft Word — самая популярная программа Microsoft, когда речь заходит о создание диаграмм Венна потому что у него есть готовые шаблоны, и создавать диаграммы Венна с помощью Word проще, чем с другими приложениями Microsoft.
Вывод
Теперь, когда вы знаете всю необходимую информацию о том, как легко нарисовать диаграмму Венна в Word, теперь вы можете решить это самостоятельно. Но если вы предпочитаете использовать стандартное средство для создания диаграмм Венна, которым сейчас пользуются многие профессионалы, откройте MindOnMap нажав на эту ссылку.
-
1
Double-click your Word document to open it in Word.
-
2
Click Insert. It’s one of the tabs at the top of the screen.
Advertisement
-
3
Click SmartArt. It’s in the toolbar. This opens the SmartArt dialog box.
-
4
Click Relationships. It’s in the left column.
-
5
Scroll down and click the Basic Venn icon. These icons are not labeled until you hover your mouse over them. The Basic Venn icon is on the second-to-last row and looks like three overlapping circles.
-
6
Click OK. You should now see a Venn diagram in your document.
-
7
Click [Text] in each circle to enter your own details. This fills in the major categories of the diagram.
-
8
Draw a text box where you want to enter an overlapping value.
- To enter text box mode, click the Insert menu, select Text Box, then Draw Text Box.
- Click and drag the mouse cursor over any area where the circles overlap. This draws a box.
- Let go of the mouse cursor once your box is placed.
-
9
Right-click the outline of the text box. Make sure your mouse cursor is right on the line that surrounds the text box. A pop-up menu will appear.
-
10
Click Format shape. This opens the Format Text Effects dialog.
-
11
Select No Fill under “Fill.” This removes the background of the text box.
-
12
Select No Line under “Line.” This removes the outline around the text box.
-
13
Click the text box and type your description.
-
14
Click another area of the Venn diagram (outside of the text box). This adds two new options to the toolbar at the top of the screen—Design and Format.
-
15
Click Design and/or Format to change your diagram’s look. Both options are at the top of the screen. Now that you’ve built your diagram, you can customize it with colors, gradient/fill levels, and accents.
- Once you’ve perfected your diagram, be sure to save your document by clicking File and then Save.


Advertisement
Add New Question
-
Question
How do I type text on the top of a venn diagram?

Corina Mendible
Community Answer
You can create a text box. Select «Insert» from the menu list and select «Text box.» Drag and place it in the desired location.
Ask a Question
200 characters left
Include your email address to get a message when this question is answered.
Submit
Advertisement
Thanks for submitting a tip for review!
About This Article
Thanks to all authors for creating a page that has been read 97,930 times.
Is this article up to date?

Back when there aren’t a lot of graphics-making apps, people used Microsoft Word to make graphs and diagrams, including the Venn chart, more popularly known as the Venn Diagram. It’s still true for the Office program today.
But is it still the best way to make a Venn Diagram? Or maybe it’s time to go for an app that fits the task better, such as the Venngage Venn Diagram maker? Let’s answer those questions later. For now, we’ll teach you how to make a Venn Diagram in Word.
Click to jump ahead:
- 5 steps to make a Venn diagram in Word
- An alternative way to make a Word Venn diagram
- Disadvantages of making a Venn diagram in Word
- Why use Venngage instead of Word?
- How to make a Venn Diagram in Venngage
- Venn diagram examples
- FAQs about Venn diagrams
5 steps to make a Venn diagram in Word
To make a basic Venn Diagram in Microsoft Office’s document maker, there are 5 steps that you have to follow in order.
Select a title for it
The first thing you should do is write a title for your own Venn diagram. This is because the title of a diagram is usually at the top, and it can be tough to move texts around shapes and images in Word.
Bring out the “shapes library” from the dropdown menu
Click on the Insert tab to bring out the Shapes library. From it, scroll down and look for the circle shape. The number of circles you’ll draw depends on the number of categories you’ll be comparing.
Arrange “shapes” and “text” properly to form the diagram
Draw overlapping circles on your page to create the Venn Diagram’s basic layout. You already know this but just a quick reminder: the area where they overlap is where you’ll place the shared trait or items of the categories being compared in the diagram.
Another thing you should know is that shapes are opaque by default. This means you won’t be able to make a much-needed overlapping area for the diagram unless you make it transparent. You can do this by changing the shape style or right-clicking on the shape. After that, select Format Shape. On the Format Shape pane, edit the fill style by increasing the transparency.
Use the text box to add text
While you can add text inside the circles, it will automatically be in paragraph format, so it will be difficult to group various items together. Instead, you’ll have to draw text boxes.
With a text box, you can put items in the circles separately, and you can put them anywhere within the circle, including the overlapping portions.
Save as a Word document
Once you’re done, save your work as a Word document. This way, you can easily edit it and make changes in the future.

Return to Table of Contents
An alternative way to make a Word Venn diagram
On the other hand, there is an easier way to make a Venn Diagram on the app, and that is to use SmartArt tools. Go to the Insert tab, click SmartArt Pull it up, and on the left-hand list in the dialog box, click on the Relationship option, and choose Basic Venn.
Whether it is better than the old-fashioned way, however, is arguable. While it is a lot easier, using individual shapes to create a Venn diagram gives more freedom on what the final result might look like.

Return to Table of Contents
Disadvantages of making a Venn diagram in Word
It’s not exactly hard to make a Venn diagram in Microsoft Word, but in case you haven’t noticed, there are many cons to using this app. First, moving text around shapes and images in Word isn’t a walk in the park, so formatting your Venn diagram can be a pain.
Second is the formatting of the text that comes with the circles, which means you’ll have to insert text boxes. Unless it’s meticulously formatted, your diagram will look messy. Lastly, the circles are pre-made and come in different sizes, so you might not be able to get the exact size you want for your diagram.
Return to Table of Contents
Why use Venngage instead of Word?

Venngage is a way simpler tool than Microsoft Word. It offers more shapes, fonts, and customization options, so you can create a professional-looking diagram in minutes. Plus, it’s easy to use, very intuitive and even a beginner or a non-designer user can be a pro in minutes.
Venngage also has a business feature called My Brand Kit that enables you to add your company’s logo, color palette, and fonts to all your designs with a single click.
For example, you can make your Venn diagram template reflect your brand design by uploading your brand logo, fonts, and color palette using Venngage’s branding feature.
Not only are Venngage templates free to use and professionally designed, but they are also tailored for various use cases and industries to fit your exact needs and requirements.

A business account also includes the real-time collaboration feature, so you can invite members of your team to work simultaneously on a project.
Venngage allows you to share your Venn online as well as download it as a PNG or PDF file. That way, your design will always be presentation-ready.
So if you’re looking for a platform that can help you easily create beautiful Venn diagrams, and other types of compelling visuals, Venngage is the tool for you.
Return to Table of Contents
How to make a Venn Diagram in Venngage

To make a Venn diagram in Venngage, start by creating a new document and selecting the Venn diagram template. Then, add the circles you need for your diagram by clicking on the “+” button.
Next, add data and text to your circles by clicking on the text box icon. You can then type the text you want to appear in your diagram.
Finally, customize the look of your diagram by editing the colors and fonts. When you’re done, click on the “Share” button to export your diagram as a PDF, JPG, or PNG file. You can also share your diagram on social media or embed it on your website.
Return to Table of Contents
Venn diagram examples
If you still aren’t convinced that you should try Venngage, maybe the Venn diagram templates from the app should. A good example with rather timely content would be this one. Both of its circles have subtle and classy pastel colors, and its font is a simple yet tasteful sans serif.
Also, on top of the texts, you’ll notice icons that perfectly represent it. Venngage has a wide variety of these icons, so feel free to use them if they fit the kind of Venn diagram you’re making.

This template is proof that if you want a more elaborate Venn Diagram, then Venngage is still a good choice. It is better than many other alternatives if you need to make more
As you can see, this Venn Diagram doesn’t just have four circles, but also a ring around it that shows the significance of these circles and the items in them.

With the help of stylized icons, you can help give your Venn diagram the same feel as that of a cute illustration. For the first one, the transportation icons and clouds make the Venn diagram seem like a kid-friendly infographic.

The same is true with this Venn diagram for durian. As you can see, you can get even more creative with how you make a Venn diagram. This time, it’s a collection of mini-recipes, and you can then use the overlaps to show their commonalities with one another.
Learn more about how businesses use Venn diagrams by reading this article and get more inspiration from it.

This template shows that with Venngage, you can make presentable and professional-looking Venn diagrams for corporate settings. Plus, with this template, you can insert your own company’s images and logos.

Return to Table of Contents
FAQs about Venn diagrams
Does Word have Venn diagram templates?
While not a template, SmartArt tools in MS Word allow you to create a Venn Diagram with relative ease. However, because of the lack of customization options, you’re better off making a Venn Diagram using shapes, or better yet, using a graphic maker like Venngage.
Can you make overlapping shapes in Word?
It is possible to make overlapping shapes in Word, but the area where they overlap will be blotted out by the shape on top of it. To fix that, you’ll have to set the Shape Style to transparent.
Where can you make a Venn diagram?
You can make a Venn diagram in Venngage, Word, or any other graphic design software. However, if you’re looking for an easy-to-use and versatile tool, we recommend using Venngage.
Return to Table of Contents
Choose Venngage Over Word
In conclusion, Word is still a decent way to make a Venn diagram, but it’s not as good as using an app like Venngage. Venngage offers an intuitive interface, lots of shapes and fonts, and customization options, so you can create a professional-looking diagram in minutes. Plus, it’s easy to use, even for beginners. So if you’re looking for an app that can help you easily create beautiful Venn diagrams, Venngage is the tool for you.
Create a Venn diagram
- On the Insert tab, in the Illustrations group, click SmartArt.
- In the Choose a SmartArt Graphic gallery, click Relationship, click a Venn diagram layout (such as Basic Venn), and then click OK.
Contents
- 1 How do you draw a Venn diagram?
- 2 Does Microsoft Word have a Venn diagram template?
- 3 How do you overlap shapes in Word?
- 4 How do you make a Venn diagram online?
- 5 Can you create a Venn diagram in Google Docs?
- 6 How do you create a diagram in Word?
- 7 Is Venn diagram a graphic organizer?
- 8 What is a Venn diagram template?
- 9 How do you make comparisons?
- 10 How do you make a comparison chart?
- 11 How do you use a Venn diagram to compare and contrast?
- 12 How do you solve a possibility case in syllogism?
- 13 How do you know when a Venn diagram argument is valid?
- 14 Is syllogism and Venn diagram the same?
- 15 What is AUB Venn diagram?
- 16 How do I create a math diagram in Word?
- 17 How do I make a circle diagram in Word?
How do you draw a Venn diagram?
How to Make a Venn Diagram
- The first step to creating a Venn diagram is deciding what to compare. Place a descriptive title at the top of the page.
- Create the diagram. Make a circle for each of the subjects.
- Label each circle.
- Enter the differences.
- Enter the similarities.
Does Microsoft Word have a Venn diagram template?
In Word, go to Insert > Illustrations > Shapes. A drop-down menu will appear. Add shapes and lines from the shape library to build your Venn diagram.
How do you overlap shapes in Word?
Merge shapes
- Select the shapes to merge. Press and hold Shift to select multiple shapes. The Shape Format tab appears.
- On the Shape Format tab, click Merge Shapes, and then pick the option you want. The order in which you select the shapes to merge may affect the options shown to you.
How do you make a Venn diagram online?
How to design a Venn diagram with the online editor, EDIT.org
- Click on any image in this article.
- Select a diagram to customize.
- Edit details such as colors, text, font, icons…
- Save changes online.
- Download your custom Venn diagram in JPG, PNG, or PDF.
Can you create a Venn diagram in Google Docs?
Open a Google Doc. Select Insert > Drawing > New. Use the shape icon to add circles, and add text boxes to complete your Venn diagram. Click “Save and Close.”
How do you create a diagram in Word?
To create a diagram in a document
- Position the cursor in the document where you want to insert the diagram.
- Do either of the following to open the Choose a SmartArt Graphic dialog box:
- In the left pane, select a type of diagram.
- Click OK to insert the selected diagram at the cursor.
Is Venn diagram a graphic organizer?
A Venn diagram is a type of graphic organiser. Graphic organisers are a way of organising complex relationships visually. They allow abstract ideas to be more visible.
What is a Venn diagram template?
Originally created by John Venn in 1880, Venn diagrams were invented as a way of picturing relationships between different groups of information.A Venn diagram uses overlapping circles or other shapes to illustrate the logical relationships between two or more sets of items.
How do you make comparisons?
Adjectives and adverbs can be used to make comparisons. The comparative form is used to compare two people, ideas, or things. The superlative form with the word “the” is used to compare three or more. Comparatives and superlatives are often used in writing to hedge or boost language.
How do you make a comparison chart?
How to make a comparison chart
- Create a new Canva account to get started with your own comparison chart design.
- Choose from our library of professionally created templates.
- Upload your own photos or choose from over 1 million stock images.
- Fix your images, add stunning filters and edit text.
- Save and share.
How do you use a Venn diagram to compare and contrast?
When using a Venn diagram to write a compare and contrast essay, first draw two large circles. These two circles should overlap each other. Assign a title to each circle that represents each idea you are comparing. In the overlapping area, write all of the things that the two ideas, people, or objects have in common.
How do you solve a possibility case in syllogism?
If the conclusion is in “Possibility” case then these rules must be applied:
- “NO Conclusion” means “Any Possibility is true”.
- “Only A is B” means All B are A.
- “At least Some A are B” means “Some A are B”.
- Words like Can be / May be denotes Possibility. For eg. All A can be B. means All A are B is a possibility.
How do you know when a Venn diagram argument is valid?
To sum up: To test a syllogism for validity, Venn diagram the premises. Inspect the diagram. If the diagram already represents the conclusion, then the argument is valid. If a representation of the conclusion is absent, the argument is invalid.
Is syllogism and Venn diagram the same?
Abstract: The Venn Diagram technique is shown for typical as well as unusual syllogisms.A syllogism is a two premiss argument having three terms, each of which is used twice in the argument. B. Each term ( major, minor, and middle terms) can be represented by a circle.
What is AUB Venn diagram?
Let A and B be the two sets.The union of A and B is the set of all those elements which belong either to A or to B or both A and B. Now we will use the notation A U B (which is read as ‘A union B’) to denote the union of set A and set B. Thus, A U B = {x : x ∈ A or x ∈ B}.
How do I create a math diagram in Word?
Add a drawing to a document
- Click in your document where you want to create the drawing.
- On the Insert tab, in the Illustrations group, click Shapes.
- When you find the shape you want to insert, double-click to insert it automatically, or click and drag to draw it in your document.
How do I make a circle diagram in Word?
Draw an oval or circle
- On the Insert tab, click Shapes.
- Under Basic Shapes, click Oval.
- Click where you want the oval to start, and drag to draw the shape.
- To draw a circle, press Shift while you drag. Notes: You can change the look of your circle or curve by adding a shape fill or effect or changing the border.