
I’ve received a large number of questions on how to command other programs with VBA through Excel. In this post, we will walk through how to copy a specified cell range and paste it into a brand new PowerPoint presentation. This might seem like a task that would be much more efficient to carry out manually. However, when you need to put together a presentation with 50+ Excel images, having a VBA macro do all the heavy lifting is much faster! Let me first show you the VBA code and then I will highlight some of the main sections that are most important.
Sub ExcelRangeToPowerPoint()
‘PURPOSE: Copy/Paste An Excel Range Into a New PowerPoint Presentation
‘SOURCE: www.TheSpreadsheetGuru.com
Dim rng As Range
Dim PowerPointApp As Object
Dim myPresentation As Object
Dim mySlide As Object
Dim myShape As Object
‘Copy Range from Excel
Set rng = ThisWorkbook.ActiveSheet.Range(«A1:C12»)
‘Create an Instance of PowerPoint
On Error Resume Next
‘Is PowerPoint already opened?
Set PowerPointApp = GetObject(class:=»PowerPoint.Application»)
‘Clear the error between errors
Err.Clear
‘If PowerPoint is not already open then open PowerPoint
If PowerPointApp Is Nothing Then Set PowerPointApp = CreateObject(class:=»PowerPoint.Application»)
‘Handle if the PowerPoint Application is not found
If Err.Number = 429 Then
MsgBox «PowerPoint could not be found, aborting.»
Exit Sub
End If
On Error GoTo 0
‘Optimize Code
Application.ScreenUpdating = False
‘Create a New Presentation
Set myPresentation = PowerPointApp.Presentations.Add
‘Add a slide to the Presentation
Set mySlide = myPresentation.Slides.Add(1, 11) ’11 = ppLayoutTitleOnly
‘Copy Excel Range
rng.Copy
‘Paste to PowerPoint and position
mySlide.Shapes.PasteSpecial DataType:=2 ‘2 = ppPasteEnhancedMetafile
Set myShape = mySlide.Shapes(mySlide.Shapes.Count)
‘Set position:
myShape.Left = 66
myShape.Top = 152
‘Make PowerPoint Visible and Active
PowerPointApp.Visible = True
PowerPointApp.Activate
‘Clear The Clipboard
Application.CutCopyMode = False
End Sub
Teaching Excel The PowerPoint Language
In order to control PowerPoint from inside Excel’s Visual Basic Editor, we need to teach Excel how to speak in PowerPoint’s terms. PowerPoint uses a vocabulary containing terms such as «Slide» and «Presentation» that simply do not exist in Excel’s own code language. You can learn more about this topic by reading my post Teaching Excel To Speak PowerPoint. In order to activate PowerPoint’s object library, simply click the Tools menu in the Visual Basic Editor and select Reference. Then make sure the reference Microsoft Office PowerPoint 12.0 Object Library is checked (the version number may verify, for example in Office 2016 the reference would be Office PowerPoint 16.0 Object Library). In the below image, I show you exactly how to do this and prove afterward that Excel now knows PowerPoint lingo!
UPDATE: I have updated the code in this article so you do not need to do this step, however IntelliSense for any PowerPoint objects in the Visual Basic Editor will not work. This is not that big of a deal unless you need coding direction when adding additional PowerPoint automation to your VBA macro.
In this part of the code, we are determining if Microsoft PowerPoint is open or not. If PowerPoint is already open, we can set a variable equal to the entire program by using GetObject. If PowerPoint is not currently running we can use CreateObject to run an instance of PowerPoint and then set a variable equal to that specific instance of PowerPoint.
When using CreateObject, the target application will start running but it is not visible on the screen. Therefore we need to turn the Visible setting on (equal to true). Also, VBA with PowerPoint is a little bit different than with Excel in that it is much more dependent on its window showing on the screen. Therefore a second command must be written to Activate PowerPoint.
Copy From Excel, Paste Onto Slide
Now that you have a new presentation and a new slide, you can command Excel to paste your range into PowerPoint. Near the beginning of the code, there was a line that allowed you to specify the exact range you wanted to copy. The variable rng was used to remember this range and to allow you to reference the range later on in the code.
Guru Tip: It is a good idea to place code that may need to be manually changed at some point in the future near the beginning of the subroutine. This prevents you from having to scroll through your code and pinpoint the exact place where you spelled out which range you wanted to copy or which worksheet you wanted to pull data from. This can save you a bunch of time and prevent confusion!
Notice how we set a variable equal to the newly pasted item. This is important because it allows you to modify the picture after it has been placed into PowerPoint. In the example code, I chose to change the picture position by setting the Left and Top dimensions. You could also choose to resize the image, add a shadow, or apply any other modification you would typically do manually inside of PowerPoint.
You have now reached the end of the macro and successfully pasted in a range from Excel into a PowerPoint presentation!
Learn What VBA Can Do With PowerPoint
For the longest time, I had no idea I could use VBA with PowerPoint. I thought VBA was strictly an Excel thing. It was actually through an online VBA course that I was shown how to control PowerPoint & Word with VBA commands. It’s unfortunate that there is very little documentation out on the web concerning VBA outside of Excel. It is one of the major contributors in personally deciding to create this site and I hope to compile a bunch of resources for you in these areas. The best place to get your feet wet with VBA for PowerPoint is to hop on over to the PowerPoint Code Vault. This is where I post pre-written code and it serves as a great guide on how to write VBA for PowerPoint.
About The Author
Hey there! I’m Chris and I run TheSpreadsheetGuru website in my spare time. By day, I’m actually a finance professional who relies on Microsoft Excel quite heavily in the corporate world. I love taking the things I learn in the “real world” and sharing them with everyone here on this site so that you too can become a spreadsheet guru at your company.
Through my years in the corporate world, I’ve been able to pick up on opportunities to make working with Excel better and have built a variety of Excel add-ins, from inserting tickmark symbols to automating copy/pasting from Excel to PowerPoint. If you’d like to keep up to date with the latest Excel news and directly get emailed the most meaningful Excel tips I’ve learned over the years, you can sign up for my free newsletters. I hope I was able to provide you with some value today and I hope to see you back here soon!
— Chris
So far in this series about using VBA to control other Office applications, we have looked at the basics of controlling other office applications and specifically how to create macros to control Word from within Excel. Our approach for creating macros to control Word was using the Macro Recorder. We record very short actions, copy and paste the code into the Excel VBA Editor, then adapt the code to include the references to the Word Application. Slowly, action by action we build up our Macro using recorded code. It would be logical to think we could use the principles we learned for Word and apply them to PowerPoint.
But, there is one big problem to using this approach with PowerPoint: PowerPoint does not have a Macro Recorder. We can use VBA code in PowerPoint, but there is no Macro Recorder to create it. As a result, we cannot record PowerPoint VBA code to copy into our Excel Macro.
But the lack of PowerPoint’s Macro Recorder is not going to stop us. If we want to control PowerPoint from within Excel we just need to find a different approach. Here are the three methods we will consider to obtain valid PowerPoint VBA code.
- The beauty of the Object Model (how to use Excel code to control PowerPoint)
- Taking code from the internet
- Using the Object Browser and IntelliSense to help write the code
However, before we get there we need to enable the Developer Ribbon in PowerPoint. This is so we can check the code works before moving it into Excel.
Enable the PowerPoint Developer Ribbon
If you have enabled the Excel Developer menu it is the same process in PowerPoint.
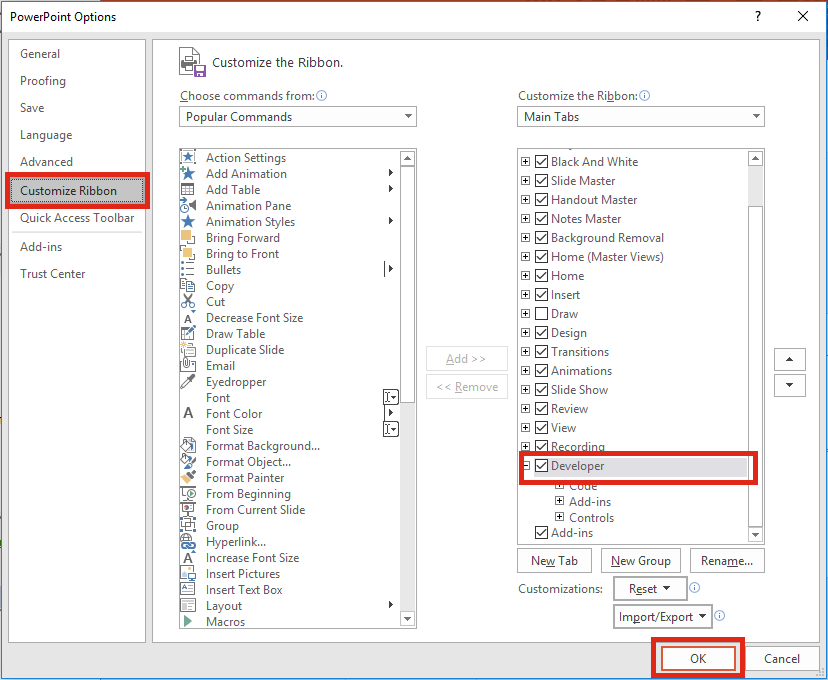
In PowerPoint: File -> Options -> Customize Ribbon
Then tick the Developer Ribbon option then click OK.
The beauty of the Object Model
The object model is the underlying structure of all the objects within Excel. Within VBA, a cell is an object, a chart is an object, a drawn shape is an object. Each of these objects has methods (the actions we can do to the objects – e.g. adding or deleting) and properties (the attributes of the objects – e.g. it’s height or width). The Object Model to control objects in Excel is similar to the Object Model in PowerPoint.
Here is some recorded Excel VBA code to create a shape and color it red.
ActiveSheet.Shapes.AddShape(msoShapeRectangle, 50, 50, 50, 50).Select
With Selection.ShapeRange.Fill
    .Visible = msoTrue
    .ForeColor.RGB = RGB(255, 0, 0)
    .Transparency = 0
    .Solid
End With
Here is some Powerpoint VBA code to create a shape and color it red (using the Excel VBA Code as start point).
Dim myShape As Shape
Set myShape = ActiveWindow.View.Slide.Shapes.AddShape(msoShapeRectangle, 50, 50, 50, 50)

With myShape.Fill
    .Visible = msoTrue
    .ForeColor.RGB = RGB(255, 0, 0)
    .Transparency = 0
    .Solid
End With
In the code below I have highlighted in red the PowerPoint code which is exactly the same as the Excel VBA code.
Dim myShape As Shape
Set myShape = ActiveWindow.View.Slide.Shapes.AddShape(msoShapeRectangle, 50, 50, 50, 50)

With myShape.Fill
    .Visible = msoTrue
    .ForeColor.RGB = RGB(255, 0, 0)
    .Transparency = 0
    .Solid
End With
Did you notice that most of the code was the same? The key differences were how we referred to the application, and the presentation. In Excel we might use “ActiveSheet” to refer to the current worksheet, but in PowerPoint we might use “ActiveWindow.View.Slide“. Once we know this we can adapt code we have recorded in Excel. We can change the references to the PowerPoint Object Model and the code will work.
Before you get too excited . . . this isn’t guaranteed to work with all objects. Just because something works in Excel it does not mean it will work perfectly in PowerPoint. But it is a method to try.
Using Early Binding, our code could be adapted as follows – changes from the code directly above colored in red.
Dim pptApp As PowerPoint.Application
Set pptApp = New PowerPoint.Application

Dim myShape As Object
Set myShape = pptApp.ActiveWindow.View.Slide.Shapes. _
AddShape(msoShapeRectangle, 50, 50, 50, 50)

With myShape.Fill
    .Visible = msoTrue
    .ForeColor.RGB = RGB(255, 0, 0)
    .Transparency = 0
    .Solid
End With
With just a few carefully thought out changes to the Excel code we can now control PowerPoint from within Excel. The changes from the PowerPoint code are:
- Reference to the PowerPoint application now included
- All Object variables (such as shapes) must be created as Object in the Dim statement
Taking code from the internet
You have the option to take code straight from the internet – certainly not a bad idea. The individuals who run websites which share code want you to learn by using that code, so make the most of it.
If you really want to understand what the code means that I recommend you follow the 1 golden rule:
If you want to copy code that you do not understand you must type it out yourself – do not just copy and paste.
There is not as much PowerPoint VBA code out there on the internet as Excel VBA code, but it is there. Once you understand the Object Model it is reasonably straightforward.
PowerPoint VBA reference sources:
- Excel Off the Grid – PowerPoint VBA Library
- The Spreadsheet Guru
- Microsoft Developer Network
- Office Tips
- PPTAlchemy
Using the Object Browser and IntelliSense to help write the code
The Object Browser is the library of objects in VBA. To view the Object Browser click View -> Object Browser (or shortcut F2) from within the Visual Basic Editor. The screenshot below shows the Object Browser window.
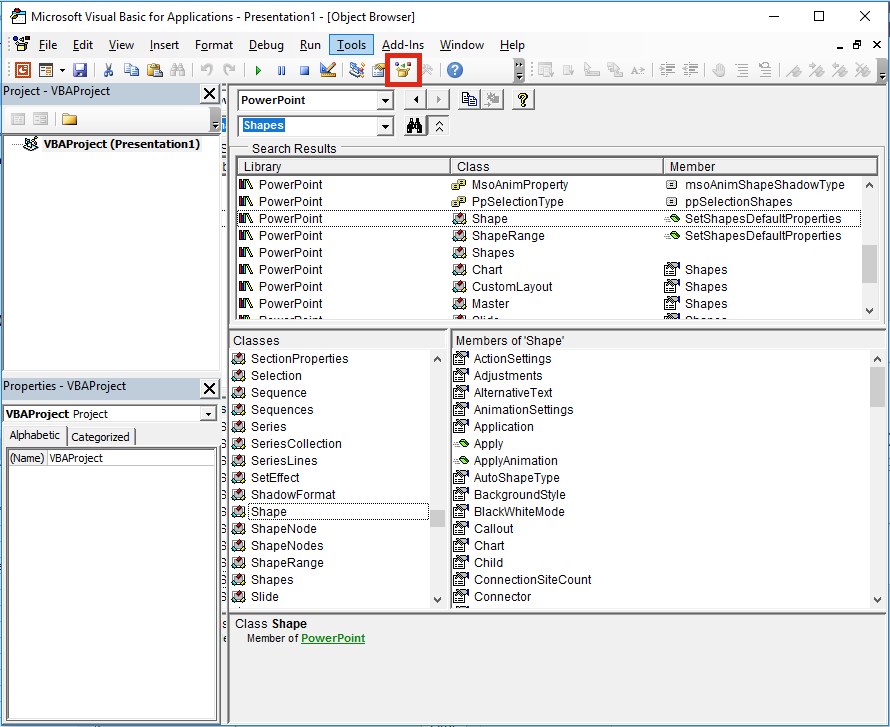
From within the Object Browser it is possible to search for the name of any object. The Search Results window shows all the places in the object model where that object exists. The Members window shows all the objects, methods and properties available for the object.
IntelliSense is the feature which shows the small boxes as you type VBA code (see image below).
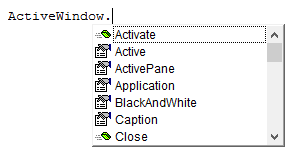
If we have a piece of code, and we are not sure what could come next then just scroll through the IntelliSense options (these are the same options as shown within the Object Browser). If it’s not in the IntelliSense list then it’s not viable code.
Conclusion
So, there we have it. 3 ways to write valid PowerPoint VBA code. None of this is straightforward, so when you stumble across an issue, Google is definitely your best friend. Chances are that somebody else has had the same problem before you.

About the author
Hey, I’m Mark, and I run Excel Off The Grid.
My parents tell me that at the age of 7 I declared I was going to become a qualified accountant. I was either psychic or had no imagination, as that is exactly what happened. However, it wasn’t until I was 35 that my journey really began.
In 2015, I started a new job, for which I was regularly working after 10pm. As a result, I rarely saw my children during the week. So, I started searching for the secrets to automating Excel. I discovered that by building a small number of simple tools, I could combine them together in different ways to automate nearly all my regular tasks. This meant I could work less hours (and I got pay raises!). Today, I teach these techniques to other professionals in our training program so they too can spend less time at work (and more time with their children and doing the things they love).
Do you need help adapting this post to your needs?
I’m guessing the examples in this post don’t exactly match your situation. We all use Excel differently, so it’s impossible to write a post that will meet everybody’s needs. By taking the time to understand the techniques and principles in this post (and elsewhere on this site), you should be able to adapt it to your needs.
But, if you’re still struggling you should:
- Read other blogs, or watch YouTube videos on the same topic. You will benefit much more by discovering your own solutions.
- Ask the ‘Excel Ninja’ in your office. It’s amazing what things other people know.
- Ask a question in a forum like Mr Excel, or the Microsoft Answers Community. Remember, the people on these forums are generally giving their time for free. So take care to craft your question, make sure it’s clear and concise. List all the things you’ve tried, and provide screenshots, code segments and example workbooks.
- Use Excel Rescue, who are my consultancy partner. They help by providing solutions to smaller Excel problems.
What next?
Don’t go yet, there is plenty more to learn on Excel Off The Grid. Check out the latest posts:
Excel VBA PowerPoint Tutorial
VBA is a powerful tool which can be used within any area of Microsoft integrated tools. Like MS Excel, Powerpoint also has a provision for creating a macro and automating the presentation. The automation can be of any form. You have seen presentations where the slides are so big and detailed, which sometimes end up having 50+ slides just to cover a training topic or a report. So instead of adding the charts in PowerPoint from Excel, we can create a code which will directly copy the charts from Excel and paste that into PowerPoint slide.
How to Create a PowerPoint Presentation From Excel VBA?
Below is the example to create a powerpoint presentation Using VBA Code in Excel:
You can download this VBA PowerPoint Excel Template here – VBA PowerPoint Excel Template
VBA PowerPoint Example
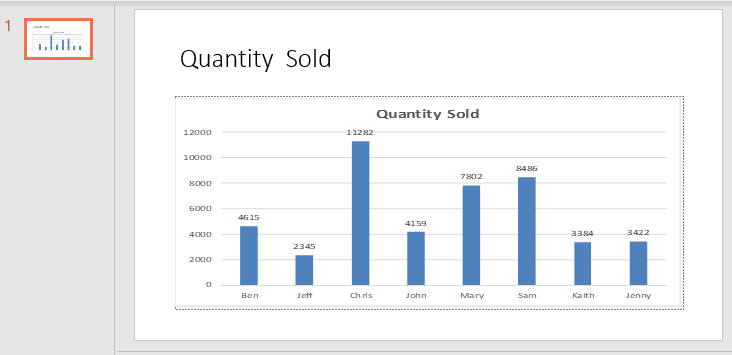
Let’s create a chart first in excel. For that, we need data. Below we have some sales data of 8 salespersons.
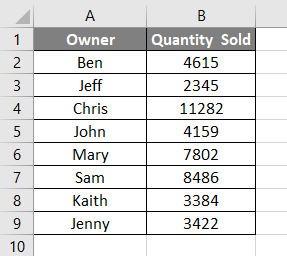
Now let’s create a Column Chart or Graph with the help of the above data. We will see below, we have now a column chart with the title Quantity Sold and all labels inserted.
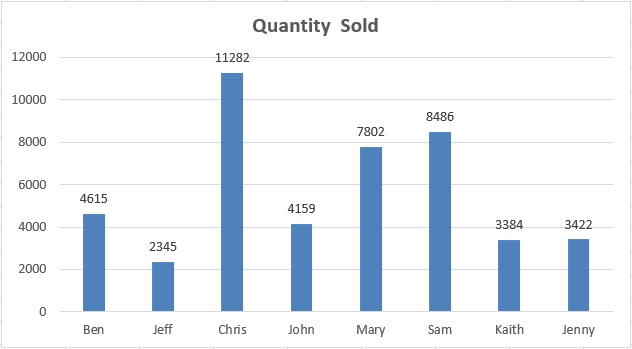
Now our task is to get this graph in PowerPoint slide as it is showing here with the title of the chart as the title of PowerPoint slide. For this, we need to enable the PowerPoint in VBA.
Follow the below steps:
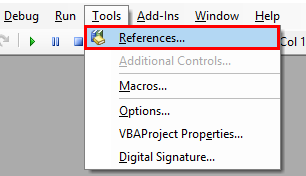
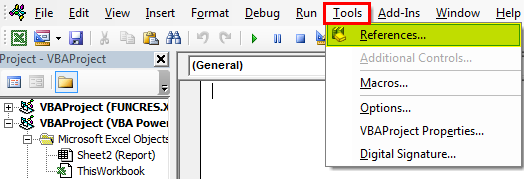
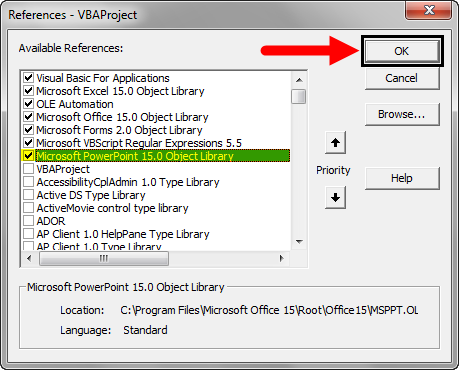
Step 1: Go to VBA Tool menu as shown below and select References… option as shown below.
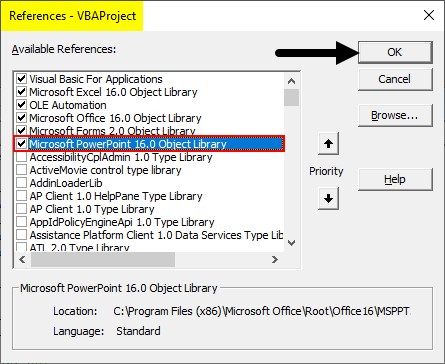
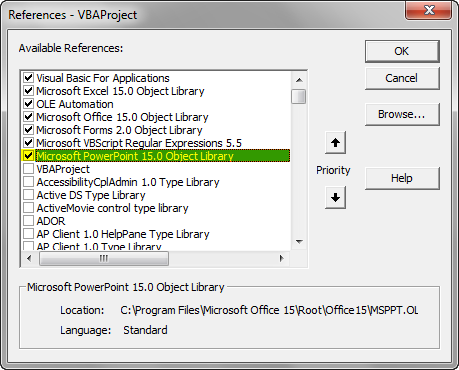
Step 2: Once we do that we will get a References VBA Project windows. From that list select MS PowerPoint 15.0 Object Library as shown below. This will activate all the commands related to MS PowerPoint in VBA. Without this, we cannot run VBA in PowerPoint. Check the box of mentioned Library and click on Ok.
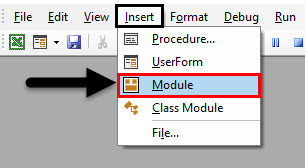
Step 3: Now for writing the code for VBA PowerPoint, we need a module. To get a new module, go to Insert menu and select a Module option as shown below.
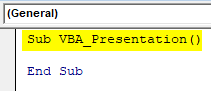
Step 4: In that module write the subcategory of VBA PowerPoint or in any other name as per your need as shown below.
Code:
Sub VBA_Presentation()

End Sub
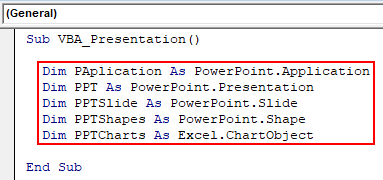
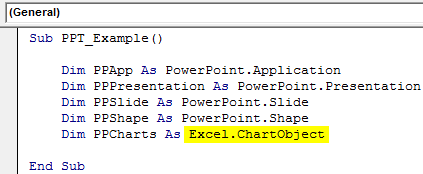
Step 5: Now for creating a presentation with the help of Chart in excel, we need few Variables. Let’s consider 5 variables as:
- PApplication for PowerPoint Application.
- PPT for PowerPoint Presentation,
- PPTSlide for PowerPoint Slide,
- PPTShapes for PowerPoints,
- PPTCharts for Excel Chart Object.
Code:
Sub VBA_Presentation()

  Dim PAplication As PowerPoint.Application
  Dim PPT As PowerPoint.Presentation
  Dim PPTSlide As PowerPoint.Slide
  Dim PPTShapes As PowerPoint.Shape
  Dim PPTCharts As Excel.ChartObject

End Sub
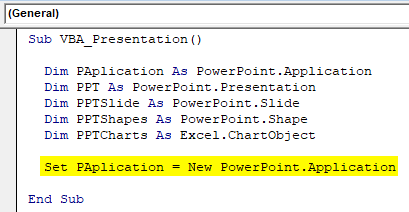
Step 6: Now use Set command to add New PowerPoint Application as shown below.
Code:
Sub VBA_Presentation()

  Dim PAplication As PowerPoint.Application
  Dim PPT As PowerPoint.Presentation
  Dim PPTSlide As PowerPoint.Slide
  Dim PPTShapes As PowerPoint.Shape
  Dim PPTCharts As Excel.ChartObject

  Set PAplication = New PowerPoint.Application

End Sub
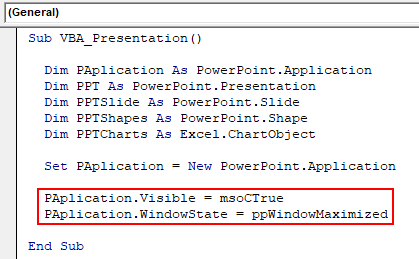
Step 7: In a line of code, make PowerPoint Application visible and use msoCTrue for mysteriously evaluating the incorrect way. And after that, the same application will get be used as Maximized in PowerPoint to get the full view.
Code:
Sub VBA_Presentation()

  Dim PAplication As PowerPoint.Application
  Dim PPT As PowerPoint.Presentation
  Dim PPTSlide As PowerPoint.Slide
  Dim PPTShapes As PowerPoint.Shape
  Dim PPTCharts As Excel.ChartObject

  Set PAplication = New PowerPoint.Application

  PAplication.Visible = msoCTrue
  PAplication.WindowState = ppWindowMaximized

End Sub
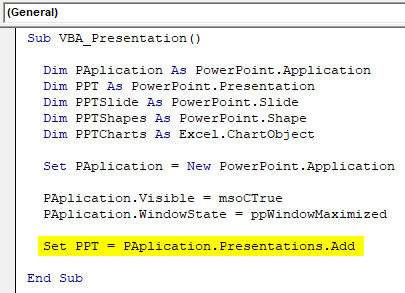
Step 8: Now set the PPT which is our presentation to add in MS PowerPoint Application,
Code:
Sub VBA_Presentation()

  Dim PAplication As PowerPoint.Application
  Dim PPT As PowerPoint.Presentation
  Dim PPTSlide As PowerPoint.Slide
  Dim PPTShapes As PowerPoint.Shape
  Dim PPTCharts As Excel.ChartObject

  Set PAplication = New PowerPoint.Application

  PAplication.Visible = msoCTrue
  PAplication.WindowState = ppWindowMaximized

  Set PPT = PAplication.Presentations.Add

End Sub
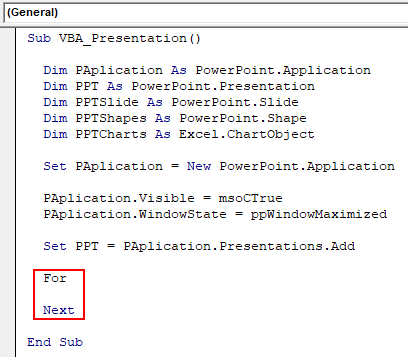
Step 9: Now we will use a combination of For-Next and If-Else loop. Starting with For-Next Loop.
Code:
Sub VBA_Presentation()

  Dim PAplication As PowerPoint.Application
  Dim PPT As PowerPoint.Presentation
  Dim PPTSlide As PowerPoint.Slide
  Dim PPTShapes As PowerPoint.Shape
  Dim PPTCharts As Excel.ChartObject

  Set PAplication = New PowerPoint.Application

  PAplication.Visible = msoCTrue
  PAplication.WindowState = ppWindowMaximized

  Set PPT = PAplication.Presentations.Add

  For

  Next

End Sub
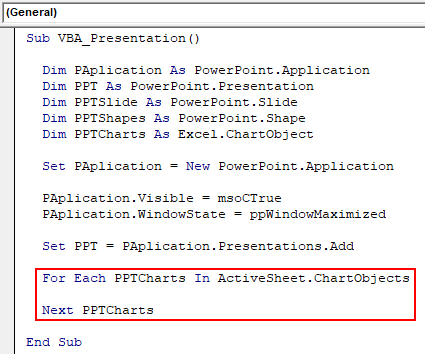
Step 10: In For loop of PPTCharts, first active charts in excel.
Code:
Sub VBA_Presentation()

  Dim PAplication As PowerPoint.Application
  Dim PPT As PowerPoint.Presentation
  Dim PPTSlide As PowerPoint.Slide
  Dim PPTShapes As PowerPoint.Shape
  Dim PPTCharts As Excel.ChartObject

  Set PAplication = New PowerPoint.Application

  PAplication.Visible = msoCTrue
  PAplication.WindowState = ppWindowMaximized

  Set PPT = PAplication.Presentations.Add

  For Each PPTCharts In ActiveSheet.ChartObjects

  Next PPTCharts

End Sub
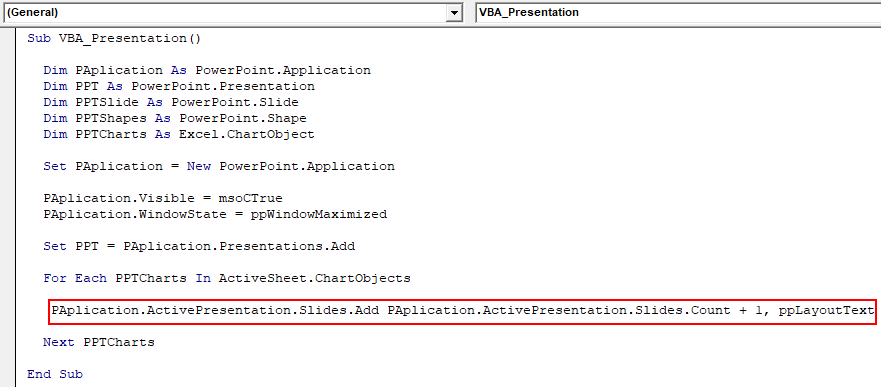
Step 11: Below is the code for pasting the chart from excel to PowerPoint slide. Use code to add a slide into defined PAplication adding +1 slide each time we run the code.
Code:
Sub VBA_Presentation()

  Dim PAplication As PowerPoint.Application
  Dim PPT As PowerPoint.Presentation
  Dim PPTSlide As PowerPoint.Slide
  Dim PPTShapes As PowerPoint.Shape
  Dim PPTCharts As Excel.ChartObject

  Set PAplication = New PowerPoint.Application

  PAplication.Visible = msoCTrue
  PAplication.WindowState = ppWindowMaximized

  Set PPT = PAplication.Presentations.Add

  For Each PPTCharts In ActiveSheet.ChartObjects

   PAplication.ActivePresentation.Slides.Add PAplication.ActivePresentation.Slides.Count + 1, ppLayoutText

  Next PPTCharts

End Sub
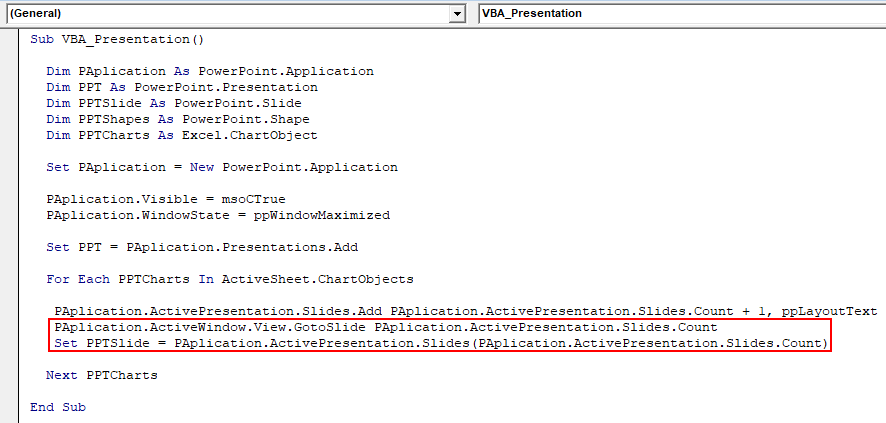
Step 12: Now on the continuation to the next line of code, use the below set of code to set an active window view. This will take use to slide after Chart gets pasted in PowerPoint presentation.
Code:
Sub VBA_Presentation()

  Dim PAplication As PowerPoint.Application
  Dim PPT As PowerPoint.Presentation
  Dim PPTSlide As PowerPoint.Slide
  Dim PPTShapes As PowerPoint.Shape
  Dim PPTCharts As Excel.ChartObject

  Set PAplication = New PowerPoint.Application

  PAplication.Visible = msoCTrue
  PAplication.WindowState = ppWindowMaximized

  Set PPT = PAplication.Presentations.Add

  For Each PPTCharts In ActiveSheet.ChartObjects

   PAplication.ActivePresentation.Slides.Add PAplication.ActivePresentation.Slides.Count + 1, ppLayoutText
   PAplication.ActiveWindow.View.GotoSlide PAplication.ActivePresentation.Slides.Count
   Set PPTSlide = PAplication.ActivePresentation.Slides(PAplication.ActivePresentation.Slides.Count)

  Next PPTCharts

End Sub
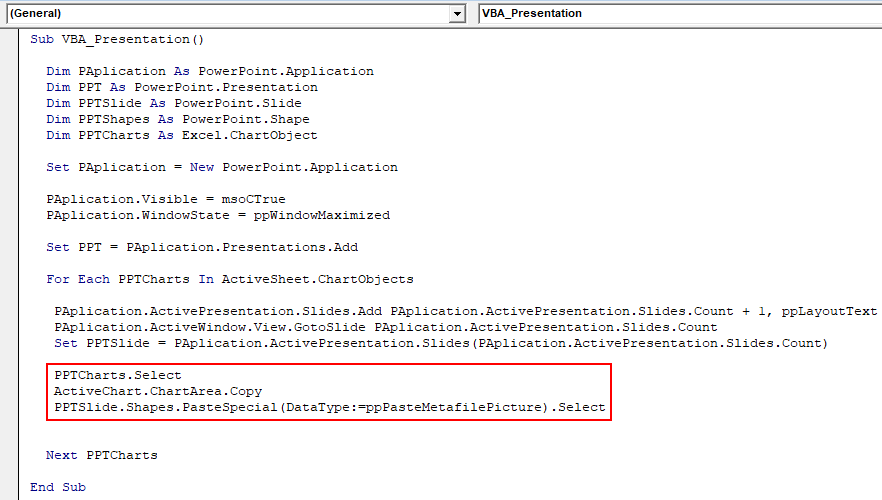
Step 13: Once done, select the PPTChart variable which we defined earlier. After that copy the selected active chart into the chart area where it will be placed. And use Paste Special command to paste the chart with pictures.
Code:
Sub VBA_Presentation()

  Dim PAplication As PowerPoint.Application
  Dim PPT As PowerPoint.Presentation
  Dim PPTSlide As PowerPoint.Slide
  Dim PPTShapes As PowerPoint.Shape
  Dim PPTCharts As Excel.ChartObject

  Set PAplication = New PowerPoint.Application

  PAplication.Visible = msoCTrue
  PAplication.WindowState = ppWindowMaximized

  Set PPT = PAplication.Presentations.Add

  For Each PPTCharts In ActiveSheet.ChartObjects

   PAplication.ActivePresentation.Slides.Add PAplication.ActivePresentation.Slides.Count + 1, ppLayoutText
   PAplication.ActiveWindow.View.GotoSlide PAplication.ActivePresentation.Slides.Count
   Set PPTSlide = PAplication.ActivePresentation.Slides(PAplication.ActivePresentation.Slides.Count)

   PPTCharts.Select
   ActiveChart.ChartArea.Copy
   PPTSlide.Shapes.PasteSpecial(DataType:=ppPasteMetafilePicture).Select

  Next PPTCharts

End Sub
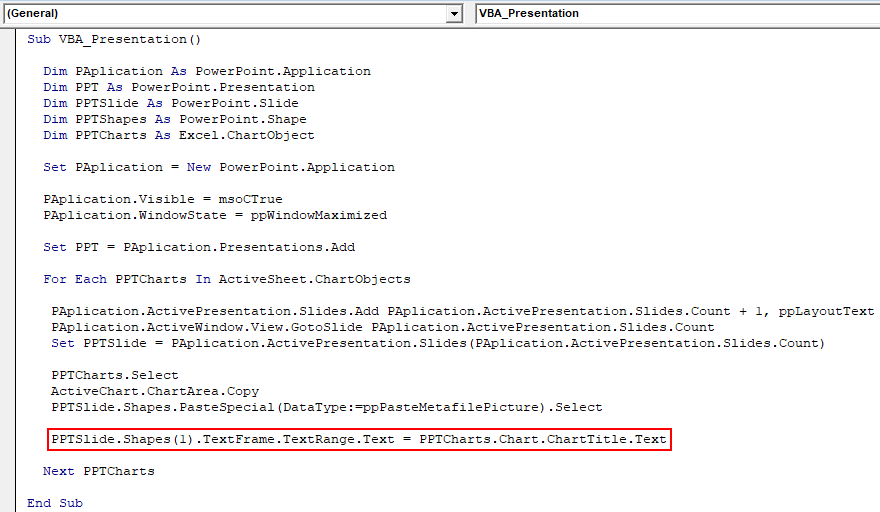
Step 14: Now select the shape of the Chart which is at first position as text range. And carry the same title which is “Quantity Sold” into the PowerPoint Presentation.
Code:
Sub VBA_Presentation()

  Dim PAplication As PowerPoint.Application
  Dim PPT As PowerPoint.Presentation
  Dim PPTSlide As PowerPoint.Slide
  Dim PPTShapes As PowerPoint.Shape
  Dim PPTCharts As Excel.ChartObject

  Set PAplication = New PowerPoint.Application

  PAplication.Visible = msoCTrue
  PAplication.WindowState = ppWindowMaximized

  Set PPT = PAplication.Presentations.Add

  For Each PPTCharts In ActiveSheet.ChartObjects

   PAplication.ActivePresentation.Slides.Add PAplication.ActivePresentation.Slides.Count + 1, ppLayoutText
   PAplication.ActiveWindow.View.GotoSlide PAplication.ActivePresentation.Slides.Count
   Set PPTSlide = PAplication.ActivePresentation.Slides(PAplication.ActivePresentation.Slides.Count)

   PPTCharts.Select
   ActiveChart.ChartArea.Copy
   PPTSlide.Shapes.PasteSpecial(DataType:=ppPasteMetafilePicture).Select

   PPTSlide.Shapes(1).TextFrame.TextRange.Text = PPTCharts.Chart.ChartTitle.Text

  Next PPTCharts

End Sub
This completes the code for VBA PowerPoint.
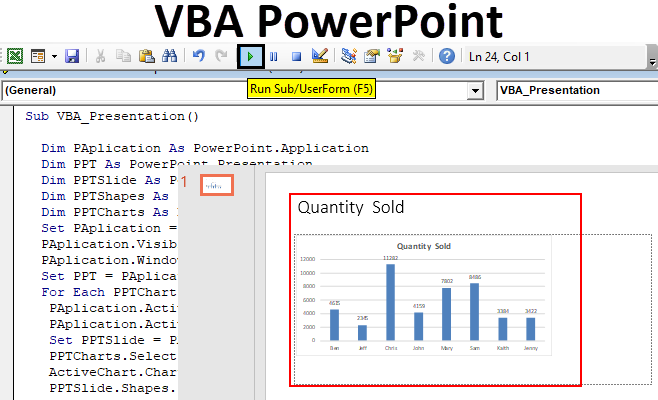
Step 15: Now compile the code step by step to know if any line of code has an error by pressing function key F8. And after that run the code by clicking on the Play button which is below the menu bar as shown below.
We will get the chart posted in PowerPoint file in the first slide of it as shown below.
As the code is big, so the complete code can be seen in the text box below.
Pros of Excel VBA PowerPoint
- Using VBA in Powerpoint makes easy to handle if a ppt file has so many slides with huge content.
- VBA with Powerpoint gives a touch of automation even with limited functions available.
Cons of Excel VBA PowerPoint
- We need to select the Microsoft PowerPoint 15.0 Object Library from the Reference option located in Tool menu option, which we need in the start of example-1, every time we run the code for PowerPoint.
Things to Remember
- Save the file in the Macro-Enable Presentation format after writing the code. This will help us to avoid losing the code and using the same multiple time in the future.
- Recoding feature will not work here as we need to jump from Excel to PowerPoint changing the interface between the pages.
- Always compile the code before running. This will help you to find the error in the code. This is quite helpful when we write big lines of code.
- To run and implement the code we need to open the excel sheet with Chart that we want to paste it in PowerPoint slide.
- We can align the chart in PowerPoint as per our needs.
Recommended Articles
This is a guide to VBA PowerPoint. Here we discuss how to create PowerPoint Presentation From Excel Using VBA Code along with a practical example and downloadable excel template. You can also go through our other suggested articles –
- VBA Delete Column
- Status Bar in Excel
- VBA Remove Duplicates
- Create Spreadsheet in Excel
Excel VBA PowerPoint
Using VBA, we can automate the work we do for PowerPoint. But first, to use VBA code or snippets to work in PowerPoint, first work through the security options in PowerPoint to enable all Macros. Then, we can use PowerPoint VBA reference for Macros in MS PowerPoint.
The beauty of VBA is that we can reference other Microsoft products like “Microsoft Word” and “Microsoft PowerPoint.” We usually create reports in Excel and then create PowerPoint presentations. All Excel users usually spend a considerable amount of time preparing the presentation from Excel data and reports. If you spend considerable time preparing PowerPoint presentations, this tutorial will show you how to create a PowerPoint presentation from Excel using VBA CodingVBA code refers to a set of instructions written by the user in the Visual Basic Applications programming language on a Visual Basic Editor (VBE) to perform a specific task.read more.
Table of contents
- Excel VBA PowerPoint
- Enable Powerpoint Object Model
- VBA Tutorial to Create PowerPoint Presentation
- Recommended Articles
You are free to use this image on your website, templates, etc, Please provide us with an attribution linkArticle Link to be Hyperlinked
For eg:
Source: VBA PowerPoint (wallstreetmojo.com)
Enable Powerpoint Object Model
Let us follow the below steps..
- Open “VBA Editor.” Then, go to “Tools” and “References.”

- Now, you will see all the references to the “VBA Project.” Scroll down and select “Microsoft PowerPoint 15.0 Object Library”.

- Click on “OK.” Now, we can access PowerPoint from Excel.
VBA Tutorial to Create PowerPoint Presentation
We can create PPT in “Early Binding” and “Late Binding.” Finally, we will show you how to create a PowerPoint presentationThe full form of PPT is PowerPoint Presentation. They are generally used in corporate meetings for educational purposes such as training, induction, etc. and are even used by students for creating their high school/ college projects and assignments. Such presentations are prepared by sourcing and combining individual slides together into one with the help of MS PowerPoint Software.read more using the “Early Binding” technique.
You can download this VBA PowerPoint Excel Template here – VBA PowerPoint Excel Template
Usually, from Excel, we prepare presentations based on charts and interpretation of the charts. So, for this purpose, we have created some simple excel chartsIn Excel, a graph or chart lets us visualize information we’ve gathered from our data. It allows us to visualize data in easy-to-understand pictorial ways. The following components are required to create charts or graphs in Excel: 1 — Numerical Data, 2 — Data Headings, and 3 — Data in Proper Order.read more and interpretations in the same worksheet.


Step 1: Start the subroutine in VBASUB in VBA is a procedure which contains all the code which automatically gives the statement of end sub and the middle portion is used for coding. Sub statement can be both public and private and the name of the subprocedure is mandatory in VBA.read more. We have already enabled the PowerPoint object model in the earlier steps to access PowerPoint. To access this, we need to declare the variable as PowerPoint.Application.
Code:
Sub PPT_Example()

    Dim PPApp As PowerPoint.Application
End Sub

Step 2: To add the presentation to PowerPoint, we need to declare a variable as PowerPoint.Presentation.
Code:
Dim PPPresentation As PowerPoint.Presentation

Step 3: After adding the presentation to the PowerPoint, we need to add a Slide to declare the variable as PowerPoint.Slide.
Code:
Dim PPSlide As PowerPoint.Slide

Step 4: Once we add the slide to the PowerPoint, we need to use shapes in the PowerPoint, i.e., text boxes, to declare a variable as PowerPoint.Shape.
Code:
Dim PPShape As PowerPoint.Shape

Step 5: Now, we need to declare the variable as Excel to access all the charts in the worksheet.ChartObjects.
Code:
Dim PPCharts As Excel.ChartObject
These variables are enough to start the proceedings.
Step 6: Now, we need to launch the PowerPoint from Excel. Since it is an external object, we need to set this as a new PowerPoint.
Code:
Set PPApp = New PowerPoint.Application

It will launch the new PowerPoint from Excel.
Step 7: The variable PPApp is equal to the PowerPoint we launched. Now, make this PowerPoint visible and maximize the window.
Code:
PPApp.Visible = msoCTrue
PPApp.WindowState = ppWindowMaximized
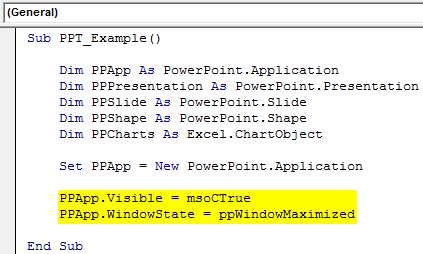
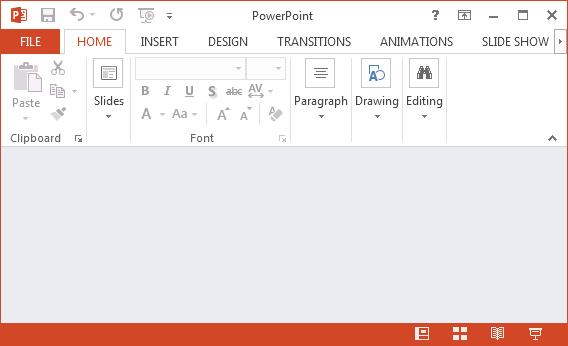
Now, just run the code using the F5 key or manually. You should see the PowerPoint app launched like the one below.
Step 8: We need to add a presentation to the PowerPoint app we have launched.
Code:
Set PPPresentation = PPApp.Presentations.Add
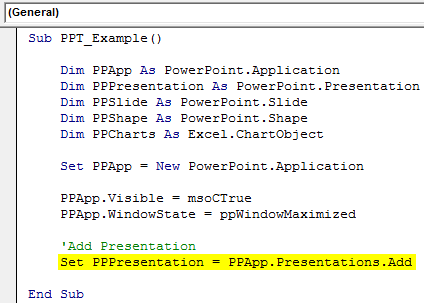
Now, we should see the PowerPoint presentation like this.

Step 9: We need to add a slide after adding the presentation
Code:
Set PPSlide = PPPresentation.Slides.Add(1, ppLayoutTitleOnly)
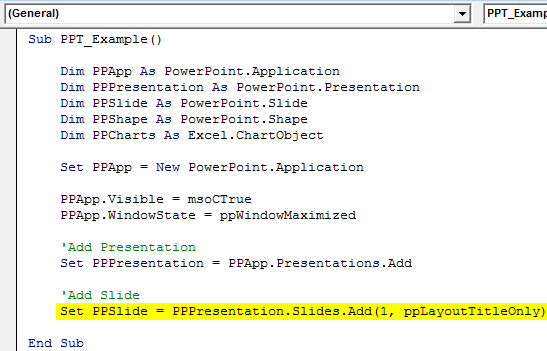
Now, this will add the title slide like the below.

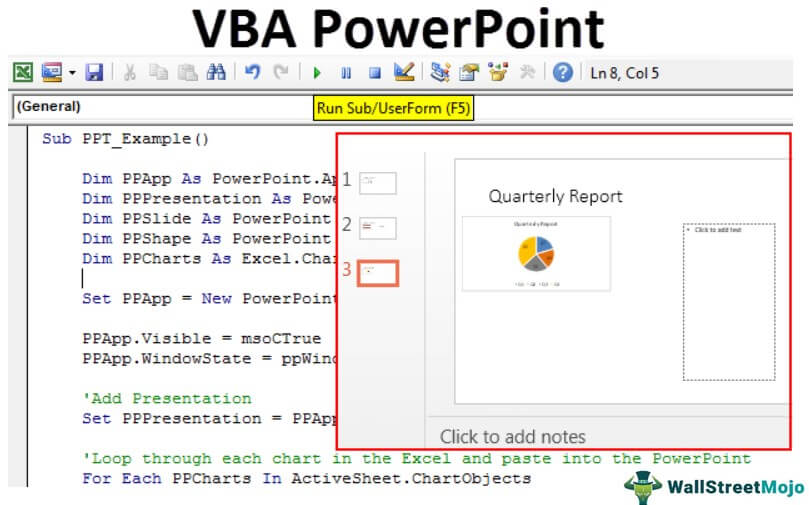
Step 10: Now that we have more than one chart in the worksheet, we need to loop through each chart and paste it into the presentation. Below is the code to copy and paste the chart and interpretation.
Below is the complete code for you.
Sub PPT_Example()

    Dim PPApp As PowerPoint.Application
    Dim PPPresentation As PowerPoint.Presentation
    Dim PPSlide  As PowerPoint.Slide
    Dim PPShape As PowerPoint.Shape
    Dim PPCharts As Excel.ChartObject

    Set PPApp = New PowerPoint.Application

    PPApp.Visible = msoCTrue
    PPApp.WindowState = ppWindowMaximized

    'Add Presentation
     Set PPPresentation = PPApp.Presentations.Add

     'Loop through each chart in the Excel and paste into the PowerPoint
     For Each PPCharts In ActiveSheet.ChartObjects
       PPApp.ActivePresentation.Slides.Add PPApp.ActivePresentation.Slides.Count + 1, ppLayoutText
       PPApp.ActiveWindow.View.GotoSlide PPApp.ActivePresentation.Slides.Count
       Set PPSlide = PPApp.ActivePresentation.Slides(PPApp.ActivePresentation.Slides.Count)

    'Copy the chart and paste in Powerpoint
     PPCharts.Select
     ActiveChart.ChartArea.Copy
     PPSlide.Shapes.PasteSpecial(DataType:=ppPasteMetafilePicture).Select

    'Add heading to the slide
     PPSlide.Shapes(1).TextFrame.TextRange.Text = PPCharts.Chart.ChartTitle.Text

    'Allignment of the chart
     PPApp.ActiveWindow.Selection.ShapeRange.Left = 15
     PPApp.ActiveWindow.Selection.ShapeRange.Top = 125

     PPSlide.Shapes(2).Width = 200
     PPSlide.Shapes(2).Left = 505

     'Add interpretation
        If InStr(PPSlide.Shapes(1).TextFrame.TextRange.Text, "Region") Then
           PPSlide.Shapes(2).TextFrame.TextRange.Text = Range("K2").Value & vbNewLine
           PPSlide.Shapes(2).TextFrame.TextRange.InsertAfter (Range("K3").Value & vbNewLine)
     'Else if the chart is the "Renewable" consumption chart, then enter the appropriate comments
         ElseIf InStr(PPSlide.Shapes(1).TextFrame.TextRange.Text, "Month") Then
           PPSlide.Shapes(2).TextFrame.TextRange.Text = Range("K20").Value & vbNewLine
           PPSlide.Shapes(2).TextFrame.TextRange.InsertAfter (Range("K21").Value & vbNewLine)
           PPSlide.Shapes(2).TextFrame.TextRange.InsertAfter (Range("K22").Value & vbNewLine)
      End If

   'Now let's change the font size of the callouts box
      PPSlide.Shapes(2).TextFrame.TextRange.Font.Size = 16

Next PPCharts

End Sub

Recommended Articles
This article is a guide to VBA PowerPoint Tutorial. Here, we learn how to create a PowerPoint presentation using the “Early Binding” technique in VBA code, examples, and a downloadable template. Below are some useful Excel articles related to VBA: –
- VBA ByRef Function
- Excel VBA Charts
- VBA Val Function
- Create VBA Pivot Table
In this post we will explore how VBA paste from Excel to PowerPoint objects such as a Range, Chart or other element. Below you will find working code snippets. We will learn also to modify this routine to address different VBA Copy Paste from Excel to PowerPoint.
We will start with an example of VBA Paste Excel Range into PowerPoint as Picture as this is the most typical scenario. For this I created a custom function called CopyFromExcelToPPT:
Function CopyFromExcelToPPT(excelFilePath As String, sheetName As String, rngCopy As String, dstSlide As Long, Optional shapeTop As Long, Optional shapeLeft As Long)
    On Error GoTo ErrorHandl 'Handle Errors

    'Set Variables and Open Excel
    Dim eApp As Excel.Application, wb As Excel.Workbook, ppt As PowerPoint.Presentation
    Set eApp = New Excel.Application
    eApp.Visible = False
    Set wb = eApp.Workbooks.Open(excelFilePath)
    Set ppt = ActivePresentation

    'Copy cells in Excel
    wb.Sheets(sheetName).Range(rngCopy).Copy

    'Paste into first slide in active PowerPoint presentation
    ppt.Slides(dstSlide).Shapes.PasteSpecial ppPasteBitmap

    'Close and clean-up Excel
    wb.Close SaveChanges:=False
    eApp.Quit
    Set wb = Nothing: Set eApp = Nothing

    'Move the new shape if left/top provided
    If Not (IsMissing(shapeTop)) Then
        With ppt.Slides(dstSlide).Shapes(ppt.Slides(dstSlide).Shapes.Count)
            .Left = shapeLeft
            .Top = shapeTop
        End With
    End If

    CopyFromExcelToPPT = True
    Exit Function
ErrorHandl:
    'Make sure to close the workbook and Excel and return False
    On Error Resume Next
    If Not (eApp Is Nothing) Then
        wb.Close SaveChanges:=False
        eApp.Quit
    End If
    CopyFromExcelToPPT = False
End Function
What does the VBA Function do? In short you need to provide the following parameters:
- excelFilePath – full file path to the Excel from which you want to copy a VBA Range
- sheetName – the Sheet name from which you want to copy
- rngCopy – the VBA Range you want to copy
- dstSlide – the number of the slide (starting at 1) to which you want to copy the Range
- shapeTop – Optional. The Top position in pixels of the new pasted Shape
- shapeLeft – Optional. The Left position in pixels of the new pasted Shape
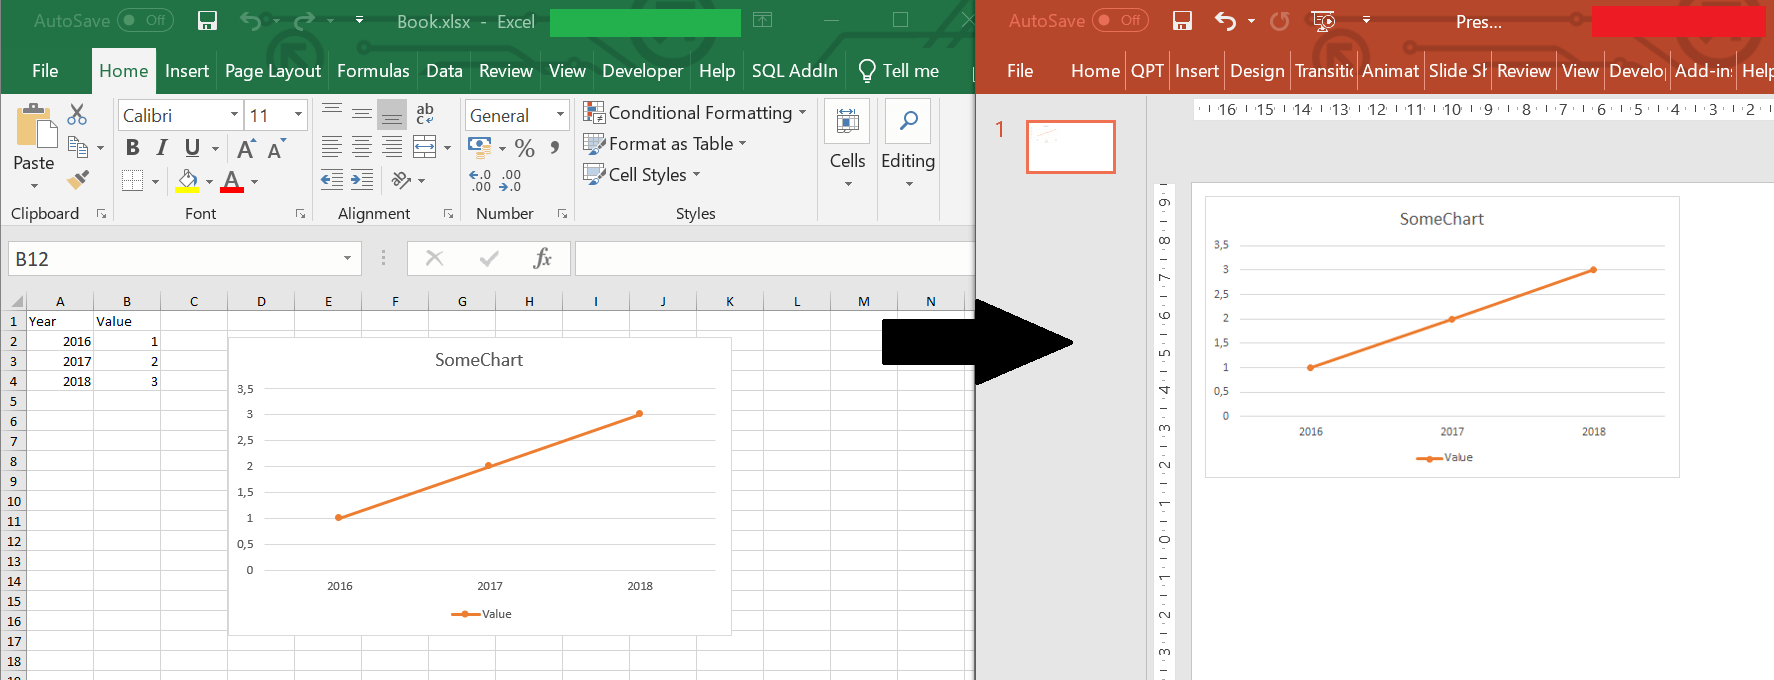
Let us use this function in the following scenario. We want to copy range A1:B4.
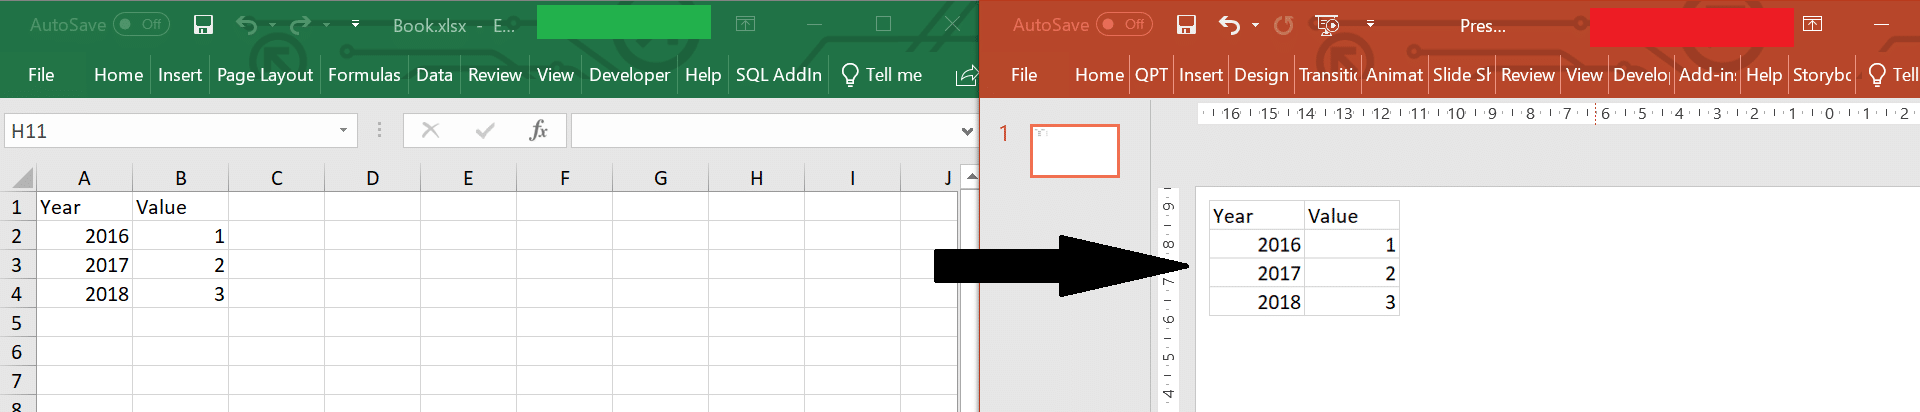
Let us use our function above for this scenario
Sub Test()
'Copy from Excel worksheet named Sheet1 the A1:B4 range
If CopyFromExcelToPPT("C:Book.xlsx", "Sheet1", "A1:B4", 1) Then
        Debug.Print "Success"
    Else
        Debug.Print "Failure"
    End If
End Sub
VBA Paste Chart from Excel to PowerPoint
Now an example of VBA Paste Excel Graph into PowerPoint as Picture as this is also a useful case. For this I created a custom function called CopyChartFromExcelToPPT:
Function CopyChartFromExcelToPPT(excelFilePath As String, sheetName As String, chartName As String, dstSlide As Long, Optional shapeTop As Long, Optional shapeLeft As Long)
    On Error GoTo ErrorHandl 'Handle Errors

    'Set Variables and Open Excel
    Dim eApp As Excel.Application, wb As Excel.Workbook, ppt As PowerPoint.Presentation, ws As Excel.Worksheet
    Set eApp = New Excel.Application
    eApp.Visible = False
    Set wb = eApp.Workbooks.Open(excelFilePath)
    Set ppt = ActivePresentation

    'Copy Chart in Excel
    wb.Sheets(sheetName).ChartObjects(chartName).Copy

    'Paste into first slide in active PowerPoint presentation
    ppt.Slides(dstSlide).Shapes.PasteSpecial ppPasteBitmap

    'Close and clean-up Excel
    wb.Close SaveChanges:=False
    eApp.Quit
    Set wb = Nothing: Set eApp = Nothing

    'Move the new shape if left/top provided
    If Not (IsMissing(shapeTop)) Then
        With ppt.Slides(dstSlide).Shapes(ppt.Slides(dstSlide).Shapes.Count)
            .Left = shapeLeft
            .Top = shapeTop
        End With
    End If

    CopyChartFromExcelToPPT = True
    Exit Function
ErrorHandl:
    'Make sure to close the workbook and Excel and return False
    On Error Resume Next
    If Not (eApp Is Nothing) Then
        wb.Close SaveChanges:=False
        eApp.Quit
    End If
    CopyChartFromExcelToPPT = False
End Function
Again let us use it on the example below where we want to copy a Chart from a Excel Workbook to PowerPoint:
Example execution of the VBA Function below:
Sub Test()
    If CopyChartFromExcelToPPT("C:Book.xlsx", "Sheet1", "Chart 1", 1) Then
        Debug.Print "Success"
    Else
        Debug.Print "Failure"
    End If
End Sub
If you want to place the Chart at a specific place use the shapeTop and shapeLeft arguments. The below will place the chart at 10 pixels from the Top and 100 pixels from the Left.
Sub Test()
    If CopyChartFromExcelToPPT("C:Book.xlsx", "Sheet1", "Chart 1", 1, 10, 100) Then
        Debug.Print "Success"
    Else
        Debug.Print "Failure"
    End If
End Sub
Changing Height / Width of pasted elements
In the examples above we didn’t change the Width and Height of the pasted Range or Chart. To do this use the adjusted functions below:
Function CopyFromExcelToPPT(excelFilePath As String, sheetName As String, rngCopy As String, dstSlide As Long, Optional shapeTop As Long, Optional shapeLeft As Long, Optional shapeHeight As Long, Optional shapeWidth As Long)
    On Error GoTo ErrorHandl 'Handle Errors

    'Set Variables and Open Excel
    Dim eApp As Excel.Application, wb As Excel.Workbook, ppt As PowerPoint.Presentation
    Set eApp = New Excel.Application
    eApp.Visible = False
    Set wb = eApp.Workbooks.Open(excelFilePath)
    Set ppt = ActivePresentation

    'Copy cells in Excel
    wb.Sheets(sheetName).Range(rngCopy).Copy

    'Paste into first slide in active PowerPoint presentation
    ppt.Slides(1).Shapes.PasteSpecial ppPasteBitmap

    'Close and clean-up Excel
    wb.Close SaveChanges:=False
    eApp.Quit
    Set wb = Nothing: Set eApp = Nothing

    'Move the new shape if left/top provided
    If Not (IsMissing(shapeTop)) Then
        With ppt.Slides(1).Shapes(ppt.Slides(1).Shapes.Count)
            .Left = shapeLeft
            .Top = shapeTop
        End With
    End If

    'Resize the shape if height/width provided
    If Not (IsMissing(shapeHeight)) Then
        With ppt.Slides(dstSlide).Shapes(ppt.Slides(1).Shapes.Count)
            .Height = shapeHeight
            .Width = shapeWidth
        End With
    End If

    CopyFromExcelToPPT = True
    Exit Function
ErrorHandl:
    'Make sure to close the workbook and Excel and return False
    On Error Resume Next
    If Not (eApp Is Nothing) Then
        wb.Close SaveChanges:=False
        eApp.Quit
    End If
    CopyFromExcelToPPT = False
End Function
Function CopyChartFromExcelToPPT(excelFilePath As String, sheetName As String, chartName As String, dstSlide As Long, Optional shapeTop As Long, Optional shapeLeft As Long, Optional shapeHeight As Long, Optional shapeWidth As Long)
    On Error GoTo ErrorHandl 'Handle Errors

    'Set Variables and Open Excel
    Dim eApp As Excel.Application, wb As Excel.Workbook, ppt As PowerPoint.Presentation, ws As Excel.Worksheet
    Set eApp = New Excel.Application
    eApp.Visible = False
    Set wb = eApp.Workbooks.Open(excelFilePath)
    Set ppt = ActivePresentation

    'Copy Chart in Excel
    wb.Sheets(sheetName).ChartObjects(chartName).Copy

    'Paste into first slide in active PowerPoint presentation
    ppt.Slides(dstSlide).Shapes.PasteSpecial ppPasteBitmap

    'Close and clean-up Excel
    wb.Close SaveChanges:=False
    eApp.Quit
    Set wb = Nothing: Set eApp = Nothing

    'Move the new shape if left/top provided
    If Not (IsMissing(shapeTop)) Then
        With ppt.Slides(dstSlide).Shapes(ppt.Slides(1).Shapes.Count)
            .Height = shapeHeight
            .Width = shapeWidth
        End With
    End If

    'Resize the shape if height/width provided
    If Not (IsMissing(shapeHeight)) Then
        With ppt.Slides(dstSlide).Shapes(ppt.Slides(1).Shapes.Count)
            .Height = shapeHeight
            .Width = shapeWidth
        End With
    End If

    CopyChartFromExcelToPPT = True
    Exit Function
ErrorHandl:
    'Make sure to close the workbook and Excel and return False
    On Error Resume Next
    If Not (eApp Is Nothing) Then
        wb.Close SaveChanges:=False
        eApp.Quit
    End If
    CopyChartFromExcelToPPT = False
End Function