Программное создание графика (диаграммы) в VBA Excel с помощью метода Charts.Add на основе данных из диапазона ячеек на рабочем листе. Примеры.
Метод Charts.Add
В настоящее время на сайте разработчиков описывается метод Charts.Add2, который, очевидно, заменил метод Charts.Add. Тесты показали, что Charts.Add продолжает работать в новых версиях VBA Excel, поэтому в примерах используется именно он.
Синтаксис
|
Charts.Add ([Before], [After], [Count]) |
|
Charts.Add2 ([Before], [After], [Count], [NewLayout]) |
Параметры
Параметры методов Charts.Add и Charts.Add2:
| Параметр | Описание |
|---|---|
| Before | Имя листа, перед которым добавляется новый лист с диаграммой. Необязательный параметр. |
| After | Имя листа, после которого добавляется новый лист с диаграммой. Необязательный параметр. |
| Count | Количество добавляемых листов с диаграммой. Значение по умолчанию – 1. Необязательный параметр. |
| NewLayout | Если NewLayout имеет значение True, диаграмма вставляется с использованием новых правил динамического форматирования (заголовок имеет значение «включено», а условные обозначения – только при наличии нескольких рядов). Необязательный параметр. |
Если параметры Before и After опущены, новый лист с диаграммой вставляется перед активным листом.
Примеры
Таблицы
В качестве источников данных для примеров используются следующие таблицы:
Пример 1
Программное создание объекта Chart с типом графика по умолчанию и по исходным данным из диапазона «A2:B26»:
|
Sub Primer1() Dim myChart As Chart ‘создаем объект Chart с расположением нового листа по умолчанию Set myChart = ThisWorkbook.Charts.Add With myChart ‘назначаем объекту Chart источник данных .SetSourceData (Sheets(«Лист1»).Range(«A2:B26»)) ‘переносим диаграмму на «Лист1» (отдельный лист диаграммы удаляется) .Location xlLocationAsObject, «Лист1» End With End Sub |
Результат работы кода VBA Excel из первого примера:
Пример 2
Программное создание объекта Chart с двумя линейными графиками по исходным данным из диапазона «A2:C26»:
|
Sub Primer2() Dim myChart As Chart Set myChart = ThisWorkbook.Charts.Add With myChart .SetSourceData (Sheets(«Лист1»).Range(«A2:C26»)) ‘задаем тип диаграммы (линейный график с маркерами) .ChartType = xlLineMarkers .Location xlLocationAsObject, «Лист1» End With End Sub |
Результат работы кода VBA Excel из второго примера:
Пример 3
Программное создание объекта Chart с круговой диаграммой, разделенной на сектора, по исходным данным из диапазона «E2:F7»:
|
Sub Primer3() Dim myChart As Chart Set myChart = ThisWorkbook.Charts.Add With myChart .SetSourceData (Sheets(«Лист1»).Range(«E2:F7»)) ‘задаем тип диаграммы (пирог — круг, разделенный на сектора) .ChartType = xlPie ‘задаем стиль диаграммы (с отображением процентов) .ChartStyle = 261 .Location xlLocationAsObject, «Лист1» End With End Sub |
Результат работы кода VBA Excel из третьего примера:
Примечание
В примерах использовались следующие методы и свойства объекта Chart:
| Компонент | Описание |
|---|---|
| Метод SetSourceData | Задает диапазон исходных данных для диаграммы. |
| Метод Location | Перемещает диаграмму в заданное расположение (новый лист, существующий лист, элемент управления). |
| Свойство ChartType | Возвращает или задает тип диаграммы. Смотрите константы. |
| Свойство ChartStyle | Возвращает или задает стиль диаграммы. Значение нужного стиля можно узнать, записав макрос. |
Содержание
- VBA в Excel Объект Excel.Chart и программная работа с диаграммами средствами VBA
- 10.9 Работа с диаграммами: объект Chart
- Объект Charts (Excel)
- Замечания
- Пример
- Методы
- Свойства
- См. также
- Поддержка и обратная связь
- Объект Chart (Excel)
- Примечания
- События
- Методы
- Свойства
- См. также
- Поддержка и обратная связь
VBA в Excel Объект Excel.Chart и программная работа с диаграммами средствами VBA
10.9 Работа с диаграммами: объект Chart
Объект Excel.Chart, программная работа с диаграммами средствами VBA, выбор типа диаграммы, добавление рядов
Одно из основных применений Excel — это анализ данных. А для анализа данных часто удобно использовать диаграммы с их специальными возможностями, такими, как тренды. На практике задачи по автоматизации создания множества похожих друг на друга диаграмм (обычно на основе информации, полученной из базы данных) возникают очень часто.
С диаграммами в Excel существует некоторая терминологическая путаница. То, что на графическом интерфейсе русского Excel называется диаграммой (меню Вставка -> Диаграмма), по английски называется графиком (Chart) и ему соответствует объект Chart. В объектной модели Excel предусмотрен также и объект Diagram, но он представляет скорее схему отношений (то, что при помощи графического интерфейса русского Excel можно добавить при помощи меню Вставка -> Схематическая диаграмма). Под диаграммой в этом разделе будет пониматься то же, что и у создателей русского Excel — график.
Диаграммы в Excel создаются при помощи объекта Chart.
Лучше всего вначале этот объект объявить:
Dim oChart As Chart
Дальше можно создавать диаграмму. Производится создание диаграммы при помощи много раз использованного нами приема — вызова метода Add() коллекции Charts:
Set oChart = ActiveWorkbook.Charts.Add(, ActiveSheet)
В принципе, диаграмма уже создана, но, поскольку никакие ее свойства не определены, она выглядит просто как пустой лист. Чтобы она обрела содержание, необходимо выполнить еще несколько действий:
Первое (и единственное обязательное действие) — определить источник данных для диаграммы, для чего предназначен метод SetSourceData(). В качестве источника может выступать только объект Range (он передается в качестве первого и единственного обязательного параметра этого метода). Второй параметр (необязательный) определяет, в каком порядке считывать данные — сначала по столбцам или сначала по строкам. Например, в нашем случае это может выглядеть так:
В принципе, если запустить созданный код на выполнение, то диаграмма уже будет создана. Для всех остальных параметров будут приняты значения по умолчанию. Однако на практике нужно определить еще хотя бы тип диаграммы (по умолчанию она будет выглядеть как «обычная гистограмма», то есть ряд из столбиков разной длины). Для этой цели используется свойство ChartType, для которой разработчиками предусмотрено целых 73 значения. Например, чтобы преобразовать диаграмму в обычный график, можно использовать код вида:
Еще одна очень распространенная задача – добавить дополнительные ряды на диаграмму. Для этой цели необходимо создать и получить ссылку на объект Series – ряд, а потом для ряда определить свойство Values (ему передается в качестве значения объект Range):
Dim oSeries As Series
Set oSeries = oChart.SeriesCollection.NewSeries
Пользователи часто говорят, что им необходимо создавать диаграммы не на отдельном листе, а на том же листе, на котором расположены данные. По умолчанию диаграмма создается в оперативной памяти и помещается на отдельный лист. Если нам необходимо поместить ее на уже существующий лист, то в этом случае ее вначале надо создать на отдельном листе, а затем переместить при помощи метода Location. Отдельный лист, созданный для диаграммы, при этом автоматически исчезнет:
oChart.Location xlLocationAsObject, «Лист1»
Обратите внимание, что метод Location принимает в качестве первого параметра одну из констант (xlLocationAsNewSheet – переместить на специально создаваемый новый лист, xlLocationAsObject – переместить на объект, то есть лист), а в качестве второго – не объект листа, как можно было бы подумать, а обязательно его имя. Если код предполагается использовать и в русской, и в английской версии Excel, то предпочтительнее получить имя листа программным образом.
Большая неприятность, связанная с методом Location, заключается в том, что после перемещения диаграммы внутрь листа объектная ссылка на эту диаграмму теряется, и надо находить объект этой диаграммы заново. При попытке повторного обращения к объекту Chart выдается сообщение «Automation Error». Лучше всего поэтому вызов метода Location помещать в самый конец кода, посвященного диаграмме. В противном случае нам придется разыскивать созданную нами диаграмму и заново получать на нее объектную ссылку, например так:
Dim oSeries As Series
Set oSeries = Worksheets(1).ChartObjects(1).Chart.SeriesCollection.NewSeries
Так работать, конечно, намного менее удобно.
Остальные многочисленные параметры диаграммы настраиваются при помощи свойств и методов объектов Chart:
- свойство ChartArea — это свойство возвращает одноименный объект ChartArea, который представляет собой область, занимаемую диаграммой и используется для настройки внешнего вида диаграммы (свойства Font, Interior и т.п.). Если необходимо настроить внешний вид не всей диаграммы, а той ее части, которая используется непосредственно для вывода графика, используется схожее свойство PlotArea. По умолчанию диаграмма размещается прямо по центру листа. Если необходимо ее переместить в точно определенное место листа, используются знакомые на свойства Top, Height, Left и Width для объекта ChartArea.
- свойство ChartTitle возвращает одноименный объект, при помощи которого можно настроить заголовок диаграммы (с такими свойствами, как Text, Font, Border и т.п.);
- ChartType — важнейшее свойство, про которое мы уже говорили. Определяет тип диаграммы;
- HasDataTable — если установить это свойство в True, то в нижней части диаграммы (по умолчанию) появится таблица с числами, на основе которых была создана диаграмма. Одновременно будет создан программный объект DataTable, при помощи которого можно настроить представление этой таблицы. Схожим образом действуют свойства HasLegend, HasPivotFields и HasTitle.
- Name — это свойство позволяет настроить имя диаграммы (как название вкладки в Excel). По умолчанию диаграммы называются последовательно «Диаграмма1», «Диаграмма2» и т.п.
- SizeWithWindow — если поставить значение этого свойства в True (по умолчанию False), то размер диаграммы будет подогнан таким образом, чтобы точно соответствовать размеру листа.
- Tab — свойство, о котором мало кто подозревает. Оно позволяет настроить при помощи одноименного объекта внешний вид вкладки в книге Excel для диаграммы (или просто листа). Например, чтобы пометить вкладку зеленым, можно воспользоваться кодом
oChart.Tab.Color = RGB(0, 255, 0)
- Visible — возможность спрятать диаграмму без ее удаления.
Остальные свойства в основном относятся к настройке отображения трехмерных диаграмм и к защите диаграммы от изменения пользователем.
Теперь — о самых главных методах объекта Chart:
- метод Activate() используется очень часто. Он позволяет сделать диаграмму активной (то есть просто перейти на нее);
- метод ApplyCustomType() позволяет поместить создать диаграмму своего собственно пользовательского типа (для этого необходимо вначале создать шаблон для этого типа и поместить его в галерею);
- метод ApplyDataLabels() позволяет поместить на диаграмму метки для размещенных на ней данных. Этот метод принимает множество параметров, которые позволяют настроить отображение данных меток (показывать или не показывать значения и т.п.);
- метод Axes() возвращает объект, представляющий оси диаграммы. Затем этот объект можно использовать для настройки данных осей;
- ChartWizard() — этот метод позволяет быстро переформатировать диаграмму, как будто бы прошли на графическом экране при помощи мастера построения диаграмм и передали ему значения. Позволяет при помощи одной строки кода добиться того, что другими способами потребовало бы минимум несколько строк;
- Copy() — позволяет скопировать диаграмму в другое место книги (например, чтобы создать новую диаграмму, использовав в качестве основы существующую). Для переноса существующей диаграммы в другое место можно воспользоваться методами Location() или Move().
- CopyPicture() — замечательный метод, который позволяет поместить диаграмму в буфер обмена как изображение. Затем это изображение можно вставить, например, в документ Word или в любое другое место. Другой вариант — воспользоваться методом Export(), который позволяет создать рисунок, представляющий диаграмму, в виде файла на диске.
- Delete() — просто удаляет диаграмму;
- Evaluate() — как обычно, этот метод позволяет найти нужную диаграмму в книге по ее имени;
- PrintOut() — возможность отправить диаграмму на печать. Этот метод принимает множество параметров, которые позволяют настроить такой вывод;
- Refresh() — возможность обновить диаграмму, если изменились данные, на основе которых она строилась;
- Select() — возможность выделить диаграмму (равносильно щелчку по ней мышью). Deselect() — снятие выделения (равносильно нажатию на );
- SetBackgroundPicture() — возможность «подложить» под диаграмму фоновый рисунок. Конечно, он должен быть не очень ярким;
- SetSourceData() — важнейший метод, который позволяет определить данные, на основе которых строится диаграмма. Про него мы уже говорили.
Для объекта Chart предусмотрено также события «на все случаи жизни» — реакция на щелчки мышью, на выделение/снятие выделения, активизацию, пересчет данных, изменение размера и т.п., однако используются такие события на практике нечасто.
Источник
Объект Charts (Excel)
Коллекция всех листов диаграмм в указанной или активной книге.
Замечания
Каждый лист диаграммы представлен объектом Chart . Сюда не входят диаграммы, внедренные на листах или на листах диалоговых окон. Сведения о внедренных диаграммах см. в разделах Объекты Chart и ChartObject .
Пример
Используйте свойство Charts объекта Workbook , чтобы вернуть коллекцию Charts . В следующем примере отображаются все листы диаграмм в активной книге.
Используйте метод Add объекта ChartObjects , чтобы создать лист диаграммы и добавить его в книгу. В следующем примере новый лист диаграммы добавляется в активную книгу и помещает новый лист диаграммы сразу после листа с именем Лист1.
Метод Add можно объединить с методом ChartWizard объекта Chart, чтобы добавить новую диаграмму, содержащую данные с листа. В следующем примере добавляется новая графиковая диаграмма на основе данных в ячейках A1:A20 на листе с именем Лист1.
Чтобы вернуть один объект Chart, используйте синтаксис Charts (индекс), где индекс — это номер индекса или имя листа диаграммы. В следующем примере цвет ряда 1 на листе диаграммы 1 изменяется на красный.
Коллекция Листов содержит все листы книги (как листы диаграмм, так и листы). Используйте листы (индекс), где индекс — это имя или номер листа, чтобы вернуть один лист.
Методы
Свойства
См. также
Поддержка и обратная связь
Есть вопросы или отзывы, касающиеся Office VBA или этой статьи? Руководство по другим способам получения поддержки и отправки отзывов см. в статье Поддержка Office VBA и обратная связь.
Источник
Объект Chart (Excel)
Представляет диаграмму в книге.
Примечания
Диаграмма может представлять собой внедренную диаграмму (содержащуюся в объекте ChartObject) или отдельный лист диаграммы.
Коллекция Charts содержит объект Chart для каждого листа диаграммы в книге. Чтобы вернуть один объект Chart, используйте синтаксис Charts (индекс), где индекс — это номер индекса или имя листа диаграммы.
Номер индекса диаграммы представляет положение листа диаграммы на панели вкладок книги. Charts(1) — это первая (крайняя левая) диаграмма в книге; Charts(Charts.Count) — последняя (самая правая).
Все листы диаграмм включаются в число индексов, даже если они скрыты. Имя листа диаграммы отображается на вкладке книги для диаграммы. Используйте свойство Name объекта ChartObject, чтобы задать или возвратить имя диаграммы.
В следующем примере изменяется цвет ряда 1 на листе диаграммы 1.
В следующем примере диаграмма Sales (Продажи) перемещается в конец активной книги.
Объект Chart также является элементом коллекции Sheets, который содержит все листы книги (рабочие листы и листы диаграммы). Чтобы вернуть один лист, используйте синтаксис Sheets (индекс), где индекс — это номер индекса или имя листа.
Если диаграмма является активным объектом, для ссылки на нее можно использовать свойство ActiveChart. Лист диаграммы активен, если пользователь выбрал его или он активирован с помощью метода Activate объекта Chart или метода Activate объекта ChartObject.
В следующем примере активируется лист диаграммы 1, а затем задается тип и заголовок диаграммы.
Внедренная диаграмма активна, если пользователь выбрал ее или объект ChartObject, в котором она находится, активирован с помощью метода Activate.
В следующем примере активируется внедренная диаграмма 1 на листе 1, а затем задается тип и название диаграммы. Обратите внимание, что после активации внедренной диаграммы код в этом примере совпадает с предыдущим примером. С помощью свойства ActiveChart можно написать код на языке Visual Basic, который может ссылаться на внедренную диаграмму или на лист диаграммы (в зависимости от активного объекта).
Если лист диаграммы является активным листом, для ссылки на него можно использовать свойство ActiveSheet. В следующем примере используется метод Activate для активации листа диаграммы Chart1, а затем задается синий цвет для ряда 1 на диаграмме.
События
Методы
Свойства
См. также
Поддержка и обратная связь
Есть вопросы или отзывы, касающиеся Office VBA или этой статьи? Руководство по другим способам получения поддержки и отправки отзывов см. в статье Поддержка Office VBA и обратная связь.
Источник
In this Article
- Creating an Embedded Chart Using VBA
- Specifying a Chart Type Using VBA
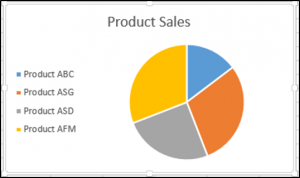
- Adding a Chart Title Using VBA
- Changing the Chart Background Color Using VBA
- Changing the Chart Plot Area Color Using VBA
- Adding a Legend Using VBA
- Adding Data Labels Using VBA
- Adding an X-axis and Title in VBA
- Adding a Y-axis and Title in VBA
- Changing the Number Format of An Axis
- Changing the Formatting of the Font in a Chart
- Deleting a Chart Using VBA
- Referring to the ChartObjects Collection
- Inserting a Chart on Its Own Chart Sheet
Excel charts and graphs are used to visually display data. In this tutorial, we are going to cover how to use VBA to create and manipulate charts and chart elements.
You can create embedded charts in a worksheet or charts on their own chart sheets.
Creating an Embedded Chart Using VBA
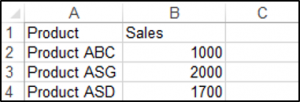
We have the range A1:B4 which contains the source data, shown below:
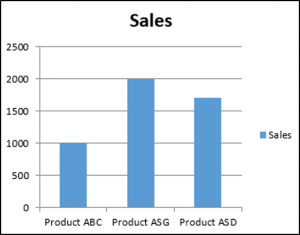
You can create a chart using the ChartObjects.Add method. The following code will create an embedded chart on the worksheet:
Sub CreateEmbeddedChartUsingChartObject()

Dim embeddedchart As ChartObject

Set embeddedchart = Sheets("Sheet1").ChartObjects.Add(Left:=180, Width:=300, Top:=7, Height:=200)
embeddedchart.Chart.SetSourceData Source:=Sheets("Sheet1").Range("A1:B4")

End Sub
The result is:
You can also create a chart using the Shapes.AddChart method. The following code will create an embedded chart on the worksheet:
Sub CreateEmbeddedChartUsingShapesAddChart()

Dim embeddedchart As Shape

Set embeddedchart = Sheets("Sheet1").Shapes.AddChart
embeddedchart.Chart.SetSourceData Source:=Sheets("Sheet1").Range("A1:B4")

End Sub
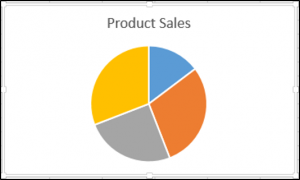
Specifying a Chart Type Using VBA
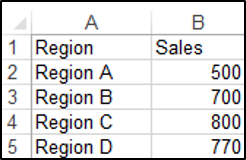
We have the range A1:B5 which contains the source data, shown below:
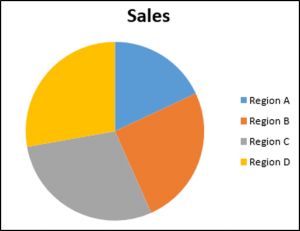
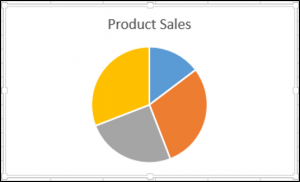
You can specify a chart type using the ChartType Property. The following code will create a pie chart on the worksheet since the ChartType Property has been set to xlPie:
Sub SpecifyAChartType()

Dim chrt As ChartObject

Set chrt = Sheets("Sheet1").ChartObjects.Add(Left:=180, Width:=270, Top:=7, Height:=210)
chrt.Chart.SetSourceData Source:=Sheets("Sheet1").Range("A1:B5")
chrt.Chart.ChartType = xlPie

End Sub
The result is:
These are some of the popular chart types that are usually specified, although there are others:
- xlArea
- xlPie
- xlLine
- xlRadar
- xlXYScatter
- xlSurface
- xlBubble
- xlBarClustered
- xlColumnClustered
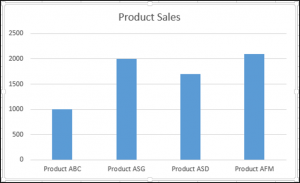
Adding a Chart Title Using VBA
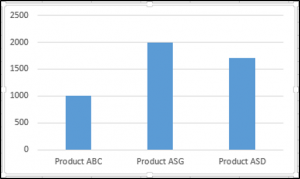
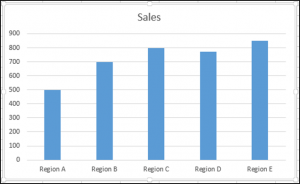
We have a chart selected in the worksheet as shown below:
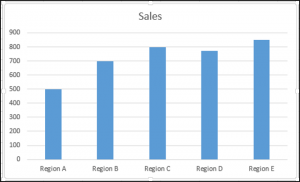
You have to add a chart title first using the Chart.SetElement method and then specify the text of the chart title by setting the ChartTitle.Text property.
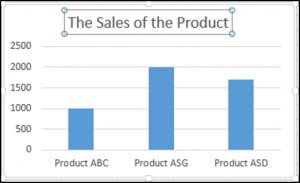
The following code shows you how to add a chart title and specify the text of the title of the Active Chart:
Sub AddingAndSettingAChartTitle()

ActiveChart.SetElement (msoElementChartTitleAboveChart)
    ActiveChart.ChartTitle.Text = "The Sales of the Product"

End Sub
The result is:
Note: You must select the chart first to make it the Active Chart to be able to use the ActiveChart object in your code.
Changing the Chart Background Color Using VBA
We have a chart selected in the worksheet as shown below:
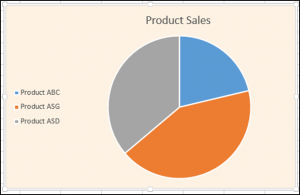
You can change the background color of the entire chart by setting the RGB property of the FillFormat object of the ChartArea object. The following code will give the chart a light orange background color:
Sub AddingABackgroundColorToTheChartArea()

ActiveChart.ChartArea.Format.Fill.ForeColor.RGB = RGB(253, 242, 227)

End Sub
The result is:
You can also change the background color of the entire chart by setting the ColorIndex property of the Interior object of the ChartArea object. The following code will give the chart an orange background color:
Sub AddingABackgroundColorToTheChartArea()

ActiveChart.ChartArea.Interior.ColorIndex = 40

End Sub
The result is:
Note: The ColorIndex property allows you to specify a color based on a value from 1 to 56, drawn from the preset palette, to see which values represent the different colors, click here.
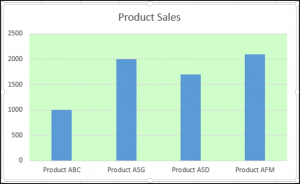
Changing the Chart Plot Area Color Using VBA
We have a chart selected in the worksheet as shown below:
You can change the background color of just the plot area of the chart, by setting the RGB property of the FillFormat object of the PlotArea object. The following code will give the plot area of the chart a light green background color:
Sub AddingABackgroundColorToThePlotArea()

ActiveChart.PlotArea.Format.Fill.ForeColor.RGB = RGB(208, 254, 202)

End Sub
The result is:
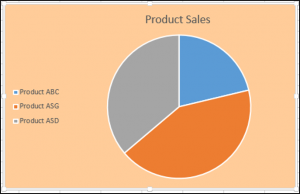
Adding a Legend Using VBA
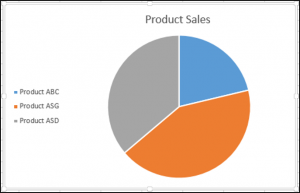
We have a chart selected in the worksheet, as shown below:
You can add a legend using the Chart.SetElement method. The following code adds a legend to the left of the chart:
Sub AddingALegend()

ActiveChart.SetElement (msoElementLegendLeft)

End Sub
The result is:
You can specify the position of the legend in the following ways:
- msoElementLegendLeft – displays the legend on the left side of the chart.
- msoElementLegendLeftOverlay – overlays the legend on the left side of the chart.
- msoElementLegendRight – displays the legend on the right side of the chart.
- msoElementLegendRightOverlay – overlays the legend on the right side of the chart.
- msoElementLegendBottom – displays the legend at the bottom of the chart.
- msoElementLegendTop – displays the legend at the top of the chart.
VBA Coding Made Easy
Stop searching for VBA code online. Learn more about AutoMacro — A VBA Code Builder that allows beginners to code procedures from scratch with minimal coding knowledge and with many time-saving features for all users!
Learn More
Adding Data Labels Using VBA
We have a chart selected in the worksheet, as shown below:
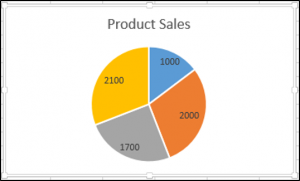
You can add data labels using the Chart.SetElement method. The following code adds data labels to the inside end of the chart:
Sub AddingADataLabels()

ActiveChart.SetElement msoElementDataLabelInsideEnd

End Sub
The result is:
You can specify how the data labels are positioned in the following ways:
- msoElementDataLabelShow – display data labels.
- msoElementDataLabelRight – displays data labels on the right of the chart.
- msoElementDataLabelLeft – displays data labels on the left of the chart.
- msoElementDataLabelTop – displays data labels at the top of the chart.
- msoElementDataLabelBestFit – determines the best fit.
- msoElementDataLabelBottom – displays data labels at the bottom of the chart.
- msoElementDataLabelCallout – displays data labels as a callout.
- msoElementDataLabelCenter – displays data labels on the center.
- msoElementDataLabelInsideBase – displays data labels on the inside base.
- msoElementDataLabelOutSideEnd – displays data labels on the outside end of the chart.
- msoElementDataLabelInsideEnd – displays data labels on the inside end of the chart.
Adding an X-axis and Title in VBA
We have a chart selected in the worksheet, as shown below:
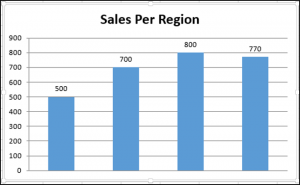
You can add an X-axis and X-axis title using the Chart.SetElement method. The following code adds an X-axis and X-axis title to the chart:
Sub AddingAnXAxisandXTitle()

With ActiveChart
.SetElement msoElementPrimaryCategoryAxisShow
.SetElement msoElementPrimaryCategoryAxisTitleHorizontal
End With


End Sub
The result is:
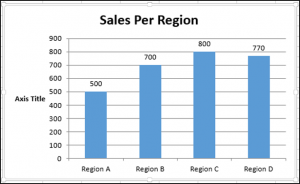
Adding a Y-axis and Title in VBA
We have a chart selected in the worksheet, as shown below:
You can add a Y-axis and Y-axis title using the Chart.SetElement method. The following code adds an Y-axis and Y-axis title to the chart:
Sub AddingAYAxisandYTitle()

With ActiveChart
.SetElement msoElementPrimaryValueAxisShow
.SetElement msoElementPrimaryValueAxisTitleHorizontal
End With
End Sub
The result is:
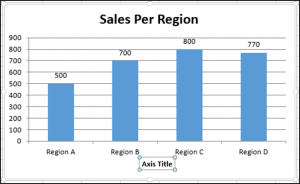
VBA Programming | Code Generator does work for you!
Changing the Number Format of An Axis
We have a chart selected in the worksheet, as shown below:
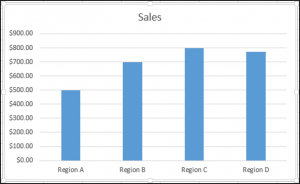
You can change the number format of an axis. The following code changes the number format of the y-axis to currency:
Sub ChangingTheNumberFormat()

ActiveChart.Axes(xlValue).TickLabels.NumberFormat = "$#,##0.00"

End Sub
The result is:
Changing the Formatting of the Font in a Chart
We have the following chart selected in the worksheet as shown below:
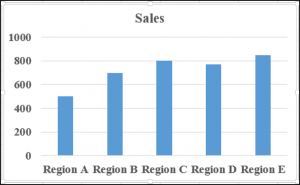
You can change the formatting of the entire chart font, by referring to the font object and changing its name, font weight, and size. The following code changes the type, weight and size of the font of the entire chart.
Sub ChangingTheFontFormatting()

With ActiveChart


.ChartArea.Format.TextFrame2.TextRange.Font.Name = "Times New Roman"
.ChartArea.Format.TextFrame2.TextRange.Font.Bold = True
.ChartArea.Format.TextFrame2.TextRange.Font.Size = 14

End With
The result is:
Deleting a Chart Using VBA
We have a chart selected in the worksheet, as shown below:
We can use the following code in order to delete this chart:
Sub DeletingTheChart()

ActiveChart.Parent.Delete

End Sub
Referring to the ChartObjects Collection
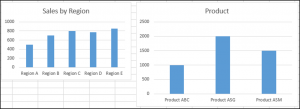
You can access all the embedded charts in your worksheet or workbook by referring to the ChartObjects collection. We have two charts on the same sheet shown below:
We will refer to the ChartObjects collection in order to give both charts on the worksheet the same height, width, delete the gridlines, make the background color the same, give the charts the same plot area color and make the plot area line color the same color:
Sub ReferringToAllTheChartsOnASheet()

Dim cht As ChartObject

For Each cht In ActiveSheet.ChartObjects
cht.Height = 144.85
cht.Width = 246.61

cht.Chart.Axes(xlValue).MajorGridlines.Delete
cht.Chart.PlotArea.Format.Fill.ForeColor.RGB = RGB(242, 242, 242)
cht.Chart.ChartArea.Format.Fill.ForeColor.RGB = RGB(234, 234, 234)
cht.Chart.PlotArea.Format.Line.ForeColor.RGB = RGB(18, 97, 172)

Next cht

End Sub
The result is:
Inserting a Chart on Its Own Chart Sheet
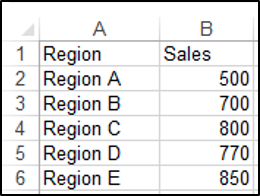
We have the range A1:B6 which contains the source data, shown below:
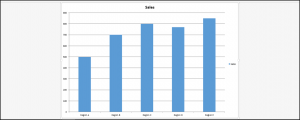
You can create a chart using the Charts.Add method. The following code will create a chart on its own chart sheet:
Sub InsertingAChartOnItsOwnChartSheet()

Sheets("Sheet1").Range("A1:B6").Select
Charts.Add

End Sub
The result is:
See some of our other charting tutorials:
Charts in Excel
Create a Bar Chart in VBA
Содержание
Диаграммы и графики Excel используются для визуального отображения данных. В этом руководстве мы расскажем, как использовать VBA для создания диаграмм и элементов диаграмм и управления ими.
Вы можете создавать встроенные диаграммы на листе или диаграммы на отдельных листах диаграмм.
Создание встроенной диаграммы с помощью VBA
У нас есть диапазон A1: B4, который содержит исходные данные, показанные ниже:
Вы можете создать диаграмму с помощью метода ChartObjects.Add. Следующий код создаст на листе встроенную диаграмму:
| 12345678 | Sub CreateEmbeddedChartUsingChartObject ()Уменьшить размер встроенной диаграммы как ChartObjectУстановите embeddedchart = Sheets («Sheet1»). ChartObjects.Add (Left: = 180, Width: = 300, Top: = 7, Height: = 200)embeddedchart.Chart.SetSourceData Источник: = Sheets («Sheet1»). Range («A1: B4»)Конец подписки |
Результат:
Вы также можете создать диаграмму с помощью метода Shapes.AddChart. Следующий код создаст на листе встроенную диаграмму:
| 12345678 | Подложка CreateEmbeddedChartUsingShapesAddChart ()Заменить встроенную диаграмму как фигуруУстановите embeddedchart = Sheets («Sheet1»). Shapes.AddChartembeddedchart.Chart.SetSourceData Source: = Sheets («Sheet1»). Range («A1: B4»)Конец подписки |
Указание типа диаграммы с помощью VBA
У нас есть диапазон A1: B5, который содержит исходные данные, показанные ниже:
Вы можете указать тип диаграммы, используя свойство ChartType. Следующий код создаст круговую диаграмму на листе, поскольку для свойства ChartType задано значение xlPie:
| 123456789 | Sub SpecifyAChartType ()Dim chrt как ChartObjectУстановите chrt = Sheets («Sheet1»). ChartObjects.Add (Left: = 180, Width: = 270, Top: = 7, Height: = 210)chrt.Chart.SetSourceData Source: = Sheets («Sheet1»). Range («A1: B5»)chrt.Chart.ChartType = xlPieКонец подписки |
Результат:
Вот некоторые из популярных типов диаграмм, которые обычно указываются, хотя есть и другие:
- xlArea
- xlPie
- xlLine
- xlRadar
- xlXYScatter
- xlSurface
- xlBubble
- xlBarClustered
- xlColumnClustered
Добавление заголовка диаграммы с помощью VBA
У нас есть диаграмма, выбранная на листе, как показано ниже:
Сначала необходимо добавить заголовок диаграммы с помощью метода Chart.SetElement, а затем указать текст заголовка диаграммы, установив свойство ChartTitle.Text.
В следующем коде показано, как добавить заголовок диаграммы и указать текст заголовка активной диаграммы:
| 123456 | Sub AddingAndSettingAChartTitle ()ActiveChart.SetElement (msoElementChartTitleAboveChart)ActiveChart.ChartTitle.Text = «Продажи продукта»Конец подписки |
Результат:
Примечание. Сначала необходимо выбрать диаграмму, чтобы сделать ее активной, чтобы можно было использовать объект ActiveChart в своем коде.
Изменение цвета фона диаграммы с помощью VBA
У нас есть диаграмма, выбранная на листе, как показано ниже:
Вы можете изменить цвет фона всей диаграммы, установив свойство RGB объекта FillFormat объекта ChartArea. Следующий код придаст диаграмме светло-оранжевый цвет фона:
| 12345 | Sub AddingABackgroundColorToTheChartArea ()ActiveChart.ChartArea.Format.Fill.ForeColor.RGB = RGB (253, 242, 227)Конец подписки |
Результат:
Вы также можете изменить цвет фона всей диаграммы, установив свойство ColorIndex объекта Interior объекта ChartArea. Следующий код придаст диаграмме оранжевый цвет фона:
| 12345 | Sub AddingABackgroundColorToTheChartArea ()ActiveChart.ChartArea.Interior.ColorIndex = 40Конец подписки |
Результат:
Примечание. Свойство ColorIndex позволяет указать цвет на основе значения от 1 до 56, взятого из предустановленной палитры, чтобы увидеть, какие значения представляют разные цвета, щелкните здесь.
Изменение цвета области графика диаграммы с помощью VBA
У нас есть диаграмма, выбранная на листе, как показано ниже:
Вы можете изменить цвет фона только области построения диаграммы, установив свойство RGB объекта FillFormat объекта PlotArea. Следующий код придаст области построения диаграммы светло-зеленый цвет фона:
| 12345 | Sub AddingABackgroundColorToThePlotArea ()ActiveChart.PlotArea.Format.Fill.ForeColor.RGB = RGB (208, 254, 202)Конец подписки |
Результат:
Добавление легенды с помощью VBA
У нас есть диаграмма, выбранная на листе, как показано ниже:
Вы можете добавить легенду с помощью метода Chart.SetElement. Следующий код добавляет легенду слева от диаграммы:
| 12345 | Подложка AddingALegend ()ActiveChart.SetElement (msoElementLegendLeft)Конец подписки |
Результат:
Вы можете указать положение легенды следующими способами:
- msoElementLegendLeft — отображает легенду в левой части диаграммы.
- msoElementLegendLeftOverlay — накладывает легенду на левую часть диаграммы.
- msoElementLegendRight — отображает легенду в правой части диаграммы.
- msoElementLegendRightOverlay — накладывает легенду на правую часть диаграммы.
- msoElementLegendBottom — отображает легенду внизу диаграммы.
- msoElementLegendTop — отображает легенду вверху диаграммы.
Добавление меток данных с помощью VBA
У нас есть диаграмма, выбранная на листе, как показано ниже:
Вы можете добавлять метки данных с помощью метода Chart.SetElement. Следующий код добавляет метки данных на внутренний конец диаграммы:
| 12345 | Sub AddingADataLabels ()ActiveChart.SetElement msoElementDataLabelInsideEndКонец подписки |
Результат:
Вы можете указать расположение меток данных следующими способами:
- msoElementDataLabelShow — отображать метки данных.
- msoElementDataLabelRight — отображает метки данных в правой части диаграммы.
- msoElementDataLabelLeft — отображает метки данных в левой части диаграммы.
- msoElementDataLabelTop — отображает метки данных вверху диаграммы.
- msoElementDataLabelBestFit — определяет наилучшее соответствие.
- msoElementDataLabelBottom — отображает метки данных внизу диаграммы.
- msoElementDataLabelCallout — отображает метки данных в виде выноски.
- msoElementDataLabelCenter — отображает метки данных в центре.
- msoElementDataLabelInsideBase — отображает метки данных на внутренней основе.
- msoElementDataLabelOutSideEnd — отображает метки данных на внешнем конце диаграммы.
- msoElementDataLabelInsideEnd — отображает метки данных на внутреннем конце диаграммы.
Добавление оси X и заголовка в VBA
У нас есть диаграмма, выбранная на листе, как показано ниже:
Вы можете добавить заголовок оси X и оси X с помощью метода Chart.SetElement. Следующий код добавляет к диаграмме заголовки осей X и X:
| 123456789 | Sub AddingAnXAxisandXTitle ()С ActiveChart.SetElement msoElementPrimaryCategoryAxisShow.SetElement msoElementPrimaryCategoryAxisTitleHorizontalКонец сКонец подписки |
Результат:
Добавление оси Y и заголовка в VBA
У нас есть диаграмма, выбранная на листе, как показано ниже:
Вы можете добавить заголовок оси Y и оси Y с помощью метода Chart.SetElement. Следующий код добавляет к диаграмме заголовки по осям Y и Y:
| 1234567 | Дополнительное добавлениеAYAxisandYTitle ()С ActiveChart.SetElement msoElementPrimaryValueAxisShow.SetElement msoElementPrimaryValueAxisTitleHorizontalКонец сКонец подписки |
Результат:
Изменение числового формата оси
У нас есть диаграмма, выбранная на листе, как показано ниже:
Вы можете изменить числовой формат оси. Следующий код изменяет числовой формат оси Y на валюту:
| 12345 | Sub ChangingTheNumberFormat ()ActiveChart.Axes (xlValue) .TickLabels.NumberFormat = «$ #, ## 0.00″Конец подписки |
Результат:
Изменение форматирования шрифта на диаграмме
У нас на листе выбрана следующая диаграмма, как показано ниже:
Вы можете изменить форматирование всего шрифта диаграммы, обратившись к объекту шрифта и изменив его имя, толщину и размер шрифта. Следующий код изменяет тип, вес и размер шрифта всей диаграммы.
| 12345678910 | Sub ChangingTheFontFormatting ()С ActiveChart.ChartArea.Format.TextFrame2.TextRange.Font.Name = «Times New Roman».ChartArea.Format.TextFrame2.TextRange.Font.Bold = Истина.ChartArea.Format.TextFrame2.TextRange.Font.Size = 14Конец с |
Результат:
Удаление диаграммы с помощью VBA
У нас есть диаграмма, выбранная на листе, как показано ниже:
Мы можем использовать следующий код, чтобы удалить эту диаграмму:
| 12345 | Sub DeletingTheChart ()ActiveChart.Parent.DeleteКонец подписки |
Ссылаясь на коллекцию ChartObjects
Вы можете получить доступ ко всем встроенным диаграммам на листе или в книге, обратившись к коллекции ChartObjects. У нас есть две диаграммы на одном листе, показанном ниже:
Мы обратимся к коллекции ChartObjects, чтобы дать обеим диаграммам на листе одинаковую высоту и ширину, удалить линии сетки, сделать цвет фона одинаковым, дать диаграммам одинаковый цвет области графика и сделать одинаковый цвет линии области графика. цвет:
| 12345678910111213141516 | Sub ReferringToAllTheChartsOnASheet ()Dim cht As ChartObjectДля каждого cht в ActiveSheet.ChartObjectscht.Height = 144,85cht.Width = 246,61cht.Chart.Axes (xlValue) .MajorGridlines.Deletecht.Chart.PlotArea.Format.Fill.ForeColor.RGB = RGB (242, 242, 242)cht.Chart.ChartArea.Format.Fill.ForeColor.RGB = RGB (234, 234, 234)cht.Chart.PlotArea.Format.Line.ForeColor.RGB = RGB (18, 97, 172)Следующий чтКонец подписки |
Результат:
Вставка диаграммы на отдельный лист диаграммы
У нас есть диапазон A1: B6, который содержит исходные данные, показанные ниже:
Вы можете создать диаграмму, используя метод Charts.Add. Следующий код создаст диаграмму на собственном листе диаграммы:
| 123456 | Sub InsertingAChartOnItsOwnChartSheet ()Листы («Лист1»). Диапазон («A1: B6»). ВыберитеCharts.AddКонец подписки |
Результат:
См. Некоторые из наших других руководств по построению графиков:
Графики в Excel
Создайте гистограмму в VBA
Charts and graphs are one of the best features of Excel; they are very flexible and can be used to make some very advanced visualization. However, this flexibility means there are hundreds of different options. We can create exactly the visualization we want but it can be time-consuming to apply. When we want to apply those hundreds of settings to lots of charts, it can take hours and hours of frustrating clicking. This post is a guide to using VBA for Charts and Graphs in Excel.
The code examples below demonstrate some of the most common chart options with VBA. Hopefully you can put these to good use and automate your chart creation and modifications.
While it might be tempting to skip straight to the section you need, I recommend you read the first section in full. Understanding the Document Object Model (DOM) is essential to understand how VBA can be used with charts and graphs in Excel.
In Excel 2013, many changes were introduced to the charting engine and Document Object Model. For example, the AddChart2 method replaced the AddChart method. As a result, some of the code presented in this post may not work with versions before Excel 2013.
Adapting the code to your requirements
It is not feasible to provide code for every scenario you might come across; there are just too many. But, by applying the principles and methods in this post, you will be able to do almost anything you want with charts in Excel using VBA.
Understanding the Document Object Model
The Document Object Model (DOM) is a term that describes how things are structured in Excel. For example:
- A Workbook contains Sheets
- A Sheet contains Ranges
- A Range contains an Interior
- An Interior contains a color setting
Therefore, to change a cell color to red, we would reference this as follows:
ActiveWorkbook.Sheets("Sheet1").Range("A1").Interior.Color = RGB(255, 0, 0)Charts are also part of the DOM and follow similar hierarchical principles. To change the height of Chart 1, on Sheet1, we could use the following.
ActiveWorkbook.Sheets("Sheet1").ChartObjects("Chart 1").Height = 300Each item in the object hierarchy must be listed and separated by a period ( . ).
Knowing the document object model is the key to success with VBA charts. Therefore, we need to know the correct order inside the object model. While the following code may look acceptable, it will not work.
ActiveWorkbook.ChartObjects("Chart 1").Height = 300In the DOM, the ActiveWorkbook does not contain ChartObjects, so Excel cannot find Chart 1. The parent of a ChartObject is a Sheet, and the Parent of a Sheet is a Workbook. We must include the Sheet in the hierarchy for Excel to know what you want to do.
ActiveWorkbook.Sheets("Sheet1").ChartObjects("Chart 1").Height = 300With this knowledge, we can refer to any element of any chart using Excel’s DOM.
Chart Objects vs. Charts vs. Chart Sheets
One of the things which makes the DOM for charts complicated is that many things exist in many places. For example, a chart can be an embedded chart on the face of a worksheet, or as a separate chart sheet.
- On the worksheet itself, we find ChartObjects. Within each ChartObject is a Chart. Effectively a ChartObject is a container that holds a Chart.
- A Chart is also a stand-alone sheet that does not have a ChartObject around it.
This may seem confusing initially, but there are good reasons for this.
To change the chart title text, we would reference the two types of chart differently:
- Chart on a worksheet:
Sheets(“Sheet1”).ChartObjects(“Chart 1”).Chart.ChartTitle.Text = “My Chart Title” - Chart sheet:
Sheets(“Chart 1”).ChartTitle.Text = “My Chart Title”
The sections in bold are exactly the same. This shows that once we have got inside the Chart, the DOM is the same.
Writing code to work on either chart type
We want to write code that will work on any chart; we do this by creating a variable that holds the reference to a Chart.
Create a variable to refer to a Chart inside a ChartObject:
Dim cht As Chart
Set cht = Sheets("Sheet1").ChartObjects("Chart 1").Chart
Create a variable to refer to a Chart which is a sheet:
Dim cht As Chart
Set cht = Sheets("Chart 1")
Now we can write VBA code for a Chart sheet or a chart inside a ChartObject by referring to the Chart using cht:
cht.ChartTitle.Text = "My Chart Title"OK, so now we’ve established how to reference charts and briefly covered how the DOM works. It is time to look at lots of code examples.
Inserting charts
In this first section, we create charts. Please note that some of the individual lines of code are included below in their relevant sections.
Create a chart from a blank chart
Sub CreateChart()

'Declare variables
Dim rng As Range
Dim cht As Object

'Create a blank chart
  Set cht = ActiveSheet.Shapes.AddChart2

'Declare the data range for the chart
  Set rng = ActiveSheet.Range("A2:B9")

'Add the data to the chart
  cht.Chart.SetSourceData Source:=rng

'Set the chart type
  cht.Chart.ChartType = xlColumnClustered

End Sub
Reference charts on a worksheet
In this section, we look at the methods used to reference a chart contained on a worksheet.
Active Chart
Create a Chart variable to hold the ActiveChart:
Dim cht As Chart
Set cht = ActiveChart
Chart Object by name
Create a Chart variable to hold a specific chart by name.
Dim cht As Chart
Set cht = Sheets("Sheet1").ChartObjects("Chart 1").Chart
Chart object by number
If there are multiple charts on a worksheet, they can be referenced by their number:
- 1 = the first chart created
- 2 = the second chart created
- etc, etc.
Dim cht As Chart
Set cht = Sheets("Sheet1").ChartObjects(1).Chart
Loop through all Chart Objects
If there are multiple ChartObjects on a worksheet, we can loop through each:
Dim chtObj As ChartObject

For Each chtObj In Sheets("Sheet1").ChartObjects

    'Include the code to be applied to each ChartObjects
    'refer to the Chart using chtObj.cht.

Next chtObj
Loop through all selected Chart Objects
If we only want to loop through the selected ChartObjects we can use the following code.
This code is tricky to apply as Excel operates differently when one chart is selected, compared to multiple charts. Therefore, as a way to apply the Chart settings, without the need to repeat a lot of code, I recommend calling another macro and passing the Chart as an argument to that macro.
Dim obj As Object

'Check if any charts have been selected
If Not ActiveChart Is Nothing Then

    Call AnotherMacro(ActiveChart)

Else
    For Each obj In Selection

    'If more than one chart selected
    If TypeName(obj) = "ChartObject" Then

        Call AnotherMacro(obj.Chart)

    End If
Next

End If
Reference chart sheets
Now let’s move on to look at the methods used to reference a separate chart sheet.
Active Chart
Set up a Chart variable to hold the ActiveChart:
Dim cht As Chart
Set cht = ActiveChart
Note: this is the same code as when referencing the active chart on the worksheet.
Chart sheet by name
Set up a Chart variable to hold a specific chart sheet
Dim cht As Chart
Set cht = Sheets("Chart 1")
Loop through all chart sheets in a workbook
The following code will loop through all the chart sheets in the active workbook.
Dim cht As Chart

For Each cht In ActiveWorkbook.Charts

    Call AnotherMacro(cht)

Next cht
Basic chart settings
This section contains basic chart settings.
All codes start with cht., as they assume a chart has been referenced using the codes above.
Change chart type
'Change chart type - these are common examples, others do exist.
cht.ChartType = xlArea
cht.ChartType = xlLine
cht.ChartType = xlPie
cht.ChartType = xlColumnClustered
cht.ChartType = xlColumnStacked
cht.ChartType = xlColumnStacked100
cht.ChartType = xlArea
cht.ChartType = xlAreaStacked
cht.ChartType = xlBarClustered
cht.ChartType = xlBarStacked
cht.ChartType = xlBarStacked100
Create an empty ChartObject on a worksheet
'Create an empty chart embedded on a worksheet.
Set cht = Sheets("Sheet1").Shapes.AddChart2.Chart
Select the source for a chart
'Select source for a chart
Dim rng As Range
Set rng = Sheets("Sheet1").Range("A1:B4")
cht.SetSourceData Source:=rng
Delete a chart object or chart sheet
'Delete a ChartObject or Chart sheet
If TypeName(cht.Parent) = "ChartObject" Then

    cht.Parent.Delete

ElseIf TypeName(cht.Parent) = "Workbook" Then

    cht.Delete

End If
Change the size or position of a chart
'Set the size/position of a ChartObject - method 1
cht.Parent.Height = 200
cht.Parent.Width = 300
cht.Parent.Left = 20
cht.Parent.Top = 20

'Set the size/position of a ChartObject - method 2
chtObj.Height = 200
chtObj.Width = 300
chtObj.Left = 20
chtObj.Top = 20
Change the visible cells setting
'Change the setting to show only visible cells
cht.PlotVisibleOnly = False
Change the space between columns/bars (gap width)
'Change the gap space between bars
cht.ChartGroups(1).GapWidth = 50
Change the overlap of columns/bars
'Change the overlap setting of bars
cht.ChartGroups(1).Overlap = 75
Remove outside border from chart object
'Remove the outside border from a chart
cht.ChartArea.Format.Line.Visible = msoFalse
Change color of chart background
'Set the fill color of the chart area
cht.ChartArea.Format.Fill.ForeColor.RGB = RGB(255, 0, 0)

'Set chart with no background color
cht.ChartArea.Format.Fill.Visible = msoFalse
Chart Axis
Charts have four axis:
- xlValue
- xlValue, xlSecondary
- xlCategory
- xlCategory, xlSecondary
These are used interchangeably in the examples below. To adapt the code to your specific requirements, you need to change the chart axis which is referenced in the brackets.
All codes start with cht., as they assume a chart has been referenced using the codes earlier in this post.
Set min and max of chart axis
'Set chart axis min and max
cht.Axes(xlValue).MaximumScale = 25
cht.Axes(xlValue).MinimumScale = 10
cht.Axes(xlValue).MaximumScaleIsAuto = True
cht.Axes(xlValue).MinimumScaleIsAuto = True
Display or hide chart axis
'Display axis
cht.HasAxis(xlCategory) = True

'Hide axis
cht.HasAxis(xlValue, xlSecondary) = False
Display or hide chart title
'Display axis title
cht.Axes(xlCategory, xlSecondary).HasTitle = True

'Hide axis title
cht.Axes(xlValue).HasTitle = False
Change chart axis title text
'Change axis title text
cht.Axes(xlCategory).AxisTitle.Text = "My Axis Title"
Reverse the order of a category axis
'Reverse the order of a catetory axis
cht.Axes(xlCategory).ReversePlotOrder = True

'Set category axis to default order
cht.Axes(xlCategory).ReversePlotOrder = False
Gridlines
Gridlines help a user to see the relative position of an item compared to the axis.
Add or delete gridlines
'Add gridlines
cht.SetElement (msoElementPrimaryValueGridLinesMajor)
cht.SetElement (msoElementPrimaryCategoryGridLinesMajor)
cht.SetElement (msoElementPrimaryValueGridLinesMinorMajor)
cht.SetElement (msoElementPrimaryCategoryGridLinesMinorMajor)

'Delete gridlines
cht.Axes(xlValue).MajorGridlines.Delete
cht.Axes(xlValue).MinorGridlines.Delete
cht.Axes(xlCategory).MajorGridlines.Delete
cht.Axes(xlCategory).MinorGridlines.Delete
Change color of gridlines
'Change colour of gridlines
cht.Axes(xlValue).MajorGridlines.Format.Line.ForeColor.RGB = RGB(255, 0, 0)
Change transparency of gridlines
'Change transparency of gridlines
cht.Axes(xlValue).MajorGridlines.Format.Line.Transparency = 0.5
Chart Title
The chart title is the text at the top of the chart.
All codes start with cht., as they assume a chart has been referenced using the codes earlier in this post.
Display or hide chart title
'Display chart title
cht.HasTitle = True

'Hide chart title
cht.HasTitle = False
Change chart title text
'Change chart title text
cht.ChartTitle.Text = "My Chart Title"
Position the chart title
'Position the chart title
cht.ChartTitle.Left = 10
cht.ChartTitle.Top = 10
Format the chart title
'Format the chart title
cht.ChartTitle.TextFrame2.TextRange.Font.Name = "Calibri"
cht.ChartTitle.TextFrame2.TextRange.Font.Size = 16
cht.ChartTitle.TextFrame2.TextRange.Font.Bold = msoTrue
cht.ChartTitle.TextFrame2.TextRange.Font.Bold = msoFalse
cht.ChartTitle.TextFrame2.TextRange.Font.Italic = msoTrue
cht.ChartTitle.TextFrame2.TextRange.Font.Italic = msoFalse
Chart Legend
The chart legend provides a color key to identify each series in the chart.
Display or hide the chart legend
'Display the legend
cht.HasLegend = True

'Hide the legend
cht.HasLegend = False
Position the legend
'Position the legend
cht.Legend.Position = xlLegendPositionTop
cht.Legend.Position = xlLegendPositionRight
cht.Legend.Position = xlLegendPositionLeft
cht.Legend.Position = xlLegendPositionCorner
cht.Legend.Position = xlLegendPositionBottom

'Allow legend to overlap the chart.
'False = allow overlap, True = due not overlap
cht.Legend.IncludeInLayout = False
cht.Legend.IncludeInLayout = True

'Move legend to a specific point
cht.Legend.Left = 20
cht.Legend.Top = 200
cht.Legend.Width = 100
cht.Legend.Height = 25
Plot Area
The Plot Area is the main body of the chart which contains the lines, bars, areas, bubbles, etc.
All codes start with cht., as they assume a chart has been referenced using the codes earlier in this post.
Background color of Plot Area
'Set background color of the plot area
cht.PlotArea.Format.Fill.ForeColor.RGB = RGB(255, 0, 0)


'Set plot area to no background color
cht.PlotArea.Format.Fill.Visible = msoFalse
Set position of Plot Area
'Set the size and position of the PlotArea. Top and Left are relative to the Chart Area.
cht.PlotArea.Left = 20
cht.PlotArea.Top = 20
cht.PlotArea.Width = 200
cht.PlotArea.Height = 150
Chart series
Chart series are the individual lines, bars, areas for each category.
All codes starting with srs. assume a chart’s series has been assigned to a variable.
Add a new chart series
'Add a new chart series
Set srs = cht.SeriesCollection.NewSeries
srs.Values = "=Sheet1!$C$2:$C$6"
srs.Name = "=""New Series"""

'Set the values for the X axis when using XY Scatter
srs.XValues = "=Sheet1!$D$2:$D$6"
Reference a chart series
Set up a Series variable to hold a chart series:
- 1 = First chart series
- 2 = Second chart series
- etc, etc.
Dim srs As Series
Set srs = cht.SeriesCollection(1)
Referencing a chart series by name
Dim srs As Series
Set srs = cht.SeriesCollection("Series Name")
Delete a chart series
'Delete chart series
srs.Delete
Loop through each chart series
Dim srs As Series
For Each srs In cht.SeriesCollection

    'Do something to each series
    'See the codes below starting with "srs."

Next srs
Change series data
'Change series source data and name
srs.Values = "=Sheet1!$C$2:$C$6"
srs.Name = "=""Change Series Name"""
Changing fill or line colors
'Change fill colour
srs.Format.Fill.ForeColor.RGB = RGB(255, 0, 0)

'Change line colour
srs.Format.Line.ForeColor.RGB = RGB(255, 0, 0)
Changing visibility
'Change visibility of line
srs.Format.Line.Visible = msoTrue
Changing line weight
'Change line weight
srs.Format.Line.Weight = 10
Changing line style
'Change line style
srs.Format.Line.DashStyle = msoLineDash
srs.Format.Line.DashStyle = msoLineSolid
srs.Format.Line.DashStyle = msoLineSysDot
srs.Format.Line.DashStyle = msoLineSysDash
srs.Format.Line.DashStyle = msoLineDashDot
srs.Format.Line.DashStyle = msoLineLongDash
srs.Format.Line.DashStyle = msoLineLongDashDot
srs.Format.Line.DashStyle = msoLineLongDashDotDot
Formatting markers
'Changer marker type
srs.MarkerStyle = xlMarkerStyleAutomatic
srs.MarkerStyle = xlMarkerStyleCircle
srs.MarkerStyle = xlMarkerStyleDash
srs.MarkerStyle = xlMarkerStyleDiamond
srs.MarkerStyle = xlMarkerStyleDot
srs.MarkerStyle = xlMarkerStyleNone

'Change marker border color
srs.MarkerForegroundColor = RGB(255, 0, 0)

'Change marker fill color
srs.MarkerBackgroundColor = RGB(255, 0, 0)

'Change marker size
srs.MarkerSize = 8
Data labels
Data labels display additional information (such as the value, or series name) to a data point in a chart series.
All codes starting with srs. assume a chart’s series has been assigned to a variable.
Display or hide data labels
'Display data labels on all points in the series
srs.HasDataLabels = True

'Hide data labels on all points in the series
srs.HasDataLabels = False
Change the position of data labels
'Position data labels
'The label position must be a valid option for the chart type.
srs.DataLabels.Position = xlLabelPositionAbove
srs.DataLabels.Position = xlLabelPositionBelow
srs.DataLabels.Position = xlLabelPositionLeft
srs.DataLabels.Position = xlLabelPositionRight
srs.DataLabels.Position = xlLabelPositionCenter
srs.DataLabels.Position = xlLabelPositionInsideEnd
srs.DataLabels.Position = xlLabelPositionInsideBase
srs.DataLabels.Position = xlLabelPositionOutsideEnd
Error Bars
Error bars were originally intended to show variation (e.g. min/max values) in a value. However, they also commonly used in advanced chart techniques to create additional visual elements.
All codes starting with srs. assume a chart’s series has been assigned to a variable.
Turn error bars on/off
'Turn error bars on/off
srs.HasErrorBars = True
srs.HasErrorBars = False
Error bar end cap style
'Change end style of error bar
srs.ErrorBars.EndStyle = xlNoCap
srs.ErrorBars.EndStyle = xlCap
Error bar color
'Change color of error bars
srs.ErrorBars.Format.Line.ForeColor.RGB = RGB(255, 0, 0)
Error bar thickness
'Change thickness of error bars
srs.ErrorBars.Format.Line.Weight = 5
Error bar direction settings
'Error bar settings
srs.ErrorBar Direction:=xlY, _
    Include:=xlPlusValues, _
    Type:=xlFixedValue, _
    Amount:=100
'Alternatives options for the error bar settings are
'Direction:=xlX
'Include:=xlMinusValues
'Include:=xlPlusValues
'Include:=xlBoth
'Type:=xlFixedValue
'Type:=xlPercent
'Type:=xlStDev
'Type:=xlStError
'Type:=xlCustom

'Applying custom values to error bars
srs.ErrorBar Direction:=xlY, _
    Include:=xlPlusValues, _
    Type:=xlCustom, _
    Amount:="=Sheet1!$A$2:$A$7", _
    MinusValues:="=Sheet1!$A$2:$A$7"
Data points
Each data point on a chart series is known as a Point.
Reference a specific point
The following code will reference the first Point.
1 = First chart series
2 = Second chart series
etc, etc.
Dim srs As Series
Dim pnt As Point

Set srs = cht.SeriesCollection(1)
Set pnt = srs.Points(1)
Loop through all points
Dim srs As Series
Dim pnt As Point

Set srs = cht.SeriesCollection(1)

For Each pnt In srs.Points

    'Do something to each point, using "pnt."

Next pnt
Point example VBA codes
Points have similar properties to Series, but the properties are applied to a single data point in the series rather than the whole series. See a few examples below, just to give you the idea.
Turn on data label for a point
'Turn on data label
pnt.HasDataLabel = True
Set the data label position for a point
'Set the position of a data label
pnt.DataLabel.Position = xlLabelPositionCenter
Other useful chart macros
In this section, I’ve included other useful chart macros which are not covered by the example codes above.
Make chart cover cell range
The following code changes the location and size of the active chart to fit directly over the range G4:N20
Sub FitChartToRange()

'Declare variables
Dim cht As Chart
Dim rng As Range

'Assign objects to variables
Set cht = ActiveChart
Set rng = ActiveSheet.Range("G4:N20")

'Move and resize chart
cht.Parent.Left = rng.Left
cht.Parent.Top = rng.Top
cht.Parent.Width = rng.Width
cht.Parent.Height = rng.Height

End Sub
Export the chart as an image
The following code saves the active chart to an image in the predefined location
Sub ExportSingleChartAsImage()

'Create a variable to hold the path and name of image
Dim imagePath As String
Dim cht As Chart

imagePath = "C:UsersmarksDocumentsmyImage.png"
Set cht = ActiveChart

'Export the chart
cht.Export (imagePath)

End Sub
Resize all charts to the same size as the active chart
The following code resizes all charts on the Active Sheet to be the same size as the active chart.
Sub ResizeAllCharts()

'Create variables to hold chart dimensions
Dim chtHeight As Long
Dim chtWidth As Long

'Create variable to loop through chart objects
Dim chtObj As ChartObject

'Get the size of the first selected chart
chtHeight = ActiveChart.Parent.Height
chtWidth = ActiveChart.Parent.Width

For Each chtObj In ActiveSheet.ChartObjects

    chtObj.Height = chtHeight
    chtObj.Width = chtWidth

Next chtObj

End Sub
Bringing it all together
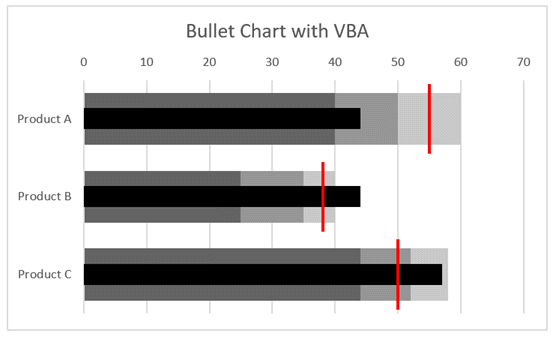
Just to prove how we can use these code snippets, I have created a macro to build bullet charts.
This isn’t necessarily the most efficient way to write the code, but it is to demonstrate that by understanding the code above we can create a lot of charts.
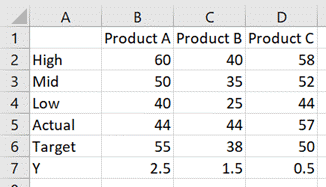
The data looks like this:
The chart looks like this:
The code which achieves this is as follows:
Sub CreateBulletChart()

Dim cht As Chart
Dim srs As Series
Dim rng As Range

'Create an empty chart
Set cht = Sheets("Sheet3").Shapes.AddChart2.Chart

'Change chart title text
cht.ChartTitle.Text = "Bullet Chart with VBA"

'Hide the legend
cht.HasLegend = False

'Change chart type
cht.ChartType = xlBarClustered

'Select source for a chart
Set rng = Sheets("Sheet3").Range("A1:D4")
cht.SetSourceData Source:=rng

'Reverse the order of a catetory axis
cht.Axes(xlCategory).ReversePlotOrder = True

'Change the overlap setting of bars
cht.ChartGroups(1).Overlap = 100

'Change the gap space between bars
cht.ChartGroups(1).GapWidth = 50

'Change fill colour
Set srs = cht.SeriesCollection(1)
srs.Format.Fill.ForeColor.RGB = RGB(200, 200, 200)

Set srs = cht.SeriesCollection(2)
srs.Format.Fill.ForeColor.RGB = RGB(150, 150, 150)

Set srs = cht.SeriesCollection(3)
srs.Format.Fill.ForeColor.RGB = RGB(100, 100, 100)

'Add a new chart series
Set srs = cht.SeriesCollection.NewSeries
srs.Values = "=Sheet3!$B$7:$D$7"
srs.XValues = "=Sheet3!$B$5:$D$5"
srs.Name = "=""Actual"""

'Change chart type
srs.ChartType = xlXYScatter

'Turn error bars on/off
srs.HasErrorBars = True

'Change end style of error bar
srs.ErrorBars.EndStyle = xlNoCap

'Set the error bars
srs.ErrorBar Direction:=xlY, _
    Include:=xlNone, _
    Type:=xlErrorBarTypeCustom

srs.ErrorBar Direction:=xlX, _
    Include:=xlMinusValues, _
    Type:=xlPercent, _
    Amount:=100

'Change color of error bars
srs.ErrorBars.Format.Line.ForeColor.RGB = RGB(0, 0, 0)

'Change thickness of error bars
srs.ErrorBars.Format.Line.Weight = 14

'Change marker type
srs.MarkerStyle = xlMarkerStyleNone

'Add a new chart series
Set srs = cht.SeriesCollection.NewSeries
srs.Values = "=Sheet3!$B$7:$D$7"
srs.XValues = "=Sheet3!$B$6:$D$6"
srs.Name = "=""Target"""

'Change chart type
srs.ChartType = xlXYScatter

'Turn error bars on/off
srs.HasErrorBars = True

'Change end style of error bar
srs.ErrorBars.EndStyle = xlNoCap

srs.ErrorBar Direction:=xlX, _
    Include:=xlNone, _
    Type:=xlErrorBarTypeCustom

srs.ErrorBar Direction:=xlY, _
    Include:=xlBoth, _
    Type:=xlFixedValue, _
    Amount:=0.45

'Change color of error bars
srs.ErrorBars.Format.Line.ForeColor.RGB = RGB(255, 0, 0)

'Change thickness of error bars
srs.ErrorBars.Format.Line.Weight = 2

'Changer marker type
srs.MarkerStyle = xlMarkerStyleNone

'Set chart axis min and max
cht.Axes(xlValue, xlSecondary).MaximumScale = cht.SeriesCollection(1).Points.Count
cht.Axes(xlValue, xlSecondary).MinimumScale = 0

'Hide axis
cht.HasAxis(xlValue, xlSecondary) = False

End Sub
Using the Macro Recorder for VBA for charts and graphs
The Macro Recorder is one of the most useful tools for writing VBA for Excel charts. The DOM is so vast that it can be challenging to know how to refer to a specific object, property or method. Studying the code produced by the Macro Recorder will provide the parts of the DOM which you don’t know.
As a note, the Macro Recorder creates poorly constructed code; it selects each object before manipulating it (this is what you did with the mouse after all). But this is OK for us. Once we understand the DOM, we can take just the parts of the code we need and ensure we put them into the right part of the hierarchy.
Conclusion
As you’ve seen in this post, the Document Object Model for charts and graphs in Excel is vast (and we’ve only scratched the surface.
I hope that through all the examples in this post you have a better understanding of VBA for charts and graphs in Excel. With this knowledge, I’m sure you will be able to automate your chart creation and modification.
Have I missed any useful codes? If so, put them in the comments.
Looking for other detailed VBA guides? Check out these posts:
- VBA for Tables & List Objects
- VBA for PivotTables
- VBA to insert, move, delete and control pictures
About the author
Hey, I’m Mark, and I run Excel Off The Grid.
My parents tell me that at the age of 7 I declared I was going to become a qualified accountant. I was either psychic or had no imagination, as that is exactly what happened. However, it wasn’t until I was 35 that my journey really began.
In 2015, I started a new job, for which I was regularly working after 10pm. As a result, I rarely saw my children during the week. So, I started searching for the secrets to automating Excel. I discovered that by building a small number of simple tools, I could combine them together in different ways to automate nearly all my regular tasks. This meant I could work less hours (and I got pay raises!). Today, I teach these techniques to other professionals in our training program so they too can spend less time at work (and more time with their children and doing the things they love).
Do you need help adapting this post to your needs?
I’m guessing the examples in this post don’t exactly match your situation. We all use Excel differently, so it’s impossible to write a post that will meet everybody’s needs. By taking the time to understand the techniques and principles in this post (and elsewhere on this site), you should be able to adapt it to your needs.
But, if you’re still struggling you should:
- Read other blogs, or watch YouTube videos on the same topic. You will benefit much more by discovering your own solutions.
- Ask the ‘Excel Ninja’ in your office. It’s amazing what things other people know.
- Ask a question in a forum like Mr Excel, or the Microsoft Answers Community. Remember, the people on these forums are generally giving their time for free. So take care to craft your question, make sure it’s clear and concise. List all the things you’ve tried, and provide screenshots, code segments and example workbooks.
- Use Excel Rescue, who are my consultancy partner. They help by providing solutions to smaller Excel problems.
What next?
Don’t go yet, there is plenty more to learn on Excel Off The Grid. Check out the latest posts:


