
Use Excel to perform valuation modeling
What is Valuation Modeling in Excel?
Valuation modeling in Excel may refer to several different types of analysis, including discounted cash flow (DCF) analysis, comparable trading multiples, precedent transactions, and ratios such as vertical and horizontal analysis. The various types of analyses may be built from scratch in Excel or may use an existing template/model. This type of work is commonly performed by a wide range of finance professionals.
Why perform valuation modeling in Excel?
There are many reasons to perform valuation modeling in Excel, and professionals across a wide range of industries spend a significant amount of time doing exactly this kind of work. The reasons include:
- Preparing to raise capital from investors (i.e., determining what price shares should be issued at)
- Selling a business and identifying what range of prices to accept
- Acquiring a company and knowing how much to pay for it
- For issuing shares to employees (an Employee Share Ownership Plan or ESOP)
- Internal budgeting and planning purposes
- Succession planning for the business
- Evaluate investment opportunities and capital projects
- Impairment testing (related to any significant reduction in asset values)
- Legal proceedings, including insolvency
How to perform valuation modeling in Excel?
As noted above, there are three primary methods for valuing a company. Discounted cash flow, or DCF, analysis is the most detailed method, and often the most relied upon approach. Below is a description of how to perform each type of modeling.
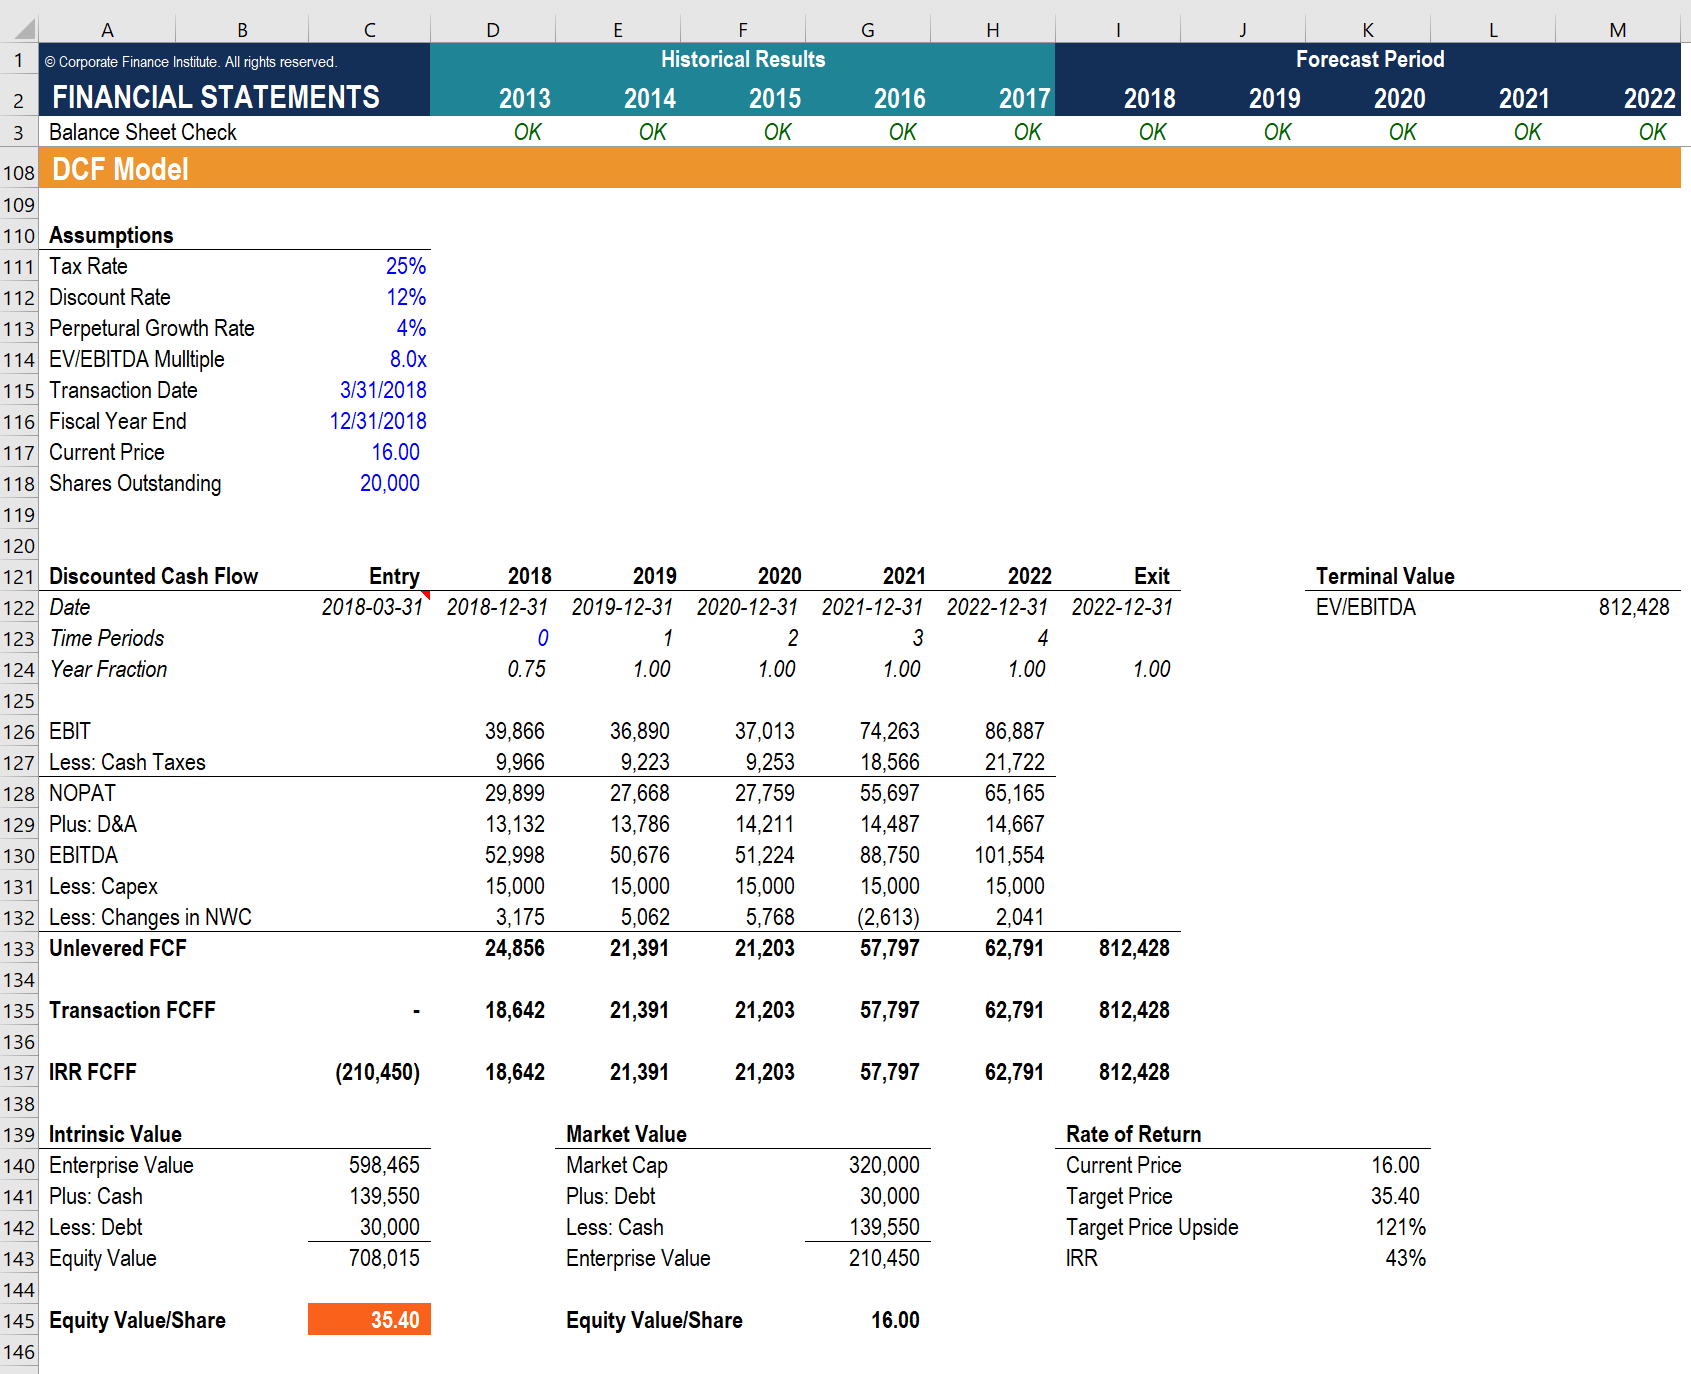
#1 Discounted cash flow modeling in Excel
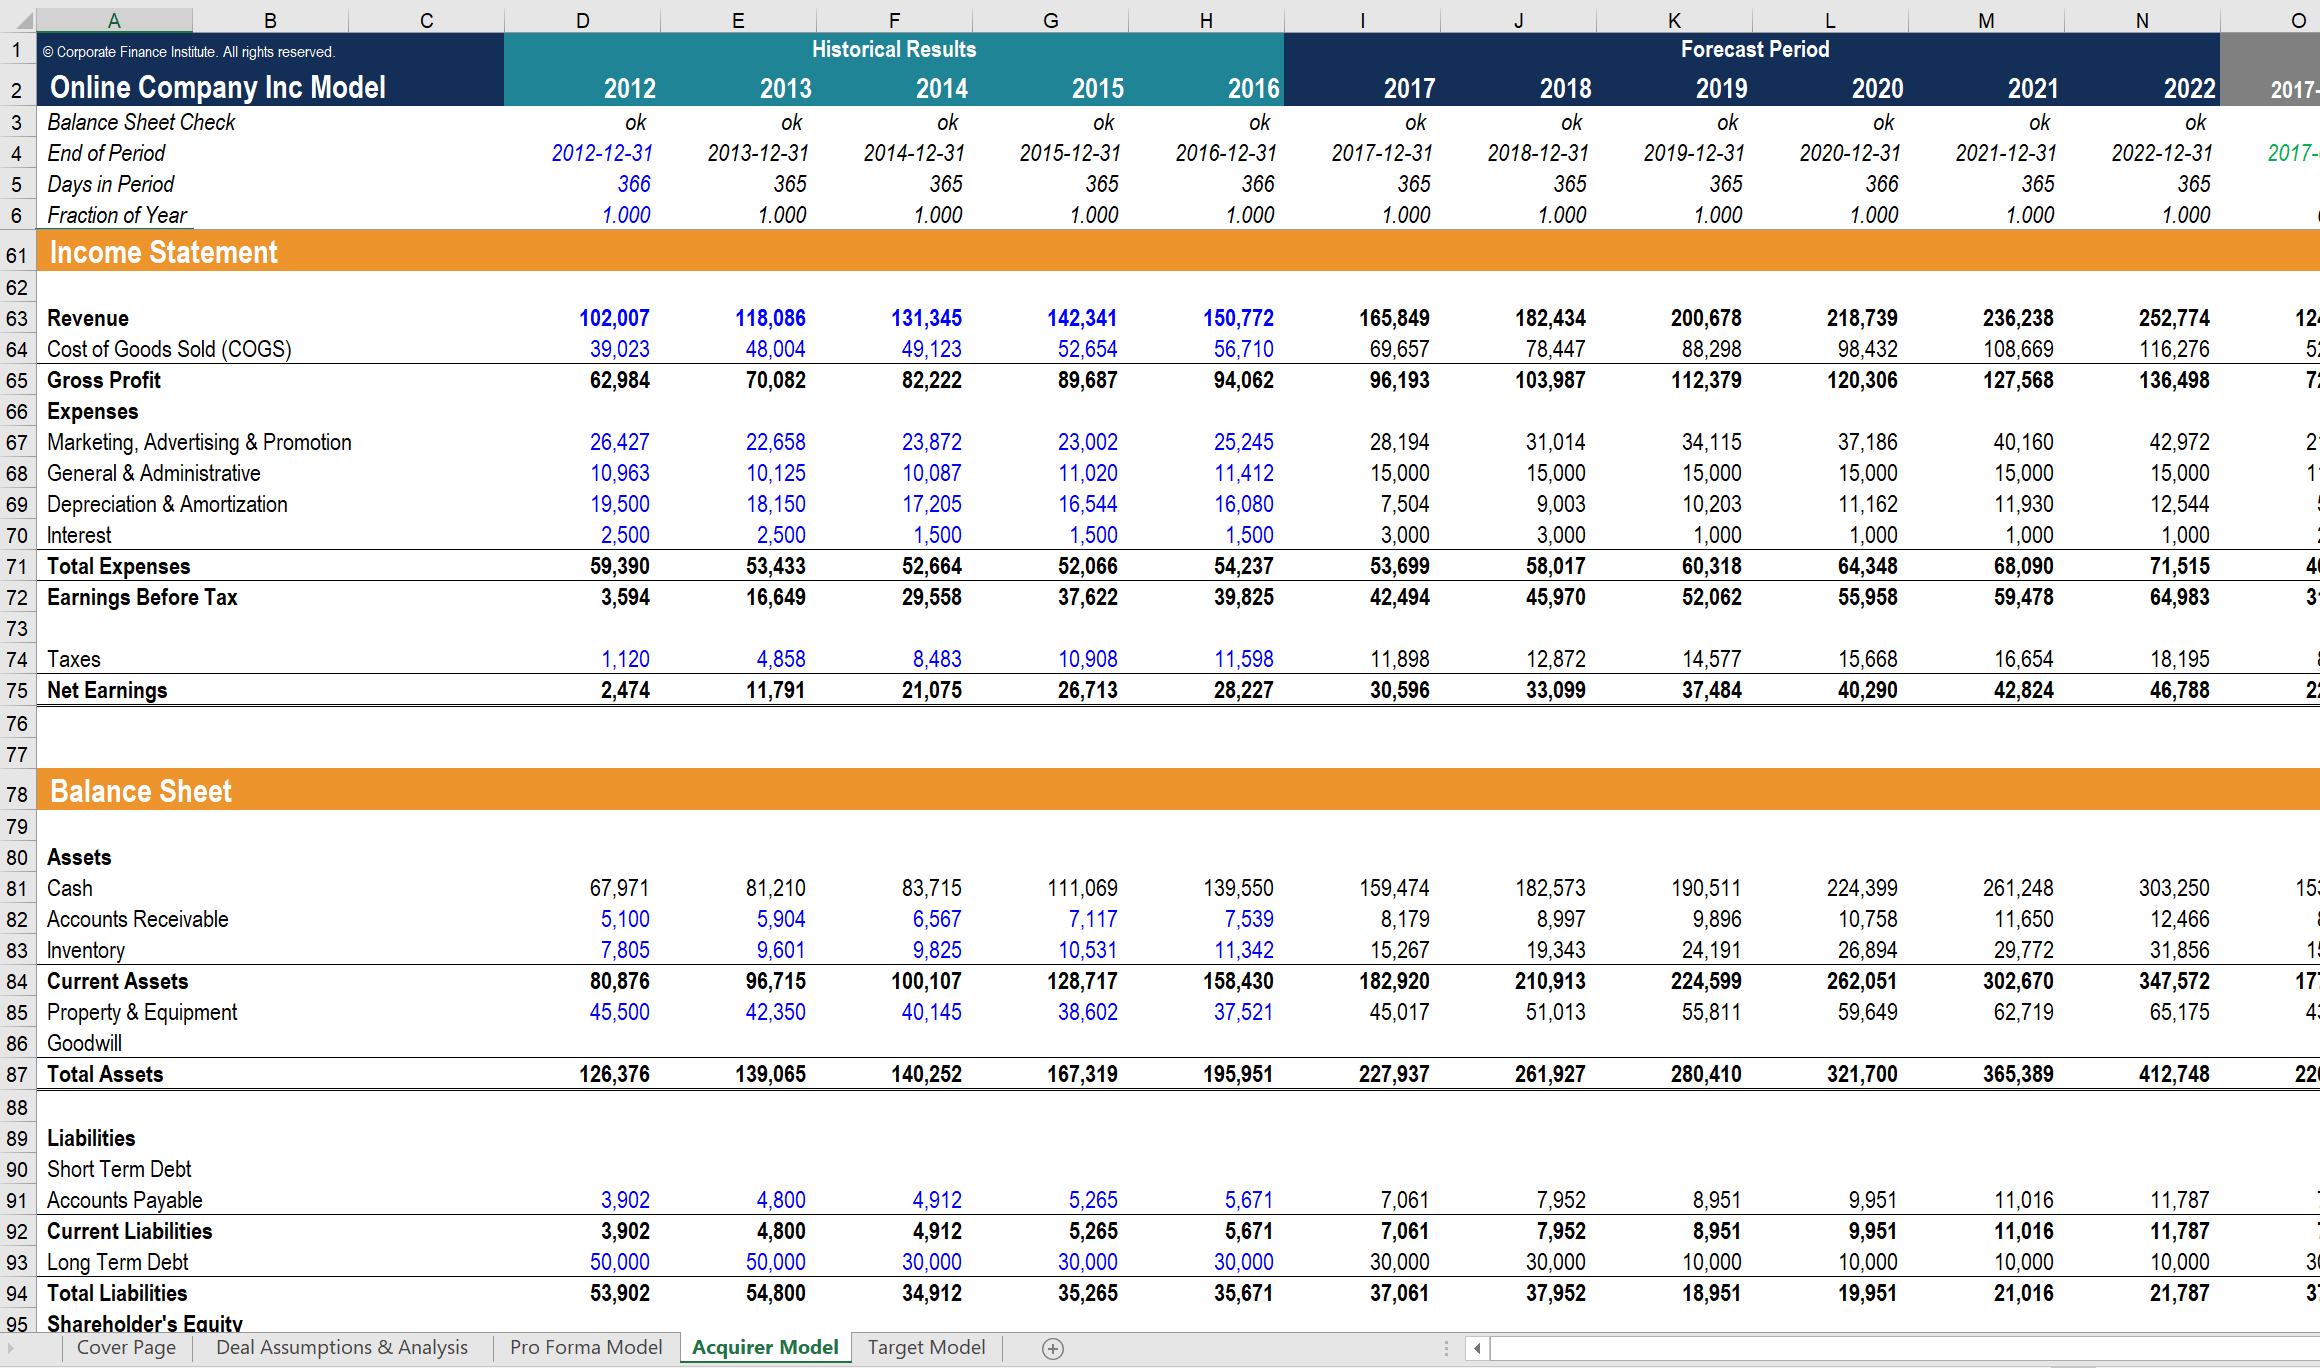
Using the DCF approach, a finance professional takes 3-5 years of historical financial information about a business and puts it into an Excel model. Next, they link the three financial statements together so that they are dynamically connected.
Following that, assumptions are made about how the business will perform in the future, and those assumptions are used in Excel formulas to create a forecast for the future (typically, about five years into the future). Finally, they calculate a terminal value for the business and discount the forecast period and the terminal value back to the present, using the company’s weighted average cost of capital(WACC).
For a more detailed explanation, read this step-by-step guide to DCF modeling.
#2 Comparable trading multiples in Excel
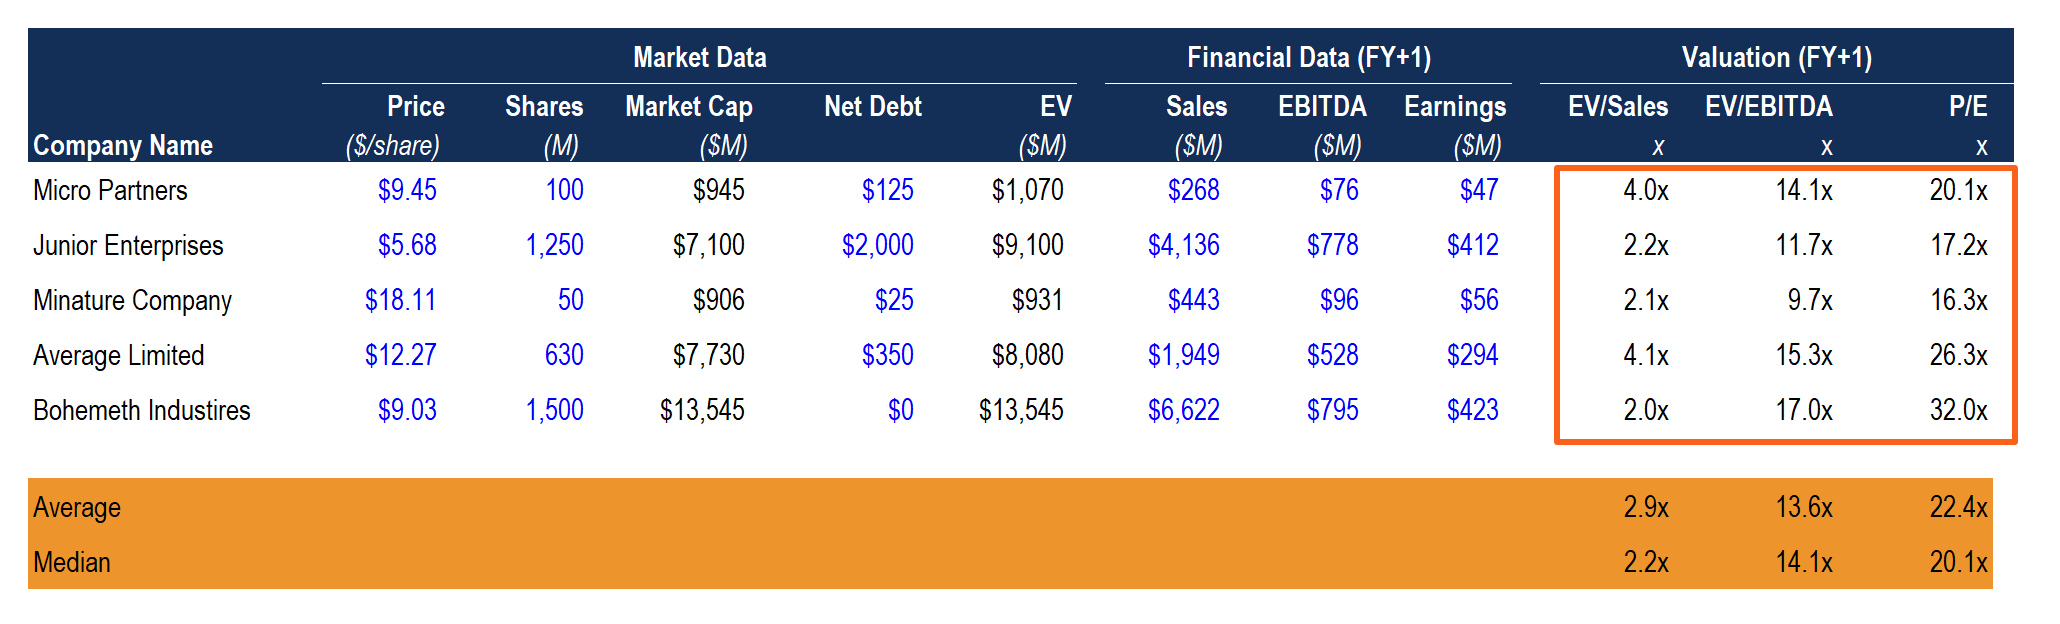
The comparable multiples valuation modeling approach in Excel is very different from that of a DCF model. With this method, instead of determining a company’s intrinsic value (as above), an analyst will look at the valuation multiples of other publicly traded companies and compare them to that of the business(es) they wish to value. Common examples of valuation multiples include EV/Revenue, EV/EBITDA, EV/EBIT, Price/Earnings, and Price/Book.
For a more detailed explanation, read this guide to comparable company analysis.
#3 Precedent transaction modeling in Excel
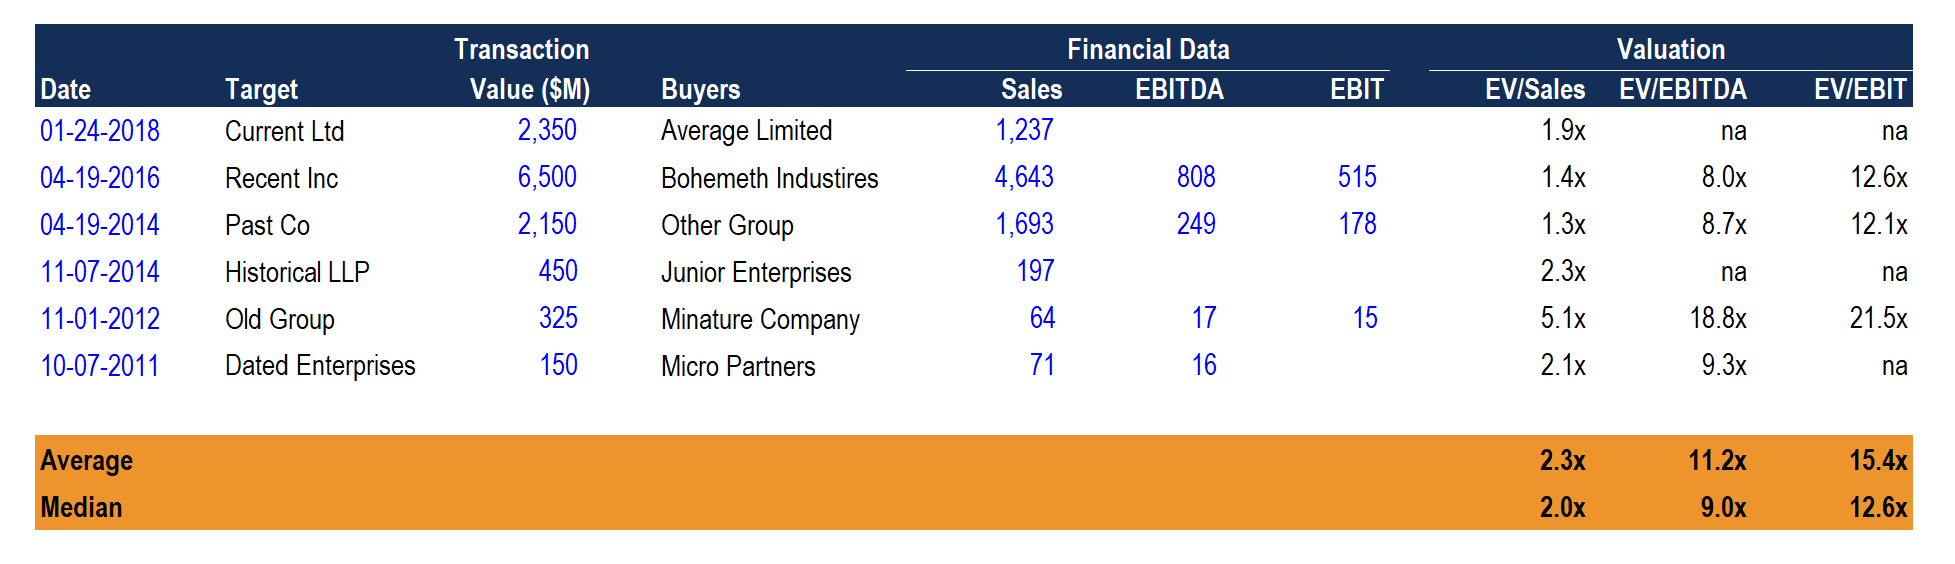
With this third approach to valuation modeling in Excel, an analyst will look at the prices paid for mergers and acquisitions (M&A) of similar businesses that took place in the past. This is also a relative form of valuation, but unlike comparable trading multiples, these transactions include takeover premiums (the value of control) and are based in the past (which can quickly become out of date).
For a more detailed explanation, read this guide to precedent transactions.
Skills for performing valuation modeling in Excel
To perform these types of analyses, financial professionals are required to have many different skills that can often take years of education and experience to master.
The most important skills include:
- Accounting (principles, methods, financial statements)
- Finance (financial math, formulas, ratios, calculations)
- Excel (MS Excel best practices, shortcuts, functions)
- Strategy (competitive advantage, market analysis)
- Valuation (a combination of all of the preceding skills)
CFI’s Financial Analyst Certification covers all of these in one intensive online program, while other designations may not cover all skill areas.
Jobs that perform valuation modeling in Excel
There are many jobs and career paths that require the skills of being able to value a company, a business unit, or an investment opportunity in Excel.
Some of the most common careers that require such skills include the following:
- Investment banking (analyst and associate level)
- Private equity & venture capital (analyst and associate level)
- Corporate development (analyst and manager level)
- Financial planning & analysis (analyst, manager, and director level)
- Public accounting (transaction advisory, impairment testing)
- Equity research (associate and analyst level)
Why use Excel for valuation modeling?
The flexibility of Excel is both a blessing and a curse. While larger organizations may attempt to use software to manage their financial modeling, the reality is they often end up reverting back to Excel.
The main reasons Excel is used include:
- Total flexibility and customization
- Extremely low cost to purchase
- Easy to share externally with other parties
- Ubiquitous and understood by all
- Simple to use and easy to audit (no “black box”)
On the flip side, however, the extreme flexibility of Excel means that models may be prone to errors, inaccurate calculations, and poor practices. Analysts and other finance professionals must ensure that they possess strong Excel modeling skills and a thorough understanding of industry-leading best practices.
Additional Resources
Thank you for reading CFI’s guide to Valuation Modeling in Excel. To help advance your career, see the following CFI resources:
- Valuation Methods
- Analysis of Financial Statements
- Data Sources in Financial Modeling
- Excel Modeling Best Practices
- See all financial modeling resources
- See all Excel resources
Содержание
- Valuation Model Excel Templates 1 comment
- What is valuation?
- Valuation Models
- Valuation models in excel
- Why valuation modeling?
- How to perform valuation modeling in Excel?
- Discounted cash flow (DCF) modeling in Excel
- Everything You Need To Master DCF Modeling
- Comparable trading multiples in Excel
- Precedent transaction modeling in Excel
- Skills for performing valuation modeling in Excel
- Jobs that require valuation modeling in Excel
- Why use Excel for valuation modeling?

What is valuation?
Valuation is the process of calculating the current worth of an asset or liability. Examples of assets are stocks, options, companies, or intangible assets. Concerning liabilities, they can be bonds issued by a company.
Common terms used when discussing the value of an asset or liability are market value, fair value, and intrinsic value.
Put simply, the value to be derived is the present value of all the future benefits (or cashflow) of the given asset or liability. This can calculated in various ways, with the use of financial and valuation tools, to determine the magnitude and risk of such future benefits. Take the example of an analyst determining the value of a company. He will consider the company’s management, the composition of its capital structure, the prospect of future earnings and market value of assets to come to terms with its value.
Valuation Models
There are a range of way to value assets and liabilities, some of which include:
Comparable Company (Comps) Analysis: Also-known-as ‘trading multiples’, ‘peer group analysis’, ‘equity comps’, or ‘public market multiples’, a Comparable Comps Analysis uses information from similar companies, in terms of size and industry, to reach a valuation on the value of a company. This method bases itself on the assumption that comparable organizations will have similar valuation values.
Precedent Transaction Analysis: This method of valuation analysis looks at the price that has been paid for companies similar in size and industry in the past to help value another company. Similar to the comparable comps analysis, due to the fact it is a relative model, the precedent transaction analysis may deliver an outdated valuation depending on when the merger or acquisition has taken place.
Discounted Cash Flow Analysis: A DCF analysis values the company based on the value of current cash flows in the future. This can be a complex method, requiring high levels of detail and intricacy. A DCF analysis is perhaps most accurate, and therefore useful, for companies with steady levels of income.
Other examples of valuation models include the Leverage Buyout Analysis and the Cost Approach (useful for real estate valuations).
It is common for a variety of valuation models used — the outcomes of each, such as the comparable comps, precedent, and DCF valuation models, to be mapped onto a ‘football field chart.’ This shows the variations regarding the different valuation outcomes, and then displays the average price.
All in all, Valuation in finance is key for many reasons. It is needed in investment analysis, capital budgeting and acquisitions transactions, financial reporting, or taxable events.
If you’d like some Valuation Excel Model Templates to facilitate your valuation, you will find the above valuation techniques and many more on the Eloquens catalogue. Also, if you have any questions or would like to discuss matters about a given tool, you can contact our authors whom will happily get back to you.
For more in depth information about Valuation, feel free to have a look through these links:
A more in-depth look at Valuation in general
Источник
Valuation models in excel

Why valuation modeling?
Modeling is a useful tool for finance professionals who are part of various transactions, including mergers and acquisitions (M&As), initial public offerings (IPOs), and venture capital. It is also useful for non-finance professionals like marketing analysts or product development teams to perform market research.
The model can be used independently or in tandem with other models such as sensitivity analysis and scenario analysis. The goal of the model is to estimate the future value of stocks and predict the share price at a certain point in time.
For example, an analyst could use it to figure out how much money they would need to invest in an IPO today to reach their target price when they sell their shares after the IPO.
Modeling in Excel is sometimes the only way to perform valuation analysis if another spreadsheet-based financial application is not accessible or is too expensive. It can also be a more convenient way to perform valuation analysis when spreadsheets are the only tool available for data collection.
It enables one to estimate future financial metrics and use them to calculate ratios, such as price/book value (PBV), price/sales ratio (PSR), price-earnings-growth (PEG), and dividend yield. In addition, it is possible to evaluate changes in the current market value of an asset or company versus its intrinsic value. It can also examine multiples of peers or other companies within the same company.
This article will now cover how to value companies using the three approaches – discounted cash flow (DCF) analysis, precedent comparables, and comparable trading multiples. These models can be built from scratch in Excel or using an existing model or template.
Read on for more!

How to perform valuation modeling in Excel?
Valuation modeling in Excel may be performed by using existing templates or by creating a model from scratch.
DCF analysis is a staple of financial modeling and can be performed with a basic template. It involves estimating future cash flows until the end of the forecast period and is an intrinsic value approach. It is a fundamental approach that provides many options to incorporate various assumptions. Conversely, analyzing trading multiples and precedent comparables are relative value approaches.
In this context, intrinsic value refers to the company’s fair value computed as the sum of its future cash flows and terminal value, discounted at the cost of capital. Other variables being constant, higher future cash flows will translate into a higher intrinsic value in today’s terms.
For example, a person valuing a house using the intrinsic value approach might say, «This house is worth $5 million because if one were to rent this house for many years, they would be paying x amount in annual rent, and the total cash outflow over the years can be discounted to a present value of $5 million.»
Contrary to intrinsic value, relative value derives an asset’s worth by comparing it with the value of similar assets. For example, if a person were valuing a house using the relative value approach, they would say, «A similar house in the neighborhood sold for $4.5 million, but its area was slightly smaller. This house under consideration is fairly similar, so adjusting for its slightly larger area, it must be worth $5 million.»
The video below, taken from our Valuation Modeling Course, walks you through differences in intrinsic and relative valuation methods.
On the other hand, market value is a result of demand and supply. The demand for a stock is reflected in its price. The higher the demand, the higher the price. Therefore, a stock trading at a higher price than its intrinsic value is considered overvalued, and vice versa. However, up and down movements in stock prices are daily occurrences causing stocks to be overvalued and undervalued daily.
Allow us to take you through the steps involved in each of the three approaches to valuing a company.
Discounted cash flow (DCF) modeling in Excel
DCF analysis determines the intrinsic value by finding the value of all expected future free cash flows in present terms. It is an intrinsic form of valuation. Due to that, some experts consider it to be the best way to value a company, especially in periods where the market seems to be over or undervaluing assets.
This method accounts for the time value of money. Experts find free cash flows (operating cash flow minus CapEx) to be one of the best proxies for financial performance. Investors use this to evaluate whether the value of the expected cash flows today is greater than their investment or whether the returns are greater than the opportunity cost.
The video below is taken from our DCF Modeling Course. It illustrates the purposes of using the DCF approach and when it is used most.
WSO’s finance experts have crafted a free template specifically for DCF analysis with which you can experiment as you go on reading the steps involved in DCF analysis.
- The UFCF estimate in the first forecasting period can come from the company’s financial statements or somesell-side analyst reports .
- Next, the growth rates can be predicted by creating individual estimates for each year or by applying bulk estimates that apply the same growth rate for different phases. For example, the same growth rate may be applied from years 2 to 6, another growth rate from years 7 to 11, and another to calculate terminal value .
- Then, the discount rate , cash and the liability balances, and the number of shares outstanding need to be input in the separate cells.
- Once this is done, analysts need to decide which rate to use while discounting the UFCF.
- The NPV function is used to calculate the net present value (NPV) of the estimated cash flows and the terminal value by discounting them at the cost of capital .
- The current value of debt and cash can be subtracted from the NPV to determine the intrinsic value of equity.
- The total intrinsic value can be divided by the shares outstanding to find the intrinsic value per share.

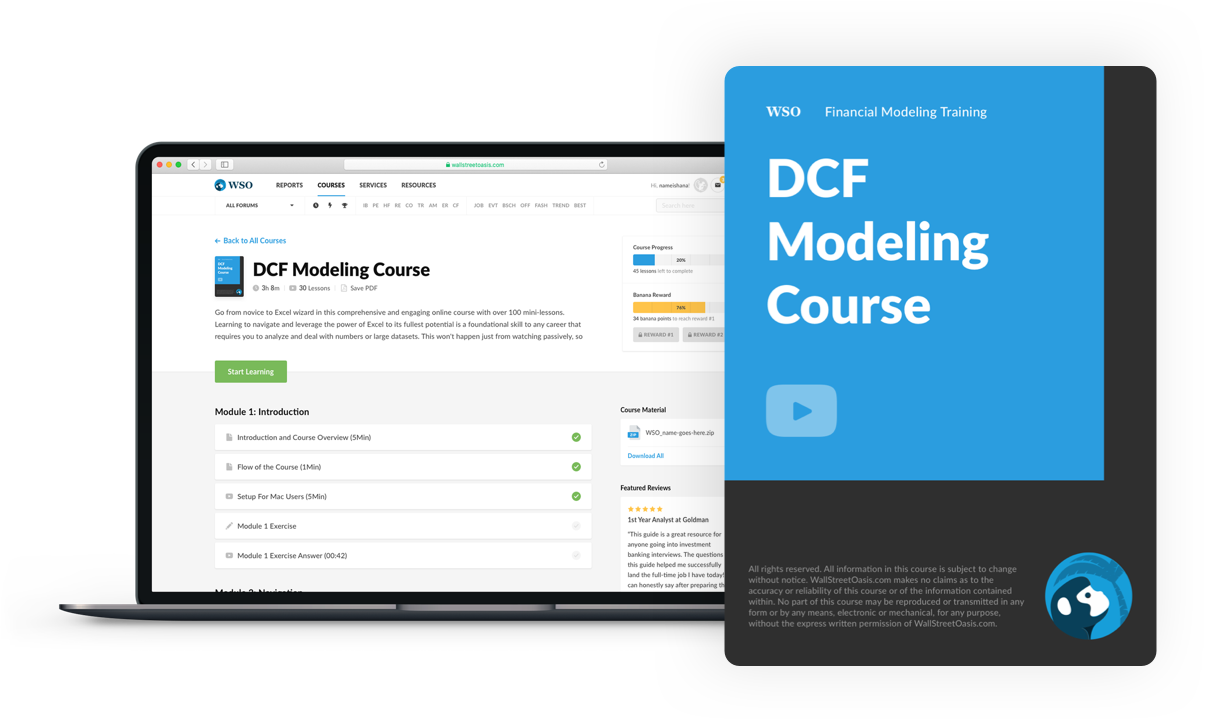
Everything You Need To Master DCF Modeling
To Help you Thrive in the Most Prestigious Jobs on Wall Street.
Comparable trading multiples in Excel
Comparable analysis (also called trading multiples analysis, comps analysis, or comps) is a relative value approach to valuation in which analysts observe trading multiples of comparable companies and use those ratios to calculate the value of a company. Unlike DCF analysis, comps do not account for the time value of money. Calculating relative valuation through comps is routine for analysts working in investment banking, corporate development, equity research, and private equity.
This method is similar to the precedent transaction method in many ways. The key differences are listed in the next section, which is about the precedent transaction method.
Below is an introductory video on trading comps from our Valuation Course.
Below, we will walk you through the list of steps to build valuation models for trading comps.
- Find similar companies
- Collect information
- Build comps model
- Compute relevant multiples
- Value the company
- Interpret results
Feel free to download this free modeling template on Multiples Analysis which is made with the sole intention of helping you understand this concept better. The above steps to comps analysis are explained below.
This task may not be as easy as it sounds because defining comparable companies can be subjective. Although data mines such as Bloomberg Terminal and CapIQ can be expensive, they are great portals to find all your needed information. They can give you detailed information about publicly traded companies. Analysts can filter companies based on industry, geography, size, growth, etc.
Once we have determined the closest matches to the company we are trying to value, we must gather their historical financial data. Again, data mines like Bloomberg Terminal can help cut down a major chunk of the laborious work. Without access to these databases, the data can still be obtained and entered into the model as it is publicly available, but it can get tedious. Depending on the stage of the company in the business lifecycle, we look at different metrics. Profit-related metrics like EBITDA or net income are considered heavily for a mature company. On the other hand, turnover-based metrics like revenue or gross margin carry more weight in the case of early-stage companies.
We can begin working on the comps valuation model with all the requisite data now at hand. We can start by listing the relevant data about the comparable companies. The most used metrics include share price, market cap, revenue, EBITDA, enterprise value (EV), earnings per share (EPS), and some estimates or assumptions for the future.
The next step is to compute the relevant ratios using the data gathered so far and the future outlook. The most common ratios used in comps analysis are EV/EBITDA, EV/Gross Profit, EV/Revenue, price-to-earnings (P/E), and price-to-book (P/B).

The valuation process is summarized below.
- Compute ratios for each of the comparable companies.
- Take the average of each ratio — for example, the average of the P/E ratios of all the comparables.
- Adjust each of these averages based on future outlook.
- Use the adjusted averages to determine different valuations of the company in question.
- Use the average of the different valuations of the company to arrive at the final valuation.
- Present results:
The best way to communicate quantitative results is by using charts and graphs. The results should be graphed in an easily understandable manner to compare them with the results determined using other methods. A football field chart is one of the commonly used charts in comps analysis and precedent transaction analysis as it allows users to present ranges of valuations.
Comps analysis can ultimately tell us which companies are undervalued or overvalued based on different ratios. However, since the analysis ignores qualitative factors, results need to be interpreted with caution. Understanding why the company is overvalued or undervalued compared to other companies can usually mitigate the ambiguity. Companies may be overvalued or undervalued, or appear to be so, due to differences in growth prospects, Capex, capital structure, etc.

Precedent transaction modeling in Excel
In the precedent transaction approach to valuation, also known as transaction comps analysis, the company in question is compared to comparable companies in the industry which were recently sold or acquired. Since companies are often acquired at a premium, the valuation figures derived using the precedent transaction method also include a premium component. Due to that, it generally gives the highest valuation of a company, followed by comps analysis and then DCF analysis. This method is also a relative value approach to valuation like comps analysis. It also uses metrics and ratios of other companies to derive the value of the company being analyzed. Both the methods rely on comparable companies, which are not easy to pick. That said, the two methods have some key differences, as listed below.
- Data: Comps analysis uses data of publicly traded companies. The precedent transaction method uses transaction data of other recently acquired companies. The data for the latter is harder to gather in comparison with the former.
- Validity of results: Since M&A activity is infrequent, the valuations derived using transaction comps become stale over time. On the other hand, comps analysis can be done daily as the public market data is easily available.
- Acquisition premium: Companies are often acquired at a premium. The precedent transaction method uses companies that are recently acquired. Due to this, a premium component will inflate the valuations of the company being analyzed. Comps analysis does not suffer from this phenomenon.
Transaction comps are particularly useful for valuing companies for mergers and acquisitions (M&A) transactions. However, it is not as prominently used in the valuation business as the other two methods. The steps to value a company using transaction comps are listed below.
- Select relevant transactions
- Shortlist transactions
- Spreading comps
- Value the company
- Present results
These steps involved in precedent transaction analysis are explained below.
Selecting the relevant historical transactions from the universe of all M&A transactions is the first step. Analysts screen for M&A where the target company is comparable to the company being valued. Companies may be considered comparable based on the following criteria–
- Industry
- Company size
- Financial metrics (revenue, EBITDA, etc.)
- Offerings (products and services)
- Geography
- Customer base
Information providers and data aggregators such as CapIQ can make the entire valuation process more efficient, as most of the necessary data, if not all, can be found in a single depository.
No two companies are exactly the same, so it is next to impossible to find perfectly comparable companies. Regardless, we try to find the closest matches in this step of the process. The relevant transactions identified in the previous step can be narrowed down by carefully understanding what the target companies do and discarding those that are not close matches.

«Spreading the comps» is investment banker lingo for creating spreadsheet models to analyze comparable multiples like P/E, P/B, EV/EBITDA, EV/Sales, etc. As part of this step, averages and medians for each ratio are calculated for further use.
The averages and the medians of the multiples calculated in the previous step are applied to the corresponding value drivers of the company being valued. Different ratios should produce different values for the company, thus creating a range for its valuation.
The best way to communicate quantitative results is by using charts and graphs. The results should be graphed in an easily understandable manner to compare them with the results determined using other methods. A football field chart is one of the commonly used charts in comps analysis and precedent transaction analysis as it allows users to present ranges of valuations.
Since precedent transactions analysis ignores qualitative factors, results need to be interpreted with caution. Understanding why a company is overvalued or undervalued compared to other companies can usually mitigate the ambiguity. Reasons for overvaluation or undervaluation could be due to takeover premium or differences in growth prospects, CapEx, capital structure, etc. The video below, taken from WSO’s Valuation Course, gives an overview of breaking down the output from transaction comps analysis.
Skills for performing valuation modeling in Excel
Valuation modeling in Excel is a skill and a practice. Modeling involves a much more comprehensive process than most imagine. It requires the modeler to know more than just Excel. It’s not about formulas or numbers; it’s about understanding the valuation process and how to use the innumerable tools. These skills can sometimes take years of experience to master.
Some skills for performing modeling in Excel include:
- Understanding the benefits of DCF analysis, trading multiples, and precedent transactions
- Being able to build financial models from scratch (or by using existing templates/models)
- Being able to build a three-statement model
- Understanding the significance of ratios
- Being able to prepare data using pivot tables
- Attention to detail
- Forecasting skills
- Presentation skills
- Ability to make reasonable and realistic assumptions
- Ability to simplify complex information
To perform financial modeling in Excel, a finance professional will typically be skilled in Microsoft Excel, Microsoft Access, or both. They should also have the fundamental knowledge of accounting, finance, and strategy. They should also know about financial analysis software like Bloomberg and Reuters. Additionally, a finance professional must be familiar with finance principles and the various types of analysis that can be performed with these tools.
Apart from these skills, financial modelers should also be aware of the current best practices in the industry to build models that are easy to comprehend by all users, meet their objectives effectively, and are robust.

Jobs that require valuation modeling in Excel
Valuation modelers typically work in a variety of fields, including commercial banking, private equity, investment banking, and venture capital. They may also be employed by third-party consulting firms that require them to develop or otherwise use valuation models.
Venture capitalists will often require the valuation models used in their investments to be tailored for their specific businesses. They will then present these valuations in pitch meetings with new business opportunities for potential investments or as part of their due diligence process to evaluate investment opportunities.
Companies selling financial products such as stocks, bonds, and mutual funds may also rely on valuation models created by valuation modelers to determine the value of their assets. These assets are typically valued based on their earnings before interest and taxes (EBIT), market capitalization, and other factors.
Financial modeling in Excel can be used in a variety of different scenarios. Some of the most common jobs that may require this skill are:
Why use Excel for valuation modeling?
Excel is a versatile tool for data analysis, the best perhaps, and valuation modeling is just one of the many ways it can be used. Because it’s so easy to create a spreadsheet in Excel and the software has wide-ranging capabilities, it’s often the best option for this type of work.
An innumerable amount of data is processed on Excel spreadsheets every day. All this data helps decision-makers make informed decisions. Investors are a subset of all decision-makers that use it to analyze data to optimize investment portfolios and evaluate investment opportunities.
Excel allows users to easily manipulate large amounts of data, create models through formulas, and perform advanced statistical calculations. It also enables users to navigate through humongous amounts of data easily. In addition, users can use formatting to differentiate between different data and make numbers look more presentable. Finally, it allows users to present the data visually through charts and graphs.
It offers users an extremely wide range of built-in formulae and functions, which play a huge part in financial modeling and data analysis. Even though most users will not end up using many of its functions, it is comforting to know that they are available at the click of a few buttons.
Besides the wide range of functionality that Excel offers, it also has a large user base. The user base acts as a community that shares resources on Excel. The large community can be an especially helpful source of learning resources. In addition, with such a large user base, any bugs in the software are found and fixed faster, or workarounds are shared rapidly.
Источник
Valuation modeling refers to the forecasting and analysis using several different financial models. It includes discounted cash flow (DCF) analysis, precedent comparables, and comparable trading multiples. These financial models may be developed from the ground up in Excel or developed using existing templates.
Primarily, there are three methods used by practitioners when valuing a company: (1) DCF analysis, (2) comparable company analysis, and (3) precedent transactions. They are commonly used in equity research, investment banking, private equity, mergers & acquisitions (M&A), corporate development, leveraged buyouts (LBO), and many other areas.
Typically, this type of modeling is used to determine the value of an investment, be it an asset or a company’s stock price. For instance, based on its current share price, users can evaluate the value of a company or determine whether it is overvalued or undervalued.
Before we dive deep into the topic, we want you to know that we truly believe that a more hands-on approach always helps gain a much better understanding of a topic. Therefore, we would like you to pick out one of the modeling templates that our finance experts have created for you to explore while reading this page.
Modeling is a useful tool for finance professionals who are part of various transactions, including mergers and acquisitions (M&As), initial public offerings (IPOs), and venture capital. It is also useful for non-finance professionals like marketing analysts or product development teams to perform market research.
The model can be used independently or in tandem with other models such as sensitivity analysis and scenario analysis. The goal of the model is to estimate the future value of stocks and predict the share price at a certain point in time.
For example, an analyst could use it to figure out how much money they would need to invest in an IPO today to reach their target price when they sell their shares after the IPO.
Modeling in Excel is sometimes the only way to perform valuation analysis if another spreadsheet-based financial application is not accessible or is too expensive. It can also be a more convenient way to perform valuation analysis when spreadsheets are the only tool available for data collection.
It enables one to estimate future financial metrics and use them to calculate ratios, such as price/book value (PBV), price/sales ratio (PSR), price-earnings-growth (PEG), and dividend yield. In addition, it is possible to evaluate changes in the current market value of an asset or company versus its intrinsic value. It can also examine multiples of peers or other companies within the same company.
This article will now cover how to value companies using the three approaches – discounted cash flow (DCF) analysis, precedent comparables, and comparable trading multiples. These models can be built from scratch in Excel or using an existing model or template.
Read on for more!
How to perform valuation modeling in Excel?
Valuation modeling in Excel may be performed by using existing templates or by creating a model from scratch.
DCF analysis is a staple of financial modeling and can be performed with a basic template. It involves estimating future cash flows until the end of the forecast period and is an intrinsic value approach. It is a fundamental approach that provides many options to incorporate various assumptions. Conversely, analyzing trading multiples and precedent comparables are relative value approaches.
In this context, intrinsic value refers to the company’s fair value computed as the sum of its future cash flows and terminal value, discounted at the cost of capital. Other variables being constant, higher future cash flows will translate into a higher intrinsic value in today’s terms.
For example, a person valuing a house using the intrinsic value approach might say, «This house is worth $5 million because if one were to rent this house for many years, they would be paying x amount in annual rent, and the total cash outflow over the years can be discounted to a present value of $5 million.»
Contrary to intrinsic value, relative value derives an asset’s worth by comparing it with the value of similar assets. For example, if a person were valuing a house using the relative value approach, they would say, «A similar house in the neighborhood sold for $4.5 million, but its area was slightly smaller. This house under consideration is fairly similar, so adjusting for its slightly larger area, it must be worth $5 million.»
The video below, taken from our Valuation Modeling Course, walks you through differences in intrinsic and relative valuation methods.
On the other hand, market value is a result of demand and supply. The demand for a stock is reflected in its price. The higher the demand, the higher the price. Therefore, a stock trading at a higher price than its intrinsic value is considered overvalued, and vice versa. However, up and down movements in stock prices are daily occurrences causing stocks to be overvalued and undervalued daily.
Allow us to take you through the steps involved in each of the three approaches to valuing a company.
Discounted cash flow (DCF) modeling in Excel
DCF analysis determines the intrinsic value by finding the value of all expected future free cash flows in present terms. It is an intrinsic form of valuation. Due to that, some experts consider it to be the best way to value a company, especially in periods where the market seems to be over or undervaluing assets.
This method accounts for the time value of money. Experts find free cash flows (operating cash flow minus CapEx) to be one of the best proxies for financial performance. Investors use this to evaluate whether the value of the expected cash flows today is greater than their investment or whether the returns are greater than the opportunity cost.
The video below is taken from our DCF Modeling Course. It illustrates the purposes of using the DCF approach and when it is used most.
Comparable trading multiples in Excel
Comparable analysis (also called trading multiples analysis, comps analysis, or comps) is a relative value approach to valuation in which analysts observe trading multiples of comparable companies and use those ratios to calculate the value of a company. Unlike DCF analysis, comps do not account for the time value of money. Calculating relative valuation through comps is routine for analysts working in investment banking, corporate development, equity research, and private equity.
This method is similar to the precedent transaction method in many ways. The key differences are listed in the next section, which is about the precedent transaction method.
Below is an introductory video on trading comps from our Valuation Course.
Below, we will walk you through the list of steps to build valuation models for trading comps.
- Find similar companies
- Collect information
- Build comps model
- Compute relevant multiples
- Value the company
- Interpret results
Feel free to download this free modeling template on Multiples Analysis which is made with the sole intention of helping you understand this concept better. The above steps to comps analysis are explained below.
- Find similar companies:
This task may not be as easy as it sounds because defining comparable companies can be subjective. Although data mines such as Bloomberg Terminal and CapIQ can be expensive, they are great portals to find all your needed information. They can give you detailed information about publicly traded companies. Analysts can filter companies based on industry, geography, size, growth, etc.
- Collect information:
Once we have determined the closest matches to the company we are trying to value, we must gather their historical financial data. Again, data mines like Bloomberg Terminal can help cut down a major chunk of the laborious work. Without access to these databases, the data can still be obtained and entered into the model as it is publicly available, but it can get tedious. Depending on the stage of the company in the business lifecycle, we look at different metrics. Profit-related metrics like EBITDA or net income are considered heavily for a mature company. On the other hand, turnover-based metrics like revenue or gross margin carry more weight in the case of early-stage companies.
- Build comps model:
We can begin working on the comps valuation model with all the requisite data now at hand. We can start by listing the relevant data about the comparable companies. The most used metrics include share price, market cap, revenue, EBITDA, enterprise value (EV), earnings per share (EPS), and some estimates or assumptions for the future.
- Compute relevant multiples:
The next step is to compute the relevant ratios using the data gathered so far and the future outlook. The most common ratios used in comps analysis are EV/EBITDA, EV/Gross Profit, EV/Revenue, price-to-earnings (P/E), and price-to-book (P/B).
- Value the company:
The valuation process is summarized below.
- Compute ratios for each of the comparable companies.
- Take the average of each ratio — for example, the average of the P/E ratios of all the comparables.
- Adjust each of these averages based on future outlook.
- Use the adjusted averages to determine different valuations of the company in question.
- Use the average of the different valuations of the company to arrive at the final valuation.
- Present results:
The best way to communicate quantitative results is by using charts and graphs. The results should be graphed in an easily understandable manner to compare them with the results determined using other methods. A football field chart is one of the commonly used charts in comps analysis and precedent transaction analysis as it allows users to present ranges of valuations.
- Interpret results:
Comps analysis can ultimately tell us which companies are undervalued or overvalued based on different ratios. However, since the analysis ignores qualitative factors, results need to be interpreted with caution. Understanding why the company is overvalued or undervalued compared to other companies can usually mitigate the ambiguity. Companies may be overvalued or undervalued, or appear to be so, due to differences in growth prospects, Capex, capital structure, etc.

Precedent transaction modeling in Excel
In the precedent transaction approach to valuation, also known as transaction comps analysis, the company in question is compared to comparable companies in the industry which were recently sold or acquired. Since companies are often acquired at a premium, the valuation figures derived using the precedent transaction method also include a premium component. Due to that, it generally gives the highest valuation of a company, followed by comps analysis and then DCF analysis. This method is also a relative value approach to valuation like comps analysis. It also uses metrics and ratios of other companies to derive the value of the company being analyzed. Both the methods rely on comparable companies, which are not easy to pick. That said, the two methods have some key differences, as listed below.
- Data: Comps analysis uses data of publicly traded companies. The precedent transaction method uses transaction data of other recently acquired companies. The data for the latter is harder to gather in comparison with the former.
- Validity of results: Since M&A activity is infrequent, the valuations derived using transaction comps become stale over time. On the other hand, comps analysis can be done daily as the public market data is easily available.
- Acquisition premium: Companies are often acquired at a premium. The precedent transaction method uses companies that are recently acquired. Due to this, a premium component will inflate the valuations of the company being analyzed. Comps analysis does not suffer from this phenomenon.
Transaction comps are particularly useful for valuing companies for mergers and acquisitions (M&A) transactions. However, it is not as prominently used in the valuation business as the other two methods. The steps to value a company using transaction comps are listed below.
- Select relevant transactions
- Shortlist transactions
- Spreading comps
- Value the company
- Present results
These steps involved in precedent transaction analysis are explained below.
- Select relevant transactions:
Selecting the relevant historical transactions from the universe of all M&A transactions is the first step. Analysts screen for M&A where the target company is comparable to the company being valued. Companies may be considered comparable based on the following criteria–
- Industry
- Company size
- Financial metrics (revenue, EBITDA, etc.)
- Offerings (products and services)
- Geography
- Customer base
Information providers and data aggregators such as CapIQ can make the entire valuation process more efficient, as most of the necessary data, if not all, can be found in a single depository.
- Shortlist transactions:
No two companies are exactly the same, so it is next to impossible to find perfectly comparable companies. Regardless, we try to find the closest matches in this step of the process. The relevant transactions identified in the previous step can be narrowed down by carefully understanding what the target companies do and discarding those that are not close matches.
- Spreading comps:
«Spreading the comps» is investment banker lingo for creating spreadsheet models to analyze comparable multiples like P/E, P/B, EV/EBITDA, EV/Sales, etc. As part of this step, averages and medians for each ratio are calculated for further use.
- Value the company:
The averages and the medians of the multiples calculated in the previous step are applied to the corresponding value drivers of the company being valued. Different ratios should produce different values for the company, thus creating a range for its valuation.
- Present results:
The best way to communicate quantitative results is by using charts and graphs. The results should be graphed in an easily understandable manner to compare them with the results determined using other methods. A football field chart is one of the commonly used charts in comps analysis and precedent transaction analysis as it allows users to present ranges of valuations.
- Interpret results:
Since precedent transactions analysis ignores qualitative factors, results need to be interpreted with caution. Understanding why a company is overvalued or undervalued compared to other companies can usually mitigate the ambiguity. Reasons for overvaluation or undervaluation could be due to takeover premium or differences in growth prospects, CapEx, capital structure, etc. The video below, taken from WSO’s Valuation Course, gives an overview of breaking down the output from transaction comps analysis.
Skills for performing valuation modeling in Excel
Valuation modeling in Excel is a skill and a practice. Modeling involves a much more comprehensive process than most imagine. It requires the modeler to know more than just Excel. It’s not about formulas or numbers; it’s about understanding the valuation process and how to use the innumerable tools. These skills can sometimes take years of experience to master.
Some skills for performing modeling in Excel include:
- Understanding the benefits of DCF analysis, trading multiples, and precedent transactions
- Being able to build financial models from scratch (or by using existing templates/models)
- Being able to build a three-statement model
- Understanding the significance of ratios
- Being able to prepare data using pivot tables
- Attention to detail
- Forecasting skills
- Presentation skills
- Ability to make reasonable and realistic assumptions
- Ability to simplify complex information
To perform financial modeling in Excel, a finance professional will typically be skilled in Microsoft Excel, Microsoft Access, or both. They should also have the fundamental knowledge of accounting, finance, and strategy. They should also know about financial analysis software like Bloomberg and Reuters. Additionally, a finance professional must be familiar with finance principles and the various types of analysis that can be performed with these tools.
Apart from these skills, financial modelers should also be aware of the current best practices in the industry to build models that are easy to comprehend by all users, meet their objectives effectively, and are robust.

Jobs that require valuation modeling in Excel
Valuation modelers typically work in a variety of fields, including commercial banking, private equity, investment banking, and venture capital. They may also be employed by third-party consulting firms that require them to develop or otherwise use valuation models.
Venture capitalists will often require the valuation models used in their investments to be tailored for their specific businesses. They will then present these valuations in pitch meetings with new business opportunities for potential investments or as part of their due diligence process to evaluate investment opportunities.
Companies selling financial products such as stocks, bonds, and mutual funds may also rely on valuation models created by valuation modelers to determine the value of their assets. These assets are typically valued based on their earnings before interest and taxes (EBIT), market capitalization, and other factors.
Financial modeling in Excel can be used in a variety of different scenarios. Some of the most common jobs that may require this skill are:
- Financial planning and analysis (analysts, managers, and directors)
- CFOs
- Investment bankers (analysts and associates)
- Venture capitalists (analysts and associates)
- Stockbrokers
- Equity researchers (analysts and associates)
- Corporate finance professionals
- Accountants
- Private equity professionals
- Insurance agents
- Business consultants
- Public accounting (impairment testing, transaction advisory)
Why use Excel for valuation modeling?
Excel is a versatile tool for data analysis, the best perhaps, and valuation modeling is just one of the many ways it can be used. Because it’s so easy to create a spreadsheet in Excel and the software has wide-ranging capabilities, it’s often the best option for this type of work.
An innumerable amount of data is processed on Excel spreadsheets every day. All this data helps decision-makers make informed decisions. Investors are a subset of all decision-makers that use it to analyze data to optimize investment portfolios and evaluate investment opportunities.
Excel allows users to easily manipulate large amounts of data, create models through formulas, and perform advanced statistical calculations. It also enables users to navigate through humongous amounts of data easily. In addition, users can use formatting to differentiate between different data and make numbers look more presentable. Finally, it allows users to present the data visually through charts and graphs.
It offers users an extremely wide range of built-in formulae and functions, which play a huge part in financial modeling and data analysis. Even though most users will not end up using many of its functions, it is comforting to know that they are available at the click of a few buttons.
Besides the wide range of functionality that Excel offers, it also has a large user base. The user base acts as a community that shares resources on Excel. The large community can be an especially helpful source of learning resources. In addition, with such a large user base, any bugs in the software are found and fixed faster, or workarounds are shared rapidly.
Business valuation is the basis of any future sale or acquisition of a company. Investors and analysts use various startup valuation models to estimate a company’s worth, which can vary drastically based on the figures and assumptions involved.
Valuation models in excel are some of the commonly used formats, and give the company founders and investors a general idea of how much the company is worth. Let’s take a brief look at some of them startup valuation models out there.
Startup Valuation Methods
Startup valuations can be tricky, especially in their pre-revenue stages. Startup valuation models used at this stage have to rely on assumptions. Despite this limitation, the importance of valuation can’t be overlooked. Every startup requires funds to grow and expand their business and a reliable valuation is the only way of estimating the business worth. It is only based on this calculation that investors evaluate funding proposals. In this section, we discuss some of the common valuation methods used for startups.
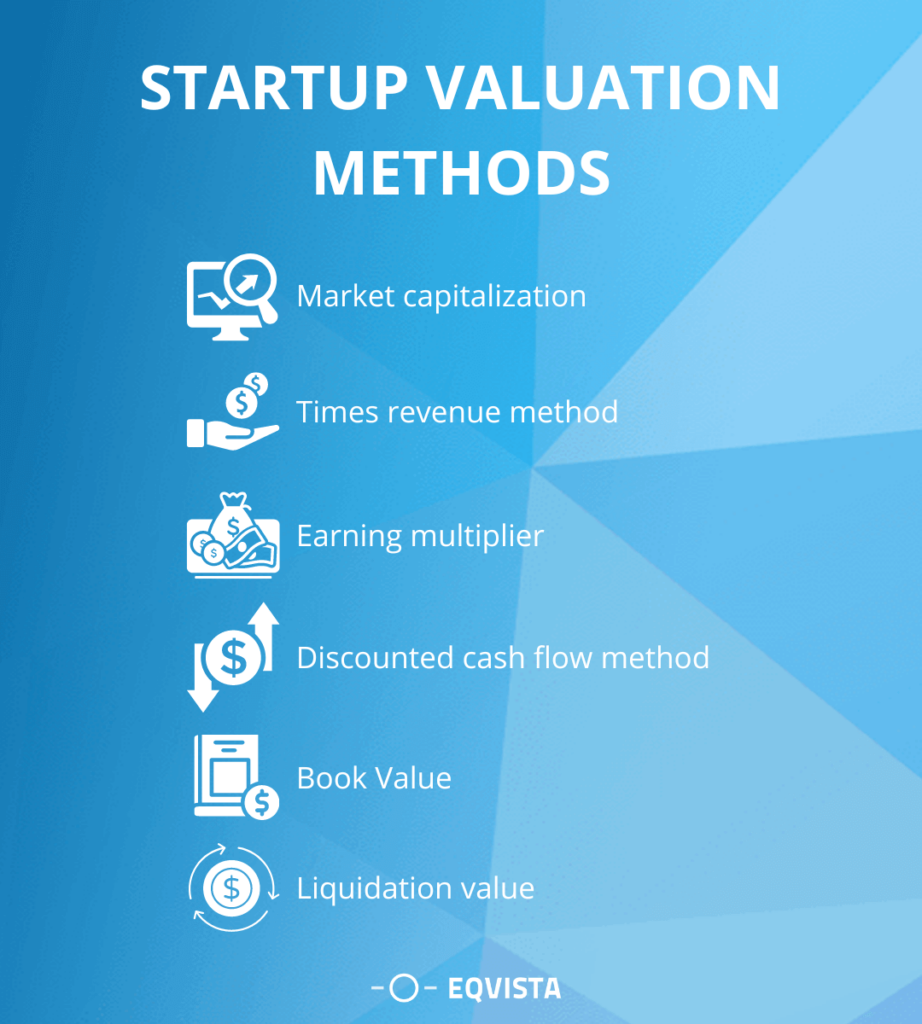
Market Capitalization
This is one of the simplest startup valuation models. Market capitalization determines the total dollar market value of a company’s outstanding shares. It is a far more dependable measure in comparison to the total asset or revenue figures. Investors use the market cap as a quick measure of the company size and a reliable indicator of possible risks.
Market cap = Price per share x Total number of outstanding shares
Companies are categorized based on their market cap. Here is a suggested range:
- $10 billion or more – Large cap
- $2 billion – $10 billion – Mid cap
- $300 million – $2 billion – Small cap
Let’s take an example of two companies A & B worth $2 billion each. Company A has 20 million shares in the market selling at $100 while Company B has 200,000 shares selling at $10,000 each. From an investor’s point of view Company A is much more stable and functional in the industry.
Market cap is established only after a company goes public through an IPO. Before this stage, a startup must engage a professional valuation firm to get a realistic value of the business using various startup valuation models. Based on this information, the startup determines how many shares to issue and at what value. A $10 million company may want to issue 1 million shares at $10 per share or 2 million shares at $5 per share.
Once a startup goes public, their share prices are determined by market forces. The supply and demand of its products and services impact the price of shares. A higher demand increases share price while a falling demand crashes stock prices. Once a company starts trading in the stock market, the market cap becomes a real-time estimate of the company’s value.
Times Revenue Method
This startup valuation method is used to understand the range of a company’s revenue potential. The idea is to determine the ‘max-value’ or ‘ceiling’ for a particular business. To calculate this, the actual revenue data over a period is considered (for eg. one fiscal year). A ‘multiplier’ is applied to this value. Thus a company valuation using Times Revenue Method can be 1x, 2x, 3x, or less than 1. Multiplier value depends on the industry and its economic growth. A hot industry such as AI may have 3x revenue while a service industry may qualify for 0.5x.
It is important to keep in mind that this startup valuation model may not be completely reliable as it uses a company’s overall revenue for calculations. Revenue is not the same as profits. High revenue does not necessarily mean high profits. But this method provides a starting point for investors to fairly estimate the company’s future growth potential.
Earnings Multiplier
This startup valuation model is used as a comparative study with similar companies. Investors use this method to check if the target company’s stock price is more expensive than it should be relative to its contemporaries in the market. Historical stock price data is also taken into consideration.
In this method, the target company’s current stock price is measured against its earnings per share (EPS). For eg, if a company’s current stock price is $100 and earnings per share are $10, the earnings multiplier will be $100/$10 = 10 years. Put simply, this is expressed as: This Company is trading at 10 times its earnings.
As we see, earnings multiplier methods do not provide an exact valuation. They rather give relative information about companies trading in the stock exchange. Investors use these metrics to invest in the most economical stocks that promise future profit potential.
Discounted Cash Flow (DCF) Method
This startup valuation model is used to estimate the present value of an investment based on the company’s future cash flows. This is one of the more commonly used valuation models used.
This again is a comparative metric and not an absolute one as a lot of its findings are based on assumptions. Analysts apply discount rates to neutralize any risks related to the business and its industry of operation.
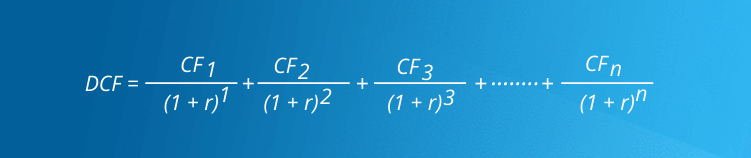
Where:
- CF – Cash flow for a given year. Yr1, yr2, yr3…and so on.
- r – Discount rate
If the DCF value is higher than the present investment, it indicates a positive outcome and potential good cash flow in the future years. However be sure to go through the details on how the discount rate was arrived at and what factors of the company were considered.
Book Value
Otherwise known as the ‘net book value’, this startup valuation model simply indicates the carrying value of company assets on its balance sheet. While this method is not the most accurate valuation method for your company, it is quick and easy to calculate and give you a ballpark estimate of the value of your company. It is calculated as follows:
Book value per share = Total common stockholders equity – preferred stock / no. of common shares
Book value serves two purposes:
- It reflects the worth of company assets that shareholders are entitled to in case of company liquidation
- This value when compared to the company’s market value indicates if their stocks are legitimately priced.
Be sure though to identify which assets may be subject to fair market adjustments (fixed assets, intangible assets, etc), and what other assets or liabilities are already at FV (cash and cash equivalents, accounts receivable and accounts payable, etc).
Liquidation Value
This startup valuation model is similar to the book value model but considers only the tangible assets like equipment, inventory, real estate, etc. Intangible assets are not considered in this calculation. Hence in value, liquidation value is always less than the book value but higher than the salvage value.
In the event of liquidation, most assets are sold at a loss. Hence investors use the liquidation value to asset a potential investment so that they have a fair estimation of how much they can expect in returns in case the company falls out of business.
Startup Valuation Model in Excel (DCF Method)
We have created a very simple startup valuation model in excel using the discounted cash flow method, one of the more common methods for company valuations.
As the startup may not have many company assets in the beginning, and being too early to have enough financial figures for comparing to other companies in the market, this income based approach may be the easiest way to determine your startup valuation.
We included a template for a 5 year and 3 year weighted moving average, as some companies may not be able to determine their growth rate just yet. Also we believe a weighted average may be more applicable than a simple average, especially with early stage companies with fluctuating income levels.
Get your 100% reliable startup valuation in minutes with Eqvista!
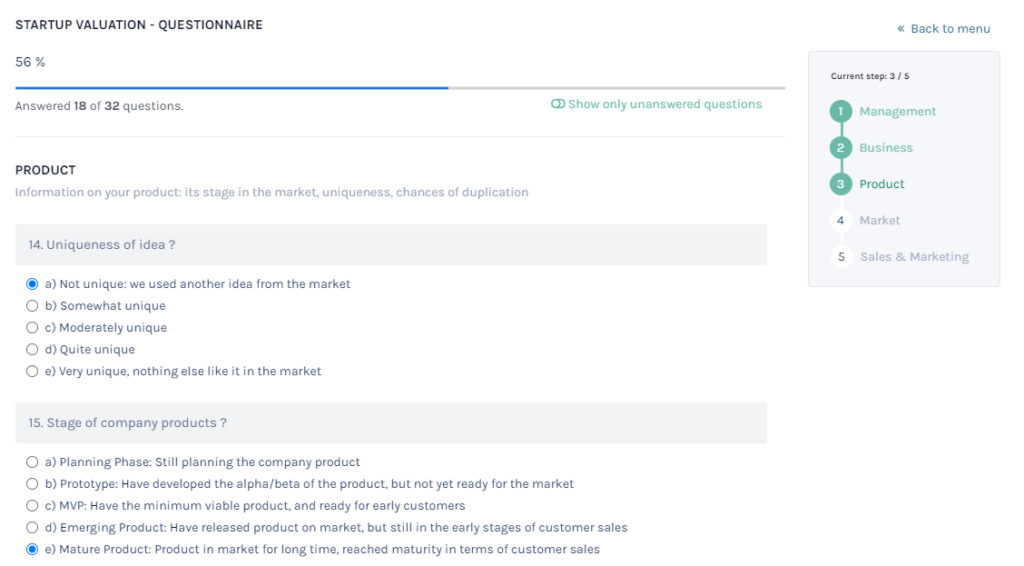
It’s now easier and more convenient to get a valuation for your startup with Eqvista’s startup valuation software. We incorporate trusted valuation methodologies into the software to calculate the most accurate valuation for your startup. Also, the 30 multiple-choice questions covers 5 areas of your business: team/management, business, product, market, as well as sales and marketing. A summarized report will be made available for you in 20 minutes.
Why should you choose Eqvista for your startup valuation?
There are many startup valuation models and none of them are used standalone. It is best left to the professional evaluators to choose the right mix of these methods to arrive at a justifiable value for the company.
Our team of valuation experts at Eqvista can help you in the valuation of your startup and get an audit ready 409a valuation report. Our online captable also helps you easily manage your company shareholders, equity transactions, valuation reports, and more.
What is valuation?
Valuation is the process of calculating the current worth of an asset or liability. Examples of assets are stocks, options, companies, or intangible assets. Concerning liabilities, they can be bonds issued by a company.
Common terms used when discussing the value of an asset or liability are market value, fair value, and intrinsic value.
Put simply, the value to be derived is the present value of all the future benefits (or cashflow) of the given asset or liability. This can calculated in various ways, with the use of financial and valuation tools, to determine the magnitude and risk of such future benefits. Take the example of an analyst determining the value of a company. He will consider the company’s management, the composition of its capital structure, the prospect of future earnings and market value of assets to come to terms with its value.
Valuation Models
There are a range of way to value assets and liabilities, some of which include:
-
Comparable Company (Comps) Analysis: Also-known-as ‘trading multiples’, ‘peer group analysis’, ‘equity comps’, or ‘public market multiples’, a Comparable Comps Analysis uses information from similar companies, in terms of size and industry, to reach a valuation on the value of a company. This method bases itself on the assumption that comparable organizations will have similar valuation values.
-
Precedent Transaction Analysis: This method of valuation analysis looks at the price that has been paid for companies similar in size and industry in the past to help value another company. Similar to the comparable comps analysis, due to the fact it is a relative model, the precedent transaction analysis may deliver an outdated valuation depending on when the merger or acquisition has taken place.
-
Discounted Cash Flow Analysis: A DCF analysis values the company based on the value of current cash flows in the future. This can be a complex method, requiring high levels of detail and intricacy. A DCF analysis is perhaps most accurate, and therefore useful, for companies with steady levels of income.
Other examples of valuation models include the Leverage Buyout Analysis and the Cost Approach (useful for real estate valuations).
It is common for a variety of valuation models used — the outcomes of each, such as the comparable comps, precedent, and DCF valuation models, to be mapped onto a ‘football field chart.’ This shows the variations regarding the different valuation outcomes, and then displays the average price.
All in all, Valuation in finance is key for many reasons. It is needed in investment analysis, capital budgeting and acquisitions transactions, financial reporting, or taxable events.
If you’d like some Valuation Excel Model Templates to facilitate your valuation, you will find the above valuation techniques and many more on the Eloquens catalogue. Also, if you have any questions or would like to discuss matters about a given tool, you can contact our authors whom will happily get back to you.
For more in depth information about Valuation, feel free to have a look through these links:
-
More on Valuation
-
More on Asset valuation
-
A more in-depth look at Valuation in general
Financial modeling in Excel refers to tools used for preparing the expected financial statements predicting the company’s financial performance in a future period using the assumptions and historical performance information. One may use such financial models in DCF valuations, mergers and acquisitions, private equity, project finance, etc.
Financial modeling in Excel is all around the web. There has been a lot written about learning financial modeling. However, most of the financial modeling pieces of training are the same. It goes beyond the usual gibberish and explores practical financial modeling used by Investment BankersInvestment banking is a specialized banking stream that facilitates the business entities, government and other organizations in generating capital through debts and equity, reorganization, mergers and acquisition, etc.read more and Research Analysts.
In this free financial modeling Excel guide, we will take the example of Colgate Palmolive (2016 – 2020) and prepare a fully integrated financial model from scratch.
This guide is over 5,000 words and took me three weeks to complete. Therefore, save this page for future reference, and do not forget to share it.
Financial Modeling in Excel Training – Read me First
Step 1 – Download the Colgate Financial Model Template.
You can download this Colgate Financial Modeling Templates (Solved/Unsolved) here – Colgate Financial Modeling Templates (Solved/Unsolved)
Step 2 – Please note you will get two templates – 1) Unsolved Colgate Palmolive Financial Model and 2) Solved Colgate Palmolive Financial Model.
Step 3- You will work on the Unsolved Colgate Palmolive Financial Model Template. Follow the step-by-step instructions to prepare a fully integrated financial model.
Step 4 – Happy Learning!
If you are new to financial modeling, look at this guide on What is Financial Modeling?Financial modeling refers to the use of excel-based models to reflect a company’s projected financial performance. Such models represent the financial situation by taking into account risks and future assumptions, which are critical for making significant decisions in the future, such as raising capital or valuing a business, and interpreting their impact.read more
How to Build a Financial Model in Excel?
Let us look at how one can build a financial model from scratch. This detailed financial modeling guide will provide a step-by-step guide to creating a financial model. The primary approach taken in this financial modeling guide is Modular. The modular system essentially means building core statements like income statements, balance sheets, and cash flows using different modules/sheets. The key focus is to prepare each statement step by step and connect all the supporting programs to the core statements on completion. We understand that this may not be clear now. However, you will realize this is very easy as we move forward.
- Step 1 – Colgate’s Financial Model – Historical
- Step 2 – Ratio Analysis of Colgate Palmolive
- Step 3 – Projecting the Income Statement
- Step 4- Working Capital Forecast
- Step 5 – Depreciation Forecast
- Step 6 – Amortization Forecast
- Step 7 – Other Long Term Forecast
- Step 8 – Completing the Income Statement
- Step 9 – Shareholder’s Equity Forecast
- Step 10 – Shares Outstanding Forecast
- Step 11 – Completing the Cash Flow Statements
- Step 12- Debt and Interest Forecast
Please note the following –
- The core statements are the Income StatementThe income statement is one of the company’s financial reports that summarizes all of the company’s revenues and expenses over time in order to determine the company’s profit or loss and measure its business activity over time based on user requirements.read more, Balance SheetA balance sheet is one of the financial statements of a company that presents the shareholders’ equity, liabilities, and assets of the company at a specific point in time. It is based on the accounting equation that states that the sum of the total liabilities and the owner’s capital equals the total assets of the company.read more, and Cash Flows.
- The different sheets are the depreciationDepreciation is a systematic allocation method used to account for the costs of any physical or tangible asset throughout its useful life. Its value indicates how much of an asset’s worth has been utilized. Depreciation enables companies to generate revenue from their assets while only charging a fraction of the cost of the asset in use each year.
read more forecast, working capital forecast, intangibles forecast, shareholder’s equityShareholder’s equity is the residual interest of the shareholders in the company and is calculated as the difference between Assets and Liabilities. The Shareholders’ Equity Statement on the balance sheet details the change in the value of shareholder’s equity from the beginning to the end of an accounting period.read more forecast, other long term items forecast, debt forecast scheduleA debt schedule is the list of debts that the business owes, including term loans, debentures, cash credit, etc. Business organizations prepare this schedule to know the exact amount of the company’s liability to others and manage its cash flows to prevent the financial crisis and enable better debt management.read more, etc. - The different schedules are linked to the core statements upon their completion.
- This financial modeling guide will build a step-by-step integrated economic model of Colgate Palmolive from scratch.
Step 1 – Financial Modeling in Excel – Project the Historicals
The first step in the financial modeling guide is to prepare the historicals.
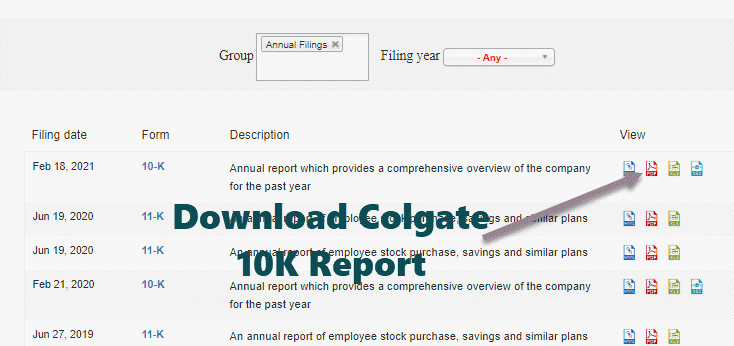
Download Colgate’s 10K Reports
One prepares financial models in Excel. The first steps start with knowing how the industry has been doing recently. Understanding the past can provide valuable insights into the company’s future. Therefore the first step is to download all the company’s financials and populate the same in an Excel sheet. For Colgate Palmolive, you can download the annual reports of Colgate Palmolive from their Investor Relation Section.
Create the Historical Financial Statements Worksheet
- If you download 10K of 2020, you will note that only two years of financial statement data is available. However, for financial modeling in Excel, the recommended dataset is to have the last 5 years of financial statements. Therefore, please download the last 3 years of the annual reportAn annual report is a document that a corporation publishes for its internal and external stakeholders to describe the company’s performance, financial information, and disclosures related to its operations. Over time, these reports have become legal and regulatory requirements.read more and populate the historical.
- Often, these tasks seem too tedious as it may take a lot of time and energy to format and put the excel in the desired format.
- However, one should not forget that this is the work you are required to do only once for each company. Populating the historicals also helps an analyst understand the trends and financial statementsFinancial statements are written reports prepared by a company’s management to present the company’s financial affairs over a given period (quarter, six monthly or yearly). These statements, which include the Balance Sheet, Income Statement, Cash Flows, and Shareholders Equity Statement, must be prepared in accordance with prescribed and standardized accounting standards to ensure uniformity in reporting at all levels.read more.
- So, please do not skip this. Instead, download and populate the data (even if you feel this is the donkey’s work).
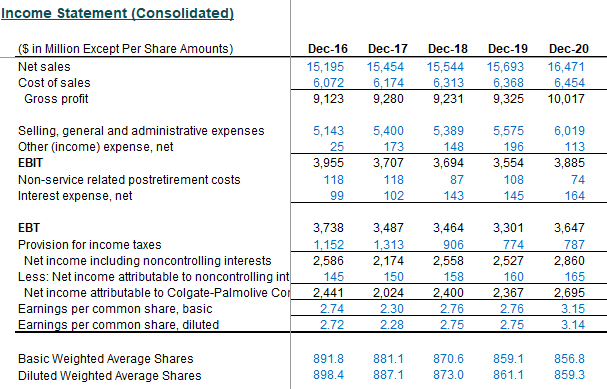
Colgate Income Statement with Historical Populated
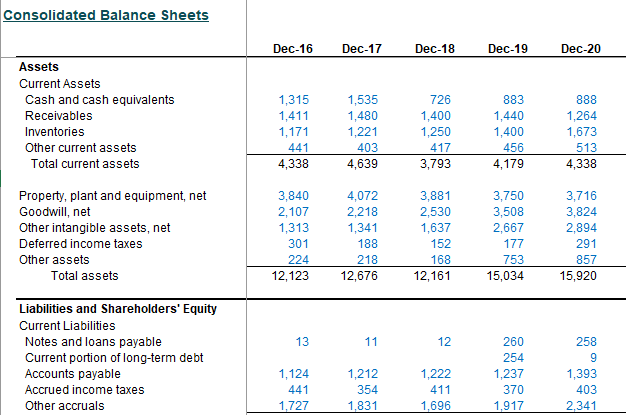
Colgate Balance Sheet Historical Data
Step 2 – Ratio Analysis
The second step in financial modeling in Excel is to perform ratio analysis. We covered this in detail in part 1 of the series – Ratio AnalysisRatio analysis is the quantitative interpretation of the company’s financial performance. It provides valuable information about the organization’s profitability, solvency, operational efficiency and liquidity positions as represented by the financial statements.read more
Vertical Analysis of Colgate
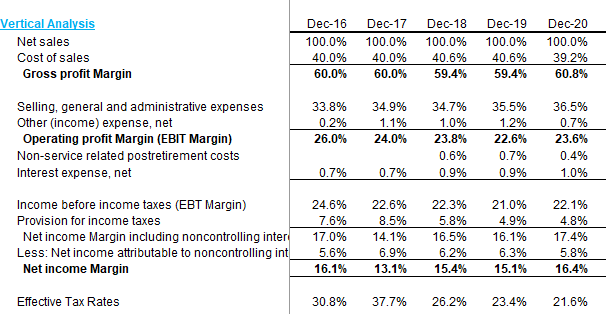
On the income statement, the vertical analysis is a universal tool for measuring the firm’s relative performance from year to year in terms of cost and profitability. Therefore, it should always be included as part of any financial analysis. Here, percentages are computed concerning net sales, which is considered 100%. This vertical analysis effort in the income statement is often referred to as margin analysis since it yields different margins concerning sales.
Horizontal Analysis of Colgate
Horizontal analysis is a technique used to evaluate trends over time by calculating percentage increases excelPercentage increase = (New Value — Old Value)/ Old Value. Instead of showing the delta as a Value, percentage increase shows how much the value has changed in terms of percentage increase.read more or decreases relative to a base year. It provides an analytical link between accounts calculated at different dates using the currency with varying purchasing powers. In effect, this analysis indexes the reports and compares these evolved. As with the vertical analysisVertical analysis is a kind of financial statement analysis wherein each item in the financial statement is shown in percentage of the base figure. The formula is: (Statement line item / Total base figure) X 100read more methodology, issues that need to be investigated and complemented with other financial analysis techniques will surface. The focus is to look for symptoms of problems that one can diagnose using additional methods.
Let us look at the horizontal analysis of Colgate.

Liquidity Ratios of Colgate
- Liquidity ratios measure the relationship of the more liquid assetsLiquid Assets are the business assets that can be converted into cash within a short period, such as cash, marketable securities, and money market instruments. They are recorded on the asset side of the company’s balance sheet.read more of an enterprise (the ones most easily convertible to cash) to current liabilities. The most common liquidity ratios are the current ratioThe current ratio is a liquidity ratio that measures how efficiently a company can repay it’ short-term loans within a year. Current ratio = current assets/current liabilities
read more, Acid test (or quick asset) ratio Cash RatiosCash Ratio is calculated by dividing the total cash and the cash equivalents of the company by total current liabilities. It indicates how quickly a business can pay off its short term liabilities using the non-current assets.read more. - Turnover Ratios like Accounts ReceivablesAccounts receivables is the money owed to a business by clients for which the business has given services or delivered a product but has not yet collected payment. They are categorized as current assets on the balance sheet as the payments expected within a year.
read more turnover, inventory turnover, and payables turnover.
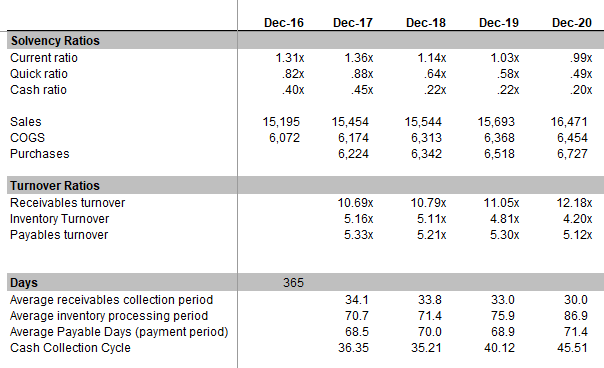
Also, have a look at this detailed article on Cash Conversion CycleThe Cash Conversion Cycle (CCC) is a ratio analysis measure to evaluate the number of days or time a company converts its inventory and other inputs into cash. It considers the days inventory outstanding, days sales outstanding and days payable outstanding for computation.read more.
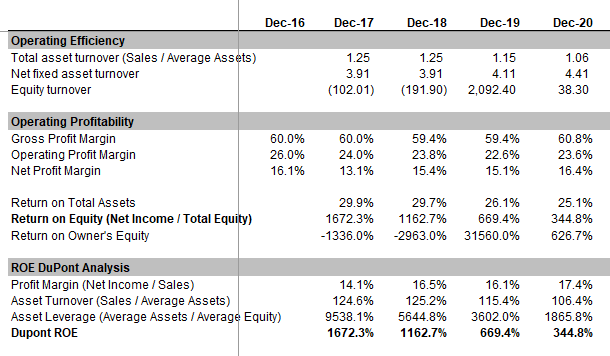
Operating Profitability Ratios of Colgate
Profitability ratiosProfitability ratios help in evaluating the ability of a company to generate income against the expenses. These ratios represent the financial viability of the company in various terms.read more are a company’s ability to generate earnings relative to sales, assets, and equity.
Risk Analysis of Colgate
Through Risk AnalysisRisk analysis refers to the process of identifying, measuring, and mitigating the uncertainties involved in a project, investment, or business. There are two types of risk analysis — quantitative and qualitative risk analysis.read more, we try to gauge whether the companies will be able to pay their short and long-term obligations (debt). We calculate leverage ratiosDebt-to-equity, debt-to-capital, debt-to-assets, and debt-to-EBITDA are examples of leverage ratios that are used to determine how much debt a company has taken out against its assets or equity.read more that focus on the sufficiency of assets or generation from assets. Rates that looks at are:
- Debt to Equity Ratio
- Debt ratio
- Interest Coverage RatioThe interest coverage ratio indicates how many times a company’s current earnings before interest and taxes can be used to pay interest on its outstanding debt. It can be used to determine a company’s liquidity position by evaluating how easily it can pay interest on its outstanding debt.read more

Step 3 – Financial Modeling in Excel – Project the Income Statement
The third step in financial modeling is to forecast the income statement, wherein we will start with modeling the sales or revenue items.
Revenues Projections
For most companies, revenues are a fundamental driver of economic performance. Therefore, a well-designed and logical revenue model reflecting the type and amounts of income flows accurately is extremely important. There are as many ways to create a revenue schedule as there are businesses. Some common types include:
- Sales Growth: Sales growth assumption in each period defines the change from the previous period. It is a simple and commonly used method but offers no insights into the components or dynamics of growth.
- Inflationary and Volume/ Mix effects: Instead of a simple growth assumption, a price inflation factor and a volume factor are used. This useful approach allows the modeling of fixed and variable costs in multi-product companies and considers price vs. volume movements.
- Unit Volume, Change in Volume, Average Price, and Change in Price: This method is appropriate for businesses with a simple product mix. It permits analysis of the impact of several key variables.
- Dollar Market Size and Growth: Market share and change in share – useful for cases where information is available on market dynamicsMarket Dynamics is defined as the forces of market constituents responsible for the shift in the demand and supply curve and are therefore accountable for creating and reducing the demand and supply of a particular product.read more and where these assumptions are likely to be fundamental to a decision. For example, the telecom industry.
- Unit Market Size and Growth: This is more detailed than the preceding case and is useful when pricing in the market is a crucial variable. (For a company with a price-discounting strategy. For example, a best-of-breed premium-priced niche player) e.g., the luxury car market
- Volume Capacity, Capacity Utilization Rate, and Average Price: These assumptions can be important for businesses where production capacity is essential to the decision. (In purchasing additional capacity, for example, or determining whether the expansion would require new investments).
- Product Availability and Pricing
- Revenue was driven by investment in capital, marketing, or R&D
- Revenue-based on installed base (continuing sales of parts, disposables, services, add-ons, etc.). Examples include classic razor-blade businesses and businesses like computers where sales of service, software, and upgrades are essential. Again, modeling the installed base is key (new additions to the floor, attrition in the ground, continuing revenues per customer, etc.).
- Employee based: For example, revenues of professional services firms or sales-based firms such as brokers. Modeling should focus on net staffing and revenue per employeeRevenue Per Employee is the ratio of total revenue over total number of employees in a particular accounting period. It gives an idea about how the business performed.read more (often based on billable hours). More detailed models will include seniority and other factors affecting pricing.
- Store, facility, or Square footage based: Retail companies are often modeled based on stores (old stores plus new stores each year) and revenue per store.
- Occupancy-factor-based: This approach applies to airlines, hotels, movie theatres, and other businesses with low marginal costs.
Projecting Colgate Revenues
Let us now look at the Colgate 10K 2020 report. First, Colgate has not provided segmental information in the income statement. However, as additional information, Colgate has provided details of each segment.
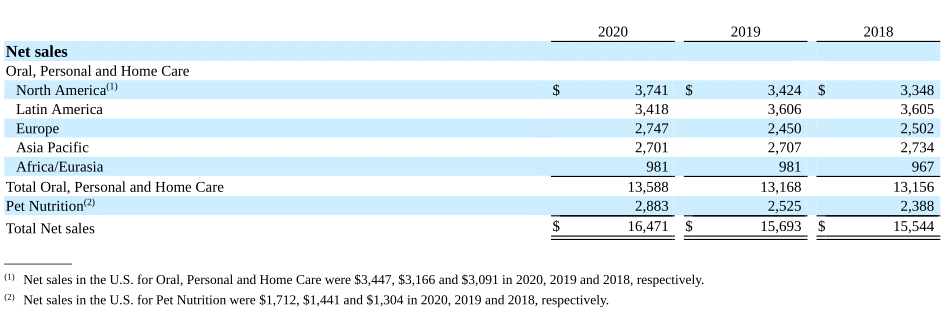
Source – Colgate 2020 – 10K, Page 119
Since we do not have any further information about the features, we will project the future sales of Colgate based on this available data. We will use the sales growth approach across segments to derive the forecasts. Please see the picture below. We have calculated the year-over-year growth rate for each element.

Now, we can assume a sales growth percentage based on the historical trends and project the revenues under each part. Therefore, total net sales are the total of the Oral, Personal & Home Care, and Pet Nutrition Segment.
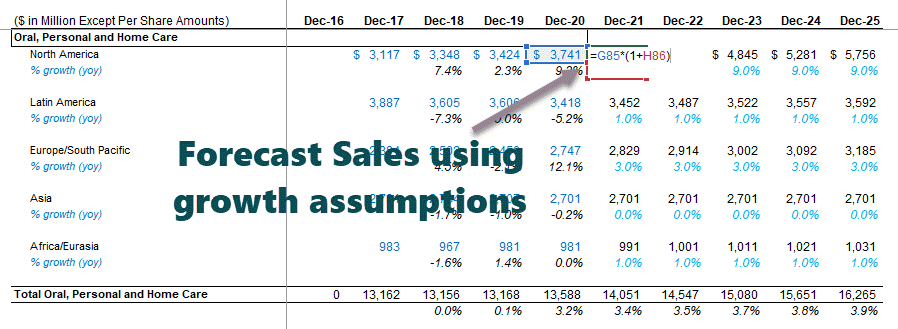
Costs Projections
- Percentage of Revenues: Simple but offers no insight into any leverage (economy of scale or fixed cost burden.
- Costs other than depreciation as a percent of revenues and depreciation from a different schedule: This approach is the minimum acceptable in most cases and permits only partial analysis of operating leverageOperating Leverage is an accounting metric that helps the analyst in analyzing how a company’s operations are related to the company’s revenues. The ratio gives details about how much of a revenue increase will the company have with a specific percentage of sales increase – which puts the predictability of sales into the forefront.read more.
- Variable costs based on revenue or volume, fixed costs based on historical trends, and depreciation from a different schedule. This approach is the minimum necessary for sensitivity analysisSensitivity analysis is a type of analysis that is based on what-if analysis, which examines how independent factors influence the dependent aspect and predicts the outcome when an analysis is performed under certain conditions.read more of profitability based on multiple revenue scenarios.
Cost Projections for Colgate
For projecting the cost, the vertical analysis done earlier will be helpful. So, let us have a relook at the vertical analysis:
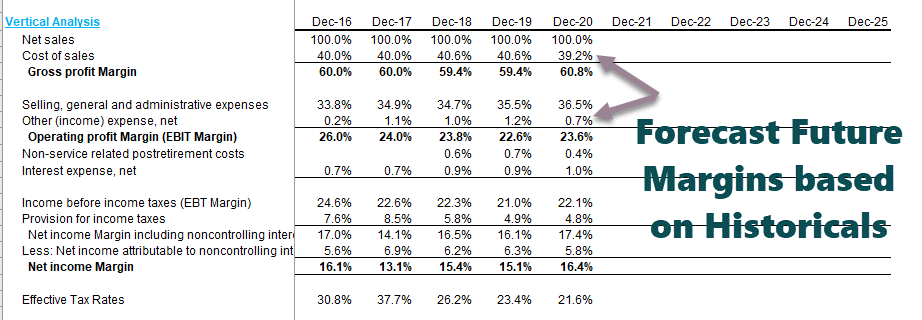
- Since we have already forecasted sales, all the other costs are some margins of these sales.
- The approach is to take the guidelines from the historical cost and expense margins and then forecast the future margin.
- For example, the cost of sales has been in the range of 39.2%-40.6% for the past five years. So we can look at forecasting the margins on this basis.
- Likewise, selling, general, and Administrative ExpensesSelling, general and administrative (SG&A) expense includes all the expenses incurred in the selling of the products of the company whether direct or indirect along with the entire general and the administrative expenses during an accounting period under consideration such as advertisement expenses, sales promotion expenses, marketing salaries, etc.read more have been historically in the range of 33.8%-36.5%. We can assume the future SG&A expense margin on this basis. Likewise, we can go on for another set of expenses.
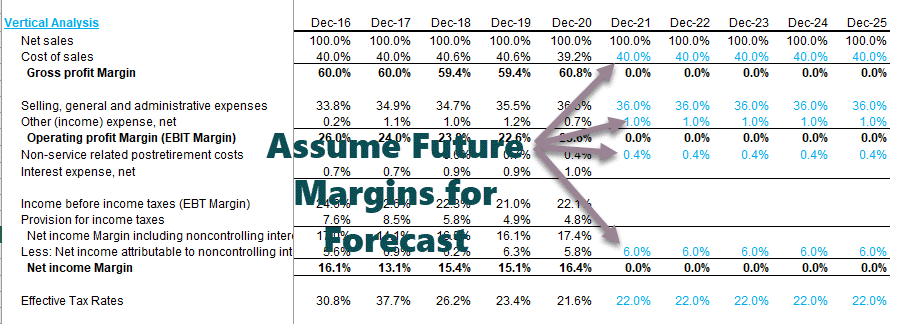
Using the above margins, we can find the actual values by back calculations.
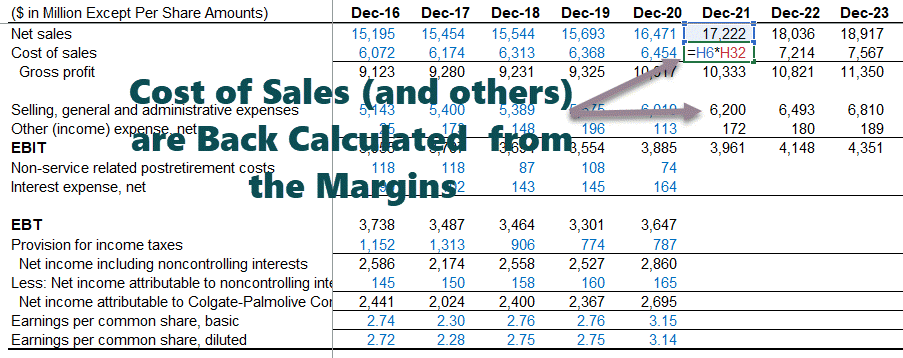
We use the effective tax rate assumption to calculate the provision for taxes.
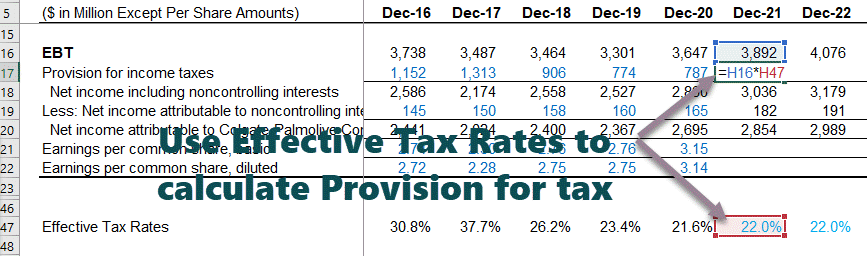
- Also, note that we do not complete the “Interest Expense (Income)” row as we will look at the income statement later.
- Interest Expense and Interest Income.Interest Income is the amount of revenue generated by interest-yielding investments like certificates of deposit, savings accounts, or other investments & it is reported in the Company’s income statement. read more
- We have also not calculated depreciation and amortization, which we have already included in the cost of sales.
- This completes the income statement (at least for the time being!).
Step 4- Financial Modeling – Working Capital Schedule
Now that we have completed the income statement, the fourth step in financial modeling is to look at the working capital schedule.
Below are the steps that one must follow for a working capital schedule.
Link the Net Sales and Cost of Sales
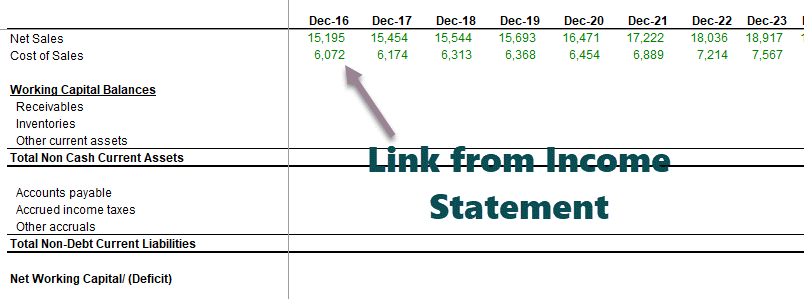
- Reference the past data from the balance sheet.
- Calculate net working capitalThe change in net working capital of a firm from one accounting period to the next is referred to as the change in net working capital. It is calculated to ensure that the firm maintains sufficient working capital in each accounting period so that there is no shortage of funds or that funds do not sit idle in the future.read more
- Arrive at an increase/ decrease in working capital
- Note that we have not included short-term debt and cash and cash equivalents in the working capital. We will deal with debt and cash and cash equivalentsCash and Cash Equivalents are assets that are short-term and highly liquid investments that can be readily converted into cash and have a low risk of price fluctuation. Cash and paper money, US Treasury bills, undeposited receipts, and Money Market funds are its examples. They are normally found as a line item on the top of the balance sheet asset. read more separately.
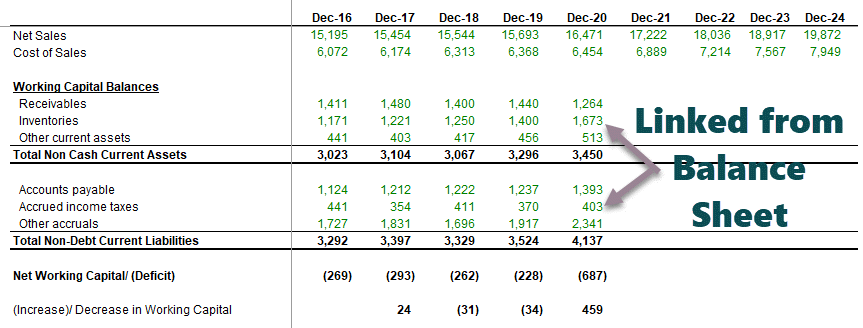
Calculate the Turnover Ratios
- Calculate historical ratios and percentages
- Use the ending or average balance.
- Both are acceptable as long as consistency is maintained.
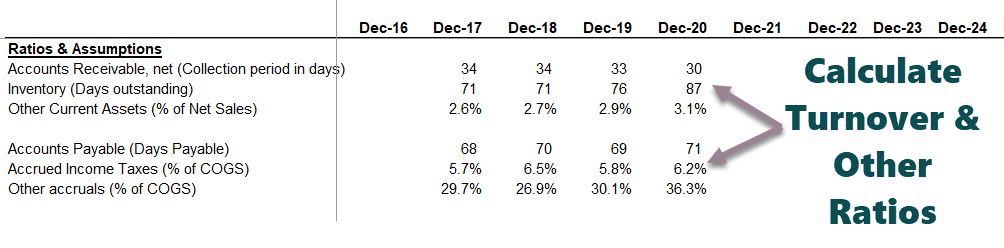
Populate the assumptions for future working capital items
- Certain items without a prominent driver are assumed usually at constant amounts.
- Ensure assumptions are reasonable and in line with the business.

Project the future working capital balances
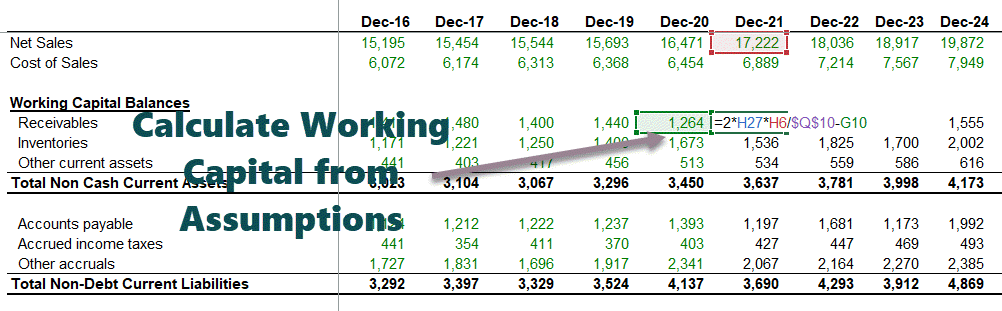
Calculate the changes in Working Capital
- Arrive at cash flows based on individual line items.
- Ensure signs are accurate!
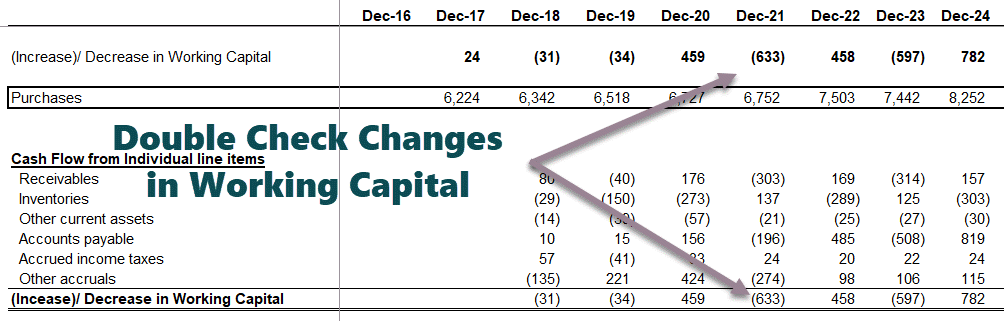
Link up the Working Capital Forecasts to the Balance Sheet
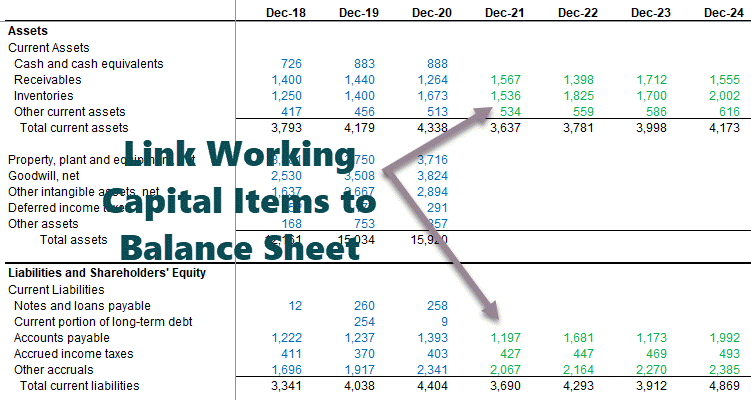
Link Working Capital Items to the Cash Flow Statement 
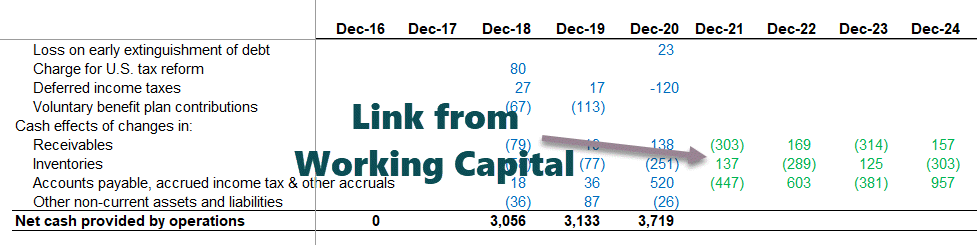
Step 5 – Financial Modeling in Excel – Depreciation Schedule
With the completion of the working capital schedule, the next step in this financial modeling is to project the CapexCapex or Capital Expenditure is the expense of the company’s total purchases of assets during a given period determined by adding the net increase in factory, property, equipment, and depreciation expense during a fiscal year.read more of Colgate and the depreciation and assets figures.

source – Colgate 10K 2020 Page – 72
- It has not provided depreciation and amortization as separate line items. However, it is included in the cost of sales.
- In such cases, please look at the cash flow statements, where you will find the depreciation and amortization expense. Also, note that the below figures are 1) Depreciation and 2) amortization. So, what is the depreciation number?
- Ending Balance for PPE = Beginning balance + Capex – Depreciation – Adjustment for Asset Sales (BASE equation).

Link the Net Sales figures in the Depreciation Schedule
- Set up the line items
- Reference net sales
- Input past capital expenditures
- Arrive at Capex as a % of net sales
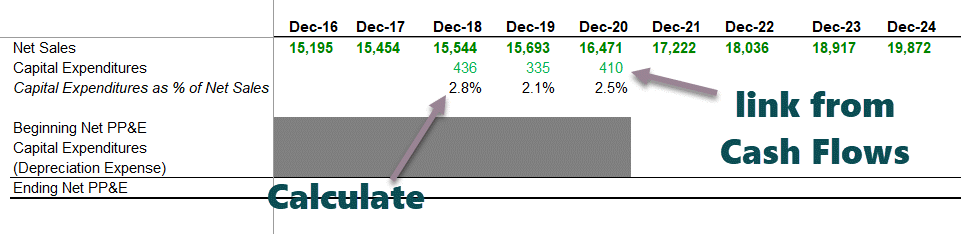
Forecast the Capital Expenditure Items
- There are various approaches to forecasting capital expenditure. One common practice is to look at the press releases, management projections, and MD&A to understand the company’s view on future capital expenditure.
- If the company has guided future capital expenditure, we can take those numbers directly.
- However, if the Capex numbers are not directly available, we can calculate it crudely using Capex as % of Sales (as done below).
- Use your judgment based on industry knowledge and other reasonable drivers.
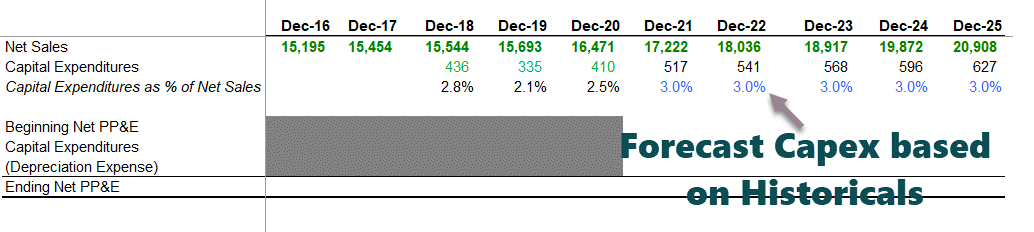
Reference Past Information and Calculate Net PP&E
- We will use Ending Balance for PPE = Beginning balance + Capex – Depreciation – Adjustment for Asset Sales (BASE equation)
- It is complicated to reconcile past PP&E due to restatementsA restatement is the revision of already issued financial statements of one or more companies to correct errors with material inaccuracy due to non adhering and complying with the GAAP, accounting mistakes, fraud, or clerical errors affecting part of the entire financial statement requiring a completely new audit.read more, asset sales, etc.
- It is therefore recommended not to reconcile the past PPE as it may lead to some confusion.
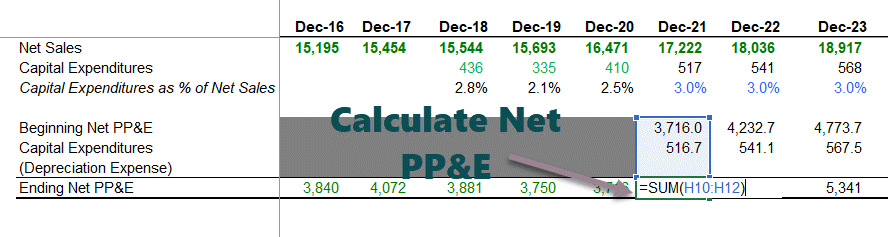
Depreciation Policy of Colgate
- Colgate has not explicitly provided a detailed breakup of the Assets. Instead, they clubbed all assets into the land, building, machinery, and other equipment.
- Also, useful lives for machinery and equipment are provided in range. In this case, we will have to do some guesswork to determine the average useful life left for the assets.
- Also, guidance for useful life is not provided for “Other equipment.” Therefore, we will have to estimate the useful life of other equipment.
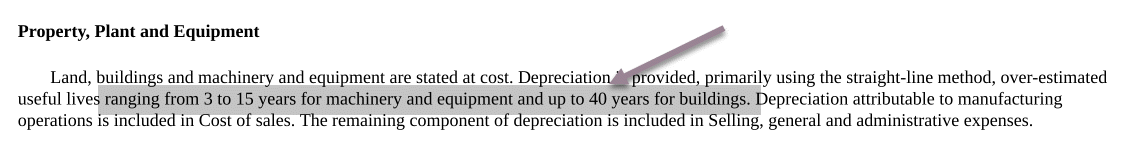
Colgate 2020 – 10K, Page 79
Below is the breakup of 2012 and 2013 Property, Plant, and Equipment Details
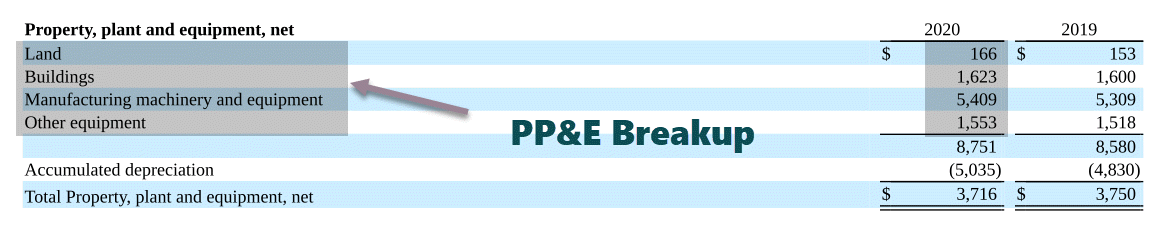
Colgate 2020 – 10K, Page 125
Estimate the breakup of Property Plant and Equipment (PPE)
- First, find the Asset weights of the Current PPE (2020)
- We will assume that these asset weights of 2020 PPE will continue going forward.
- We use these asset weights to calculate the breakup of estimated capital expenditure.
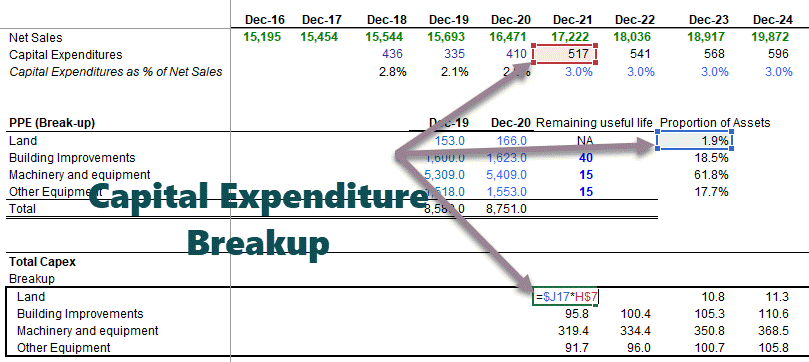
Estimate the Depreciation of Assets
- Please note that we do not calculate depreciation of LandThe land is a company asset with an infinite useful life. As a result, it is not subject to depreciation, unlike other long-term assets such as buildings and furniture, which have a limited useful life and thus require their costs to be allocated to the accounting period.read more as land is not a depreciable asset.
- For estimating depreciation from Building improvements, we first make use of the below structure.
- Depreciation here is divided into two parts: 1)Depreciation from the building improvements asset already listed on the balance sheet, 2) depreciation from the future Building improvements.
- We use the simple Straight Line Method of depreciationStraight Line Depreciation Method is one of the most popular methods of depreciation where the asset uniformly depreciates over its useful life and the cost of the asset is evenly spread over its useful and functional life. read more to calculate the depreciation from building improvements listed on the asset.
- For calculating future depreciation, we first transpose the Capex using the TRANSPOSE Function in ExcelThe TRANSPOSE function in excel helps rotate (switch) the values from rows to columns and vice versa. Being a part of the Excel lookup and reference functions, its purpose is to organize the data in the desired format. To execute the formula, the exact size of the range to be transposed is selected and the CSE key (“Control+Shift+Enter”) is pressed.
read more. - We calculate the depreciation from asset contributions from each year.
- Also, the first-year depreciation is divided by two as we assume the mid-year convention for asset deployment.

Total Depreciation of BuildingDepreciation of building refers to reducing the recorded cost of a building until the value of the structure either becomes zero or reaches its salvage value. In addition, it helps to map the revenue in the form of lease rental generated during the corresponding expenses.read more improvement = depreciation from the asset already listed on the balance sheet + depreciation from the future building improvements.
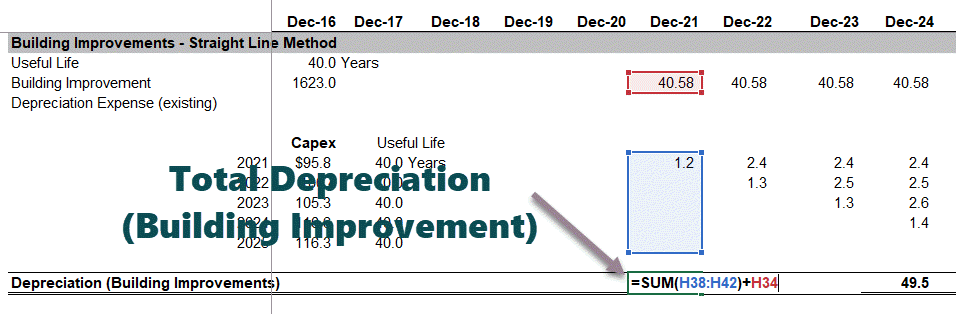
In the above process for estimating depreciation, one may calculate the depreciation of 1) manufacturing equipment & machinery and 2) other equipment, as shown below.
Total Depreciation of Colgate = Depreciation (Building Improvements) + Depreciation (Machinery & Equipment) + Depreciation (additional equipment)
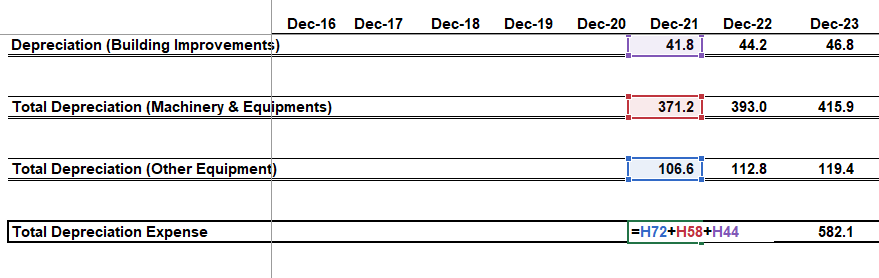
Once we have found the real depreciation figures, we can put that in the BASE equation as shown below.
- With this, we get the ending net PP&E figures for each year.
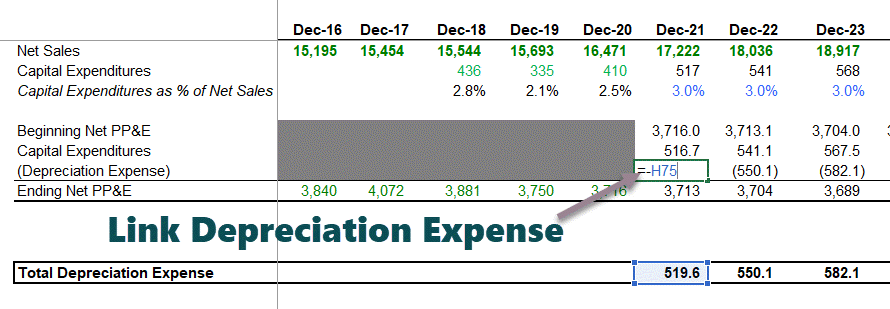
Link the Net PP&E to the Balance Sheet
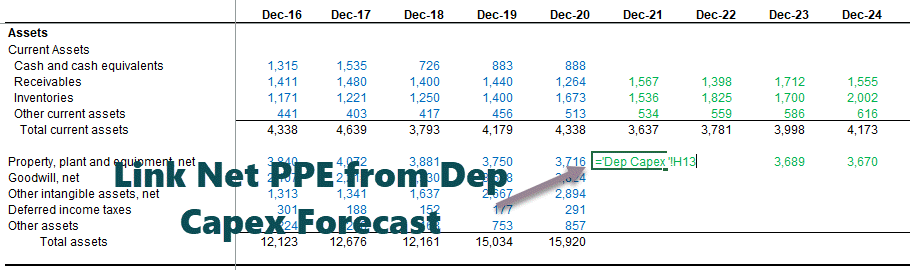
Step 6 – Amortization Schedule
The sixth step in this financial modeling in Excel is to forecast the amortization. Again, we have two broad categories to consider here – 1) GoodwillIn accounting, goodwill is an intangible asset that is generated when one company purchases another company for a price that is greater than the sum of the company’s net identifiable assets at the time of acquisition. It is determined by subtracting the fair value of the company’s net identifiable assets from the total purchase price.read more and 2) Other Intangibles.
Forecasting Goodwill
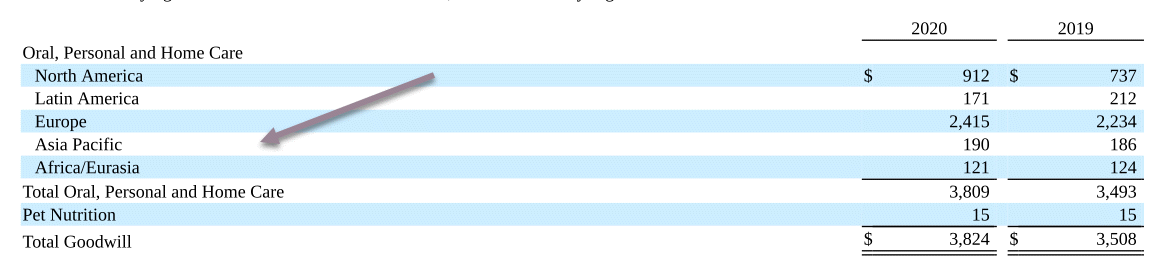
Colgate 2020 – 10K, Page 88
- Goodwill comes on the balance sheet when a company acquires another company. It usually is complicated to project goodwill for future years.
- However, Goodwill is subject to impairment tests annually, which the company performs. Therefore, analysts are in no position to conduct such tests and prepare estimates of impairments.
- Most analysts do not project goodwill. They just keep this constant, which we will do in our case.
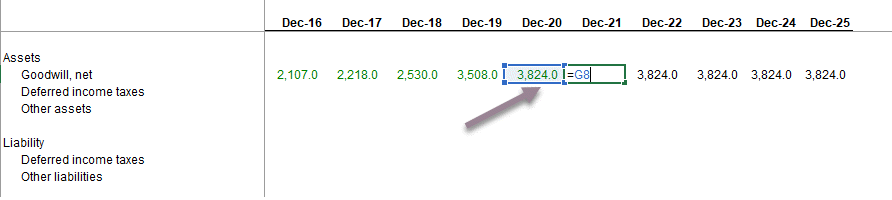
Forecasting Other Intangible Assets
- Colgate’s 10K Report notes that most of the finite life intangible is related to the Sanex acquisition.
- “Additions to Intangibles” are also complicated to project.
- Colgate’s 10K report provides us with the details of the next five years of amortization expenses.
- We will use these estimates in our financial model.
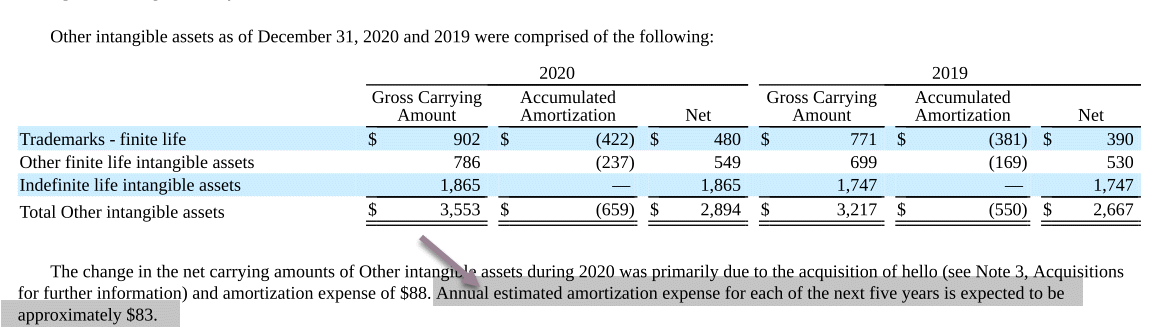
Colgate 2020 – 10K, Page 88
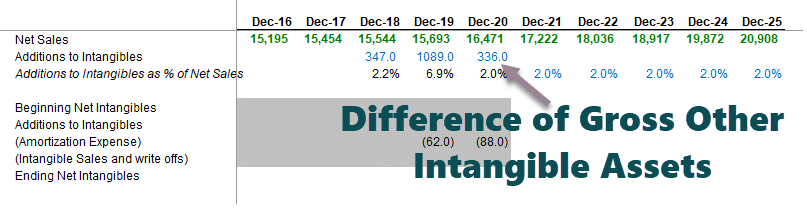
Calculate Ending Net Intangibles
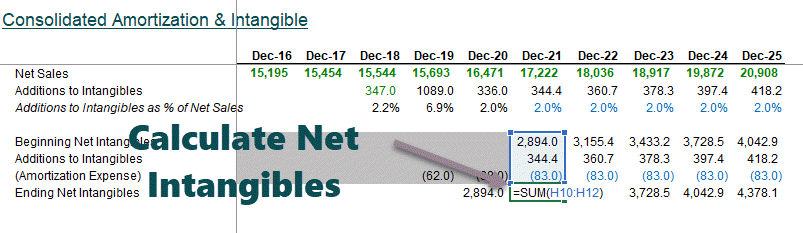
Ending net intangibles are linked to the “Other Intangible Assets.”
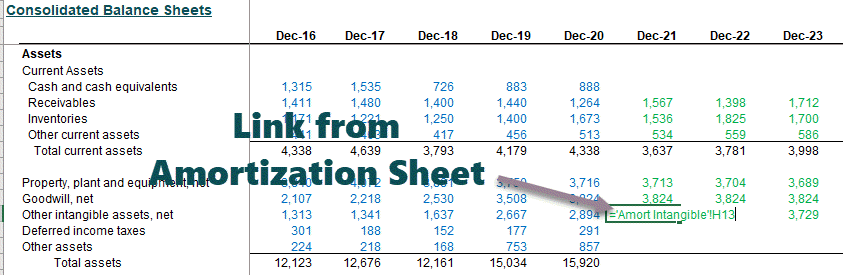
Link Depreciation and Amortization to Cash Flow Statements
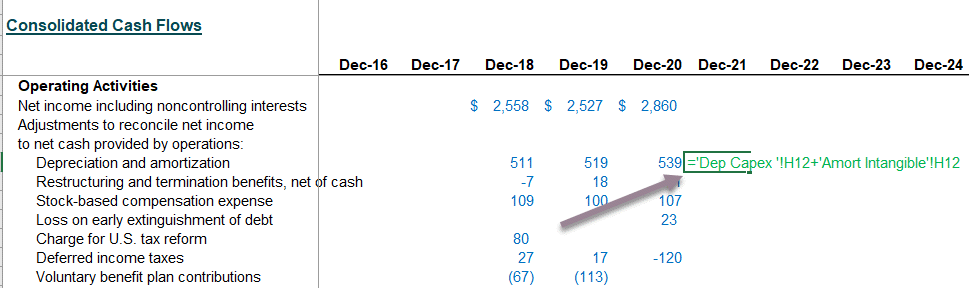
Link Capex & Addition to Intangibles to Cash flow statements
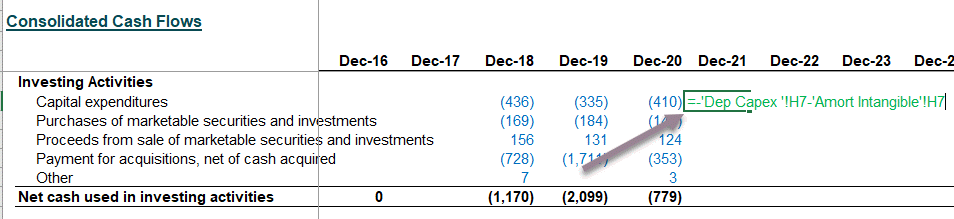
Step 7 – Other Long Term Schedule
The next step in this financial modeling is to prepare the other long-term schedule. It is when we prepare for the “leftovers” that do not have specific drivers for forecasting. In the case of Colgate, the other long-term items (leftovers) were Deferred Income TaxesDeferred income tax is a balance sheet item that can be either a liability or an asset since it is a difference in income recognition between the firm’s accounting records and the tax law, resulting in the company’s income tax due being different than the total tax expense reported.read more (liability and assets), other investments, and other liabilities.
Reference the historical data from the Balance Sheet
Also, calculate the changes in these items.
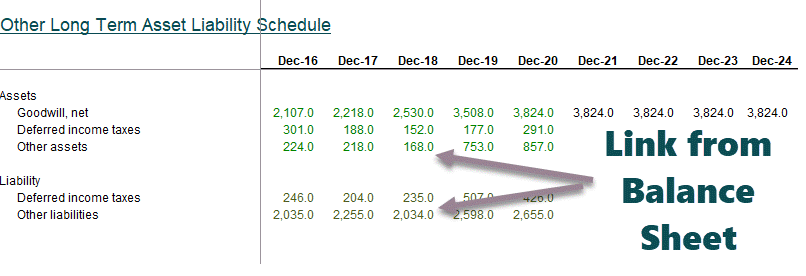
Forecast the Long Term Assets and Liabilities
- Keep the long-term items constant for projected years in case of no visible drivers.
- Link the forecasted long term items to the Balance SheetAssets such as cash, inventories, accounts receivable, investments, prepaid expenses, and fixed assets; liabilities such as long-term debt, short-term debt, Accounts payable, and so on are all included in the balance sheet.read more as shown below.
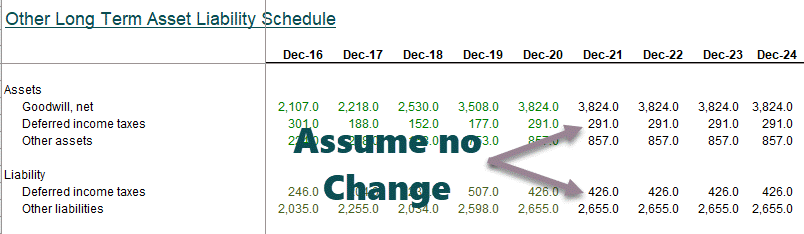
Reference Other Long Term Items to the Balance Sheet

Link the long term items to the Cash Flow Statement
Please note that if we keep the long-term assets and liabilities constant, the change that flows to the cash flow statement would be zero.
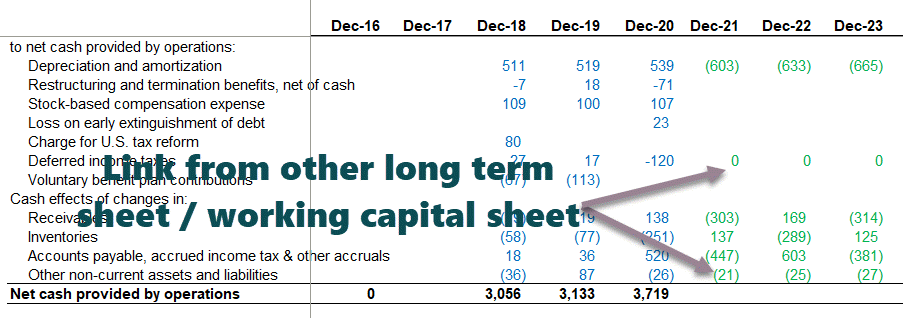
Step 8 – Financial Modeling in Excel – Completing the Income Statement
- Before we move any further in this Excel-based financial modeling, we will review the income statement.
- Populate the historical basic weighted average shares and dilute the weighted average number of shares
- These figures are available in Colgate’s 10K report.
Reference the basic and diluted shares
At this stage, assume that the future number of primary and diluted shares will remain the same as in 2020.
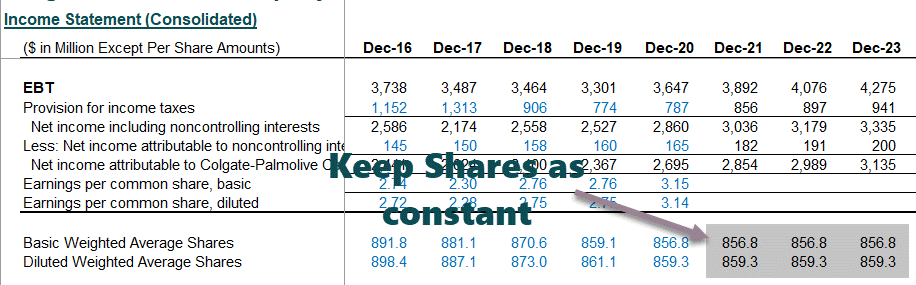
We are ready to move to our next shareholder’s equity schedule.

Step 9 – Financial Modelling – Shareholder’s Equity Schedule
The next step in this financial modeling in Excel training is to look at the shareholder’s equity schedule. The primary objective of this schedule is to project equity-related items like shareholder’s equity, dividends, Share buybackShare buyback refers to the repurchase of the company’s own outstanding shares from the open market using the accumulated funds of the company to decrease the outstanding shares in the company’s balance sheet. This is done either to increase the value of the existing shares or to prevent various shareholders from controlling the company.read more, option proceeds, etc.
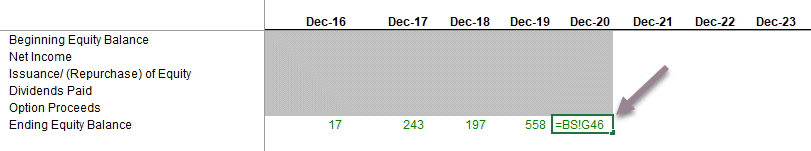
Colgate’s 10K report provides us with the details of common and treasury stock activities in the past years, as shown below.
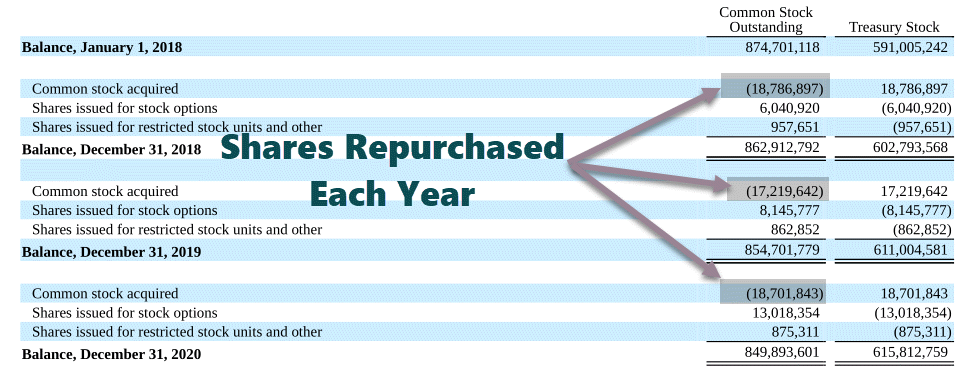
Colgate 10K 2020 – Page 97
- Historically, Colgate has repurchased shares, as shown in the schedule above.
- Populate Colgate’s shares repurchase (millions) in the Excel sheet.
- Link the historical diluted EPS from the income statement.
- The historical amount repurchased should be referenced from the cash flow statementsA Statement of Cash Flow is an accounting document that tracks the incoming and outgoing cash and cash equivalents from a business.read more.
Also, have a look at Accelerated Share RepurchaseAccelerated share repurchase (buyback) is a strategy adopted by a publicly-traded company to acquire its outstanding shares in the market from the clients in large blocks via an investment bank.read more.
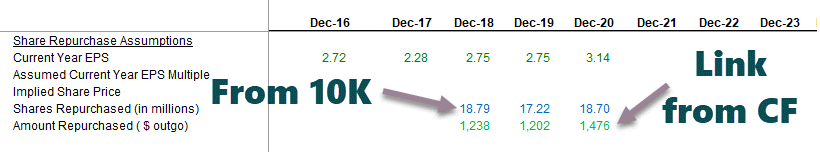
- Calculate the implied average price at which Colgate has done share repurchases historically. One may calculate the Amount repurchased / Number of shares.
- Calculate the PE multipleThe price to earnings (PE) ratio measures the relative value of the corporate stocks, i.e., whether it is undervalued or overvalued. It is calculated as the proportion of the current price per share to the earnings per share. read more = Implied Share Price / EPS

Colgate has not officially announced how many shares they intend to buy back. The only information that their 10K report shares are that they have authorized a buyback of up to 50 million shares.

Colgate 10K 2020 – Page 97
- We need to assume the share repurchase amount to find the number of shares repurchased. Based on the historical repurchase amount, we have taken this number as $1,500 million for all the future years.
- We need the projected implied share price of the potential buyback to find the number of shares repurchased.
- Actual share price = assumed PE multiplex EPS.
- One can assume future buyback PE multiple based on historical trends. We note that Colgate has repurchased shares at an average PE range of 17x – 25x.
- Below is the snapshot from Reuters that helps us validate the PE range for Colgate.

- In our case, we have assumed that all future buybacks of Colgate will be at a PE multiple of 25x.
- Using the PE of 25x, we can find the implied price = EPS x 25.
- Now that we have found the implied price, we can see the number of shares repurchased = $ amount used for repurchase / implied price.
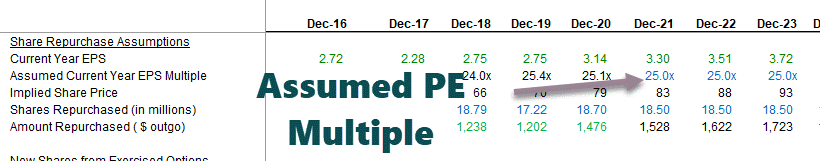
Stock Options: Populate Historical Data
- The common stock and shareholder’s equity summary shows us the number of options exercises each year.
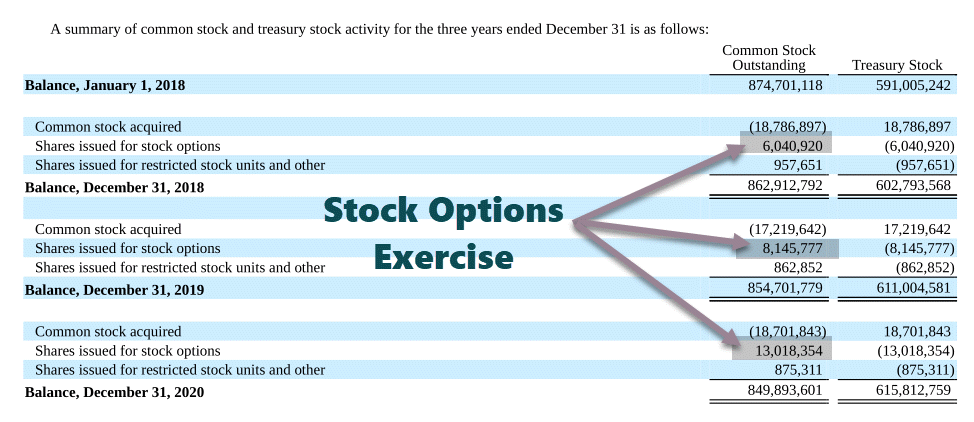
Colgate 2020 – 10K, Page 97
- Besides, we also have the option proceeds from the cash flow statements (approx).
- With this, we should be able to find an effective strike priceExercise price or strike price refers to the price at which the underlying stock is purchased or sold by the persons trading in the options of calls & puts available in the derivative trading. Thus, the exercise price is a term used in the derivative market.read more.
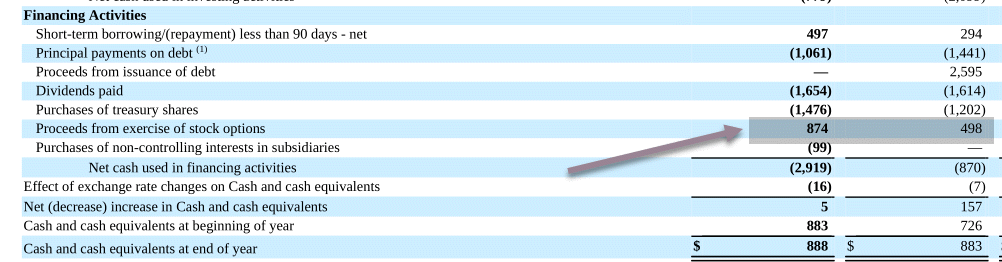
Colgate 2020 – 10K, Page 76
Also, note that the stock optionsStock options are derivative instruments that give the holder the right to buy or sell any stock at a predetermined price regardless of the prevailing market prices. It typically consists of four components: the strike price, the expiry date, the lot size, and the share premium.read more have contractual terms of eight years and vest over three years.

Colgate 2020 – 10K, Page 100
With this data, we fill up the options data as per below. We also note that the weighted average strike price of stock options for 2020 was $72, and the number of options outstanding was 27.541 million.
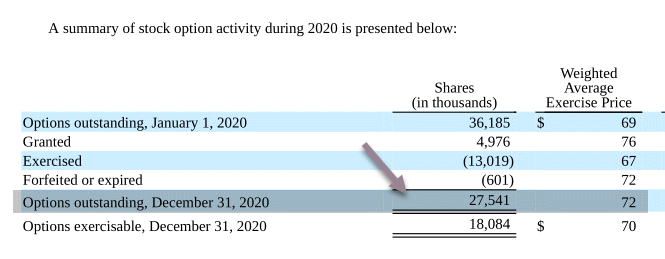
Colgate 2020 – 10K, Page 100
Stock Options: Find the Option Proceeds.
Our options data below shows that the option proceeds were $504 million in 2021. We have assumed that 7 million options exercise each year.
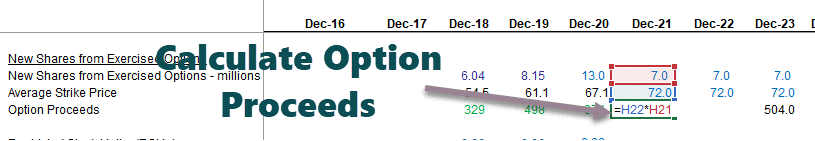
Stock Options: Forecast Restricted Stock Unit Data
In addition to the stock options, there are Restricted Stock UnitsRestricted Stock Units or RSU can be defined as stock-based compensation that is issued as company’s stock to an employee. The company establishes vesting requirements based on the performance of an individual and the length of the employment.read more are given to the employees and awarded and vested at the end of each three-year performance period.

Colgate 2020 – 10K, Page 99
Populating this data in the restricted stock units dataset.
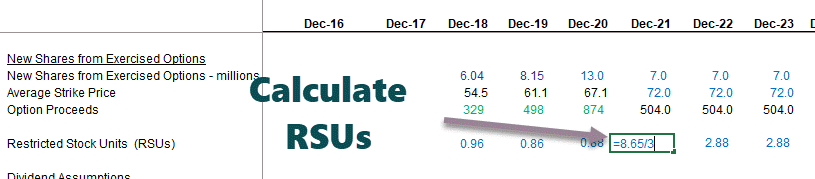
The restricted stock units project to be (8.65/3.0 years), i.e., 2.88 million going forward.
Also, have a look at the Treasury Stock MethodTreasury Stock Method is an accounting approach assuming that the options & stock warrants are exercised at the beginning of the year (or date of issue, if later) & proceeds from the exercise of these options & warrants are used to repurchase shares in the market. read more.
Dividends: Forecast the Dividends
- Forecast estimated dividends using the Dividend Payout Ratio.
- Fixed dividend outgo per-share payout.
- From the 10K reports, we extract all past information on dividends.
- With the information on dividends paid, we can find the Dividend Payout Ratio = Total Dividends Paid / Net Income.
- We have calculated the dividends payout ratio of Colgate as seen below:
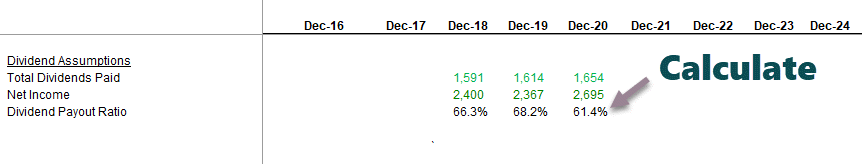
We note that the dividends payout ratio has been broadly in the range of 60%-66%. Therefore, let us assume the dividend payout ratio of 60% in the future years.
- We can also link the projected net income from the income statement.
- Using the projected net income and the dividends payout ratio, we can find the total dividends paid.
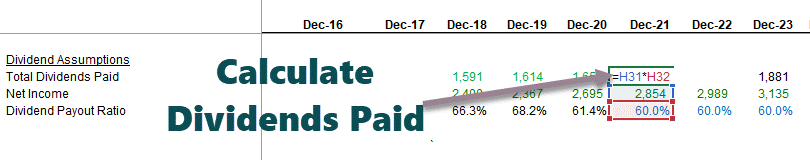
Forecast equity account in its entirety
With the forecast of share repurchase, option proceeds, and dividends, we are ready to complete the shareholder’s equity schedule. Link all these up to find the ending equity balance for each year, as shown below.
Link Ending Shareholder’s Equity to the Balance Sheet

Step 10 – Shares Outstanding Schedule
The next step in this online financial modeling in Excel training is to look at the shares’ outstanding schedule. Summary of shares outstanding schedule:
- Basic Shares – actual and average
- Capture past effects of options and convertibles as appropriate
- Diluted SharesDiluted shares can be defined as the total number of shares that the company has at a particular point that can be converted into the normal share by the holders (convertible bond, convertible preferred stock, employee stock options). It is done by exercising the right to alter such shares into ordinary shares.read more – average
- Reference Shares repurchased and new shares from exercised options
- Calculate forecasted raw percentages (actual)
- Calculate average basic and diluted shares
- Reference projected shares to Income Statement (recall Income Statement Build up!)
- Input historical shares outstandingOutstanding shares are the stocks available with the company’s shareholders at a given point of time after excluding the shares that the entity had repurchased. It is shown as a part of the owner’s equity in the liability side of the company’s balance sheet.read more information
- Note: Commonly, this schedule integrates with the equity schedule.
Input the historical numbers from the 10K report
- Shares issuedShares Issued refers to the number of shares distributed by a company to its shareholders, who range from the general public and insiders to institutional investors. They are recorded as owner’s equity on the Company’s balance sheet.read more (actual realization of options) and shares repurchased can be referenced from the shareholder’s equity schedule.
- The input weighted an average number of sharesWeighted Average Shares Outstanding is a calculation used to estimate the variations in a Company’s outstanding shares during a given period. It is determined by multiplying the outstanding number of shares (consider issuance & buybacks) in a given reporting period with their individual time-weighted portions. read more and the effect of stock options for the historical years.
Basic Shares (Ending) = Basic Shares (Beginning) + Share Issuances – Shares Repurchased.
Find the basic weighted average shares
- We find an average of two years, as shown below.
- Also, add the effect of options and restricted stock units (referenced from the shareholder’s equity schedule) to find the diluted weighted average shares.
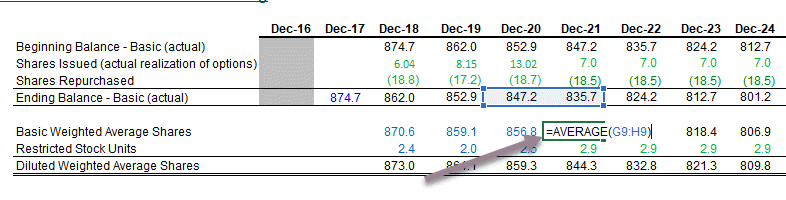
Link Basic & diluted weighted shares to Income Statement
- Now that we have calculated the diluted weighted average shares, it is time to update the same in the income statement.
- Link up forecasted diluted weighted average shares outstandingWeighted Average Shares Outstanding is a calculation used to estimate the variations in a Company’s outstanding shares during a given period. It is determined by multiplying the outstanding number of shares (consider issuance & buybacks) in a given reporting period with their individual time-weighted portions. read more to the income statement as shown below
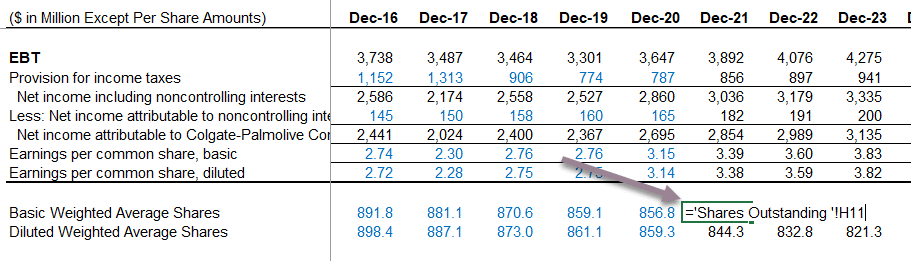
With this, we complete the shares’ outstanding schedule and time to move to our next set of statements.
Step 11 – Completing the Cash Flow Statements
We must fully complete the cash flow statements before we move to our next and final schedule in this financial modeling, i.e., the debt schedule. Until this stage, there are only a couple of incomplete things.
- Income Statement – interest expense/ income are incomplete at this stage
- Balance Sheet – cash and debt items are incomplete at this stage
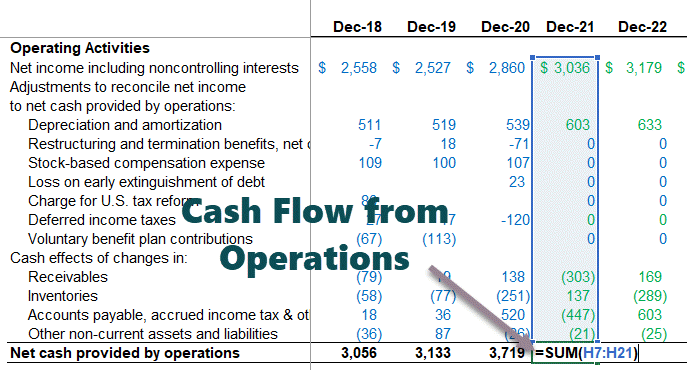
Calculate Cash Flow for Financing Activities

Also, check out Cash Flow from FinancingCash flow from financing activities refers to inflow and the outflow of cash from the financing activities like change in capital from securities like equity or preference shares, issuing debt, debentures or repayment of a debt, payment of dividend or interest on securities.read more
Find net increase (decrease) in Cash & Cash Equivalents

Complete the cash flow statements
Find the year-end cash and cash equivalents at the end of the year.
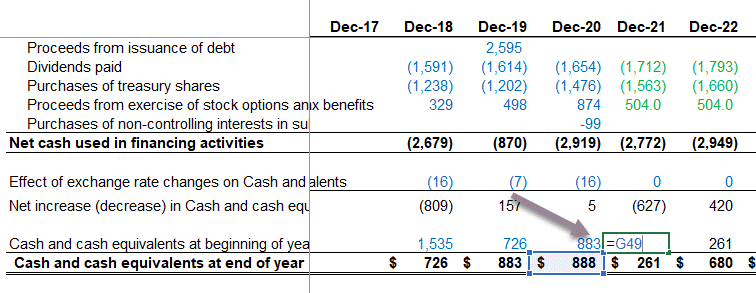
Link the cash & cash equivalents to the Balance Sheet.
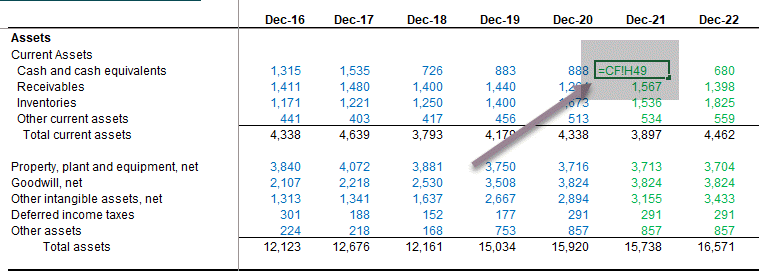
Now we are ready to take care of our last and final schedule, i.e., Debt and Interest Schedule
Step 12 – Financial Modeling in Excel – Debt and Interest Schedule
The next step in this online financial modeling is to complete the debt and interest schedule. Summary of the Debt and Interest – Schedule.
Set up a Debt Schedule
- Reference the cash flow available for financing
- Reference all equity sources and uses of cash
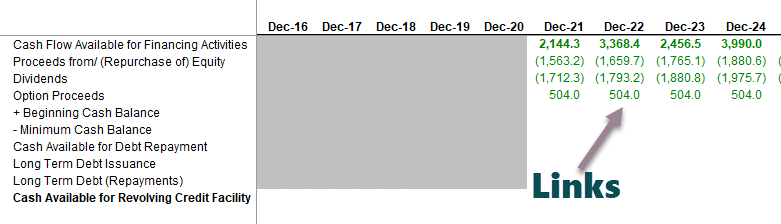
Calculate Cash Flow from Debt Repayment
- Reference the beginning cash balance from the balance sheet.
- Deduct a minimum cash balance. We have assumed that Colgate would like to keep a minimum of $500 million yearly.
Skip long-term debt issuance/ repayments, cash available for revolving credit facility, and revolver section.
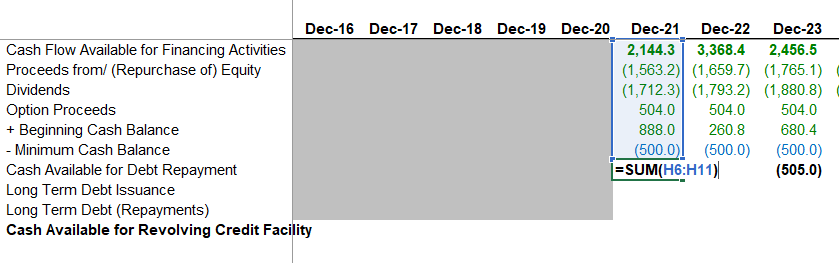
Colgate’s 10K report notes the available details on the revolved credit facility.

Colgate 2020 – 10K, Page 49
Also provided in additional information on debt is the committed long-term debt repayments.
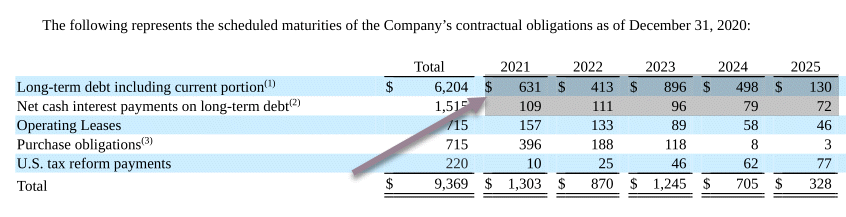
Colgate 2020 – 10K, Page 50
Calculate the Ending Long Term Debt.
We use the long-term debt repayment schedule provided above and calculate the ending balance of long-term debt repayments.
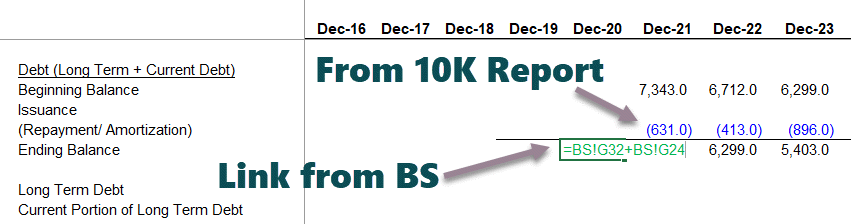
Link the long term debt repayments
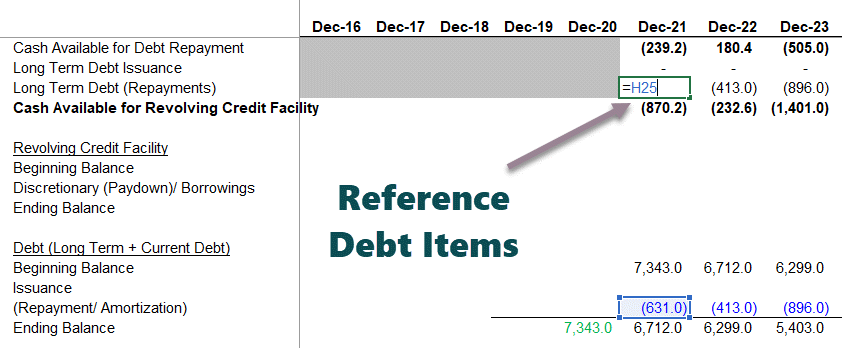
Calculate the discretionary borrowings/paydowns.
Using the cash sweep formula, as shown below, calculate the discretionary borrowings/paydown.
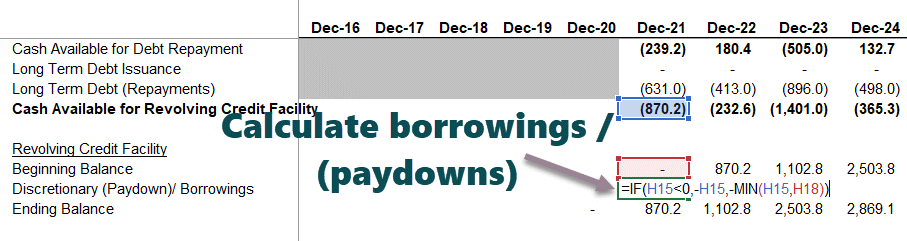
Calculate Interest Expense from Revolving Credit Facility
- Make a reasonable assumption for an interest rate based on the information provided in the 10K report.
- Find the average balance of the revolving credit facility and multiply it with the assumed interest rate.
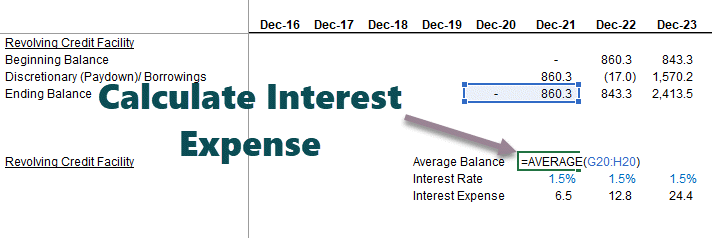
Calculate the Interest Expense from the Long Term Debt
Link the historical average balances and interest expenses. Find the implied interest rate for historical years.
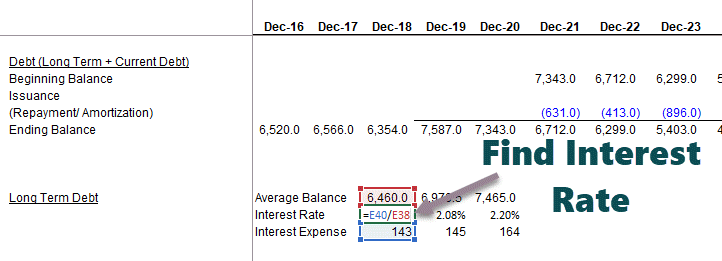
Assume the interest rate on Long term debt based on the implied interest rate. Then, multiply the average long-term debt by the assumed interest rate.
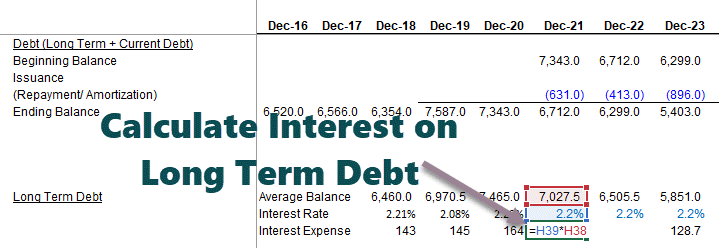
Calculate Total Interest Expense = average balance of debt x interest rate
Find the Total Interest Expense = Interest (Revolving Credit Facility) + Interest (Long Term Debt)
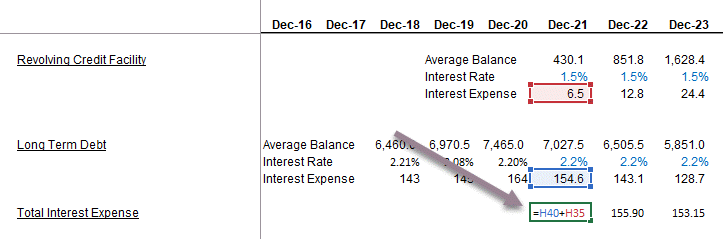
Link debt & Revolver drawdowns to Cash Flows
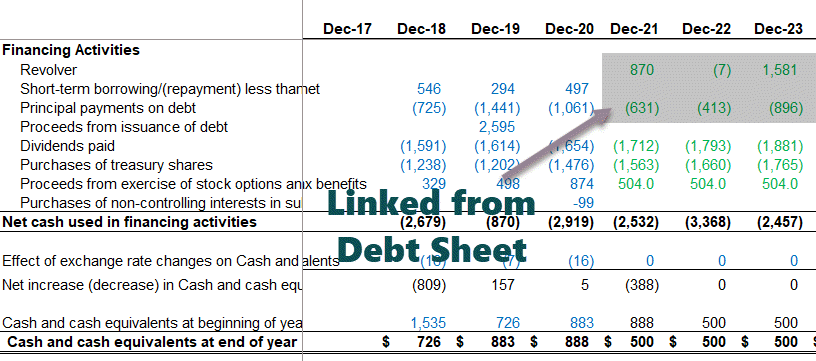
Reference Current and Long Term to Balance Sheet
- Demarcate the Current Portion of Long Term DebtCurrent Portion of Long-Term Debt (CPLTD) is payable within the next year from the date of the balance sheet, and are separated from the long-term debt as they are to be paid within next year using the company’s cash flows or by utilizing its current assets.read more and long-term debt as shown below.
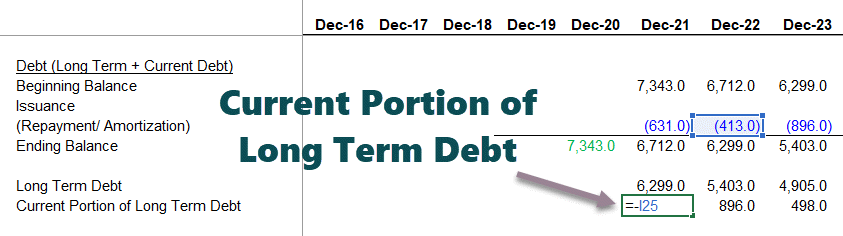
- Link the revolving credit facility, long-term debt, and current portion of long-term debt to the balance sheet.
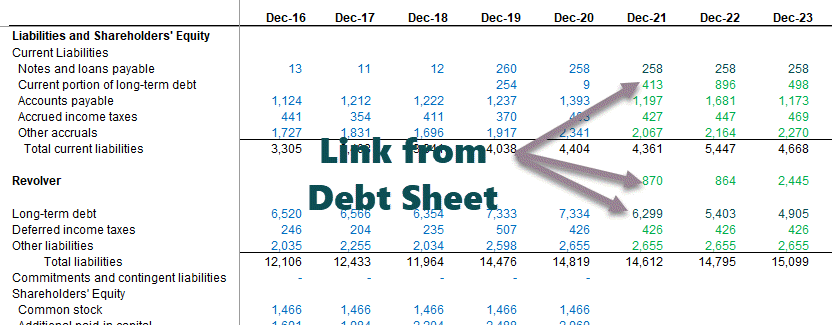
Link Noncontrolling Interest from Income Statement
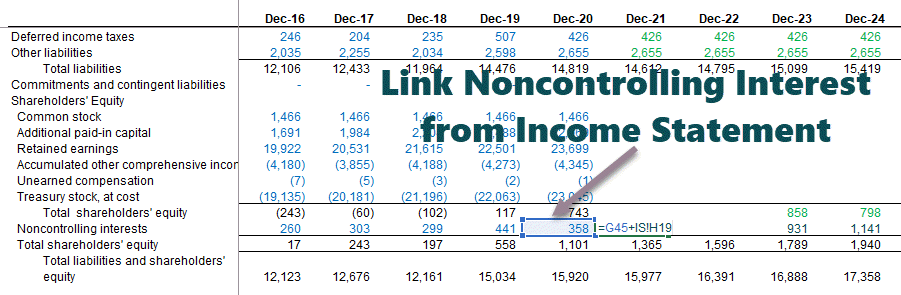
Calculate the Interest Income using the average cash balance
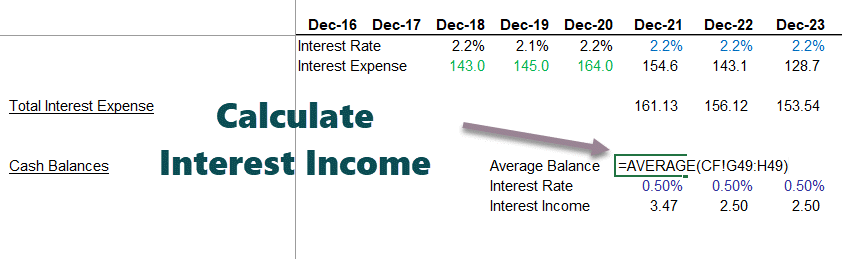
Link Interest Expense and Interest Income to Income Statement

Perform the Balance Sheet check: Total Assets = Liabilities + Shareholder’s Equity
Audit the Balance Sheet
We need to audit the model and check for linkage errors if there is any discrepancy.
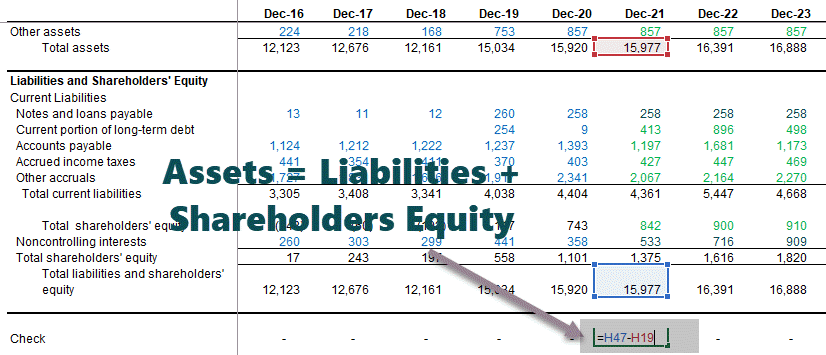
Recommended Articles
- Alibaba Financial Model
- Box IPO Financial Model
- Financial Modeling Templates
- Coursera Financial Model
What next?
If you learned something new or enjoyed this Excel-based financial modeling, please leave a comment below. Let me know what you think. Many thanks, and take care. Happy Learning!
What is a DCF Model?
The Discounted Cash Flow Model, or “DCF Model”, is a type of financial model that values a company by forecasting its cash flows and discounting them to arrive at a current, present value.
DCFs are widely used in both academia and in practice.
Valuing companies using a DCF model is considered a core skill for investment bankers, private equity, equity research and “buy side” investors.
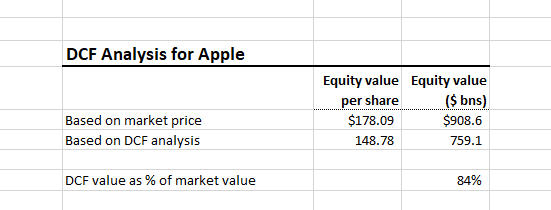
This DCF analysis suggests that Apple might be overvalued (or that our assumptions are wrong!)
A DCF model estimates a company’s intrinsic value (the value based on a company’s ability to generate cash flows) and is often presented in comparison to the company’s market value.
For example, Apple has a market capitalization of approximately $909 billion. Is that market price justified based on the company’s fundamentals and expected future performance (i.e. its intrinsic value)? That is exactly what a DCF seeks to answer.
In contrast with market-based valuation like a comparable company analysis, the idea behind the DCF model is that the value of a company is not a function of arbitrary supply and demand for that company’s stock. Instead, the value of a company is a function of a company’s ability to generate cash flow in the future for its shareholders.
DCF Model Basics: Present Value Formula
The DCF approach requires that we forecast a company’s future cash flows and discount them to the present in order to arrive at a present value for the company. That present value is the amount investors should be willing to pay (the company’s value). We can express this formulaically as the follwoing (we denote the discount rate as r):
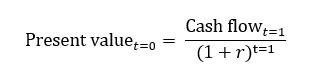
So, let’s say you decide you’re willing to pay $800 for the below. We can solve this as:
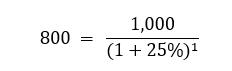
If I make the same proposition but instead of only promising $1,000 next year, say I promise $1,000 for the next 5 years.The math gets only slightly more complicated:
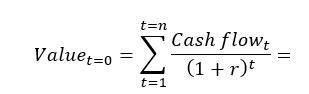
In Excel, you can calculate this using the PV function (see below). However, if cash flows are different each year, you will have to discount each cash flow separately:
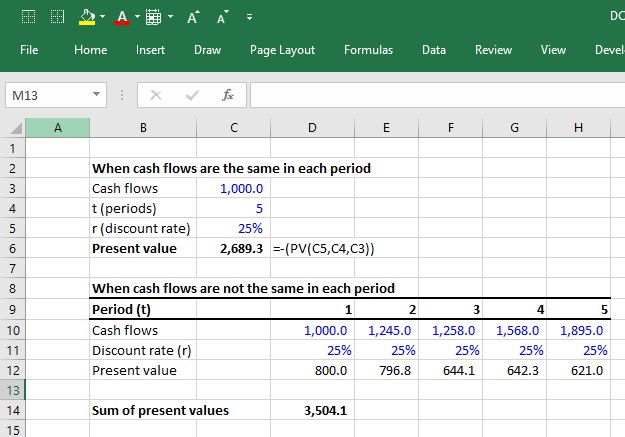
Learn More → Investment Banking Primer
DCF Model in Excel – Sample Template Download
Use the form below to download our sample DCF model template:
How to Build a DCF Model: 6-Step Framework
The premise of the DCF model is that the value of a business is purely a function of its future cash flows. Thus, the first challenge in building a DCF model is to define and calculate the cash flows that a business generates. There are two common approaches to calculating the cash flows that a business generates.
- Unlevered DCF approach
Forecast and discount the operating cash flows. Then, when you have a present value, just add any non-operating assets such as cash and subtract any financing-related liabilities such as debt. - Levered DCF approach
Forecast and discount the cash flows that remain available to equity shareholders after cash flows to all non-equity claims (i.e. debt) have been removed.
Both should theoretically lead to the same value at the end (though in practice it’s actually pretty hard to get them to be exactly equal). The unlevered DCF approach is the most common and is thus the focus of this guide. This approach involves 6 steps:
Step 1. Forecasting unlevered free cash flows
- Step 1 is to forecast the cash flows a company generates from its core operations after accounting for all operating expenses and investments.
- These cash flows are called “unlevered free cash flows.”
Step 2. Calculating the terminal value
- You can’t keep forecasting cash flows forever. At some point, you must make some high-level assumptions about cash flows beyond the final explicit forecast year by estimating a lump-sum value of the business past the explicit forecast period.
- That lump sum is called the “terminal value.”
Step 3. Discounting the cash flows to the present at the weighted average cost of capital
- The discount rate that reflects the riskiness of the unlevered free cash flows is called the weighted average cost of capital.
- Because unlevered free cash flows represent all operating cash flows, these cash flows “belong” to both the company’s lenders and owners.
- As such, the risks of both providers of capital (i.e. debt vs. equity) need to be accounted for using appropriate capital structure weights (hence the term “weighted average” cost of capital).
- Once discounted, the present value of all unlevered free cash flows is called the enterprise value.
Step 4. Add the value of non-operating assets to the present value of unlevered free cash flows
- If a company has any non-operating assets such as cash or has some investments just sitting on the balance sheet, we must add them to the present value of unlevered free cash flows.
- For example, if we calculate that the present value of Apple’s unlevered free cash flows is $700 billion, but then we discover that Apple also has $200 billion in cash just sitting around, we should add this cash.
Step 5. Subtract debt and other non-equity claims
- The ultimate goal of the DCF is to get at what belongs to the equity owners (equity value).
- Therefore if a company has any lenders (or any other non-equity claims against the business), we need to subtract this from the present value.
- What’s left over belongs to the equity owners.
- In our example, if Apple had $50 billion in debt obligations at the valuation date, the equity value would be calculated as:
- $700 billion (enterprise value) + $200 billion (non-operating assets) – $50 (debt) = $850 billion
- Often, the non-operating assets and debt claims are added together as one term called net debt (debt and other non-equity claims – non-operating assets).
- You’ll often see the equation: enterprise value – net debt = equity value. The equity value that the DCF calculates is comparable to the market capitalization (the market’s perception of the equity value).
Step 6. Divide the equity value by the shares outstanding
- The equity value tells us what the total value to owners is. But what is the value of each share? In order to calculate this, we divide the equity value by the company’s diluted shares outstanding.
Calculating Unlevered Free Cash Flows (FCF)
Here is the formula for unlevered free cash flow:
FCF = EBIT x (1- tax rate) + D&A + NWC – Capital expenditures
- EBIT = Earnings before interest and taxes. This represents a company’s GAAP-based operating profit.
- Tax rate = The tax rate the company is expected to face. When forecasting taxes, we usually use a company’s historical effective tax rate.
- D&A = Depreciation and amortization.
- NWC = Annual changes in net working capital. Increases in NWC are cash outflows while decreases are cash inflows.
- Capital expenditures represent cash investments the company must make in order to sustain the forecasted growth of the business. If you don’t factor in the cost of required reinvestment into the business, you will overstate the value of the company by giving it credit for EBIT growth without accounting for the investments required to achieve it.
FCFs are ideally driven from a 3-statement model
Forecasting all these line items should ideally come from a 3-statement model because all of the components of unlevered free cash flows are interrelated: Changes in EBIT assumptions impact capex, NWC, and D&A. Without a 3-statement model that dynamically links all these components together, it is difficult to ensure that the changes in assumptions of one component correctly impact the other components.
Because this takes more work and more time, finance professionals often do preliminary analyses using a quick, back-of-the-envelope DCF model and only build a full DCF model driven by a 3-statement model when the stakes are high, such as when an investment banking deal goes “live” or when a private equity firm is in the later stages of the investment process.
The 2-stage DCF model
The 3-statement models that support a DCF are usually annual models that forecast about 5-10 years into the future. However, when valuing businesses, we usually assume they are a going concern. In other words, the assumption is that they will continue to operate forever.
That means that the 3-statement model only takes us so far. We also have to forecast the present value of all future unlevered free cash flows after the explicit forecast period. This is called the 2-stage DCF model. The first stage is to forecast the unlevered free cash flows explicitly (and ideally from a 3-statement model). The second stage is the total of all cash flows after stage 1. This typically entails making some assumptions about the company reaching mature growth. The present value of the stage 2 cash flows is called the terminal value.
Prefer video? To watch a free video lesson on how to build a DCF, click here.
Calculating the terminal value
In a DCF, the terminal value (TV) represents the value the company will generate from all the expected free cash flows after the explicit forecast period. Imagine that we calculate the following unlevered free cash flows for Apple:
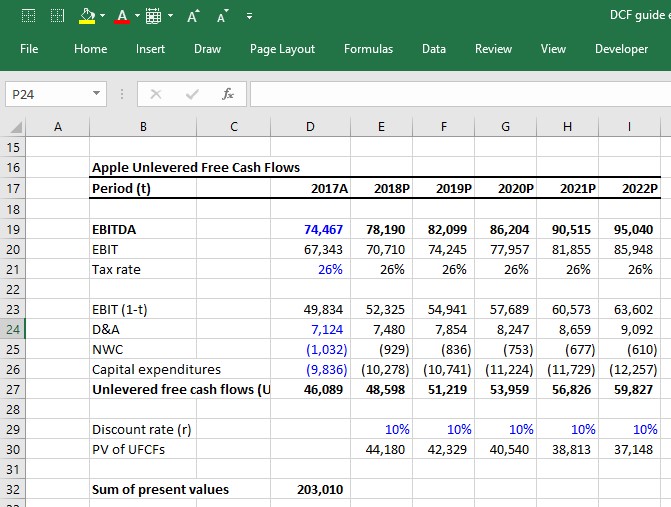
Apple is expected to generate cash flows beyond 2022, but we cannot project FCFs forever (with any degree of accuracy). So how do we estimate the value of Apple beyond 2022? There are two common approaches:
- Growth in Perpetuity
- Exit EBITDA Multiple Method
The growth in perpetuity approach
The growth in perpetuity approach assumes Apple’s UFCFs will grow at some constant growth rate assumption from 2022 to … forever. The formula for calculating the present value of a cash flow growing at a constant growth rate in perpetuity is called the “Growth in perpetuity formula”:
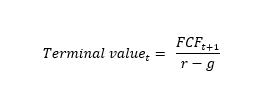
If we assume that after 2022, Apple’s UFCFs will grow at a constant 4% rate into perpetuity and will face a weighted average cost of capital of 10% in perpetuity, the terminal value (which is the present value of all Apple’s future cash flows beyond 2022) is calculated as:
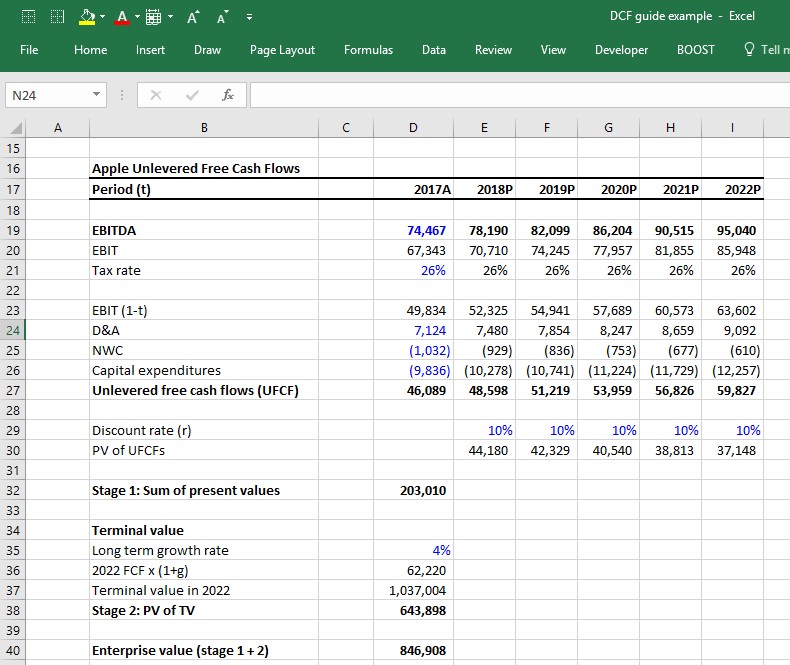
At this point, notice that we have finally calculated enterprise value as simply the sum of the stage 1 present value of UFCFs + the present value of the stage 2 terminal value.
Exit EBITDA Multiple Method
The growth in perpetuity approach forces us to guess the long-term growth rate of a company. The result of the analysis is very sensitive to this assumption. A way around having to guess a company’s long term growth rate is to guess the EBITDA multiple the company will be valued at the last year of the stage 1 forecast.
A common way to do this is to look at the current EV/EBITDA multiple the company is trading at (or the average EV/EBITDA multiple of the company’s peer group) and assume the company will be valued at that same multiple in the future. For example, if Apple is currently valued at 9.0x its last twelve months (LTM) EBITDA, we can assume that in 2022 it will be valued at 9.0x its 2022 EBITDA.
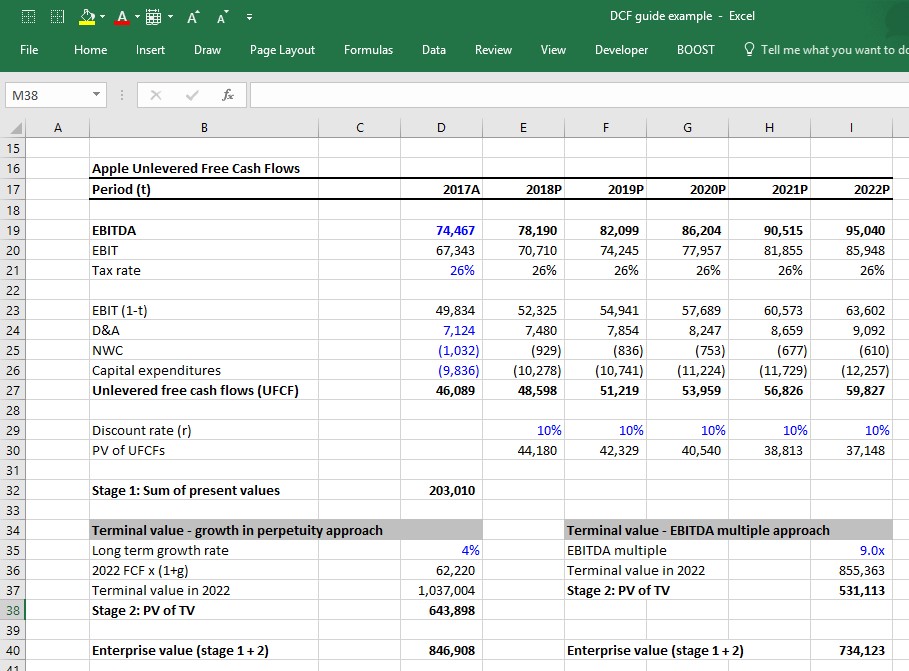
Growth in perpetuity vs. exit EBITDA multiple method
Investment bankers and private equity professionals tend to be more comfortable with the EBITDA multiple approach because it infuses market reality into the DCF. A private equity professional building a DCF will likely try to figure out what he/she can sell the company for 5 years down the road, so this arguably provides a valuation via an EBITDA multiple.
However, this approach suffers from a significant conceptual problem: It incorporates current market valuations within the DCF, which arguably defeats the whole purpose of the DCF. Making matters worse is the fact that the terminal value often represents a significant pecentage of the value contribution in a DCF, so the assumptions that go into calculating the terminal value are all the more important.
Getting to enterprise value: Discounting the cash flows by the WACC
Up to now, we’ve been assuming a 10% discount rate for Apple, but how is that actually quantified? Quantifying the discount rate, which in this case is the weighted average cost of capital (WACC), is a critical field of study in corporate finance. You can spend an entire college semester learning about it. We’ve written a complete guide to WACC here, but below are the basic elements for how it is typically calculated:
The WACC formula
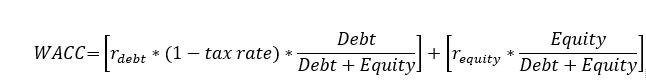
Where:
- Debt = market value of debt
- Equity = market value of equity
- rdebt = cost of debt
- requity = cost of equity
Getting to equity value: Adding the value of non-operating assets
Many companies have assets not directly tied to operations. Assets such as cash obviously increase the value of the company (i.e. a company whose operations are worth $1 billion but also has $100 million in cash is worth $1.1 billion). But up to now, the value is not accounted for in the unlevered free cash flow calculation. Therefore, these assets need to be added to the value. The most common non-operating assets include:
- Cash
- Marketable securities
- Equity investments
Below is Apple’s 2016 year-end balance sheet. The non-operating assets are its cash and equivalents, short-term marketable securities and long-term marketable securities. As you can see, they represent a significant portion of the company’s balance sheet.
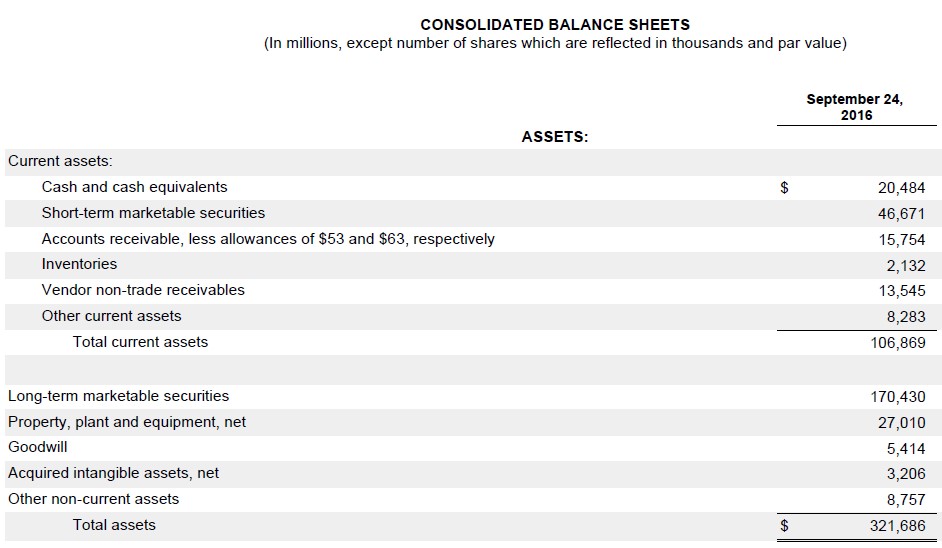
Unlike operating assets such as PP&E, inventory and intangible assets, the carrying value of non-operating assets on the balance sheet is usually fairly close to their actual value. That’s because they are mostly comprised of cash and liquid investments that companies generally can mark up to fair value. That’s not always the case (equity investments are a notable exception), but it’s typically safe to simply use the latest balance sheet values of non-operating assets as the actual market values.
Getting to equity value: Subtracting debt and other non-equity claims
At this point, we need to identify and subtract all non-equity claims on the business in order to arrive at how much of the company value actually belongs to equity owners. The most common non-equity claims you’ll encounter are:
- All debt (short term, long term, bonds, loans, etc..)
- Capital Leases
- Preferred stock
- Non-controlling (minority) interests
Below are Apple’s 2016 year-end balance sheet liabilities. You can see it includes commercial paper, current portion of long term debt and long term debt. These are the three items that would make up Apple’s non-equity claims.
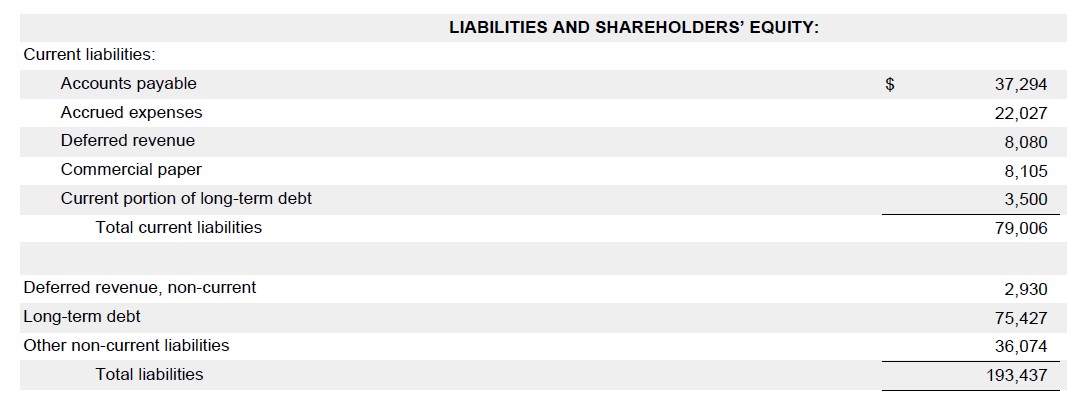
As with the non-operating assets, finance professionals usually just use the latest balance sheet values of these items as a proxy for their actual values. This is usually a safe approach when the market values are fairly close to the balance sheet values. The market value of debt doesn’t usually deviate too much from the book value unless market interest rates have changed dramatically since the issue or if the company’s credit profile has changed dramatically (i.e. a company in financial distress will have its debt trading at pennies on the dollar).
One place where the book value-as-proxy-for-market-value can be dangerous is with “non-controlling interests.” Non-controlling interests are usually understated on the balance sheet. If they are significant, it is preferable to apply an industry multiple to better reflect their true value.
The bad news is that we rarely have enough insight into the nature of the non-controlling interests’ operations to figure out the right multiple to use. The good news is that non-controlling interests are rarely large enough to make a significant difference in valuation (most companies don’t have any).
Net debt formula
When building a DCF model, finance professionals often net non-operating assets against non-equity claims and call it net debt, which is subtracted from enterprise value to arrive at equity value:
Enterprise value – net debt = Equity value
The formula for net debt is simply the value of all nonequity claims less the value of all non-operating assets:
- Gross Debt (short term, long term, bonds, loans, etc..)
- + Capital Leases
- + Preferred stock
- + Non-controlling (minority) interests
- – Cash
- – Marketable securities
- – Equity investments
- Net debt
Using Apple’s 2016 10K, we can see that it has a substantial negative net debt balance. For companies that carry significant debt, a positive net debt balance is more common, while a negative net debt balance is common for companies that keep a lot of cash.
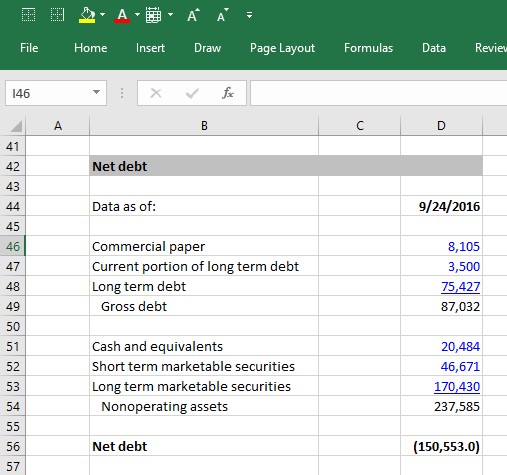
From equity value to equity value per share
Once a company’s equity value has been calculated, the next step is to determine the value of each individual share. In order to figure this out, we have to determine the number of shares that are currently outstanding. We have written a thorough guide to calculating a company’s current shares but will summarize the key steps here:
1. Take the current actual share count from the front cover of the company’s latest annual (10K) or interim (10Q) filing. For Apple, it is:
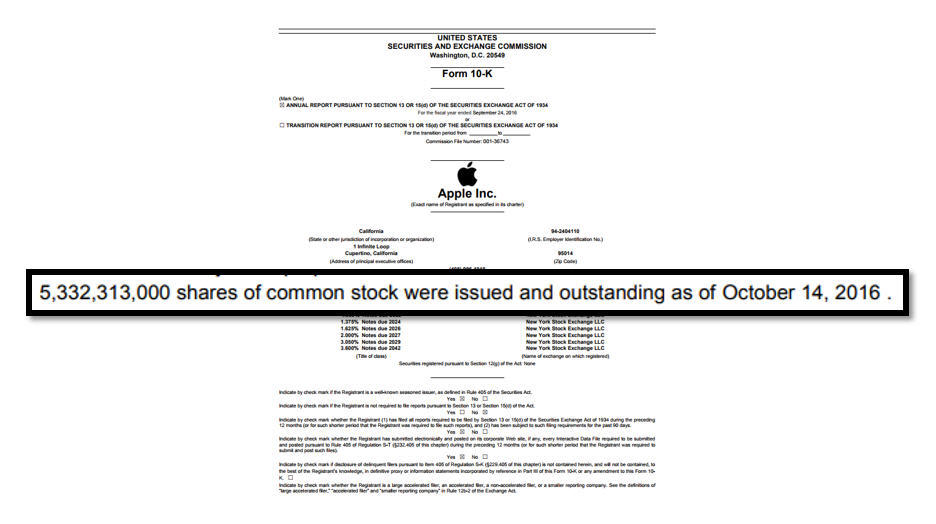
2. Next, add the effect of dilutive shares. These are shares that aren’t quite common stock yet, but that can become common stock and thus be potentially dilutive to the common shareholders (i.e. stock options, warrants, restricted stock and convertible debt and convertible preferred stock).
Assuming that we calculated 50 million dilutive securities for Apple, we can now put all the pieces together and complete the analysis:
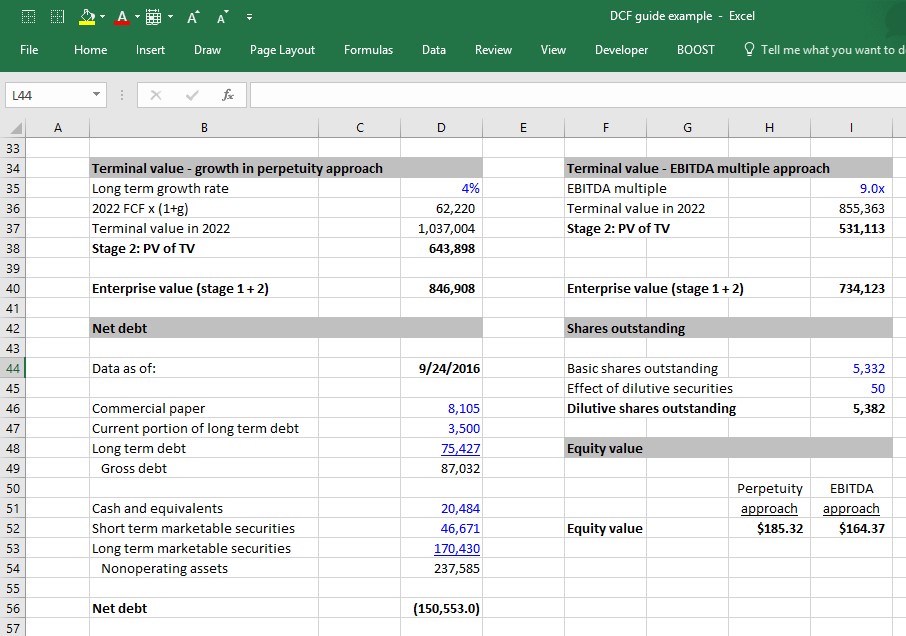
Key DCF Assumptions
We have now completed the 6 steps to building a DCF model and have calculated the equity value of Apple.
What were the key assumptions that led us to the value we arrived at?
The three key assumptions in a DCF model are:
- The operating assumptions (revenue growth and operating margins)
- The WACC
- Terminal value assumptions: Long-term growth rate and the exit multiple
Each of these assumptions is critical to getting an accurate model. In fact, the DCF model’s sensitivity to these assumptions, and the lack of confidence finance professionals have in these assumptions, (especially the WACC and terminal value) are frequently cited as the main weaknesses of the DCF model.
Nonetheless, the DCF model is one of the most common models used by investment bankers and other finance professionals, and the DCF output is almost always presented using a range of terminal value and WACC assumptions, as well as in context to other valuation methodologies. A common way this is presented is using a football field valuation matrix.
We wrote this guide for those thinking about a career in finance and those in the early stages of preparing for job interviews. This guide is quite detailed, but it stops short of all corner cases and nuances of a fully-fledged DCF model.

Step-by-Step Online Course
Everything You Need To Master Financial Modeling
Enroll in The Premium Package: Learn Financial Statement Modeling, DCF, M&A, LBO and Comps. The same training program used at top investment banks.
Enroll Today
This is a guest post written by Paramdeep from Pristine. Chandoo.org is partnering with Pristine to bring an excel financial modeling online training program for you.
 This is Part 6 of 6 on Financial Modeling using Excel
 This is Part 6 of 6 on Financial Modeling using Excel
In this tutorial we are going to learn how to build assumptions & input sheets in our excel financial model. The 6 parts of this tutorial are,
- Introduction to Financial Modeling
- Building a layout for Project Evaluation Model – Best practices
- Building Inputs and Assumptions Sheet
- Building Projections for Project Evaluation
- Modeling the Cash Flow Statement and Projections
- Putting it all together – Final Project Evaluation Model
- Join our Financial Modeling Classes
I am sorry for the slight delay in the post. Things have been very hectic for the last few weeks as we were just completing our training on Financial Modeling in Excel – Real Estate (RE) sector for JP Morgan. The real estate valuation is very similar to the project evaluation that we are doing for the simple reason:
- Project evaluation and real estate valuation are limited duration projects (If you intend to sell the RE project in near future) unlike general companies (which are an on-going concern)
- For both these the timing of the cash is very important. A delay in the timing might appear to be ok for the developer, but the investor’s calculations (typically IRR) go for a toss
In India most of the RE developers are businessmen, who are concerned about the cash that the project generates. They are not really too bothered if they receive it in April or September (After all they are getting the cash). But the investors are really bothered by these delays – Some PE investors have a limited period investment horizon and some are too concerned about the IRR generated by the project. As we figured out in our class, Real estate projects are very sensitive to delays in cash generation! Excel is a great tool to show this effect in a matter of 30 secs (Use XIRR and data-tables). Maybe I will write about this functionality in one of my posts later!
For the time being lets come back to our project.
What is time value of money?
Let me start with a very simple to understand example.
- If you invest $100 in bank today, what would be its value 1 year down the line (assuming 10% interest rate)?
- The value should be 100*(1+10%) = $ 110.
- Now if you keep this invested for another year, what would be its value 2 years down the line?
- The value should be 110*(1+10%) = $ 121. I can also write it as 110*(1+10%)^2
- Similarly if you keep invested for 10 years, the value would be 110 * (1+10%)^10
This is the simple concept of compounding.
The inverse of this concept (What if you wanted $110 after 1 year, or 110*(1+10%)^10 after 10 years), how much should you invest today, is called discounting. Clearly $100 today is worth $110 a year after and $121 two years hence.

If I have more than 1 cash flows, I can discount them depending on the time duration and if I sum them all, its called Net Present Value (NPV) of all cash flows. We would take the outflows as Negative Cash and inflows as Positive Cash.

In excel, you can either discount all cash flows or calculate the NPV of the project by using the function =NPV(Discount Rate, Cash)

What is the rate on which money should be discounted?
When equity investors invest, they take greater risk as compared to banks lending money. Obviously their expectation of return would be higher. In some cases, the equity investor might have a return figure in mind (Based on the risk I am taking, I would like to have Min. 15% return on my invested money).
Sometimes, this expected return can be calculated by using the capital asset pricing model (CAPM). What this states is very simple – Equity investors want a premium apart from the risk free rate (Lets call this expectation of equity investors as Re) . So there are two parts to the return expectation:
Re = Risk Free + Premium apart from Risk free
Now this premium depends on how much risk I am taking (Typically measured with respect to the volatility in returns with respect to the benchmark index). So I say:
Re = Risk Free + Beta * (Market Returns – Risk Free Returns)
The beta measures the movement of your returns with respect to market returns.

Now apart from the equity investors, there would be some debt in the project. Typically debt holders expect a lower return (Lets call it Rd).
The overall expectation of return from the project is the weighted average of these returns, Re and Rd.

To create this switch in the model, I have used data-validation (so that the user can just input one of these options)

To create such a drop down, use data validation – list option in excel

Internal Rate of Return
The same concept can be viewed from a return angle as well. If I can calculate a discount rate that makes the present value of the expected cash inflows just equal to the initial cost of the project, then that rate would be sort of a break even rate for me (Considering the time value of money). This rate is called the Internal rate of return (IRR).

Many investors have a certain hurdle IRR in mind and if the project is generating an IRR less than the hurdle IRR, they would not invest in the project.
To calculate IRR, there is no analytical solution possible. You can use the excel function =IRR(Cash) to get the IRR of the cash flows.
Making a decision in our case
First let me summarize the decision criteria for you. I would invest in the project based on the following conditions:
NPV Rule:
- If NPV > 0: The project may be accepted (Please note that positive NPV is not a sufficient condition)
- If NPV = 0: The investor should be indifferent
- If NPV < 0: The project must not be accepted (Please note that positive NPV is a necessary condition)
Please note that sometimes people might decide to take on the project even though the NPV is negative!
IRR Decision Rule
- If IRR > the required rate of return, accept the project
- If IRR < the required rate of return, reject the project
In our case, we are getting the NPV to be 21 and an IRR to be 12%. In this case it’s a borderline case and my feeling is that Mr. Samar would invest in the project (After all Mohit is his son!!) J.
Download Project Valuation Templates
I have created a template for you, where the subheadings are given and you have to link the model to get the cash numbers! You can download the same from here:
Project Valuation Template – Blank
You can go through the case and fill in the yellow boxes. I also recommend that you try to create this structure on your own (so that you get a hang of what information is to be recorded).
Also you can download this filled template and check, if the information you recorded, matches mine or not! 😉
Project Valuation Template – Solution
I am just doing that for the single sheet model and recommend that you do the same for multi-sheet model as a homework problem. If you face any issue, post your excel with the exact problem and we can discuss the way to move forward.

Next Steps
We are not done with a basic model for evaluation of a project. There are other nuances that we could not tackle (Given the time and space constraint) – What if the cash does not come at year end, what could be the scenarios in which this project is not a viable project, what can be done to make the project more interesting, etc. I do hope that you found the posts interesting and look forward to your comments and suggestions!
Read previous part of this series – Modeling Cash-flow projections
How do you make project investment decisions?
We are very eager to learn from your experience and know your ideas. What methods of valuation do you use? How do you model them? Share using comments.
Join our Financial Modeling Classes:
Chandoo.org is partnering with Pristine to bring an online financial modeling training program for you. Click here to learn more about our financial modeling class & join.
Added by Chandoo:
Thank you Paramdeep & Pristine:
Many thanks to Paramdeep and Pristine for making this happen. I am really enjoying this series and learning a lot of valuable tricks about financial modeling.
If you like this series, say thanks to Paramdeep. I am sure he can take any amount of appreciation without choking.
This article is written by Pristine. The author can be contacted on paramdeep@edupristine.com.
Pristine is an awesome training institute for CFA, PRIMA, GARP etc. They have trained folks at HSBC, BoA etc. Chandoo.org is partnering with Pristine to bring an excel financial modeling online training program for you.
Share this tip with your colleagues

Get FREE Excel + Power BI Tips
Simple, fun and useful emails, once per week.
Learn & be awesome.
-
23 Comments -
Ask a question or say something… -
Tagged under
capm, data validation, dcf, downloads, financial formulas, Financial Modeling, guest posts, IRR, Learn Excel, Microsoft Excel Formulas, modeling, npv, online excel training, pristine, wacc
-
Category:
Financial Modeling, Learn Excel

Welcome to Chandoo.org
Thank you so much for visiting. My aim is to make you awesome in Excel & Power BI. I do this by sharing videos, tips, examples and downloads on this website. There are more than 1,000 pages with all things Excel, Power BI, Dashboards & VBA here. Go ahead and spend few minutes to be AWESOME.
Read my story • FREE Excel tips book


Excel School made me great at work.
5/5

From simple to complex, there is a formula for every occasion. Check out the list now.

Calendars, invoices, trackers and much more. All free, fun and fantastic.

Power Query, Data model, DAX, Filters, Slicers, Conditional formats and beautiful charts. It’s all here.

Still on fence about Power BI? In this getting started guide, learn what is Power BI, how to get it and how to create your first report from scratch.
Related Tips
23 Responses to “Putting it all together – Final Project Evaluation Model [Part 6 of 6]”
-
 Steve Sexton says:
 How would I go about modeling a proposed manufacturing project? Let’s say for an example a new robotic welding cell that would cost $300,000 and save 20% in labor.
-
Dear Steve,
The modeling steps would remain pretty much the same. Just consider only the cash flow generated because of the new project. For example,
Initial Cash Out = -30,000
Lets say Original Labor Costs (Per year) = 50,000
Savings each year = 10,000
Lets say the robot gives you benefit for 5 years. So your cash flow for the next 5 years are:
-30000 | 10000 | 10000 | 10000 | 10000 | 10000If your WACC for the project is 15%, you can calculate the NPV of the project using NPV formula in Excel (which in this case calculates it as 3,062). If NPV is positive, it seems to be a good project to go for.
-
Steve Sexton says:
Paramdeep,
Did you miss a zero in the Initial Cash Out?
Initial Cash Out should be = -300,000.
Not -30,000.
Am I correct?
Steve
-
@steve: The initial cash has to be -30,000 and not -300,000. If you write an email to me, I will just forward you the 2 line excel sheet! 🙂
-
Shweta says:
Could you explain how is the market premium calculated?
I always understood it as:
market premium= expected return from the market- risk free rate
which in this case should be 6% (10% — 4%).
Am I missing out something? -
@shweta: We are actually using two different approaches for valuation. In the first approach we have assumed a specific expectation by the investor (10%). In the second approach we calculate the expected return of the project using CAPM model. In the CAPM model, we have assumed a market risk premium of 13%. This can be calculated from historical data.
-
Dear Pfriends, first of all thank you very much for your efforts to educate the folks on economics! Keep moving! Meanwhile I’ve got two questions:
1. Am I correct the described model neglects bank loan (body) repayments? As far as I understood WACC deducts only bank interest and has nothing to do with payments on the loan itself. These repayments should significantly reduce cash flow and PAT.
2. The ‘banking’ part of WACC formula shall include (1 — tax) factor, but yours doesn’t. Is there any mistake in your formula? -
Richard says:
Hi Pristine and Chandoo:
Thank you for continuing to mentor us on line. I learn a lot.
Richard
-
Piyush says:
HI Paramjeet
I want to make a IRR sheet for a R& D project with certain investment. Could you pls suggest me how to make the same.
Will be thankfull for the same.
With regards
Piyush -
Hi Piyush,
To get a model for IRR, the first step is to put the cash flows. For example, if I make an investment of USD 1000 in year 1, which gives me cash flow of 5000 growing at 10% for 5 years after 5 years, your cash flows would look like:-1000, 0, 0, 0, 0, 5000, 5500, …
Just use IRR function in excel after that to get the IRR for the project.
The main challenge is in getting the cash flow in place.
Hope this helps! -
[…] months ago, we learned how to create a project valuation model in Excel as part of our series on Financial Modeling in […]
-
Robert says:
Thank you. Excellent overview for Financial Modeling in Excel.
-
Gourav says:
You seem to ignore tax effects in the calculations. As Alexkr has pointed out, your after tax cost of debt would be 7%*(1-tax rate).
Similarly when you are calculating the cash flow benefits of Steve’s new machine, you will have to take into account the fact that reduced costs (and increased profits) would mean Steve will have to shell out more money in tax. Also, we need to take into account the depreciation benefits of buying new machine. So cash flow should be (assuming 5 years life) something like:
Initial Cash Out = -30,000
Lets say Original Labor Costs (Per year) = 50,000
Savings each year = 10,000
Additional depreciation each year=6,000
Additional book profit each year=4,000
Additional tax each year= 1200 (4,000*30%)
Actual additional cash flows= 10,000-1,200=8,800
Steve’s cash flow for the next 5 years are:
-30000 | 8,800 |8,800 |8,800 |8,800 |8,800 |
Please correct me if I am wrong.-
Steve Sexton says:
Interesting, I never really thought about the tax effect.
-
Hi Gourav,
I am sorry. I did not understand the «reduced cost». I think the model is taking care of the fact that there is a depreciation (in the P&L). Also the cost of debt has the tax shield.
Please note that in the P&L the effect of interest, depreciation and tax are considered.
If you can upload your model somewhere, I can review and get back with my comments.
-
-
Gourav says:
Hi Paramdeep,
Apologies for being unclear. I was responding to your reply to Steve’s question where you (probably inadvertently) had ignored the tax effects of cost saving. Looking at your model, I found out that it indeed taking care of the «reduced cost». The uploaded excel (where I have plugged in Steve’s numbers in your template) can probably help you understand what I meant to say. The differential cash flow is coming out to be 8800 in this case.
When I am talking about after tax cost of debt, I mean this (text inspired from wiki):
Since in most cases debt expense is a deductible expense, the cost of debt is computed as an after tax cost to make it comparable with the cost of equity (earnings are after-tax as well). Thus, for profitable firms, debt is discounted by the tax rate. The formula can be written as (interest rate)*(1-t).As far as I understand, you have taken interest rate as cost of debt directly. This results into a WACC of 10.9% instead of 9.85%. Could you please explain the reasoning behind your approach.
model is uploaded at: http://uploading.com/files/c49daa66/ProjectEvaluation-Valuation-Solution-Key%2Bmod.xls/
-
Xavier Ponce de Leon says:
Hello Gourav,
Thank you for your good explanations and templates.
I have a question. How do I incorporate the terminal value of an ongoing company into the IRR calculation?
Lets say I have to invest 13 million the first year, another 28 million the second year, then I start getting positive cash flow in the order of 7 million per year and I expect them to continue in perpetuity.
What would be the IRR? How do I calculate it using excel?
Thanks in advance for your comment.
-
Marcus says:
Hi,
Thank you very much for the detailed analysis on how to perform a financial modeling using excel.
However, i have only 1 concern, in the last part on calculating the WACC, your equation does not include the tax break. Your equation is: =($D$27*$D$26)+(1-$D$27)*$D$55
Which is basically this: (D/V x Cost of Debt) + (E/V x Cost of Equity)
Should it not include the tax break?—> ((D/V x Cost of Debt) x (1- TAX)) + (E/V x Cost of Equity)?
If so, the NPV would have come to 44.34, rather than 21.
Let me know if i am wrong.
THanks -
BHUSHAN SAVALE says:
THANKS A TON FOR YOUR DETAILED HELP…. CAN YOU PROVIDE MORE CASE STUDIES
-
Matt says:
Great article, thanks for sharing. I usually just discount cash flows at predicted inflation rates then calculate the IRR to provide a real return. Once you have this you compare it to the clients target return (which will usually factor in risk). Its essentially achieving the same thing but coming at it from a slightly different angle. I find more clients/colleagues understand this rather than talking about risk beta. NPV is only really used to demonstrate breakeven, IRR is much easier to compare between projects and discuss generally.
-
Rania says:
Hi,
I just have the following simple corrections for this post:
4.The value should be 110*(1+10%) = $ 121. I can also write it as 100*(1+10%)^2;
instead of:
The value should be 110*(1+10%) = $ 121. I can also write it as 110*(1+10%)^2
Also
5.Similarly if you keep invested for 10 years, the value would be 100 * (1+10%)^10,
instead of:
5.Similarly if you keep invested for 10 years, the value would be 110*(1+10%)^10
thanks a bunch for posting this tutorial though! its very helpful 🙂
-
Mariya says:
Hello Paradeemp,
Thank you for the wonderful tutorial! I learnt so much! I have a question even though. In the case there was written Mr Samar can invest 50% of the money required. So where we should include if Mr Samar cannot invest 100% of his money and half of the invest should come from the bank loan?
Thanks again!
Mariya
Leave a Reply
The discounted cash flow model is the most advocated model for valuing a stock. Under this model, an analyst will estimate the future cash flows for the company, and discount it with the appropriate discount rate.
Traditionally, analysts have used dividends as the proxy for cash flows, hence the dividend discount model. However, the problem with dividends is that it does not fully reflect the cash flow earned by the firm.
The two new cash flow measures used to value a firm are Free Cash Flow to Firm (FCFF) and Free Cash Flow to Equity (FCFE).
FCFF represents the free cash flow available to both equity and debt holders, while FCFE represents free cash flow available for only equity holders.
A firm can be valued by estimating the Free Cash Flow to Firm and discounting them by the Weighted Average Cost of Capital (WACC). The value we arrive at will represent the value of the entire firm We can then deduct the value of debt to arrive at the value of equity alone.
FCFF valuation is more suitable compared to FCFE when the company has high leverage, and/or negative FCFE. FCFF is also suitable for firms that have a tendency to frequently change their degree of financial leverage.
FCFF can be calculated from Net Income using the following formula:
FCFF from Net Income = Net Income + Non-cash Charges + (Interest Expense * (1-tax rate)) – Fixed Capital Investment – Working Capital Investment
One can easily extract the information required to value a frim using FCFF from the company’s financial statements and build a FCFF valuation model using Excel. Below you can find a sample excel model for FCFF valuation (By Aswath Damodaran). You can download it and adapt it to your requirements to value a company.
FCFF Valuation Model Excel Sheet
Valuation ratios measure the value of common equity. They typically indicate the intrinsic value per 1 common share of a firm’s outstanding stock. Using a firm’s Balance Sheet and Income statement, one could easily calculate its valuation metrics.
This Excel template illustrates how to calculate the following multiples:
- Earnings per share (EPS)
- Price earnings (P/E) ratio
- Dividend yield
- Retention rate (RR)
- Dividend payout
- Sustainable growth rate
Some other related topics you might be interested to explore are Ratio analysis, Company valuation, and Forecasting.
This is an open-access Excel model in XLSX format that will be useful for anyone who wants to work as an Accountant, Financial Analyst, Finance Manager, or Investor.
You can now download the Excel template for free.
Valuation ratios are included in the Financial Reporting module of the CFA Level 1 Curriculum.