
Excel is by far the most used application for data analysis, and mastering it is a must-have skill in many companies. It can also be a huge time-saver: an Excel master can be tens or hundreds of times more productive than a beginner. And add-ins can play a significant role in improving your efficiency with Excel, bring you the tools you need to perform well.
What is an Excel add-in?
Excel add-ins are small programs that can be installed to enhance the capabilities of Microsoft Excel by adding new custom features.
There are hundreds of Excel add-ins on the market, covering a wide range of functions.
In this post, we list and describe over 75 add-ins, plugins and apps that complement Microsoft Excel with additional features and options to be even more productive and impress with your abilities with Excel. Some of them are free and some are not, but each of them perform tasks that can greatly help you becoming an Excel rock star.
What are the best Excel add-ins?
Here are 75 of the best add-ins for Microsoft Excel (free or not):
-
Power-user
-
Tableau desktop
-
F9
-
Excel Stock Market Functions
-
Kutools
-
Advanced Formula Environment
-
PowerPivot
-
XLGL
-
ASAP Utilities
-
MonteCarlito
-
Intis Telecom
-
Analystix Tools
-
People Graph
-
Analysis ToolPack
-
Solver
-
Power Query
-
StatPlus:mac
-
FRED
-
Simtools
-
Formlist
-
NXPowerLite Desktop 8
-
Jensen
-
Anomaly Server
-
XLSTAT
-
Operis Analysis Toolkit (OAK)
-
Table Analysis Tools and Data Mining Client
-
Dose
-
Supply Chain add-in
-
Office Tabs
-
ParallelDots
-
vIcons
-
Random Number Generator
-
Random Sorter
-
Audit Tickmark Toolbar
-
QR4Office
-
Geographic Heat Map
-
Password Recovery
-
Ultimate Suite
-
Lucidchart
-
Supermetrics
-
GIGRAPH Network Visualization
-
Selection Diff Tool
-
XY Chart Labeler
-
Hoadley Finance
-
ModernCharts
-
Microsoft Dynamics
-
Risk Analyzer
-
Panel Chart
-
BulkQuotesXL Pro
-
Vertex42 Templates Gallery
-
Model Analyzer
-
Weather by Visual Crossing
-
Spreadsheet123
-
Capital Budgeting
-
Inventory
-
Bubbles
-
Excellent Analytics
-
SEOTools
-
SEOGadget
-
Checkbook Assistant
-
Loan Assistant
-
Flash Card Assistant
-
ActiveData
-
Mekko Chart Creator
-
Conditional Row Delete
-
Power Utility Pack
-
Exchange rates
-
Mini Calendar and Date Picker
-
Favorite Bookmarks
-
Functions Translator
-
RDBmail
-
Intrinio
-
Excel training and tips
-
Power Reconcile
-
Microsoft Flow for Excel
1. Power-user
Power-user is an add-in for Excel, PowerPoint and Word. It has dozens of impressive features designed for anyone who use the Office Suite on a frequent basis:
-
Ability to create new charts like Mekko and Sankey charts,
-
Robust Excel-PowerPoint links,
-
Powerful new functions like SumColor, CountColor, CountVisible, IsFormula, IsMerged, LastCell, LastRowNumber, LastColumnNumber, SumFromAllSheets, VlookupMax, SlicerItems, CAGR, etc.
-
Copy and paste visible cells only,
-
UnPivot a crosstab table, changing it into a database,
-
Quickly format numbers, currencies and dates in Excel,
-
Tools to clean your data from merged cells, remove empty cells or simplify formulas
-
Swap the position of cells or charts,
-
Easily format your tables with horizontal or vertical borders,
-
…and more!
But Power-user also brings amazing new features for PowerPoint and Word:
-
A rich library of 700 beautiful PowerPoint templates,
-
350 editable maps,
-
7,000 vector icons and flags,
-
1+ million high-quality pictures,
-
Dashboard tools such as Gauges, traffic lights, Harvey balls, etc.
-
Value chains, circular, relationship or pyramid diagrams,
-
An automatic Agenda builder,
-
A robust link to easily connect PowerPoint charts and tables to Excel data
-
Waterfall, Mekko, Sankey, Tornado or Gantt charts,
-
… powerful formatting tools to align titles, harmonize fonts or colors, clean a presentation, edit multiple charts, align or move shapes, change languages, etc.!
Click to watch the demo video of Power-user:
2. Tableau Desktop — $999 to $1,999
Tableau is a data visualization add-in. You have to start by connecting it to your data. It can come from an Excel spreadsheet, but also from one of the data sources provided with the add-on. Then you start creating reports or dashboards by using drag and drop on the Tableau work space. Tableau claims its software is one of the fastest on the market; a well-created Tableau report should allow to quickly filter or zoom on part of the data to answer a specific question. Tableau is available on both Windows and iOS.

3. F9 — On quotes only
F9 allows you to work on your accounting data, preparing and distributing financial reports to a group of contacts throughout your organization. Some of your data can be linked between Excel and your accounting system. F9 is available on working on PC only, for versions 2003 to 2019, but not on Mac iOS.
4. Excel Stock Market Functions — Free
This add-in provides new user-defined functions that can be used to retrieve stock markets data from the web directly into Excel. Using these functions, you can for instance download the market capitalization of a company by entering its market symbol, the dates of the period and the frequency of the quotes (ex: daily). This add-in is ideal to build a dashboard of your personal portfolio, and then just refresh it on a regular basis. Excel Stock Market Functions is available on Windows only.
5. Kutools — $39
Kutools provides a very large number of little tools and Excel functions that can turn out useful time-savers in several situations. The cons of this add-in is that is has a lot of features, but a large numbers of them you will probably never use. The pros is that several tools can be really useful, such as the possibility to paste data only to visible cells, to count cells by colors or to combine sheets. Kutools works with Excel 2007 to 2019 on PC.

6. Advanced Formula Environment — Free
This Excel add-in is provided by Microsoft itself. It offers a new, modernized environment for writing named formulas and Lambda functions. Compared to the usual formula bar, it allows syntax highlighting, inline errors, comments and formatting. It’s also perfect for importing Lambda functions. The app works with Microsoft Excel 2013 and later on PC, Mac or the web.

7. PowerPivot — Free
PowerPivot is a Microsoft add-in designed to turn Excel into a business intelligence software. Basically, PowerPivot could be described as «Microsoft Access for dummies». You can build tables with relationships that will be much faster than the time-consuming classical VLOOKUP function in Excel. However our personal experience with PowerPivot is that it still lacks stability and it often causes Excel files to be corrupt… Since Excel 2013, PowerPivot is built-in and doesn’t need to be downloaded. You can activate it like any add-in. For prior versions of Excel, you need to download it from the Microsoft website.
8. XLGL — $299
XLGL is an accounting and reporting tool that fetches data from accounting software Sage to update Excel spreadsheets. GL stands for the accounting term General Ledger. Using XLGL, you can use formulas to work with updated data on customer orders, employee hours, inventories, etc. It is also provided with report layouts. XLGL works on PC with Excel version 2007, 2010, 2013, 2016 and 2019.
9. ASAP Utilities — $49
ASAP Utilities is an Excel add-in focusing on saving time. Although many features are not rocket-science, some are interesting like the possibility to sort tabs alphabetically or by color, or the tool to insert cells before or after each cell in the selection. ASAP is one of the only add-ins available starting with Excel version 2000 and works with every version on PC up to Excel 2019.
10. MonteCarlito — Free
As the name suggests, MonteCarlito is designed to run Monte-Carlo simulations in Excel, as well as other statistical analysis to compute mean, median, standard error, variance, skewness, kurtosis, etc. It is quite an old and simple add-in, but MonteCarlito works with both Windows and Mac iOS versions of Excel.

11. Intis Telecom — FREE
The Intis Telecom plugin allows you to send SMS directly from Excel. Select a range with phone numbers in your spreadsheet and the plugin will send them the SMS of your choice. The plugin is free but requires to purchase credits to send SMS. Intis Telecom is compatible with Excel 2003 to 2019 on PC. It is not available on Mac.
12. Analystix Tools — Free
Analystix provides a free Excel add-in meant for financial analysis. It includes tools to calculate CAGR, WACC (weighted average cost of capital), Black & Scholes formula, as well as an histogram builder to visualize distribution and a date arranger. Analystix Tools works on Excel 2010 and later on PC.
13. People Graph — Free
This plugin lets your create and update people graphs, a typical tool for infographics. This add-in works on PC with Excel 2013 to 2019, on Excel 2016 for Mac, Excel Online and Excel for iPad.

14. Analysis ToolPack — Free
The Analysis ToolPack is a Microsoft add-in that allows statistical analysis such as correlation analysis, descriptive statistics or histograms. It is provided on every computer using Excel 2007 and later, Mac or PC. You just need to load the add-in.
15. Solver — Free
The Solver is a tool that is also provided by Microsoft with Excel 2007 and later. It can be used for what-if analysis, to find optimal value for a formula in a cell under constraints limiting other formula cells. Basically, the Solver will determine the maximum or minimum value that a formula can take while changing several other cells.
16. Power Query — Free
This Microsoft add-in is made to help access and explore data in Excel like with Business Intelligence tools, by allowing to import, transform or combine multiple data sources. Power Query requires Excel 2010 or 2013 on Windows.

17. StatPlus:mac — €189
StatPlus:mac is one of the very few Excel add-ins for statistics that works on Mac. It is a statistical analysis package allowing to analyze correlations, run regressions, time series or data processing analysis, to create statistical charts, etc. StatPlus is actually available on both PC (2007 to 2019) and Mac (2004 to 2016).

18. FRED — Free
Provided by the Federal Reserve Bank of St Louis, this free add-in provides access to macroeconomic data from multiple sources such as the BEA, OECD, BLS or Census. Time series can be inserted into Excel with a few clicks, and you can then automatically calculate growth rate or change the data frequency. You can even refresh your spreadsheet with the most up to date data and see your entire dashboard adapt to it. The FRED add-in works with Excel 2010 and 2013.
19. Simtools — Free
Simtools adds 32 statistical functions to perform Monte Carlo simulations and risk analysis in Excel spreadsheets. Functions cover cumulative probability, correlations among random variables, decision analysis, analyzing discrete probability distributions, regression analysis, or random generation of discrete distributions. Simtools works on PC with Excel 2003 and later.
20. Formlist — Free
Formlist is an auditing tool that provides procedure for displaying the formulas of any selected range of cells in Excel. It is a very simple add-in with limited possibilities, but it’s free, and it works on Excel 2003 and later for PC.
21. NXPowerLite Desktop 8 — $50
Not exclusively for Excel but working with PowerPoint, Excel, and Word, as well as JPEG or PDF files, NXPowerLite compresses files and optimize them for screen, print or mobile devices. It can also automatically compresses your email attachment files, a feature that you can also temporarily disable if you don’t want it. NXPowerPointLite does not work on Mac iOS.
22. Jensen — Free
Jensen has actually created multiple Excel add-ins performing various tasks, mainly for statistics analysis purposes. One is for Markov analysis, one for random variables, one for decision analysis, one for simulation, etc. These add-ins are quite old and were designed for Excel 2003 on Windows.
23. Anomaly Server — Free
This tool helps you identify anomalies and outliers in a data set. the US directly into Excel from data.gov. This Excel tool works with Excel 2016 and up for PC and Mac, as well as with Excel Online.
24. XLSTAT — $235 to $940
XLSTAT works as an add-on with about 100 features for advanced statistical analysis: linear or non-linear regressions, k-means, principal component analysis, etc. XLSTAT is highly compatible, working on PC for version 97 up to 2019 and on Mac with Excel 2011 and 2016.

25. Operis Analysis Toolkit (OAK) — £311.66
This Excel add-in aims at helping you understand complex spreadsheets and reduce the risk of errors. The main features are a workbook summary, a spreadsheet structure map, a formula walker and other solutions to compare, audit and search Excel workbooks. OAK is compatible with Excel on Windows, but not with Mac iOS.

26. Table Analysis Tools and Data Mining Client — Free
These 2 add-ins for Excel are provided by Microsoft for data mining. Table Analysis Tools for Excel leverages SQL Server 2012 data mining models from an Excel spreadsheet, while Data Mining Client lets you explore data mining models. These tools require Excel 2010 or 2013 on Windows.
27. Dose — €33.84
Dose is a great collection of tools for Excel. It contains many, many features such as a date picker, an auto back-up solution, powerful functions, tools to find duplicated, list files, manage rows, clean data, count words and more. The add-in is compatible with Excel 2007 to 2019 on PC.

28. Supply Chain add-in — Free but requires subscription
This Excel plugin helps you build powerful geographical visualizations. Not only can you create data-driven maps, but also geocoding, distance calculations, warehouse locations optimizations and more. It works with Excel 2016 and later on Windows, Mac and web.

29. Office Tabs — Free
The Office Tabs add-in creates an easy interface allowing to switch between the windows opened on any Microsoft Office application. It creates a tab bar on your standard PowerPoint, Excel or Word window, displaying a tab for each currently open document of the same application. Just like on your Internet browser, you can click on a document’s title to switch to it. You can also save all open documents in one click, instead of saving them separately. Office Tabs works on Office 365 and all Office version above 2003, but non on Mac iOS.

Nota Bene: this tool is comparable to the Tab Explorer feature included in the Power-user add-in
30. ParallelDots — Free for limited use
This powerful gives you access to an AI for text analysis. Among the great tools it provide, you can use the AI API for sentiment analysis, keywords generation, text classification (taxonomy), to find abusive content and more. The add-in requires Excel 2010, 2013, 2016 or 2019 (64 bit only) on Windows 7, 8 or 10.

31. vIcons — $99
vIcons is a library of 600 icons that can be inserted in Excel, Word or PowerPoint. Search icons using keywords or just pick them up in the library. vIcons works on Office 2007, 2010 and 2013 for Windows, but the add-in does not run on Mac.
Nota Bene: this is an equivalent to the Icons Library included in the Power-user add-in that contains over 4,000 vector icons.
32. Random Number Generator — $29.95
As the name suggest, this Excel add-in generates numbers randomly. It could be seen as an improvement of the RAND() Excel function, since you can choose the format of the data you want to generate: dates, boolean, integers, real numbers etc. It can also be used to generate strings of characters in order to create random passwords. Random Number Generator works on Windows computers with Excel version 2007, 2010, 2013, 2016 and 2019. It does not work on Mac.

33. Random Sorter — $29.95
Random Sorter can be really useful if you need sometimes to extract randomly 25% of your population, to make a poll for instance. The add-in will shuffle your data. Random Sorter works on Windows computers with Excel version 2007, 2010, 2013, 2016 or 2019. It does not work on Mac.

34. Audit Tickmark Toolbar — $25
This small toolbar can be useful for audit, accounting or finance, allowing to add tickmarks to show GL (for General Ledger account), PBC (Prepared By Client), PY (agrees to Prior Year), TB (agrees to Trial Balance), etc. The toolbar works with Excel 96 to 2019 on PC but is not available for Mac.
35. QR4Office — Free
The QR4Office plugin creates QR codes that will allow to open your document with a pre-defined url of your choice. You can use it to make your Excel file or PowerPoint presentations more interactive, so that people can check it with their smartphone or vote for a poll, for instance. QR4Office is available for versions of PowerPoint, Word and Excel later than 2013 on Windows, as well as version 2016 on Mac.

36. Geographic Heat Map — Free
The Heat Map Excel app lets you display data-based colors on the map of the USA or the World map. You can move your mouse on each state as well to display its name. This app works with Excel 2013 and later on PC, and with version 2016 on Mac.
NB: for a broader choice of 200 map of continents, regions, countries or counties, you can use instead the Power-user add-in and insert one of the many Data maps from this tool. See how it works here in video.

37. Password Recovery — $29
If you protect Excel files with passwords and you tend to forget them, this plugin can be of use to you. Success is not guaranteed though, and recovering a password can take up to 36 hours so don’t rely on this if you are in an emergency situation. Password Recovery works with Excel versions 2003 to 2010 on Windows. It is not available on Mac.

38. Ultimate Suite — $99
This suite regroups all add-ins from the office-addins website (a company that is independent from Microsoft). Those tools include Password Recovery, the Random Number Generator and Random Sorter, as well as tools to find and remove duplicates, to split columns, to clean data from multiple sources, find broken links or cells similar to your selection, etc. This package is available on Excel versions 2003 to 2010 on Windows but is not available for Mac.

39. Lucidchart — Subscription required
This app for Excel lets you create flowcharts, UML, wireframes, mockups, org charts and more in your workbook. The app works for Excel 2013 or later on Windows, and for Excel 2016 on Mac.

40. Supermetrics — $99/mo
Supermetrics is a great tool for people in digital marketing, looking for a solution to analyze data in Excel. It can connect to a great number of sources like Google Analytics, Google Ads, Social networks and more, allowing you to crunch the numbers for traffic and conversions directly in Excel. You can also use it to create dashboards, refreshing them and emailing them automatically. It is available for Excel 2016 and 365, online and offline.

41. GIGRAPH Network Visualization — Free
GIGRAPH creates network diagrams that can be used to visualize relationships between multiple persons or entities. Your data would need to be organized for one-way or two-way relationships, for instance with a ‘from’ and a ‘to’ columns. GIGRAPH is available on Windows computers with Excel 2013 Service Pack 1 or later, as well as Excel Online.

42. Selection Diff Tool — €3.99
If you need to compare two strings of text and identify the differences between them, this tool is made for you. This app works on Excel as well as on Word, where it can be of great help if you are reviewing a different version of a document that was not made using Track Change. The app does not work on Mac and is supported by Excel and Word 2013 and later.

43. XY Chart Labeler — Free
This plugin lets you take back control of the chart labels in Excel. Working with labels can be very annoying, and you have limited options. So this plugin lets you add labels to data points on your XY chart data series or move XY labels. The XY Chart Labeler actually works not only for XY charts. It is available on Windows and on Mac 2011, but not on Mac with Excel 2016.
44. Hoadley Finance — $AU176
For people working a lot on Excel in finance, this add-in can be a useful addition. It allows you to perform portfolio analysis, calculate option prices, volatility, value at risk, asset allocation, company valuation, and even more. Formulas can also be used to stream quotes values in real-time from Internet sources. The Hoadley Finance add-ins works with Excel 2003 to 2019, on Windows but not on Mac.
45. ModernCharts — $4.99/mo
This Excel app allows you to reveal what your data contains with a number of charting tools and options. It can be helpful to create infographic charts in Excel or PowerPoint, relying on a comprehensive chart library. The app is available on all versions above 2013, including on Mac.

46. Microsoft Dynamics — Free
Connect your Excel spreadsheet to your Microsoft Dynamics data, read it, analyze it or feed your dashboard, and publish data changes back into Microsoft Dynamics. On Word, you can manage templates that will be fed by data from Microsoft Dynamics. If your company is using this CRM, then you will need this app. It is available on Excel and Word 2016 versions and later.

47. Risk Analyzer — $49.95
This add-in lets your perform Monte Carlo risk analysis, histograms and tornado charts, what-if analysis, etc. It does not work on Mac iOS, but is compatible with Excel 2007 and above on Windows.

48. Panel Chart — $29.95
When you create Excel line charts with many series, it can easily become impossible to read as lines cross one another or as the size of the legend increases. with the Panel Chart add-in, you can separate lines by categories in different panels, so that you chart is much easier to read and understand. Panel Chart works on Excel 2007 and above on Windows, but is not available on Mac.

49. BulkQuotesXL Pro — $74.95
This Excel add-in allows you to download free quotes from multiple data sources directly into spreadsheets. The tool can access data from Yahoo! Finance historical prices and dividends, to Google Finance historical prices, to PiFin historical prices and to CBOE. BulkQuotesXL is available on Windows computer with Excel 2010 and later, but not on Mac.
50. Vertex42 Templates Gallery — Free
Vertex42 provides a gallery of over 150 professionally designed templates for Excel and Word. Templates include calendar, planners, budgeting, inventory, invoices or financial statements. The app works on Excel and Word 2013 and later for Windows.

51. Model Analyzer — €354
This Excel add-in brings multiple solutions for Excel modelling. You can centralize input and output variables in your spreadsheets, but also perform statistical analysis, such as what-if analysis (with tornado charts, spider charts and sensitivity tables), scenario analysis, multiple goal seek, break-even analysis or Monte-Carlo simulations. Model Analyzer is made for financial analysts, economists and researchers. It is only available on the 32 bit version of Excel 2007 and 2010. It is not compatible with Mac either.

52. Weather by Visual Crossing — $5/mo
This small add-in for Office lets you get weather and climate records and forecasts directly into Excel. The data is available down to the hour. It also includes geocoding allowing to get the weather for a specific address.
53. Spreadsheet123 — Free
Before starting to build spreadsheets from scratch, you might sometimes want to pick up a nice template and work on it. That’s exactly what you can do with Spreadsheet123, a library of templates with financial statements, budgeting, payroll, invoicing, time sheets, checklists or inventory management templates. Spreadsheet123 works with Excel and Word 2013 Service Pack 1 or later as well as Excel and Word online, but is not available on Mac.

54. Capital Budgeting — Free
This Jensen add-in is made to identify optimized portfolios. Define a potential portfolio by providing its initial investment, annual return, salvage value and life. The model will use the standard deviation to estimate risk and will identify the optimized portfolio.
55. Inventory — Free
This Jensen add-in computes inventories, with the possibility to integrate backorders, lost sales, finite or infinite replenishment rates. The model identifies the optimum lot size with cost breaks.
56. Bubbles — Free
This app lets you create nice and colorful bubble charts, to display 3 or 4 dimensions of information. Use the horizontal and vertical axes, bubble size and colors to display complex information in a simple way. Bubbles works on Excel 2013 and later on Windows, as well as Excel 2016 for Mac.

57. Excellent Analytics — Free
Excellent Analytics is the must-have add-in to dig into your Google Analytics data directly from Excel. Use it to crunch your Analytics data and identify how you can bring more traffic to your website.
58. SEOTools — €79
This add-in lets you integrate data from Google Analytics, Google Adwords, the Google Search Console, SEMrush, Youtube, Ahrefs, Moz and other platforms directly into Excel so you can work your SEO data and identify key trends on your website.
59. SEOGadget — Free
SEOGadget lets you analyze your analytics data into Excel. It can access data from Majestic SEO, Moz and Grepwords and bring it to Excel for you to work on it and identify how you can boost your website’s ranking. The tool works on Windows with Excel versions 2010 and above, but does not work on Mac iOS.
60. Checkbook Assistant — Free
This add-in can help you manage your personal finance, letting you do you checkbooks and bank statements with Excel. You can move rows up or down in a single click, so you can align your Excel records with your bank statements. The tool detects and highlights the first unprocessed row. The Checkbook Assistant works with Excel 2007 and later on Windows, but is not available for Mac.

61. Loan Assistant — $19.95
This plugin lets you easily compute loans, playing with the annual flat interest rate, load amount and balloon payment at the end of the load to calculate the actual payment per period and total interests to pay. The plugin can also create a load detail year by year with the due capital and interest payments, as well as the remaining capital. The Loan Assistant works with Excel 2007 and later on Windows, but is not available for Mac.

62. Flash Card Assistant — Free
Turn Excel into a Q&A software with this simple plugin. Define a list of questions and their answers, choose the order or make it random and run it to get questions asked like flash cards and make it a game in a private or professional situation. The plugin is free and works with Excel 2007 and later. It is not supported on Mac.

63. ActiveData — $249
ActiveData adds data analytics and time-saving worksheet and workbook management features into Excel. Features include join, merge, query, summarize, find duplicates, split data, etc. The tool works with Excel versions 2007 and later on Windows, but is not available for Mac.
64. Mekko Chart Creator — $29.95
Create Marimekko charts with this tool, so you can display 3 dimensions of data in an appealing way. This plugin works with Excel 2007 and later on Windows only.

Nota Bene: for more advanced Mekkos that are editable, you can use instead the Mekko feature of the Power-user add-in for PowerPoint, Excel and Word.
65. Conditional Row Delete — Free
This small add-in simplifies the process of deleting rows selectively, based for instance on the value in a specific column.
66. Power Utility Pack — Free
For Mac users, this add-in is one of the best available options. Created by Ron de Bruin, it contains a collection of utility tools that can be relevant time-savers in several situations.
67. Exchange rates — $35.94
This plugin helps you by converting currencies with with real-time rates from the Internet. Rates are accessed from the MSN Money Central Investor website. The tool works on Windows only, for any version of Excel above 2000.
68. Mini Calendar and Date Picker — Free
When working with dates in Excel, it can be a pain — and a possible source of errors — to type manually multiple dates. With this app you can now just pick a date in a calendar and it will be automatically formatted as date. The app works with Excel 2013 or later on Windows, on Excel 2016 on Mac and on Excel Online.

69. Favorite Bookmarks — Free
Use this add-in to bookmark your favorite workbooks, sheets or range, so you can find and open them anytime from other Excel spreadsheets. The tools is available on Windows only, for Excel versions 2007 and later.

70. Functions Translator — Free
This add-in from Microsoft helps you translate functions and formulas between languages supported by Excel. It works with Excel 2013 and later on Windows, Mac and Excel Online.

71. RDBmail — Free
This mail add-in for Excel from Ron de Bruin lets you automate the process of sending sheets, data or workbook. When you have a workbook open, you can just click on the buttons on the ribbon to send it in an Outlook email, with options to send the entire workbook, just the active worksheet, or to send is with values instead of formulas. RDBmail works with Excel 2007 to 2019 on Windows.

72. Intrinio — Free
Intrinio lets you screen all equities in the United States, using filters on 500 parameters to identify the equities that meet your requirements, such as current stock price, return on equity, dividend yield, price to earnings ratio, sector, employee count, etc. Intrinio only works on Windows with Excel 2013 or later.

73. Excel training and tips — Free
This app helps you learn some Excel with a list of formulas to learn, for beginners, intermediates or Excel experts, Q&A on formulas and other information you need to know if you are to use Excel frequently. The app works with Excel 2013 and later on Windows as well as with Excel 2016 for Mac.

74. Power Reconcile — Free but $9.99/mo subscription required
This add-on is very relevant for people in finance who need to reconcile reports between vendor and accounts payable. The report will be created automatically, highlighting perfect matches or partial matches, saving you potentially a lot of time compared to a manual reconciliation. It is compatible with Excel 2013 and later on PC or Mac as well as the web version.
75. Microsoft Flow for Excel — Free
This add-in by Microsoft helps you create workflows between different applications like Excel, Outlook, Planner, Twitter, Trello, MailChimp and others. These workflows can include approval process, mobile push notifications, email sending etc. It is compatible with Excel 2013 and later on PC, Mac or the web.

Conclusion:
Excel is among the most used software in the world, and a key tool for business in most companies. However immensely rich and complex, the standard version of Excel is still just a fraction of what can be done on it by using the variety of add-ins that have been created around it.
If you are interested in PowerPoint add-ins as well, check our list of 40+ add-ins, plugins and apps for Microsoft PowerPoint.
If you are interested in PowerPoint add-ins as well, check our list of 60+ add-ins, plugins and apps for Microsoft Word.
Saturday, April 26, 2008
Peltier Technical Services, Inc., Copyright © 2023, All rights reserved.
Excel is a mighty powerful application, and yet, there are any number of utilities available to extend its capabilities. I’m sure everyone has their favorites, and here I’m going to talk about mine. My reliance on these utilities is as a developer of Excel applications, that is, solutions that combine add-ins, templates, and regular workbook to accomplish specific objectives within specific operating parameters. My favorite utilities lean toward developer tools, rather than worksheet productivity tools. This is an incomplete list: there must be hundreds of worthy utilities written by dozens of developers, but these are the ones I have tried and kept. If you think I’ve left out an important utility, tell me about it in the comments.
Two of my favorite tools were developed by fellow Microsoft Excel MVP Jan Karel Pieterse. He has a variety of utilities on his web site, JKP Application Development Services, as well as a diverse collection of articles and tutorials. I use Jan Karel’s Name Manager and AutoSafe. Jan Karel has offered me a percentage of sales on these two utilities, but that won’t amount to much, because they are free.
Name Manager
The Name Manager is a high-powered tool for working with all of the Names in your workbooks. You can view all names, or filter by a number of conditions. You can make Names hidden or visible, local to the worksheet or global to the workbook. You can add and delete Names, and see what ranges they refer to. Especially powerful is the ability to work on many Names at once. This utility can save a developer many hours.
AutoSafe
AutoSafe is what Microsoft was thinking when they implemented Autosave. AutoSafe saves a copy of your open workbooks in a directory you specify, without overwriting the workbooks. If Excel shuts down improperly, AutoSafe offers to restore the files in use prior to the crash. When a new copy is saved, the existing copy is removed to the recycle bin. In this way, you can maintain an informal version history in the recycle bin, as well as track your activities. This utility has saved me many times.
Microsoft Excel MVP and author Rob Bovey, of Application Professionals, offers a handful of free utilities. I use Rob’s Chart Labeler and VBA Code Cleaner utilities.
Chart Labeler
Rob calls this the XY Chart Labeler, but it really works for any chart that accommodates data labels on its plotted series. Excel allows you to label points with the series name, category labels (or X values), or Y values, and once you’ve added labels, it allows you to customize those labels. But for some reason Excel lacks the capability to apply a set of labels from the worksheet to a series on the chart. The Chart Labeler addresses this shortcoming, allowing you to apply custom labels one point at a time, or one series at a time. The labels on the points remain linked to the cells containing the labels, so the chart labels change when the labels in the cells are changed. The Chart Labeler also allows fine positioning of one or a series of labels. I’ve heard that this is the most downloaded Excel utility, and I’m not surprised. It’s been around since VBA was introduced to Excel, and it’s useful for anyone from casual users to hard core developers.
VBA Code Cleaner
Rob says it best:
“During the process of creating VBA programs a lot of junk code builds up in your files. If you don’t clean your files periodically you will begin to experience strange problems caused by this extra baggage. Cleaning a project involves exporting the contents of all its VBComponents to text files, deleting the components and then importing the components back from the text files.”
Microsoft Excel MVP and author Stephen Bullen offers many example workbooks and free utilities on his Office Automation web site (Stephen and Rob have collaborated on several books). I use Stephen’s Smart Indenter and VBE Tools utilities when I’m developing in VBA.
The Smart Indenter restores an orderly appearance of your code modules by indenting each line. The indentation style is highly customizable. I use this very frequently while writing code, and often the first thing I do when I receive a workbook from someone else is run the Smart Indenter on its code. The Smart Indenter has versions for VBA and for VB6.
VBE Tools provides a set of enhancements to the Visual Basic Environment. It adds a toolbar that shows the size of the active code module and that adds “Nudge” buttons that provide fine positioning control of objects on a user form. It also wraps the location of files in the References dialog, so you can actually see the entire path and file name of the reference. This feature materialized after Stephen heard me whining about the truncated reference file name problem.
John Walkenbach, Excel MVP and author of dozens of spreadsheet books, has an extensive website with tips for developers and for regular users. “Mr Spreadsheet” also hosts the very popular non-Excel J-Walk Blog, and he has a number of utilities on his site.
J-Walk Chart Tools includes a labeling feature similar to Rob’s (above). It also includes features that export charts as image files, convert charts to embedded pictures, and create a report detailing one or all charts on a sheet.
Power Utility Pak is an extensive set of general-purpose tools that make working in Excel much easier. PUP includes tools for Formatting, Formulas, Charts, Ranges, Worksheets, Workbooks, and much more. This is the only Excel utility listed here with a registration fee, but the fee is nominal, and includes free upgrades for life. For an even smaller nominal fee, the user gains access to the VBA code behind the utilities, for educational purposes only (of course).
ASAP Utilities (“As Soon As Possible”) by Bastien Mensink offers a broad set of tools that enhance your productivity in Excel. It is similar in scope to the Power Utility Pak, but remarkably there is not a lot of overlap between them. When my work was primarily as a regular Excel user, I had both utilities installed, and used them about evenly. I find them less useful now as a developer, but both are worth mentioning here.
A utility I use a great deal as a developer is MZ Tools, written by Microsoft Visual Developer MVP Carlos Quintero. There are free VBA and VB6 versions as well as commercial .Net versions. MZ Tools provides many features that facilitate writing, documenting, and debugging code, and managing VB projects. I don’t even know all the features of MZ Tools; I discover new ones all the time.
For packaging my projects into standard installation executable files, I use Inno Setup by Jordan Russell. This standalone utility uses a versatile script to compile your files into a single EXE file, for simple and flawless installation. Inno places your files into a predetermined or user-defined directory, sets any registry keys, and adds shortcuts during installation, and cleans up after itself when uninstalling programs.
There are some utilities that I don’t use frequently, but I need them on occasion and recommend them to users with specific problems.
FindLinks by Excel MVP Bill Manville helps to find and fix those stubborn links in your workbook.
FlexFind is another handy utility from Jan Karel Pieterse (see above). This utility helps find and replace text throughout the entire workbook, in headers, footers, chart titles, and other places normally out of reach to the Edit menu.
Excel MVP Andy Pope hosts a number of utilities, as well as lots of neat Excel tricks. I use his Button Editor frequently when designing user interfaces.
I may as well mention a few non-Excel utilities I also use frequently.
IrfanView is an outstanding and free image editing utility.
SnagIt by TechSmith is a nicely made program, which can capture images or text from windows or screeen regions. TechSmith also makes Camtasia, which I’ve never used, but which is popular for creating and editing video files. SnagIt and Camtasia are commercial products.
For converting workbooks and other documents to PDF files, there must be dozens of free utilities. I use PDFCreator, which is unique in that it can be controlled using VBA (see Ken Puls’ ExcelGuru site for programming hints), and PrimoPDF, which has a very nice save-as interface.
For FTP file transfers, open source program FileZilla is the best free alternative I’ve come across.
Ultimate Suite for Microsoft Excel
70+ professional tools to accomplish any task impeccably without errors or delays.
Works with desktop Excel included in Microsoft 365, Excel 2021 – 2016.
You can find the previous versions of our products on the archived versions page.
| Edition | Version | Date | Free Download |
|---|---|---|---|
|
Personal edition |
2022.3.3345 | 06-Feb-23 | Download |
|
Business edition |
2022.3.3345 | 06-Feb-23 | Download |
|
For Terminal server users edition |
2022.3.3345 | 06-Feb-23 | Download |
Add-ins Collection for Outlook
8 essential tools to boost your inbox productivity.
Works with desktop Outlook included in Microsoft 365, Outlook 2021 – 2016.
You can find the previous versions of our products on the archived versions page.
| Edition | Version | Date | Free Download |
|---|---|---|---|
|
Business edition |
2023.1.720 | 11-Apr-23 | Download |
Link Checker for Word
A speedy solution for managing links in your Microsoft Word document. Works with desktop Word included in Microsoft 365, Word 2021 – 2016.
| Edition | Version | Date | Free Download |
|---|---|---|---|
|
Personal edition |
4.3.460 | 10-Mar-22 | Download |
Управление данными
Работа с ячейками, столбцами и строками
Поиск и замена
Использование стилей
Удаление ненужных пробелов
Исправление опечаток
Работа с книгами
Быстрый доступ к нужным книгам
Эффективное управление книгами
Выявление и восстановление нарушенных ссылок в связанных книгах
Объединение, разделение и сравнение данных
Объединение данных из нескольких файлов
Объединение данных из нескольких ячеек
Разделение данных по таблицам
Сравнение файлов с данными
Выявление записей-дубликатов
Работа со сводными таблицами
Управление
Автоматическое форматирование
Создание графиков и диаграмм
Microsoft Excel — лидирующее приложение на рынке решений для обработки электронных таблиц, которое широко используется как корпоративными клиентами, так и домашними пользователями. Такое признание вполне оправданно, поскольку данное решение удобно в применении, стабильно работает и отличается очень широкой функциональностью. Однако, как бы ни был хорош тот или иной программный продукт, всегда можно найти функции, которые неплохо было бы в нем усовершенствовать. Также и с программой Excel, для расширения функциональности которой сегодня разработано множество программ-надстроек. Основное их назначение — добавление новых возможностей и автоматизация привычных рутинных операций. Наиболее интересные решения подобного плана мы и рассмотрим.
Управление данными
Работа с ячейками, столбцами и строками
При работе с таблицами для достижения желаемого результата приходится выполнять огромное количество разнообразных действий: изменять в ячейках форматы, перемещать столбцы и строки, сортировать данные и т.д. Все это требует определенного времени, поэтому крайне важно наличие функционала для быстрого (то есть одним кликом, а не через последовательный выбор тех или иных меню) осуществления таких операций. Необходимый для этого функционал в Excel может быть разработан собственноручно через макросы. Например, если вам регулярно приходится устанавливать в ячейках числовой формат с одним знаком после запятой, то разумнее создать для этой операции макрос, назначить его кнопке и вынести последнюю на панель инструментов. Заметим, что некоторые подобного рода рутинные операции в Excel имеют свои кнопки, но они просто не вынесены на панель инструментов. Поэтому, прежде чем мудрить с макросами, стоит открыть окно Настройка (команда Сервис -> Настройка), активировать вкладку Команды и, перебирая категории в левой части окна, внимательно просмотреть кнопки в его правой части. При обнаружении интересующей кнопки ее следует перетащить на панель инструментов. Можно пойти другим путем — расширить функциональность Excel, установив подходящие надстройки типа ASAP Utilities, PLEX или Cells Assistant for Excel. Это позволит существенно ускорить выполнение ряда операций.
После установки плагина ASAP Utilities (http://www.asaputilities.com/download/ASAPUtilities_setup_4-2-5.exe; 3,36 Мбайт; 49 долл.) в Excel появляется дополнительное меню ASAP Utilities (рис. 1), имеющее инструментарий для выполнения множества разнообразных действий. Так, с помощью данного плагина можно быстро пронумеровать ячейки и вставить в выделенных ячейках (перед либо после введенных значений) конкретный текст. Столь же несложно перетасовать значения ячеек случайным образом и объединить ячейки с сохранением их содержимого. Либо выделить ячейки в соответствии с некоторым условием — например только защищенные или незащищенные, пустые или непустые либо те, в которых значения находятся в определенных интервалах или имеют связанные с другими файлами либо листами формулы и т.п. А также скопировать параметры настройки отдельного листа (размеры полей, колонтитулы, ориентацию страницы и пр.) на любой другой лист. ASAP Utilities поможет быстро удалить в таблице все ссылки, объекты (изображения, кнопки), ненужные пробелы и границы, а также ячейки, имеющие заливку определенного цвета либо содержащие определенного цвета текст. С его помощью можно отсеять из группы выделенных ячеек ячейки внутри конкретного диапазона и провести сортировку ячеек с учетом не только значений, но и целого ряда других критериев (включая цвет заполнения ячейки, цвет, гарнитуру и размер шрифта и др.). Очень удобно в ASAP Utilities реализовано применение формул — они назначаются сразу всему выделенному диапазону (рис. 2), при этом программа запоминает последние сто задействованных формул, так что в случае повторного применения вводить нужную формулу уже не потребуется — ее можно просто выбрать из списка.
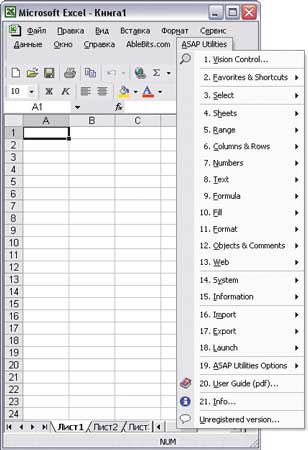
Рис. 1. Меню ASAP Utilities
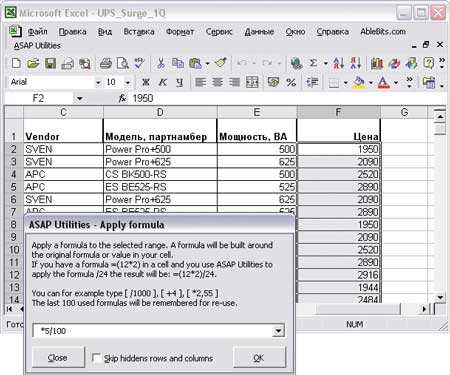
Рис. 2. Назначение формулы выделенному диапазону в ASAP Utilities
Плагин PLEX (http://www.planetaexcel.ru/docs/PLEXDEMO.zip; 1,83 Мбайт; 500 руб.) при инсталляции добавляет в окно Excel дополнительную панель инструментов PLEX Toolbar (рис. 3). Используя кнопки данной панели, можно автоматически подсветить ячейки в зависимости от их содержимого (это, в частности, позволит быстро понять, где в большой таблице введено значение вместо формулы или текст вместо числа), отсортировать ячейки по цвету и провести суммирование ячеек с определенным цветом шрифта или заливки. А также быстро переставить ячейки в выделенном диапазоне в обратном порядке (первая становится последней, вторая — предпоследней и т.д.), удалить все пустые строки на листе, поменять местами выделенные столбцы либо строки и т.п. Так же быстро можно установить в выделенных ячейках денежные форматы, вставить текущее значение курса доллара (евро, гривны, фунты стерлингов) на заданную дату, вывести сумму прописью на русском и английском языках и др.

Рис. 3. Панель инструментов PLEX Toolbar
Бесплатный плагин Cells Assistant for Excel (http://www.ablebits.com/files/cells-assistant-excel-15.zip; 1,29 Мбайт) поможет ускорить выполнение некоторых базовых операций за счет вынесения отвечающих за данные операции кнопок на дополнительную панель (рис. 4). Он обеспечит быстрое выделение групп ячеек, к которым было применено условное форматирование, и ячеек, смежных с ячейкой, в которой находится курсор, и имеющих точно такое же форматирование. А также поможет мгновенно переместиться в правую нижнюю ячейку таблицы и быстро выделить ячейки со значениями, формулами или комментариями.
Рис. 4. Панель инструментов
Cells Assistant for Excel
Поиск и замена
В Excel встроена возможность проведения поиска и замены, но ее хватает не всегда. Например, при необходимости проведения одной и той же замены в нескольких файлах данную операцию нужно будет запускать многократно, что потребует немало дополнительных усилий. А если какие-то варианты замен приходится проводить регулярно, то каждый раз потребуется вводить данные для поиска и замены заново, поскольку в Excel запоминание такой информации не предусмотрено.
Иное дело, если установить плагины MAPILab Find and Replace for Excel (http://www.mapilab.com/files/find_and_replace.zip; 2 Мбайт; 1100 руб.) или Advanced Find & Replace (http://www.ablebits.com/files/find-replace-excel-312.zip; 2,78 Мбайт; 29,95 долл.), существенно расширяющие возможности стандартного поиска и замены. Самое главное — они позволяют проводить поиск с заменой сразу в нескольких файлах одновременно (рис. 5), причем искать можно как в выбранных книгах целиком, так и только в определенных листах этих книг. Помимо этого данные плагины умеют проводить поиск и заменять данные не только в значениях ячеек, но и в формулах, комментариях, гиперссылках и др.
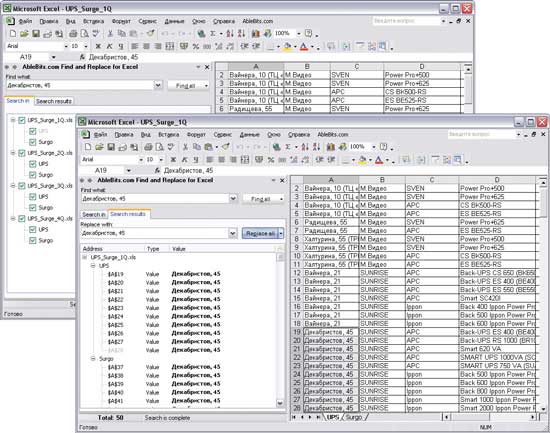
Рис. 5. Проведение поиска с заменой в четырех документах
одновременно в Advanced Find & Replace
Помимо этого плагин MAPILab Find and Replace for Excel может применяться для сохранения и загрузки поисковых запросов в качестве шаблонов. Это позволит в дальнейшем выполнять поиск более быстро, ведь исходные данные для поиска и замены уже вводить не придется — потребуется лишь указать список файлов и запустить процесс поиска. Кроме того, названный плагин допускает использование регулярных выражений и масок, что существенно расширяет возможности задания критериев поиска и замены данных, поскольку появляется возможность указывать не конкретные данные, а шаблон соответствия.
Использование стилей
Применение технологии стилей позволяет не только добиваться единообразного оформления материалов, но и существенно ускоряет процесс настройки внешнего вида таблиц. Однако встроенные в Excel возможности работы со стилями весьма ограниченны: количество стилей невелико, а создание пользовательских стилей хотя и допускается, но использовать их можно только внутри той книги, где они были созданы. Если же необходимо применить пользовательский стиль в другой книге (то есть не в той, где он был создан), то придется открывать обе книги и затем копировать стиль из одной книги в другую, что долго и неудобно.
Если такое положение дел вас не устраивает, то стоит обратить внимание на плагин Style Manager for Excel (http://www.ablebits.com/files/style-manager-excel-20.zip; 2,7 Мбайт; 19,95 долл.). Он поможет легко и быстро оформлять таблицы с помощью стилей, управление которыми производится через дополнительную панель Style Manager (рис. 6), включаемую/выключаемую нажатием комбинации клавиш Ctrl + Shift + S. Список входящих в поставку стилей достаточно велик и может быть расширен за счет пользовательских стилей, создать которые совсем несложно: достаточно настроить параметры форматирования в одной из ячеек, по своему вкусу подобрав цвета, шрифты, границы и прочие настройки форматирования, щелкнуть на кнопке Add и ввести имя нового стиля. Созданные таким образом пользовательские стили в дальнейшем без ограничений могут быть использованы в любой книге. Все стили (как встроенные, так и пользовательские) отображаются на панели StyleManager в древовидной структуре, и для удобства применения их несложно сгруппировать по папкам. При необходимости любой из стилей можно перетащить из одной папки в другую, переименовать и удалить.
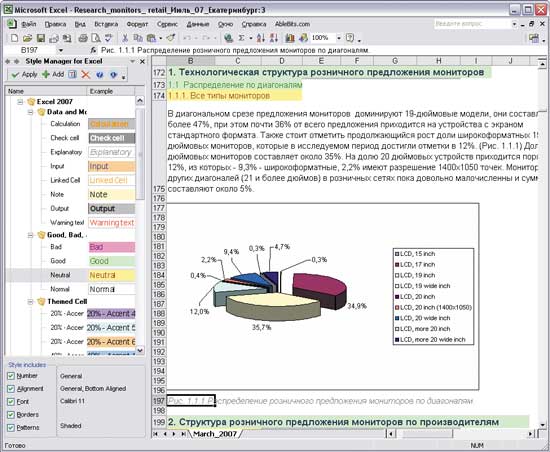
Рис. 6. Окно Excel с панелью Style Manager
Если при разработке собственного стиля арсенала доступных цветов вам окажется недостаточно, то можно создать новые цвета, палитры и градиенты, включая полупрозрачные. Для этого потребуется дополнительно установить плагин Color Palette Manager (http://www.ablebits.com/excel-colors-palettes-manager-addins/index.php; 19,95 долл.).
Удаление ненужных пробелов
Тем, кто занимается аналитической обработкой таблиц, приходится регулярно сталкиваться с ситуацией, что в отдельных ячейках в конце введенного в них текста присутствуют лишние пробелы (они обычно появляются при недостаточно внимательном вводе либо копировании данных из других источников). Хотя такие пробелы невидимы, они препятствуют нормальной обработке данных (например, удалению записей-дубликатов, корректному построению сводных таблиц и др.), а потому их приходится выявлять и удалять.
Отлавливание ненужных пробелов вручную занимает много времени — разумнее автоматизировать данный процесс, установив бесплатный плагин Trim Spaces (http://www.ablebits.com/files/trim-spaces-excel-12.zip; 1,2 Мбайт). С его помощью выявить и удалить такие пробелы можно будет в считаные секунды, ведь для этого потребуется лишь выделить интересующие столбцы и щелкнуть на кнопке Trim Spaces (рис. 7).
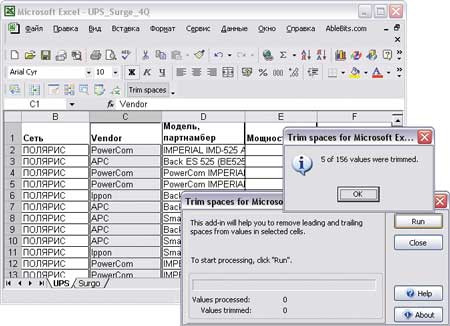
Рис. 7. Удаление ненужных пробелов с помощью Trim Spaces
Стоит отметить, что функция удаления ненужных пробелов предусмотрена и в уже упоминавшемся плагине ASAP Utilities.
Исправление опечаток
Обычно данные в документах Excel представлены большим количеством строк, в которых часть информации (например, производитель, наименование модели и т.п.) многократно повторяется. В то же время пользователи, отвечающие за заполнение таблиц, далеко не всегда придерживаются при вводе принципа единообразия вводимых данных — то есть, например, вместо текста Core 2 Duo в одних строках может оказаться Core2Duo, в других — CORE2 DUO и т.д. Помимо этого возможны и банальные опечатки, когда какой-то из символов будет пропущен либо заменен другим. В итоге при аналитической обработке данных, например при создании сводных таблиц, возникает масса проблем, и все подобные неточности приходится устранять вручную, что отнимает очень много времени.
Существенно ускорить процесс исправления подобных неточностей совсем несложно — достаточно взять на вооружение плагины Similar Data Finder for Excel (http://www.mapilab.com/files/similar_data_finder.zip; 3,6 Мбайт; 1100 руб.) и Fuzzy Duplicate Finder (http://www.ablebits.com/files/fuzzy-duplicate-finder-20.zip; 2,26 Мбайт; 29,95 долл.). С их помощью выявить ячейки с похожими значениями можно в считаные секунды. А затем столь же быстро исправить значения в тех ячейках, где они оказались неверными (рис. 8 и 9), либо удалить такие ячейки, либо выделить их (последнее требуется, если перед исправлением вам необходимо уточнить, какой из вариантов следует считать верным, и возможно только в Similar Data Finder for Excel).
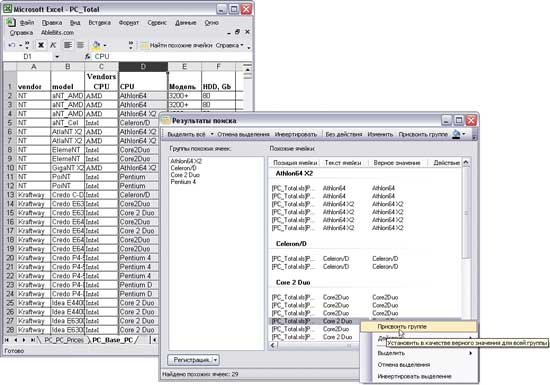
Рис. 8. Исправление схожих данных с помощью Similar Data Finder for Excel
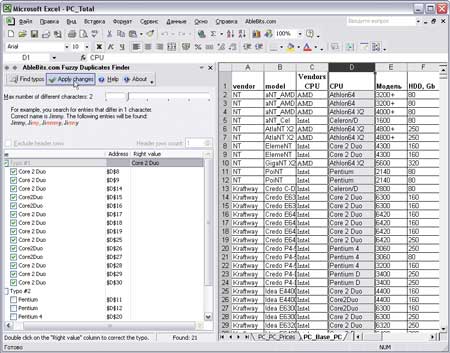
Рис. 9. Поиск и исправление опечаток в Fuzzy Duplicate Finder
Подобная корректировка может производиться автоматически (исправляются неверные значения сразу во всех схожих ячейках) либо вручную, когда правка осуществляется в отношении отдельных ячеек. Наличие возможности ручной правки не менее важно, ведь во многих случаях исправлять требуется не все выявленные ячейки, а лишь часть из них. Дело в том, что наименования моделей продукции могут быть весьма схожими. Например, разные модели блоков бесперебойного питания Back 500 IpponPowerPro, Back 600 IpponPowerPro и Back 800 IpponPowerPro окажутся отнесенными данными плагинами к одной группе ячеек. А это означает, что корректно изменить в соответствующем столбце, например, вариант написания Back 800 IpponPOWERPRO на вариант Back 800 IpponPowerPro в автоматическом режиме окажется невозможным — придется прибегать к корректировке значений вручную. Но все равно это гораздо быстрее, чем работать без применения плагинов.
Работа с книгами
Быстрый доступ к нужным книгам
В процессе работы с таблицами приходится многократно открывать те или иные папки и загружать из них нужные книги, что в случае слишком большого уровня вложений может отнимать немало времени. Для ускорения доступа к часто открываемым папкам с табличными документами либо напрямую к табличным документам можно прямо на рабочем столе разместить ведущие к ним ярлыки. Однако при большом количестве таких документов (а также иных ярлыков на рабочем столе) это не ускорит навигацию, а, наоборот, усложнит ее, ведь ориентироваться в большом числе ярлыков сложно. Пользователи Excel для решения данной проблемы могут воспользоваться бесплатным плагином Favorite Bookmarks (http://www.add-ins.com/Favorite_Bookmarks.exe; 509 Кбайт). С его помощью несложно создать закладки на избранные папки с документами либо отдельные файлы (рис. 10), что позволит в дальнейшем открывать соответствующие папки либо загружать напрямую файлы одним кликом. Созданным набором закладок можно управлять, перемещая их в желаемом порядке.
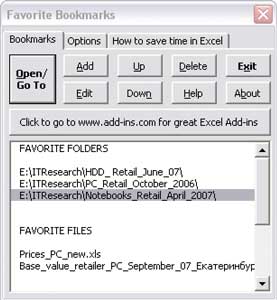
Рис. 10. Окно Favorite Bookmarks
с набором закладок
Эффективное управление книгами
Возможности быстрого открытия книг для организации эффективной работы с ними недостаточно — требуется еще иметь инструментарий, который бы обеспечивал удобное управление книгами. Такой инструментарий может предоставить плагин Explorer for Microsoft Excel (http://www.ablebits.com/files/explorer-for-excel-21.zip; 3,36 Мбайт; 19,95 долл.), предназначенный для удобного управления листами и книгами. После его установки все открытые книги и листы автоматически отображаются на панели плагина в виде дерева (рис. 11) — эта панель располагается в левой части экрана и включается/выключается нажатием комбинации клавиш Ctrl + Shift + N. Через данную панель можно легко переключаться между листами и книгами, перетаскивать листы из одной книги в другую, переименовывать листы и книги, сортировать их и удалять одним щелчком мыши. Возможна также работа со ссылками, комментариями, гиперссылками, ошибками и ячейками, имеющими условное форматирование.
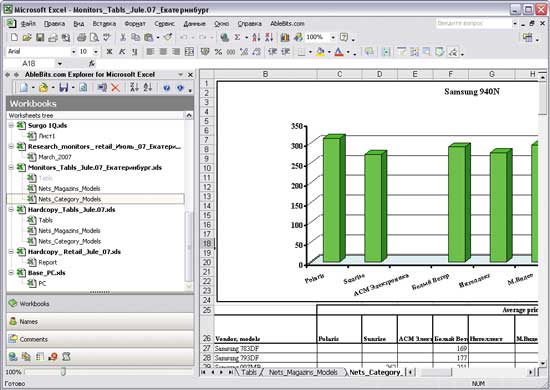
Рис. 11. Окно Excel с открытой панелью Explorer for Microsoft Excel
Выявление и восстановление нарушенных ссылок в связанных книгах
Нередко в таблицы включаются данные, находящиеся не только на других листах рабочих книг, но даже в других книгах (файлах-источниках), так как Excel позволяет связывать рабочие листы и отображать данные из одного рабочего листа в другом независимо от его расположения. Эта возможность незаменима, когда информация в файле-источнике постоянно обновляется или требуется обобщить данные из различных рабочих книг. Примером подобной задачи может служить подготовка отчета по продажам, в котором некоторые исходные данные для вычислений (предположим, текущие цены) берутся из связанного с рабочей книгой файла, хранящегося на компьютере другого сотрудника либо в общей папке на сервере компании. В этом случае благодаря возможности связывания данных отпадает необходимость каждый раз при подготовке отчета копировать в таблицу обновленные цены.
К сожалению, использование в рабочих документах связанных данных может привести к тому, что в один прекрасный день ссылки на другие документы окажутся неработоспособными (рис. 12) и подобные отчеты уже нельзя будет сформировать. Произойти это может вследствие того, что какой-то из исходных файлов оказался переименованным или перемещенным либо был перемещен сам итоговый файл со связями. При возникновении такой ситуации придется выяснить, что произошло с исходными файлами, и затем вручную вновь указать их — это потребует дополнительных временных затрат. Имеется более быстрый способ решения проблемы — воспользоваться плагином Fix Broken Links for Excel (http://www.mapilab.com/files/fix_broken_links.zip; 2,8 Мбайт; 1600 руб.).
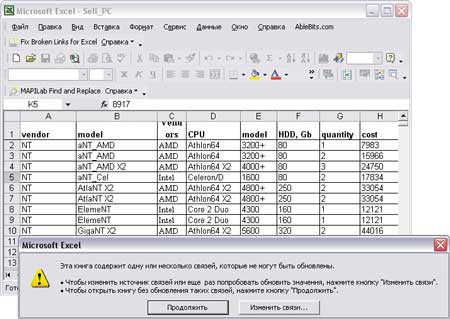
Рис. 12. Сообщение Excel о нарушении связей
С его помощью связи могут быть восстановлены в автоматическом режиме. Это означает, что вручную указывать новые файлы-источники не придется — программа сама проанализирует папку, в которой они находятся, выявит их и восстановит нарушенные связи (рис. 13). При активном использовании связанных файлов, особенно если их много и ситуации с перемещением/переименованием имеют место довольно часто, данная возможность окажется весьма кстати. Однако еще более полезной представляется другая функция — Fix Broken Links for Excel (копирование и перенос связанных файлов с сохранением работоспособности связей). Данная возможность предотвратит проблемы с нарушением связей при изменении структуры папок на рабочем компьютере и в случае использования связанных документов на нескольких компьютерах — например на рабочем компьютере и ноутбуке.
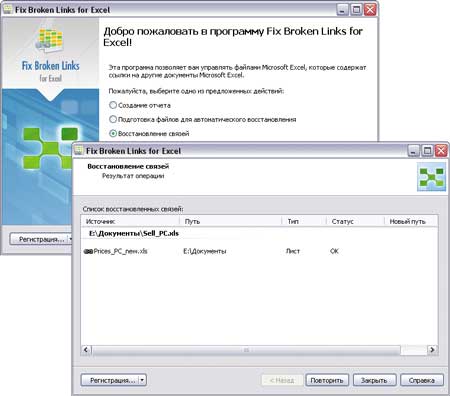
Рис. 13. Процесс восстановления связей в Fix Broken Links for Excel
Объединение, разделение и сравнение данных
Объединение данных из нескольких файлов
При работе с таблицами нередко возникает необходимость в объединении находящихся в разных файлах данных. Подобную операцию осуществить в Excel несложно — достаточно открыть исходные таблицы и скопировать через буфер обмена нужную информацию в итоговый файл. Однако при большом количестве файлов или для больших таблиц подобная операция становится достаточно трудоемкой и отнимает много времени. Если такие работы приходится проводить довольно часто, то полезно установить подходящие надстройки. Это могут быть плагины Advanced Consolidation Manager (http://www.mapilab.com/files/consolidation_manager.zip; 3,6 Мбайт; 1100 руб.), Merge Tables Wizard (http://www.ablebits.com/files/merge-tables-excel-168.zip; 2,04 Мбайт; 39,95 долл.) или Tables Transformer for Excel (http://www.mapilab.com/files/tables_transformer.zip; 3,2 Мбайт; 1100 руб.).
Плагин Advanced Consolidation Manager поможет скопировать листы с данными из нескольких файлов в одну рабочую книгу (рис. 14 и 15) либо объединить данные из разных файлов на один лист. Объединение данных может производиться с использованием итоговых функций: Sum, Count, Average, Max и т.д.
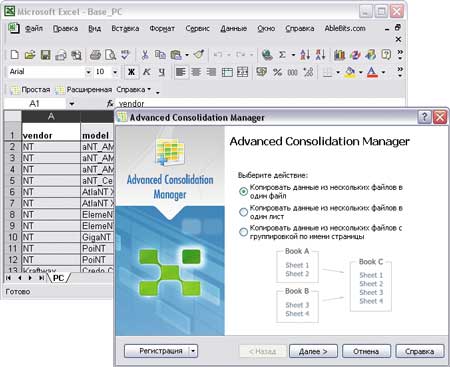
Рис. 14. Копирование листов из двух файлов в новую рабочую книгу
в Advanced Consolidation Manager
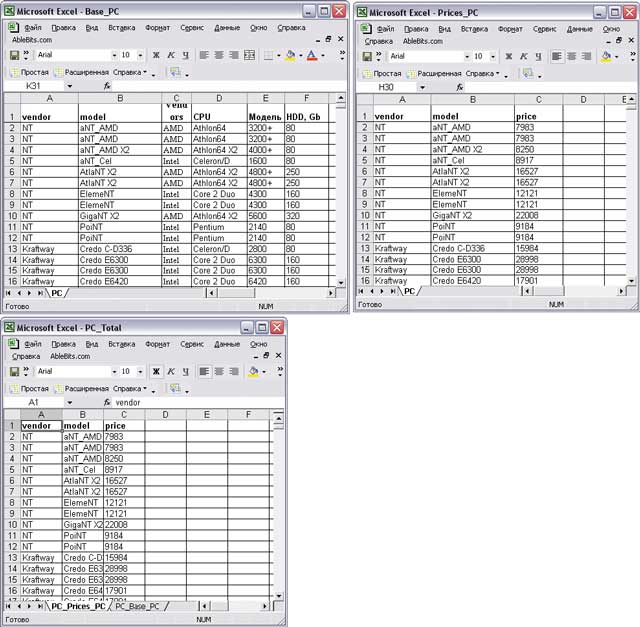
Рис. 15. Результат копирования листов из двух файлов в новую рабочую книгу
в Advanced Consolidation Manager (вверху — исходные таблицы, внизу — итоговая)
Плагин Merge Tables Wizard работает не с листами, а с указанными на них данными и позволяет объединять данные из нескольких файлов в одном листе (рис. 16 и 17). Технически это будет чуть медленнее, поскольку данные придется выделять, но зато появляется возможность брать не все листы полностью, а только нужную информацию с них. Помимо обычного объединения информации из нескольких таблиц, этот плагин может быть применен для сравнения однотипных данных и их обновления в рабочей таблице на основе информации базовой таблицы.
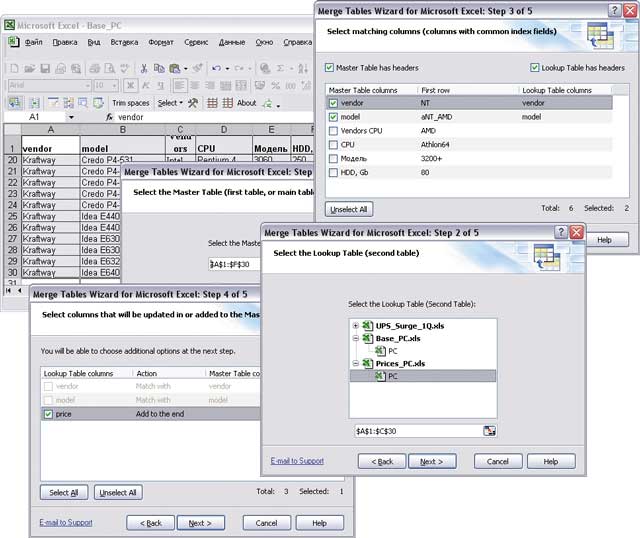
Рис. 16. Добавление в первую таблицу столбца из второй таблицы в Merge Tables Wizard
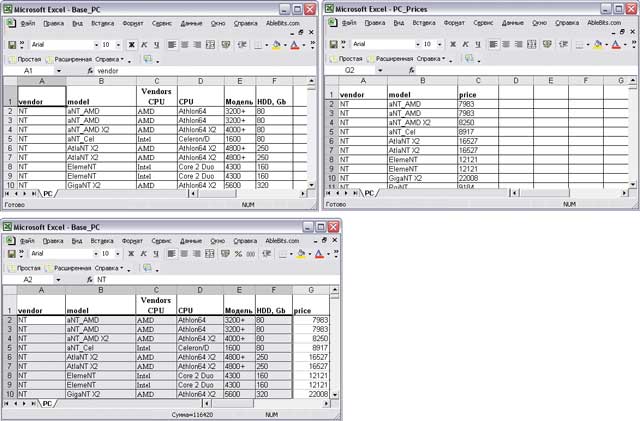
Рис. 17. Результат добавления в первую таблицу столбца из второй таблицы в Merge Tables Wizard
(вверху — исходные таблицы, внизу — итоговая)
Плагин Tables Transformer for Excel может объединить данные из двух таблиц в одну (рис. 18) с группировкой по наименованию конкретного поля. При этом он позволяет включать в общую таблицу не все столбцы из объединяемых таблиц, а только требуемые.
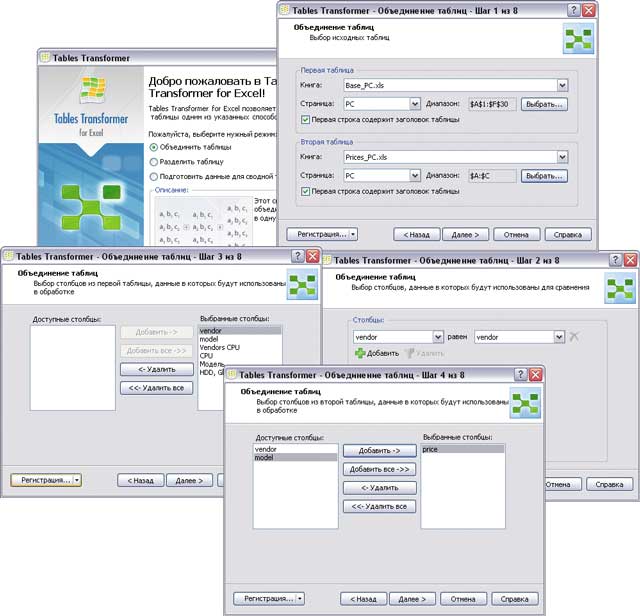
Рис. 18. Слияние двух таблиц с помощью Tables Transformer for Excel
Объединение данных из нескольких ячеек
Встроенными возможностями Excel невозможно слить ячейки, не потеряв данные в них, поскольку в полученной после слияния обобщенной ячейке помещаются данные из самой левой ячейки в выделенной группе. Поэтому в таких ситуациях, а они возникают достаточно часто (примером может служить получение полных данных о клиентах, продукции и т.п. — изначально при вводе подобная информация обычно разбита по разным столбцам), приходится копировать данные вручную, что утомительно, а при большом количестве данных еще и потребует немалых затрат времени.
В таких ситуациях на помощь придут плагины ASAP Utilities, PLEX и Merge Cells Wizard (http://www.ablebits.com/files/submit/merge-cells-wizard.zip; 2,04 Мбайт; 29,95 долл.). С их помощью подобное слияние может быть осуществлено одним кликом мыши (рис. 19).
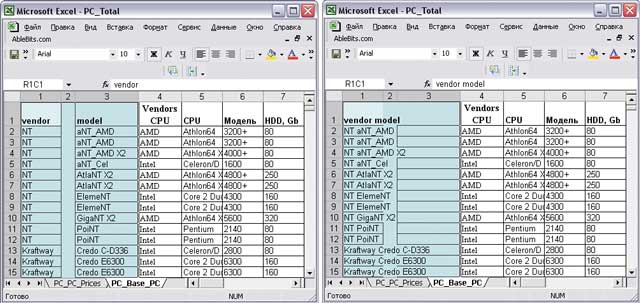
Рис. 19. Результат слияния ячеек в Merge Cells Wizard (
слева — исходная таблица, справа — итоговая)
Разделение данных по таблицам
Если вам часто приходится формировать на базе одной таблицы несколько новых, включая в них некоторую информацию из исходной таблицы, то стоит обратить внимание на упоминавшиеся плагины Advanced Consolidation Manager, Tables Transformer for Excel и ASAP Utilities.
Advanced Consolidation Manager окажется полезным для копирования данных в разные файлы с группировкой по страницам (рис. 20) — то есть первые листы с данными из указанных файлов будут объединены в первой книге, вторые — во второй и т.д.
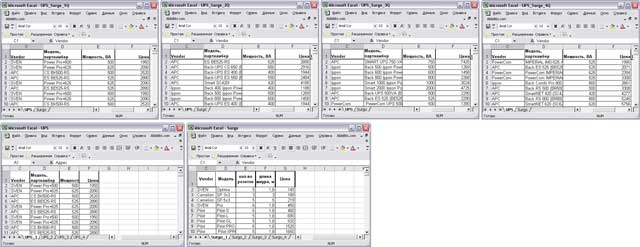
Рис. 20. Результат копирования листов из четырех файлов в два с группировкой
по страницам в Advanced Consolidation Manager
(вверху — исходные таблицы, внизу — итоговые)
Плагин Tables Transformer for Excel поможет быстро разделить одну таблицу на несколько новых. В каждой новой таблице названия столбцов исходной таблицы продублируются, а сами таблицы окажутся размещенными в новой либо рабочей книге (на текущем или новом листе). Предусмотрены два принципа проведения подобного разбиения. Во-первых, исходная таблица разбивается с учетом указанного количества строк — тогда в каждой новой таблице окажется соответствующее число строк и браться они будут последовательно из исходной таблицы. Это может пригодиться, например, для получения на базе одного годового отчета по продажам с данными за каждый месяц четырех квартальных отчетов.
Разбиение также может быть осуществлено на базе уникальных значений ячеек в выбранном столбце. Данная возможность окажется полезной для получения отдельных таблиц с данными по соответствующим уникальным значениям, например по конкретным производителям (рис. 21), наименованиям продукции и т.п.
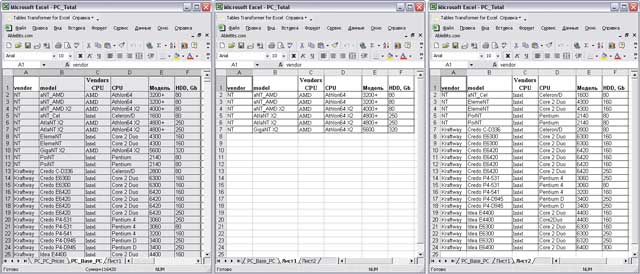
Рис. 21. Результат разделения таблицы по производителю
(столбец Vendors CPU) в Tables Transformer for Excel (первая таблица —
исходная, вторая и третья?— итоговые)
Плагин ASAP Utilities можно применить для формирования новых Excel-документов на основе листов рабочей книги, когда каждый из листов исходной книги помещается в отдельный файл (рис. 22).
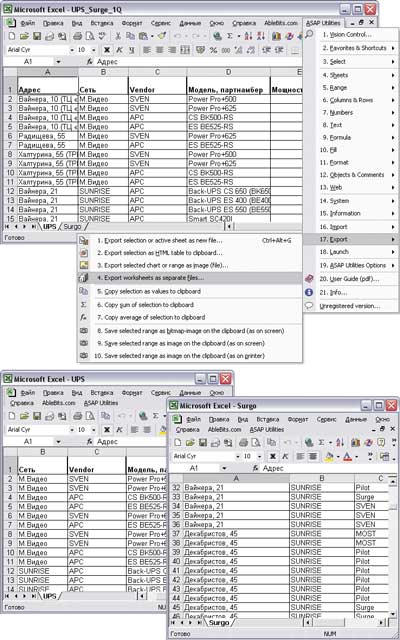
Рис. 22. Экспорт листов в отдельные файлы
с помощью ASAP Utilities (вверху — процесс экспорта,
внизу — итоговые файлы)
Сравнение файлов с данными
При работе в Excel сравнивать различные модификации файлов (например, обновленные версии прайс-листов, получаемых от партнеров ежемесячно) приходится сплошь и рядом. Причем речь идет не о том, как выяснить, какая версия файла является более свежей (это и так понятно из свойств файла), а о том, что именно изменилось с точки зрения содержимого.
Детальное сравнение всех позиций таблицы при поиске удаленных, добавленных и измененных ячеек вручную крайне трудоемко, а если таблица большая (что на практике чаще всего и наблюдается) — вообще нереально. Гораздо разумнее для проведения подобных операций прибегнуть к помощи специализированных решений Excel Compare (http://www.formulasoft.com/download/ExcelCompare.exe; 1,17 Мбайт; 290 руб.) и Compare Spreadsheets for Excel (http://www.mapilab.com/files/compare_spreadsheets.zip; 8,7 Мбайт; 1600 руб.), которые позволят решать подобные задачи автоматически.
Оба решения умеют сравнивать диапазоны ячеек из выбранных листов указанных книг и формируют отчеты различий (рис. 23 и 24), отображающие изменения, — в данных отчетах добавленные, удаленные и измененные ячейки подсвечиваются либо выделяются. При этом в отчете Excel Compare отображаются лишь соответствующие строки, в которых такие изменения были найдены, а в отчете Compare Spreadsheets for Excel данные строки показываются вместе со всей прочей имеющейся в таблицах информацией.
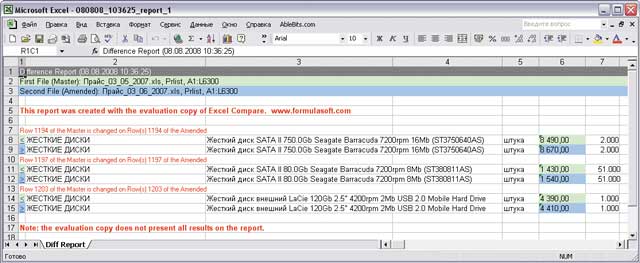
Рис. 23. Отчет различий, полученный при сравнении
двух версий прайс-листа с помощью Excel Compare
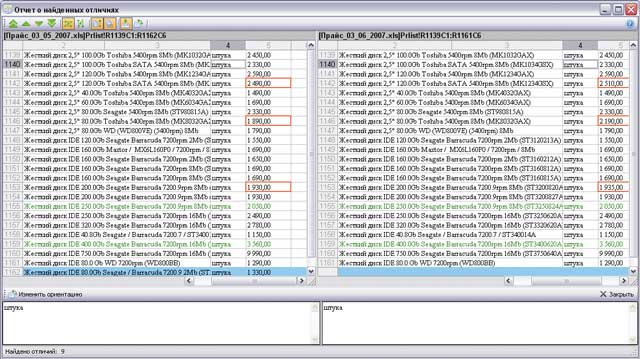
Рис. 24. Результат сравнения двух версий прайс-листа в Compare Spreadsheets for Excel
Утилита Excel Compare умеет сравнивать все одноименные рабочие листы двух файлов, все файлы, которые расположены в двух выбранных папках, либо все файлы на листах созданного в среде данной утилиты проекта. Возможности плагина Compare Spreadsheets for Excel ограничены сравнением лишь двух листов двух выбранных книг, но зато при сравнении он может учитывать формат ячеек.
Выявление записей-дубликатов
В Excel не предусмотрено каких-либо специальных функций для поиска записей-дубликатов, поэтому при возникновении подобной необходимости осуществлять их поиск приходится вручную. Как правило, вначале записи сортируются по интересующему столбцу (в результате записи-дубликаты окажутся расположенными последовательно), а затем вся таблица уже вручную просматривается на предмет выявления таких повторяющихся записей. Для упрощения и ускорения просмотра, на который в больших таблицах придется затратить немало времени, можно предварительно выделить повторяющиеся записи цветом, воспользовавшись операцией условного форматирования.
При больших объемах данных провести подобные операции вручную проблематично: затраты времени окажутся слишком велики и не исключена вероятность удаления нужных данных. Гораздо лучше воспользоваться подходящими плагинами, например Remove Duplicates from Excel (http://www.mapilab.com/files/remove_duplicates_excel.zip; 1,8 Мбайт; 1100 руб.) или Duplicate Remover (http://www.ablebits.com/files/duplicate-remover-excel-173.zip; 2,16 Мбайт; 29,95 долл.). Оба решения предназначены для поиска и обработки дубликатов в документах Excel и позволяют быстро и с минимальными усилиями найти все повторяющиеся элементы, а затем выделить их (рис. 25 и 26), изменив форматирование, либо сразу удалить. Дополнительно к этому плагин Remove Duplicates from Excel умеет скрывать повторяющиеся данные, а Duplicate Remover может скопировать или переместить такие записи в новую рабочую книгу либо на новый/существующий рабочий лист. Поиск через данные плагины можно проводить как с целью выявления полностью идентичных строк, так и для того, чтобы найти ячейки с повторяющимися данными в конкретных столбцах или строках.
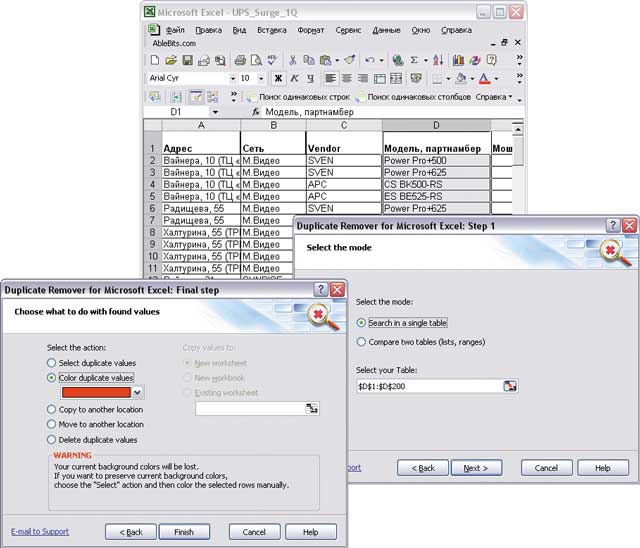
Рис. 25. Проведение поиска ячеек-дубликатов в столбце в Duplicate Remover
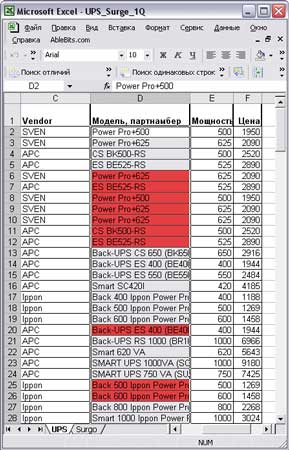
Рис. 26. Результат поиска ячеек-дубликатов
в столбце в Duplicate Remover
(дублирующиеся ячейки выделены цветом)
Если задача проще: нужно избавиться от дубликатов не на уровне таблицы, а, например, внутри фрагмента столбца, то есть выявить в диапазоне уникальные значения, — то тут возможны разные варианты решения проблемы. Можно создать по данному столбцу сводную таблицу, в которой автоматически окажутся отображенными только уникальные значения, либо воспользоваться уже упоминавшимся плагином PLEX, умеющим извлекать из указанного диапазона уникальные элементы (рис. 27).
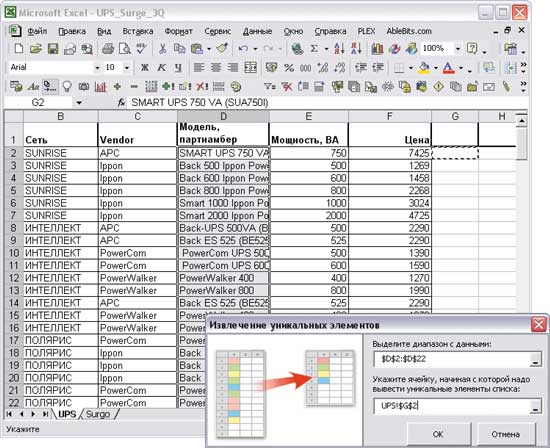
Рис. 27. Выявление уникальных элементов в указанном диапазоне с помощью PLEX
Работа со сводными таблицами
Управление
При настройке внешнего вида сводных таблиц приходится прибегать к самым разным операциям: неоднократно изменять ширину столбцов для лучшей видимости расположенных в них данных, менять числовой формат значений и др. Все это очень просто выполнить и обычным образом, но потребуется немало времени. Например, для того чтобы изменить форматы во всех полях со значениями, эти поля предварительно придется выделить и только затем из контекстного меню выбрать команду Формат ячеек и указать нужные параметры формата (например, изменить количество разрядов после запятой).
Можно ускорить выполнение некоторых подобных операций, установив бесплатный плагин Pivot Table Helper (http://www.ablebits.com/files/pivottable-helper-excel-11.zip; 1,04 Мбайт). После его инсталляции на панели инструментов появится ряд дополнительных кнопок (рис. 28), обеспечивающих быстрое выделение отдельных элементов сводной таблицы (либо всей таблицы целиком), определение числового формата ячеек, изменение ширины столбцов и строк для удобного просмотра находящихся в них данных, удаление ранее примененного варианта автоматического форматирования и т.д.
![]()
Рис. 28. Панель Pivot Table Helper
Можно воспользоваться более широкими возможностями платного плагина Pivot Table Assistant (http://www.vertex42.com/ExcelLinks/link_in_frame.php?action=next&link=285; 29,95 долл.). При инсталляции он внедряет в Excel дополнительную панель (рис. 29), кнопки которой позволяют выполнять одним кликом мыши немало разнообразных операций. Например, быстро изменять форматы столбцов с данными (делая данные целыми, устанавливая в них один или два знака после запятой, назначая им процентный формат и т.д.), изменять размеры столбцов и закреплять строки и столбцы заголовков для упрощения просмотра. А также обновлять данные сводной таблицы, задавать заголовки и назначать область печати сводной таблицы, создавать рамки по правому и нижнему краям каждой печатной страницы сводной таблицы для того, чтобы с распечаткой было удобнее работать.
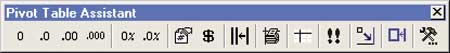
Рис. 29. Панель Pivot Table Assistant
Автоматическое форматирование
В Excel предусмотрено автоматическое форматирование сводных таблиц (команда Формат -> Автоформат), однако выбор предустановленных шаблонов невелик. Поэтому чаще всего приходится прибегать к форматированию сводных таблиц вручную, но при их перестройке (например, при добавлении или удалении полей) часть сделанных настроек форматирования может теряться — в итоге приходится затрачивать дополнительное время на повторное форматирование. Еще более актуально то, что каждую новую сводную таблицу вновь нужно форматировать, поскольку запомнить сделанные настройки форматирования в виде шаблона в Excel невозможно — такой функциональности там просто нет.
Поэтому при активном использовании сводных таблиц полезно установить плагин AutoFormat for PivotTables (http://www.ablebits.com/files/autoformat-excel-pivottables-20.zip; 3,65 Мбайт; 29,95 долл.). В его поставку входит набор предустановленных и весьма привлекательных шаблонов, список которых может быть расширен путем скачивания дополнительных шаблонов с сайта программы либо за счет разработки пользовательских шаблонов. Последнее как раз и представляется самым интересным, поскольку после разработки нужных в работе шаблонов форматирование вновь создаваемых таблиц уже не будет отнимать столько времени — для его проведения достаточно будет просто выбрать нужный шаблон из списка и щелкнуть по кнопке Apple(рис. 30). Количество создаваемых пользовательских шаблонов неограничено, и для удобства работы шаблоны можно объединять в группы. Поддерживается импорт и экспорт пользовательских шаблонов, что позволяет восстанавливать их после переустановки системы и переносить между компьютерами.
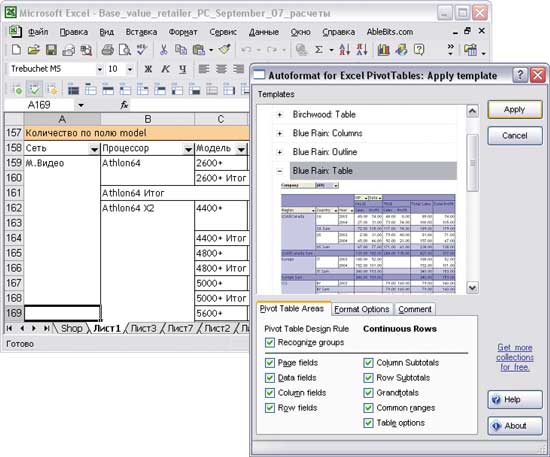
Рис. 30. Проведение автоформатирования сводной таблицы
с помощью AutoFormat for PivotTables
Создание графиков и диаграмм
Если создаваемые в Excel графики и диаграммы вам кажутся недостаточно эффектными и выразительными, то стоит обратить внимание на решение PowerPlugs:Charts (ftp://ftp.crystalgraphics.com/cgi_powerplugs/chartsdemo.exe; 17,6 Мбайт; 99 долл.). С его помощью можно создавать впечатляющие двух- и трехмерные графики и диаграммы непосредственно в Excel, при этом возможность формирования диаграмм традиционно, то есть через Microsoft Graphs, останется доступной.
В PowerPlugs:Charts свыше ста встроенных шаблонов двух- и трехмерных графиков, разбитых на девять категорий (Area, Bar, Bubble, Column, Histograms, Lines, Pies, Scatter и Surface). Данный список шаблонов можно пополнить за счет пользовательских шаблонов, разработка которых окажется полезной для автоматизации процесса подготовки серий диаграмм в едином стиле оформления. Сделать верный выбор при таком разнообразии шаблонов непросто — помочь в этом может инструмент Data Analyzer, который проанализирует конкретный набор данных и выдаст заключение о том, какие типы диаграмм в этом случае предпочтительны. Создание (рис. 31) и редактирование диаграмм реализовано просто и удобно благодаря широкому набору мощных средств редактирования, возможности полного контроля над отображением и предварительному просмотру результата после изменения любых параметров. При редактировании, помимо настройки базовых параметров (изменения размеров, включения/выключения отображения разнообразных данных, изменения цветов и особенностей форматирования текста и т.п.), предоставляется ряд дополнительных возможностей, позволяющих добиваться очень интересных результатов. Например, можно менять степень прозрачности объектов, добавлять обводки, настраиваемые градиентные и текстурные заливки, совмещать разные типы графиков в комбинированные диаграммы, имитировать трехмерное представление диаграмм и т.д.
КомпьютерПресс 9’2008
This is the second version for PK’s Utility Tool. This is absolute free to cost. In this Utility Tool, we have carried forward all the features form PK’ Utility Tool V1.0
Click here to know more about features of PK’ Utility Tool V1.0-
PK’s Utility Tool 3.0 is available now
Click here to download PK’s Utility Tool V1.0
Click here to download PK’s Utility Tool V2.0
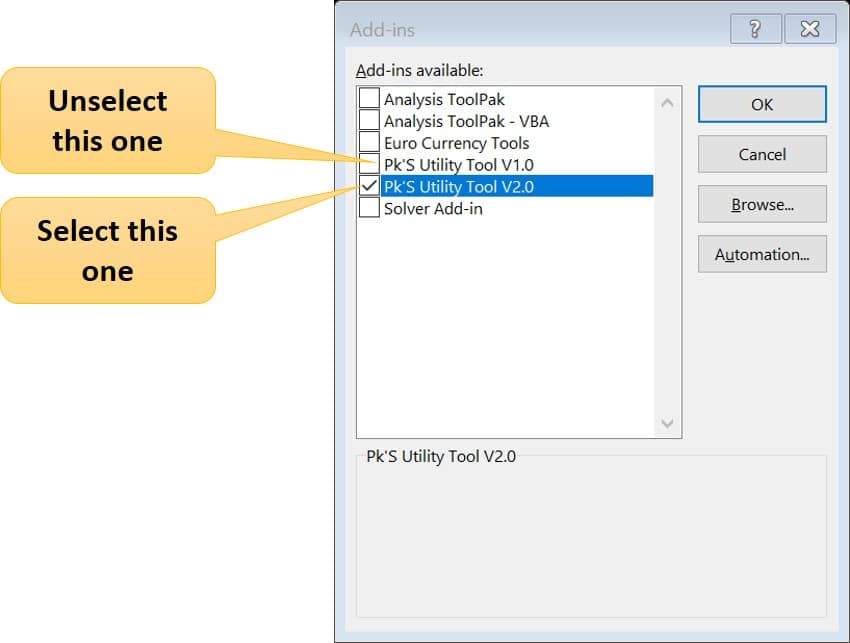
Click here to learn how to install an add-in in Excel. If you are installing PK’s Utility V2.0 then you should remove PK’s Utility Tool 1.0 because version 2.0 has all the feature and functions.
Features are in red rectangles are new in this version, rest we have carried forward all the features form PK’ Utility Tool V1.0 –

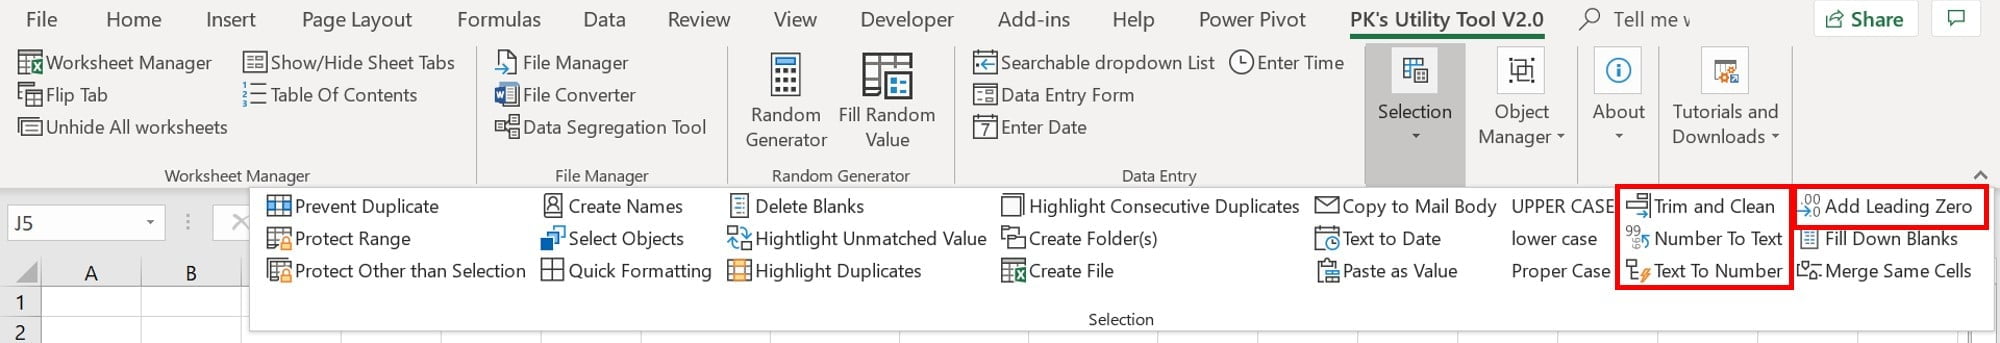
Worksheet Manger Group:
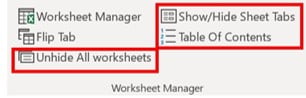
In the worksheet Manager group, we have added 3 new features:
- Unhide All worksheets: Using this feature you can hide all the worksheets from active workbook on one click.
- Show/Hide Sheet Tab: Using this feature you can show or hide sheet tabs in active workbook. On first click it will hide sheet tabs. Click again to show the sheet tabs.
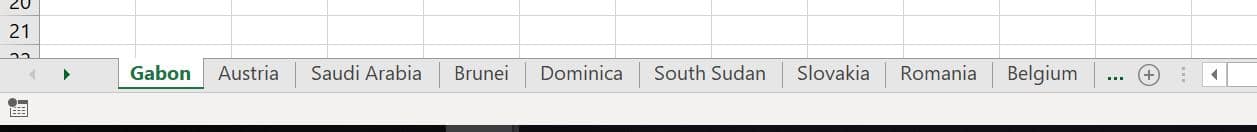
Click on Show/Hide Sheet Tab to hide the sheet tabs
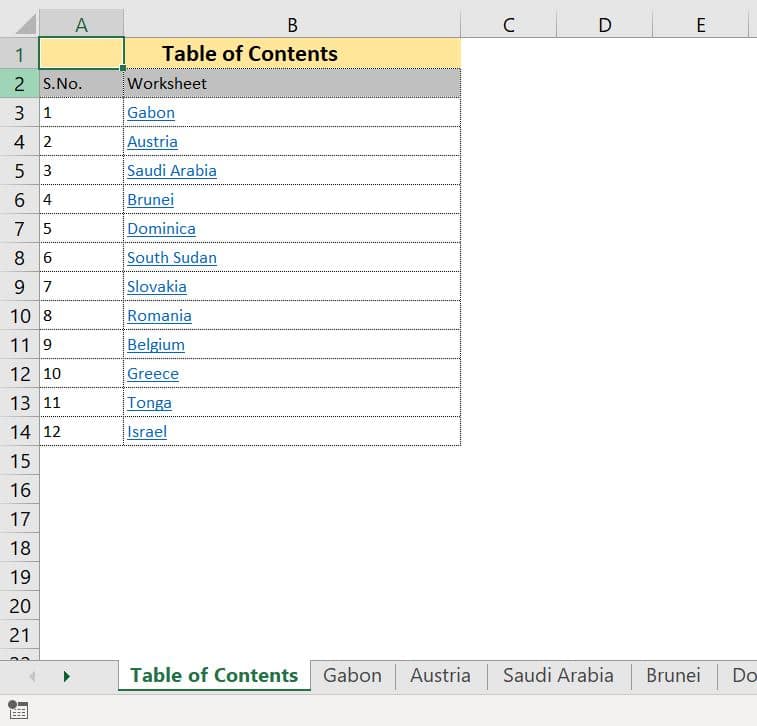
- Table of Contents: To create a new worksheet in your active workbook with a table of worksheets, you can click on this button. It will keep the hyperlink for the respective worksheets.
File Manger Group:
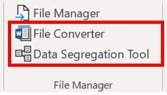
In this Group, we have 2 new features-
File Converter:
To convert your files in another format you can use this feature:
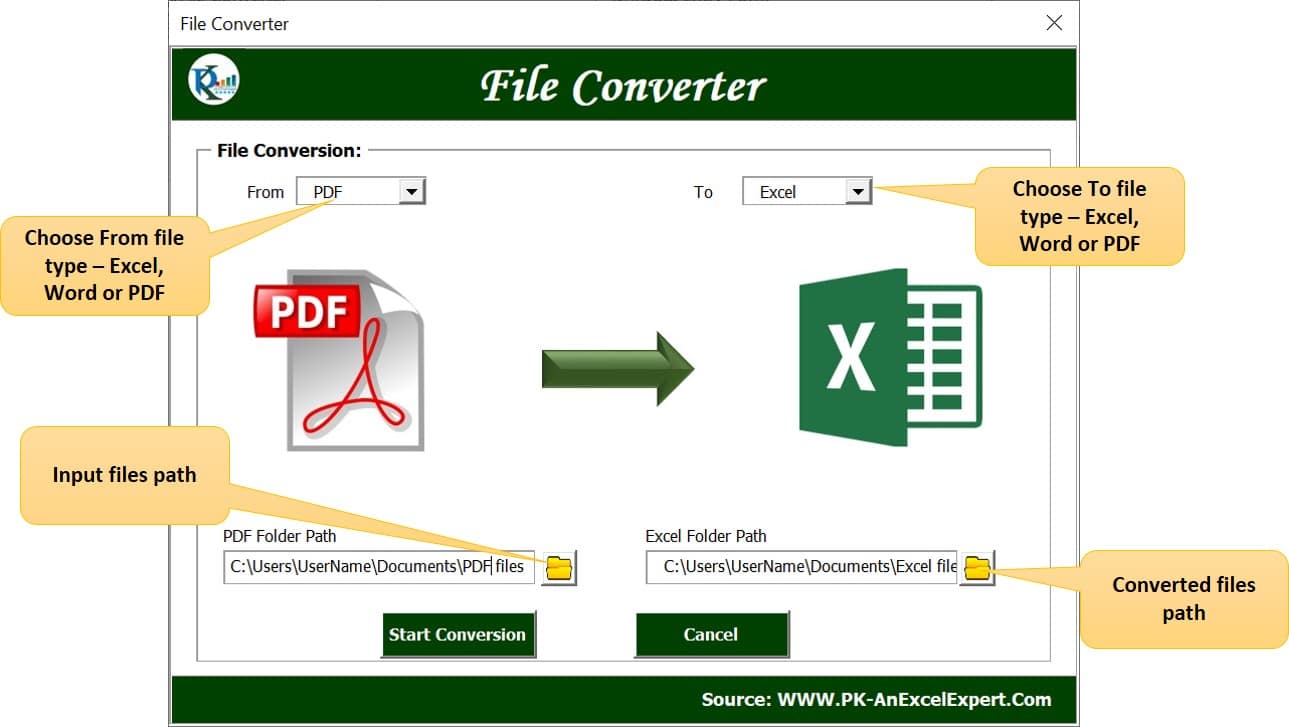
Using the file converter tool, you can convert the files as given below-
- Excel to Word: Office 2007 or above version is required.
- Excel to PDF: Office 2010 or above version is required.
- Word to Excel: Office 2007 or above version is required.
- Word to PDF: Office 2010 or above version is required.
- PDF to Excel: Office 2013 or above version is required. Tool will open the PDF file with MS word first then copy the data from word and will paste in to Excel. While opening the PDF with Word, it may ask below given confirmation. Please check the check box and click on OK.
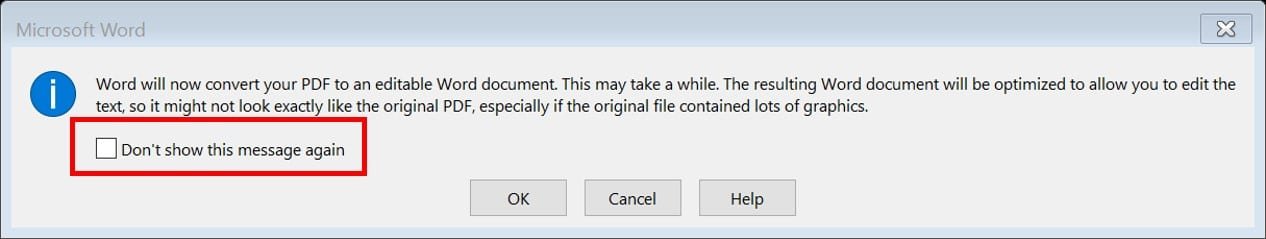
- PDF to Word: Office 2013 or above version is required. During this process, it may ask below given confirmation. Please check the check box and click on OK.
Data Segregation Tool:
Data Segregation Tool is useful to segregate the data into multiple excel files or multiple worksheets. It can save the data into different Excel files or you can keep them opened also.
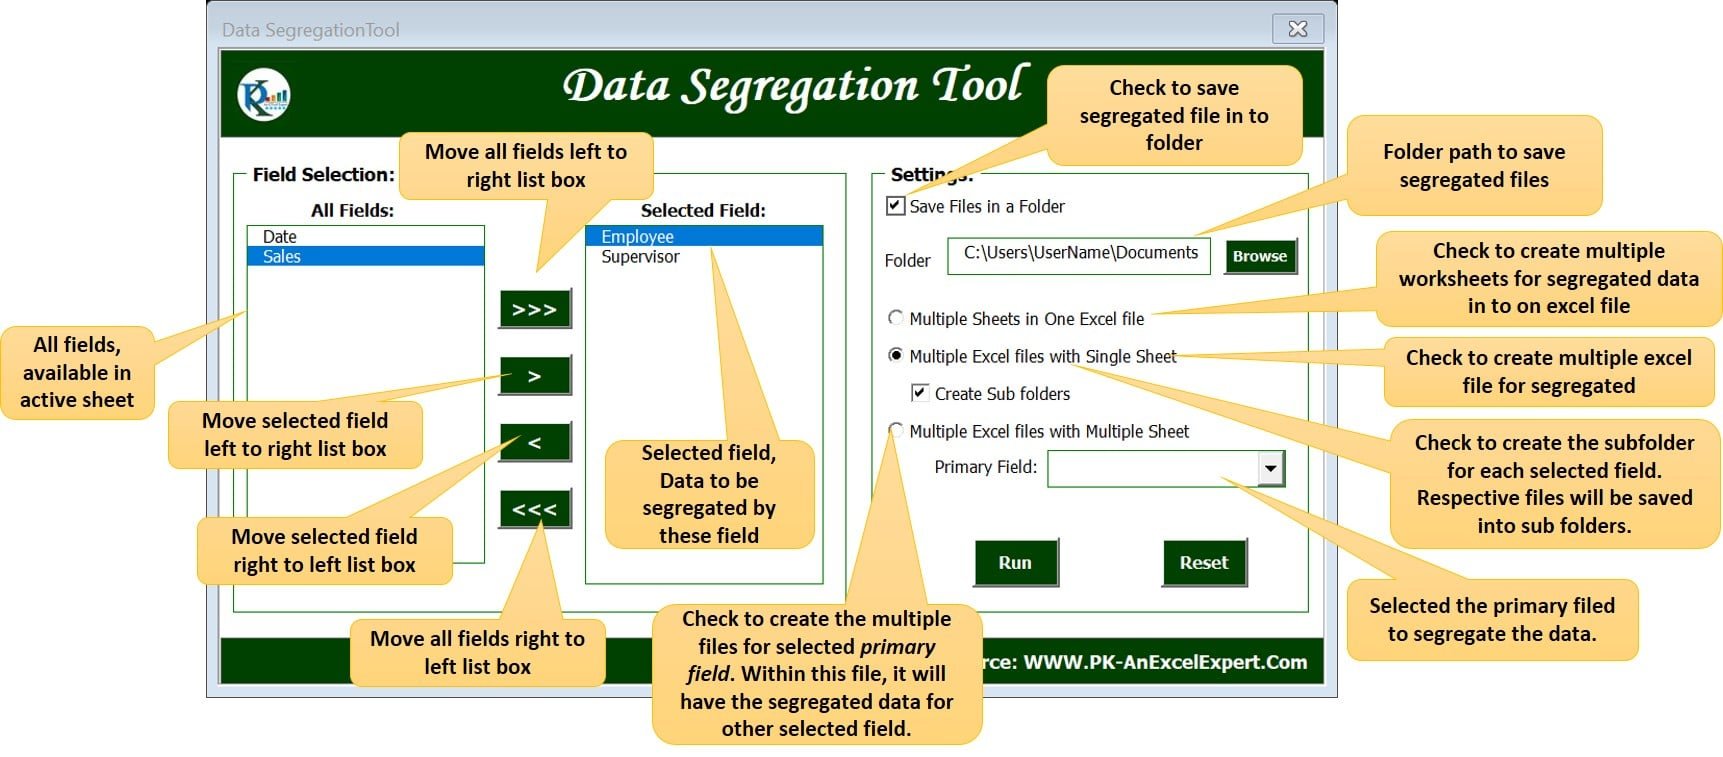
Learn how to create Data Segregation Tool step by step-
Random Generator Group:
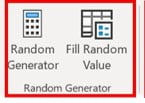
This is the new group in this version. In this group we have 2 features-
Random Generator:
Random Generator is useful to randomly generate numbers or text. You can generate below given random types in selected range-
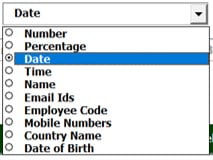
Below is the snapshot of Random Generator. You can change the minimum and maximum range –
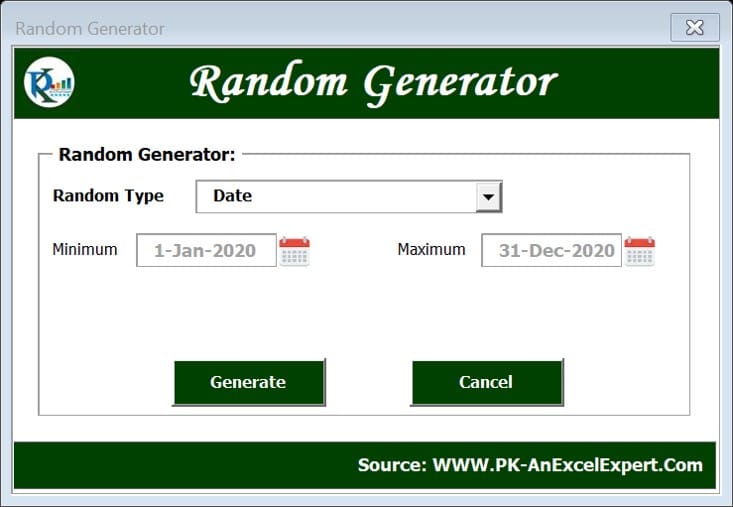
Fill Random Values:
This is feature has been carried forward form PK’s Utility Tool V1.0. Earlier it was in Selection group. Using this feature, you can fill the random values from Excel sheet, or you can used comma separated list. Given list will be distributed randomly in the selected range.
Date Entry Group:
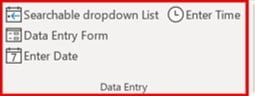
This is also a new group. It was not available in PK’s Utility Tool V1.0. In this group we have given 4 different features-
Searchable Drop-down List:
If you can a data validation list in excel cells and in there is a long list in drop-down of data validation list, then it is very useful.
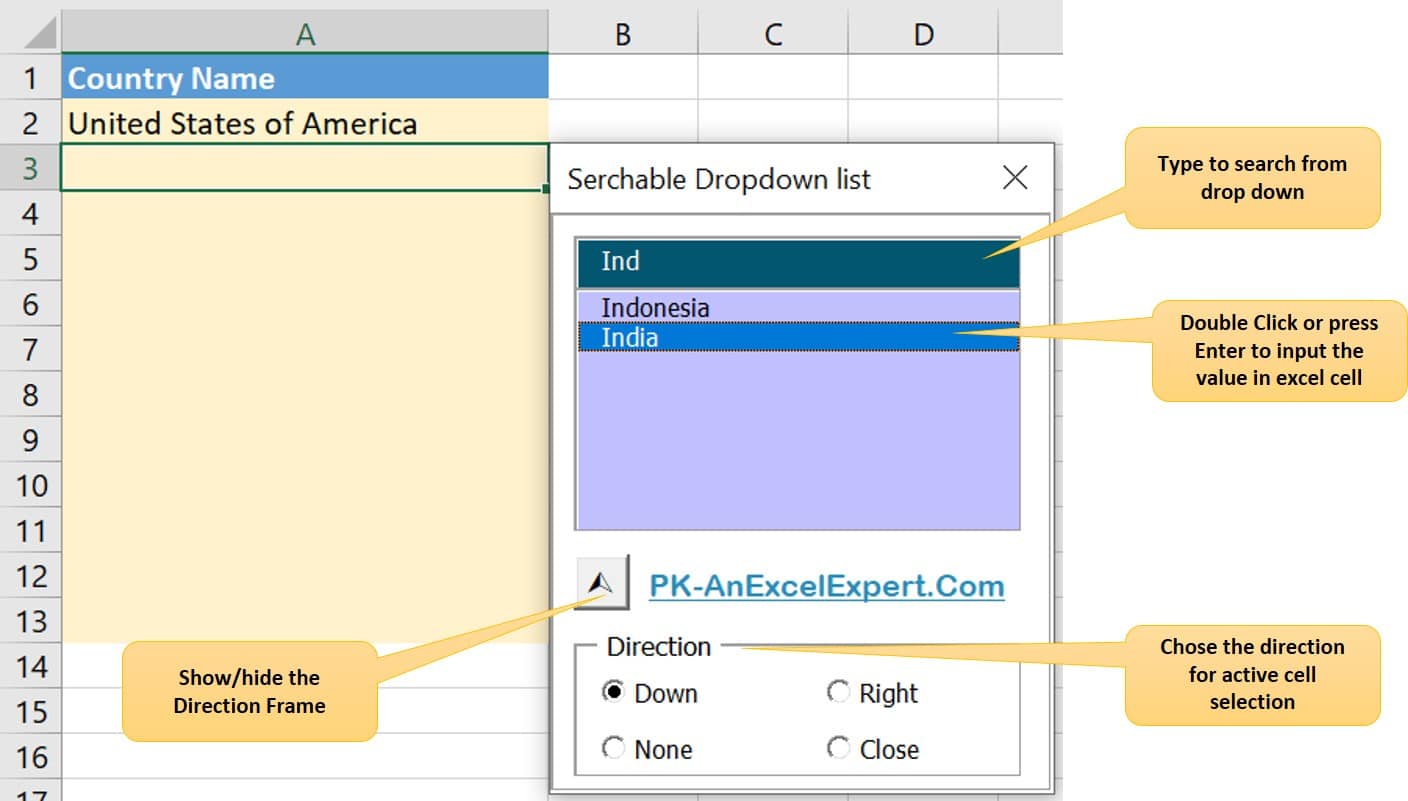
Learn how to make searchable drop-down list in Excel using VBA
Date Entry Form:
It will not the data entry form. You can use it for data entry in the table available on Excel sheet.
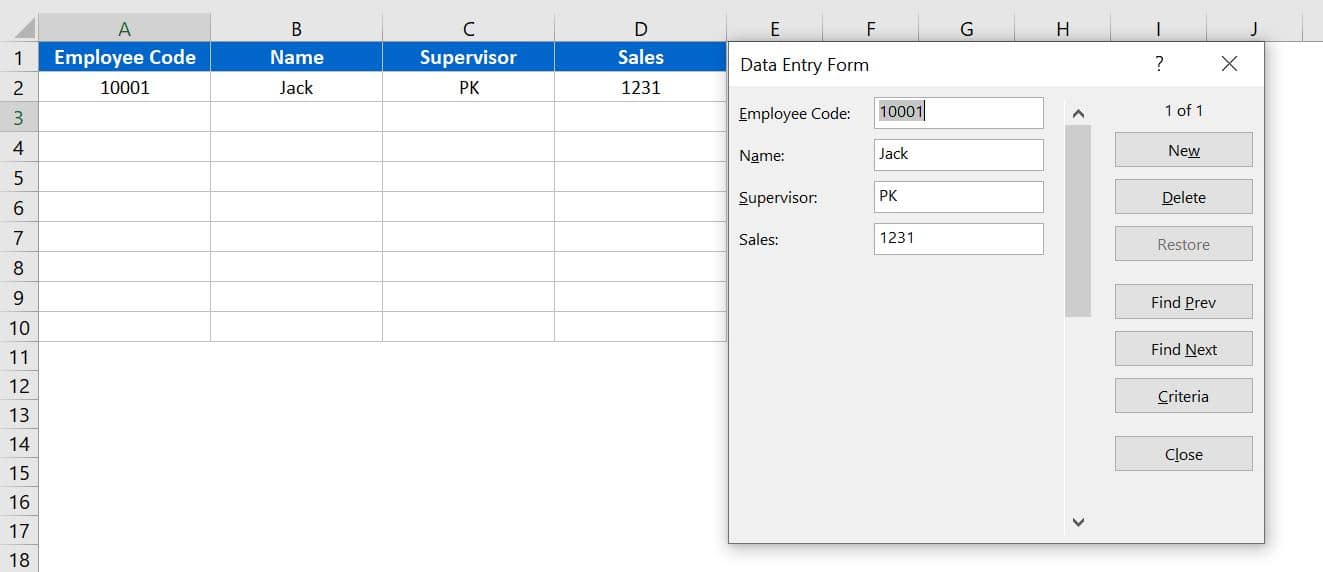
Learn how to use Data Entry form in Excel without VBA-
Enter Date:
You can enter the date in selected range using Calendar.
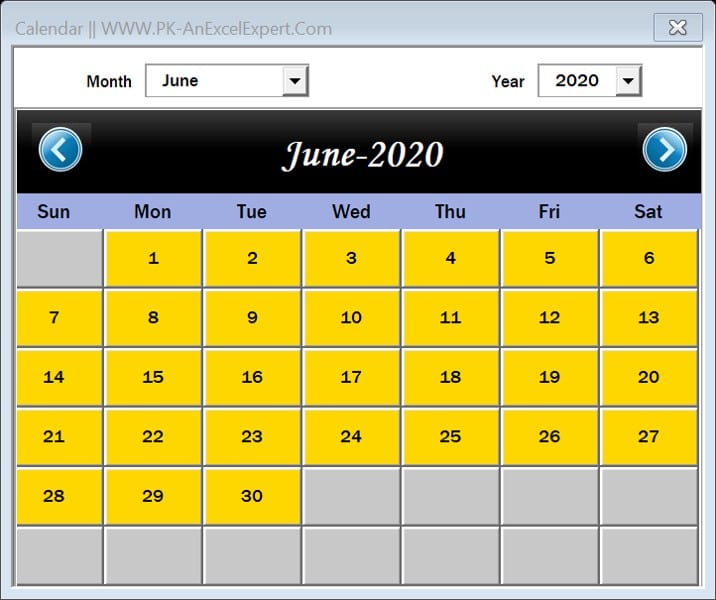
Learn how to create the calendar control in Excel VBA-
Enter Time:
You can enter the time in selected range using Time Picker.
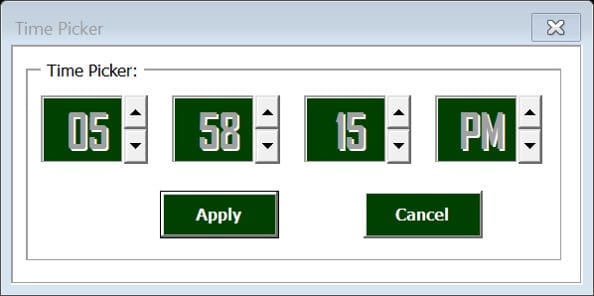
Selection Group:
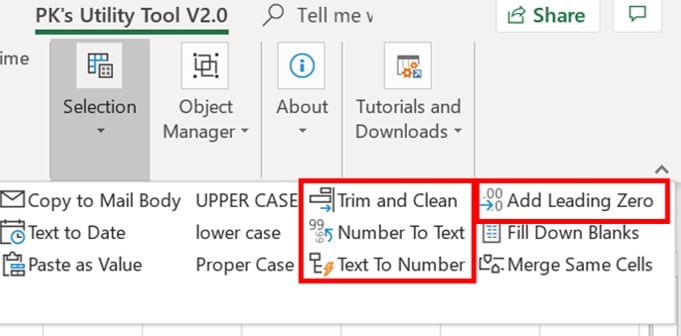
In the selection group, we have added 4 new features-
Trim and Clean:
It will remove the leading and trailing zeros form selected range.
Number to Text:
You can convert selected numbers in text format.
Text to Number:
If your numbers are in text format, then you can convert them into number format.
Add Leading Zero:
You can add leading zero in the selected range. You the below given form you can choose number of leading zeros or you can choose what should be the length of your number after adding leading zero. It will add the leading zeros accordingly.
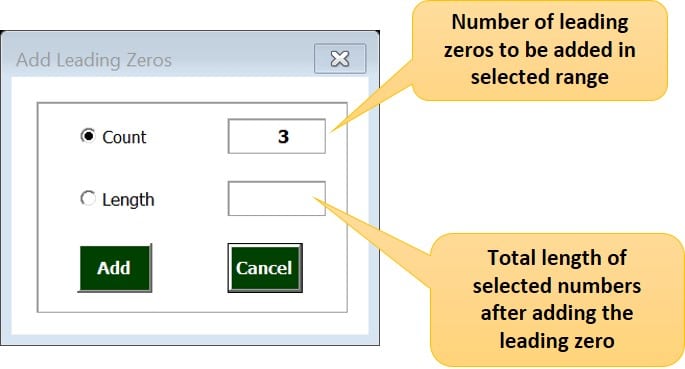
Tutorials and Downloads Group:
In this group, we have the hyperlink of our website from where you can learn and downloads –
- Dashboards
- Charts and Visualizations
- Templates and Tools
Functions:
We have added 4 new functions. Earlier it has 17 function, which was taken from PK’s Function Kit.
Watch this video to learn about more function in PK’s Function Kit.
In excel sheet, you can type “=PK” then you will the get the list of functions-
In the below given table first 4 functions are added in this version, rest 17 function have been carried forward from PK’s Utility Tool V1.0
| S.No | Function Name | Syntax | Result |
|---|---|---|---|
| 1 | PK_Get_Comments | Input_Cell | This formula will return the comments text form the input cell. |
| 2 | PK_Get_Emails | Input_text | This formula will fetch the email ids from the long text. If there are multiple email ids are available in the long text then it will return semi colon separated email ids. |
| 3 | PK_Get_Distance | Start_Latitude,Start_Longitude,End_Latitude,End_Longitude | This formula will return the distance between two places in Kilometers (Km) on the basis of latitude and longitude of Start Point and End Point. |
| 4 | PK_Specific_Char_Count | Complete_Text,Search_Text,Match_Case | This formula will return the count of specific character count. Third argument is options. If you want the case sensitive search then put third argument as True |
| 5 | PK_Unique_Count | criteria_Range | This formula will return the unique values count from given criteria range. Criteria Range should not have more than 100000 rows. |
| 6 | PK_Duplicate_Count | criteria_Range | This formula will return the duplicate values count from given criteria range. Criteria Range should not have more than 100000 rows. |
| 7 | PK_Vlookup_By_Cell_background_Color | Lookup_Cell As Range, Table_Array As Range, Col_Num As Integer, Get_last_Value As Boolean | This formula will return the value from Table array range on the base of lookup cell background color. Col_index_number to be given as number of the column in table array from which it will return the value. Get_last_Value is Boolean, if there are duplicate colors in table array then for 0 it will return the first value from table array and for 1 it will return the last value from table array. Note: This formula will not refreshed automatically when color is changed in table array, need to press F9. This will not work with conditional formatting colors. Table Array range should not have more than 100000 rows. |
| 8 | PK_Vlookup_By_Partial_Lookup_Value | lookup_value As Variant, Table_Array As Range, col_index_num As Integer, range_lookup As Boolean | This formula will work just like VLOOKUP. First it will check the complete lookup value and will return the result. If complete lookup value is not available in table array then it will check if lookup value is available partially then it will return the value. |
| 9 | PK_Count_By_Cell_background_Color | criteria_Range As Range, criteria_cell As Range | This formula will return the count on the base of criteria cells background color. Note: This formula will not refreshed automatically when cell background color is changed, need to press F9. This will not work with conditional formatting colors.criteria_Range should not have more than 100000 rows. |
| 10 | PK_Count_By_Case_Sensitive_Criteria | criteria_Range As Range, criteria As String | This formula will return the count on the base of criteria value. It will count only when case of criteria is matched in criteria range. For Example: if criteria is «ABC» then it will not count «abc» from criteria range. Note: criteria_Range should not have more than 100000 rows. |
| 11 | PK_Count_Font_Bold_Cells | criteria_Range | This formula will return the count on the base of criteria cells’s font is bold. Note: This formula will not refreshed automatically when font is made bold in criteria range, need to press F9. This will not work with conditional formatting font bold .criteria_Range should not have more than 100000 rows. |
| 12 | PK_Count_By_Partial_Value | criteria_Range As Range, criteria As String | This formula will return the count on the base of criteria value. It will also count when criteria is partially available in criteria range. For Example: if criteria is «ABC» then it will not count «abc» from criteria range. Note: criteria Range should not have more than 100000 rows. |
| 13 | PK_Text_Join | delimiter As String, ignore_empty As Boolean, text_range As Range | This formula will join the multiple strings given in text range separated by the given delimiter. Ignore_empty needs to be taken as true or false. Note: Text Range should not have more than 100000 rows. |
| 14 | PK_Extract_Numbers | Alphanumeric_Text | This formula will extract the numbers from Alphanumeric Text. It will return a string not a number |
| 15 | PK_Extract_Text | Alphanumeric_Text | This formula will extract the non numeric characters from Alphanumeric Text. It will return a string. |
| 16 | PK_Weighted_Average | Weight_Range,Average_range | This formula will return the weighted average for given Average range. Weight range and Average range should have the same number of rows. |
| 17 | PK_Sum_Of_Digits | Whole_Number | This formula will return the sum of digits of given number. |
| 18 | PK_First_Name | Complete_Name | This formula will return the first name from the given complete name. |
| 19 | PK_Middle_Name | Complete_Name | This formula will return the middle name from the given complete name. If middle name is not available then it will return blank. |
| 20 | PK_Last_Name | Complete_Name | This formula will return the last name from the given complete name. If last name is not available then it will return blank. |
| 21 | PK_Ordinal_Date_Format | Input_Date | This formula will return the ordinal date for given date like for 1/1/2018 it will change as 1st Jan, 2018. Note: It will return a string not a date. |
Click here to download PK’s Utility Tool V1.0
Click here to download PK’s Utility Tool V2.0
Watch the step by step demo video: