
Apply MATLAB analysis and visualization capabilities to Excel data
When it comes to data analysis and visualization, technical professionals who use Excel® often encounter functional limitations. MATLAB supplements the capabilities of Excel by providing access to pre-built mathematical and analysis functions, visualization tools, and the ability to automate your analysis workflows.
3 ways to use MATLAB and Excel together:
- Import Excel data into MATLAB
- Access MATLAB from Excel
- Package MATLAB code as Excel add-ins
Import Excel Data into MATLAB
The Import Tool makes it easy to bring data from an Excel spreadsheet into MATLAB. It shows the data both as it exists in Excel and how it will be represented in MATLAB, and recommends the best format for the data in MATLAB. Data import can be integrated into an automated analysis workflow in MATLAB, either by using code automatically generated by the Import Tool, or by calling MATLAB commands readtable and xlsread directly.
Excel data is naturally represented in MATLAB as a table, which organizes tabular data into columns of a single variable.
Access MATLAB from Excel
Spreadsheet Link™ connects Excel with the MATLAB workspace, enabling you to access the MATLAB environment from an Excel spreadsheet. You can exchange data between MATLAB and Excel, taking advantage of the familiar Excel interface while gaining access to MATLAB algorithms in image processing, data analytics, and control engineering.
Package MATLAB Code as Excel Add-ins
With MATLAB Compiler™, you can package math, graphics, and user interfaces created in MATLAB as Excel add-ins to perform analyses with Excel. These Excel add-ins can be distributed royalty-free to users who do not have MATLAB, and require no VBA programming.
With the addition of MATLAB Compiler SDK™, you can deploy add-ins to MATLAB Production Server™ for multiple Excel clients to access your MATLAB algorithms. This deployment ensures that users access the latest version of your analytics automatically with updates made to the algorithms deployed on the server.
Examples and How To
Software Reference
See also:
desktop and web deployment,
creating MATLAB apps,
data analysis,
data science
MATLAB provides options to write a table, array, or matrix to Microsoft Excel spreadsheets. The function available to do so is the writetable () function. The general syntax for this function is:
Syntax:
writetable(<data>, <filename>, <optional_values>)
Now, in the following sections, we shall see how to write a table, an array, and a matrix into a spreadsheet.
Writing a Table to Excel Spreadsheet:
Firstly, we shall create a table and then write the same to an excel spreadsheet with the help of writetable function.
Example 1:
Matlab
tab = magic(5);
tab = array2table(tab,"VariableNames",
["R1" "R2" "R3" "R4" "R5"]);
disp(tab)
writetable(tab,'new.xls','FileType','spreadsheet')
The output of the above code will create a new excel sheet in the current folder.
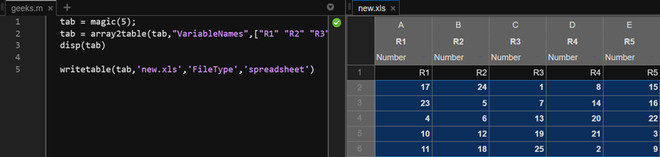
In the above code, we create a table from magic with the variable names or table headers passed as a vector. Then, in the writetable function, we pass the table, and the file name to be used (if present then, it’ll overwrite the data. If not, then it will create a new file and then, it’ll create a new file). The next argument is a field type that decides the file type and the argument following it is the value for the same field; spreadsheet in this case.
Writing a Matrix to Excel Spreadsheet
In the above section, we discussed how to add a table to an excel sheet. In this section, we shall explore the writetable further by adding a matrix at specified cells in a spreadsheet. Let us see the same with the help of an example.
To write numeric data into an excel sheet, we need can use the writetable function. We have to use another function, the writematrix function.
writematrix(<data>, <filename>, <optional_values>)
The syntax is the same as the writetable just the datatype changes to double, float, or int.
Example 2:
Matlab
tab = magic(5);
writematrix(tab,'new.xls','Sheet',2,'Range','C1')
Output:
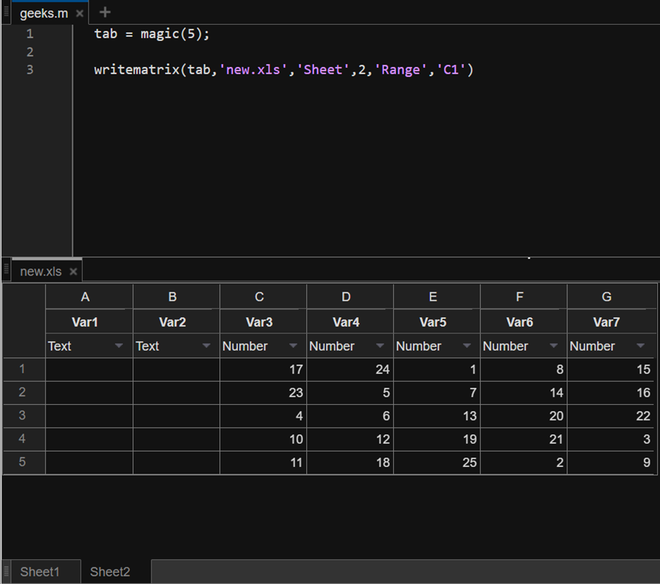
In this code, we write the magic square matrix to an excel spreadsheet named new.xls. The following arguments define the sheet number and the starting cell where we want to write our matrix-formed data.
Writing a cell array (array of multiple data types) to an excel spreadsheet
To write an array with both numeric and text data, we use the writecell() function. The syntax of the same is similar to writematrix and writetable however, the data type then changes to a cell array.
writecell(<data>, <filename>, <optional_values>)
In the following example, we will write a cell array to a new sheet in our new.xls spreadsheet.
Example 3:
Matlab
arr = {'cell', 'array'; 1, 2; 23, 31};
writecell(arr,'new.xls','Sheet',3,'Range','C1:E2')
Output:
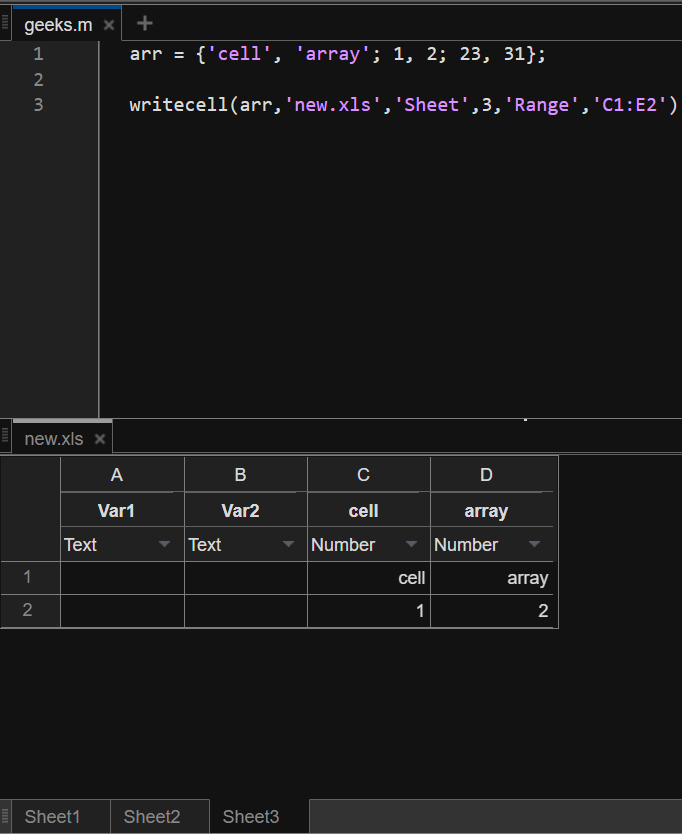
In this code, we are writing a 3×3 cell array to the spreadsheet in sheet 3 from a range of cells C1 to E2, this means that only as many elements as are specified in the range C1:E2.
![]()
ячейки ввода, определяются в строках Width и Height и раскрывающемся списке Units.
Ячейки вывода с окончательными результатами преобразовываются в текст выбором пункта Undefine Cells меню Notebook. Пользователь может переопределить стили шаблона m-book.dot так же, как и любого другого стиля, выбрав в меню Формат пункт Стили и форматирование и произведя нужные установки в появившемся диалоговом окне.
Квадратные скобки, ограничивающие ячейки и группы ячеек, пропадают при выборе пункта Hide Cell Markers меню Notebook. Пункт Show Cell Markers служит для отображения скобок в документе. При печати М- книги скобки не выводятся.
Чтение рабочего листа Excel в числовую матрицу Matlab
Создадим файл Excel с именем myExample.xlsx в рабочем каталоге Matlab. Для этого в окне Matlab выполним следующие команды
Лист с именем Лист1 в файле myExample.xlsx содержит следующие данные:
Прочтем числовые данные с первого рабочего листа Excel.
11

Чтение диапазона ячеек
Прочтем заданный диапазон ячеек из файла Excel определенного в предыдущем примере.
Чтение столбца
Прочтем второй столбец из файла Excel из первого примера.
Для получения лучшего результата рекомендуется в задаваемый диапазон включать номера строк, например, ‘B2:B4’.
Получение числовых, текстовых и необработанных данных
Примерполучениячисловых,текстовыхинеобработанных(комбинированных) данных из файла Excel, созданного в первом примере.
12

Вычисление функции на рабочем листе Excel
В Редакторе Matlab (Editor – New – Function) создадим функцию, оперирующую с данными, расположенными на рабочем листе Excel. Значениям, выходящим за пределы диапазона [0.2,0.8] будем присваивать значения 0.2 или 0.8. Функцию сохраним в файле SetMinMax.m в рабочем каталоге.
13

В Command Window добавим случайные данные к файлу myExample.xlsx.
Порезультатамвыполненияэтихкомандпоявляетсяинформационное предупреждение о том, что к заданному файлу произошло добавление нового рабочего листа и в этот лист занесены определенные нами данные.
Рабочий лист с именем MyData содержит величины в диапазоне от 0
до 1.
14

Introduction of xlsread Matlab
‘xls’ command is used in Matlab to import and export excel files into Matlab. We can create the excel files by using this command as well as we can read the excel files by using this commands. there are two operation in Matlab one is to create excel files and other is to read or open excel files. These commands are xlsread and xlswrite. Xlsread command is used to read or open the existing excel files in Matlab. Xlswrite command is used to write or create excel files in Matlab.by using xlswrite command we can also modify content of existing excel files. This command improves the adaptability of Matlab language by accessing data in other formats.
Syntax:
xlsread (filename)

xlsread (filename, parameters list)

xlsread (filename, [data])

xlsread (filename, sheet name)

xlsread (filename, range for columns or row)
How does xlsread Work in Matlab?
To read any excel file in Matlab first we need to create that file with some data in to it. There are various ways to write and read the excel files. These files can be written by sing parameter list, direct data, by giving sheet name, or by giving a range of the columns or rows.
Steps to read excel file in Matlab –
- Clear workspace
- Declare and assign data
- Write into excel file by using ‘xlsread’ syntax( xlswrite (filename,[data])
- Declare variable to read a file
- Use xlsread read command by using syntax. ( xlsread (filename ) ).
Examples of xlsread Matlab
Following are the examples are given below:
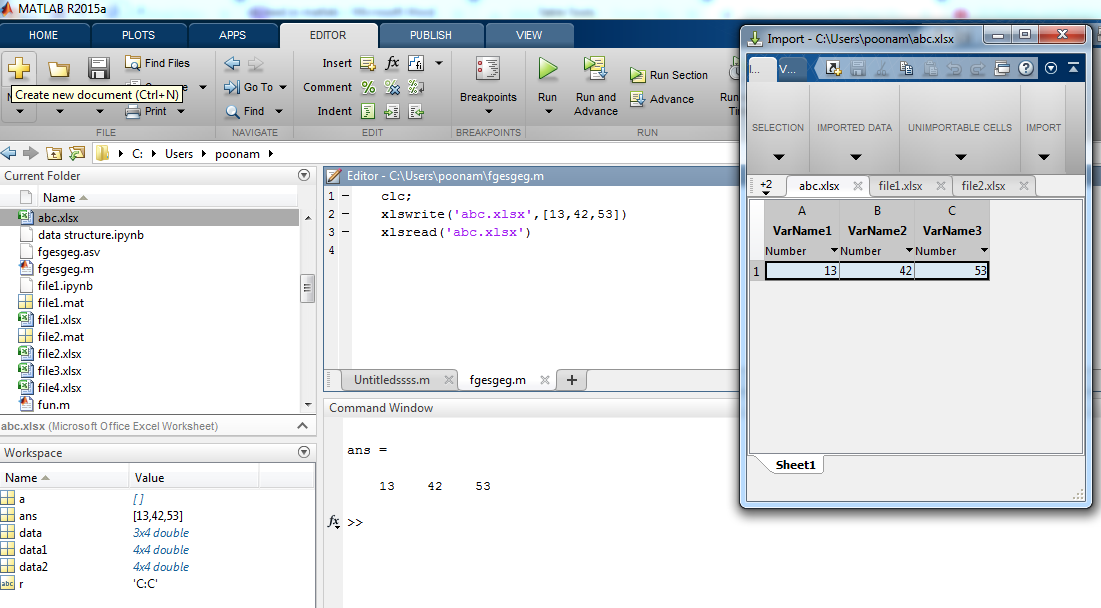
Example #1
In this example, excel file is ‘abc.xlsx’ and data added to the file is [ 13 ,42, 53 ]. So it create one excel file in current directory.
| Matlab Editor | Command window |
| Clc ;
xlswrite(‘abc.xlsx ‘,[13, 42, 53]) xlsread (‘ abc.xlsx ‘) |
ans =
13 42 53 |
Output:
Example #2
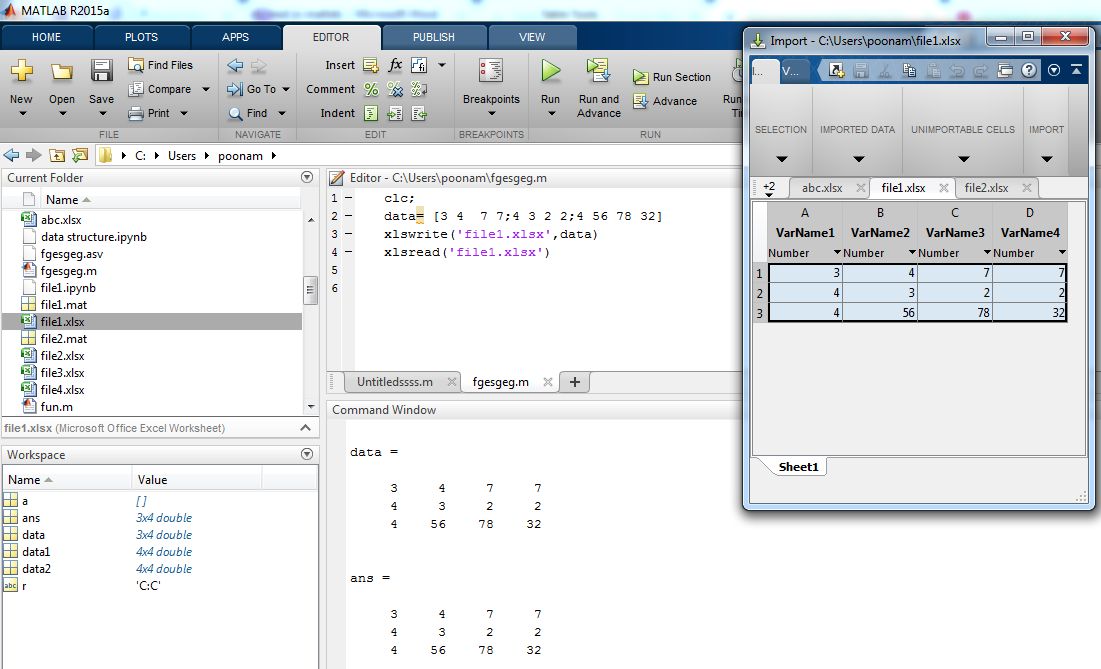
In this example input data is declared by using another variable, which is ‘data’ (data= [3 4 7 7;4 3 2 2;4 56 78 32]) . Data is written in ‘file1’.
| Matlab Editor | Command Window |
| Clc ;
Data = [3 4 7 7 ; 4 3 2 2 ; 4 56 78 32] xlswrite(‘ file1.xlsx ‘, data) xlsread (‘ file1.xlsx ’) |
data =
3 4 7 7 4 3 2 2 4 56 78 32 ans = 3 4 7 7 4 3 2 2 4 56 78 32 |
Output:
Example #3
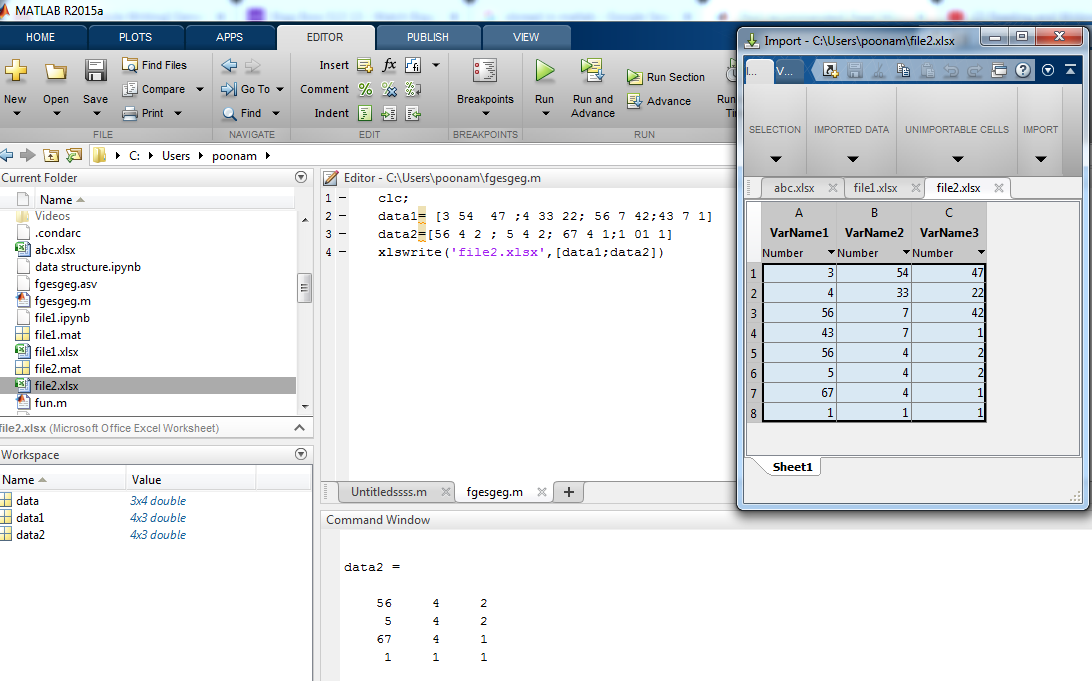
In this example input data is declared by using another two variables, which is ‘data’ (data1= [3 54 47 ;4 33 22; 56 7 42;43 7 1] and data2=[56 4 2 ; 5 4 2; 67 4 1;1 01 1]. Data is written in ‘file2’.
| Matlab Editor | Command Window |
| Clc ;
data1= [3 54 47 ; 4 33 22; 56 7 42 ; 43 7 1] data2 = [56 4 2 ; 5 4 2 ; 67 4 1 ; 1 01 1] xlswrite(‘ file2.xlsx ‘ , [data1 ; data2]) xlsread(‘ file2.xlsx ‘) |
data1 =
3 54 47 4 33 22 56 7 42 43 7 1 data2 = 56 4 2 5 4 2 67 4 1 1 1 1 ans = 3 54 47 4 33 22 56 7 42 43 7 1 56 4 2 5 4 2 67 4 1 1 1 1 |
Output:
Example #4
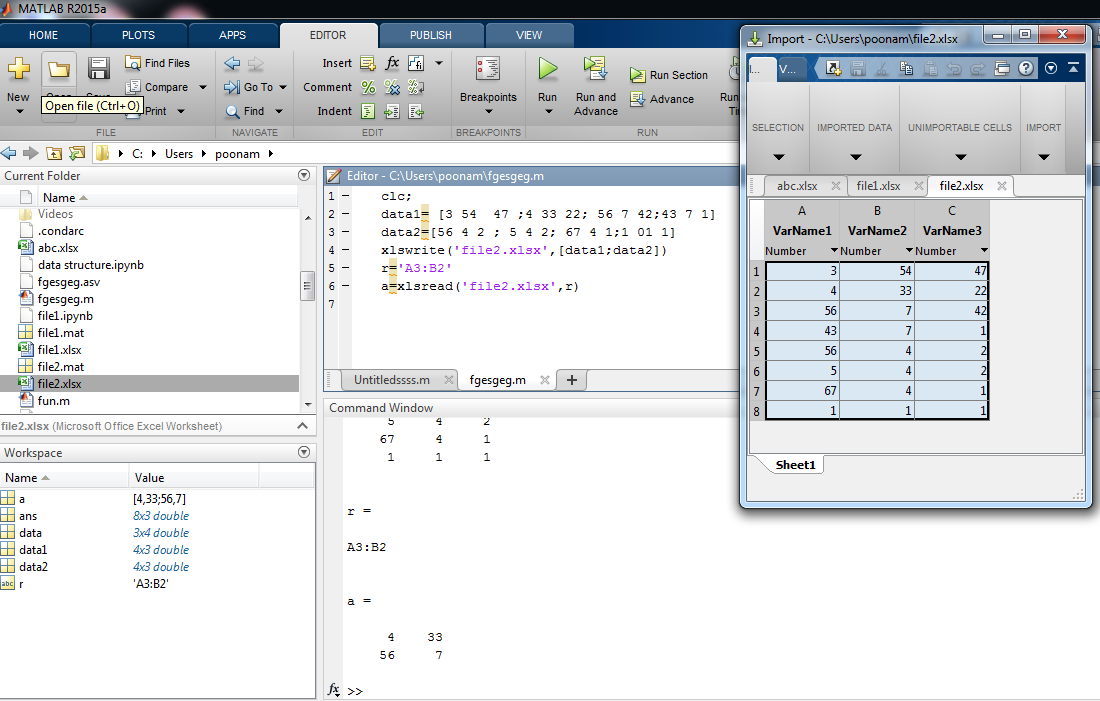
In this example input data is declared by using another two variables , which is ‘data’ (data1= [3 54 47 ;4 33 22; 56 7 42;43 7 1]and data2=[56 4 2 ; 5 4 2; 67 4 1;1 01 1]). Data is written in ‘file1’.to read the file we use range function. By giving range to the specific file we can display only important data.
| Matlab Editor | Command Window |
| Clc ;
data1 = [3 54 47 ;4 33 22; 56 7 42;43 7 1] data2 = [56 4 2 ; 5 4 2 ; 67 4 1 ; 1 01 1] xlswrite(‘file2.xlsx’,[data1 ; data2]) r = ‘ A3 : B2 ‘ a = xlsread(‘file2.xlsx’, r ) |
data1 =
3 54 47 4 33 22 56 7 42 43 7 1 data2 = 56 4 2 5 4 2 67 4 1 1 1 1 r = A3:B2 a = 4 33 56 7 |
Output:
Example #5
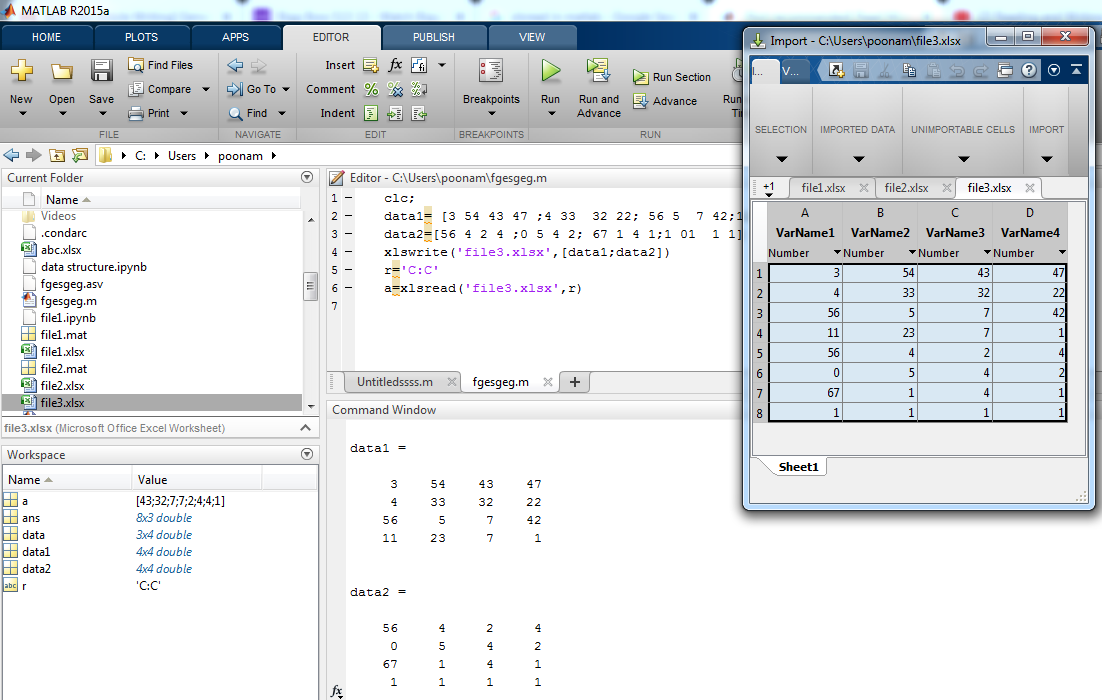
In this example input data is declared by using another two variables , which is ‘data’ (data1= [3 54 43 47 ; 4 33 32 22 ; 56 5 7 42 ; 11 23 7 1] and data2 =[56 4 2 4 ;0 5 4 2; 67 1 4 1;1 01 1 1 ]). Data is written in ‘file3’.to read the file we use range function. By giving range to the specific file we can display only important data. Here start range value and end range value is same to we can display only specific row or column by using this method.
| Matlab Editor | Command Window |
| clc;
data1= [3 54 43 47 ;4 33 32 22; 56 5 7 42;11 23 7 1] data2=[56 4 2 4 ;0 5 4 2; 67 1 4 1;1 01 1 1] xlswrite(‘file3.xlsx’,[data1;data2]) r=’C:C’ a=xlsread(‘file3.xlsx’,r) |
data1 =
3 54 43 47 4 33 32 22 56 5 7 42 11 23 7 1 data2 = 56 4 2 4 0 5 4 2 67 1 4 1 1 1 1 1 r = C:C a = 43 32 7 7 2 4 4 1 |
Output:
Conclusion
We know that nowadays a, most of the data comes in excel format only, therefore to deal with excel files is little difficult. But by using Matlab we can easily import and export the data from excel to Matlab or Matlab to excel. We can read the excel data in various ways as per our need and as per application need. Matlab operates on excel data very effectively and efficiently.
Recommended Articles
This is a guide to xlsread Matlab. Here we also discuss the introduction and how does xlsread work in matlab? along with different examples and its code implementation. you may also have a look at the following articles to learn more –
- xlabel Matlab
- Matlab mesh()
- Plot Vector Matlab
- Size Function in MATLAB
What is the simplest way to programmatically export Excel data to Matlab?
asked Oct 13, 2008 at 18:38
![]()
If you are running Matlab on Windows with Excel installed, try XLSREAD.
answered Oct 13, 2008 at 19:07
![]()
Jouni K. SeppänenJouni K. Seppänen
42.7k5 gold badges72 silver badges100 bronze badges
2
If there’s not much text annotation in the Excel file, save it as a csv, then use the MATLAB function csvread.
answered Oct 13, 2008 at 18:39
![]()
Scottie TScottie T
11.6k10 gold badges45 silver badges59 bronze badges
In more recent Matlab releases there are also csvread() and writetable() that work with csv which can easily be opened in Excel.
answered Mar 9, 2016 at 21:51
For a bit of $$$, you can get the MATLAB add-on Excel Link, which provides a nice clean interface for transferring data back and forth between the two programs.
answered Oct 13, 2008 at 18:41
![]()
Scottie TScottie T
11.6k10 gold badges45 silver badges59 bronze badges
As has been said, XLSREAD is the right function for the job. On a non-Windows system it will also work without Excel installed. However, it supposedly lacks some of Excels advanced features.
answered Oct 18, 2008 at 0:44
![]()
bastibebastibe
16.3k28 gold badges93 silver badges124 bronze badges
![]()
Download Article
![]()
Download Article
Whether you are an experienced MATLAB user or a novice, you may not be fully aware of MATLAB’s graphing abilities. MATLAB allows you to easily customize, label, and analyze graphs, giving you more freedom than the traditional Excel graph. In order to utilize MATLAB’s graphing abilities to the fullest, though, you must first understand the process for importing data. This instruction set will teach you how to import and graph excel data in MATLAB.
-

1
Open a fresh MATLAB Screen. To make the process of importing and graphing data easier, clear any text in the command window with the command clc.
-
2
Open your desired Excel file. Be sure to record the name of the Excel file for later use.
Advertisement
-
3
Save the Excel file into your MATLAB folder. The pathway for the folder typically is: C:Users[your account name]DocumentsMATLAB. Be sure you save the file as an Excel Workbook in order to have the proper file format for the import. Once this step is complete, you should see your Excel file in the current folder section in MATLAB.
-
4
Locate the columns that will be exported. Identify the range of each column to be exported. The range of the column is the first cell in a column to the last cell in a column. The proper format for this range is the first cell followed by a colon followed by the last cell (I.e. “B1:B30”)
-
5
Import the data columns to MATLAB. Enter the command var = xlsread(‘filename’, ‘xlrange’); into the command window for each column you want to import. In this command:
- Var is a variable name of your choice (Example: “x” or “y”)
- Filename is the name of your excel spreadsheet
- Xlrange is the range of the desired column in the form “X—:X—“,with X being the letter of the column followed by the cell number.


Advertisement
-
1
Create a graph. Enter the command p = plot(indep, dep1, indep, dep2) in the command window. In this command, indep is the independent variable and dep1 and dep2 are the dependent variables. If you wish to graph more than two dependent variables, follow the same format and add a dep3 variable. If you wish to graph only one dependent variable, only graph the first pair of x and y values (Example: plot(x, y1)).

-
1
Change the line color. Enter the command set(p,’color’,’[Desired Color]’); into the command window to change all the graphed lines to the same color. In this command, p is a reference to the variable you set your plot equal to in step 6. If you wish to change the color of only one line enter set(p(x),’color’,’[Desired Color]’); into the command line. The x in p(x) is the number that corresponds to the order that the lines are plotted in (Example: y1 = p(1), y2 = p(2)).
-
2
Change the line style. Enter the command set(p,’LineStyle’,’style’); into the command window to change all of the graphed lines to the same style. If you wish to change the style of one line only, enter the command set(p(x),’LineStyle’,’style’); into the command line. In this command, the x in p(x) corresponds to the number in which the lines were graphed (Example: y1 = p(1), y2 = p(2)). Common line styles include:
- dashed lines= ‘—‘
- dotted lines = ‘:’
- solid line = ‘-‘
- dash-dot line = ‘-.’
-
3
Label your axis. To label the x-axis, enter the command xlabel(‘text’) in the command window. To label the y-axis, enter the command ylabel(‘text’) in the command window.
-
4
Add a title to your graph. Enter the command title(‘text’) in the command window. The title will display at the top of your graph.
-
5
Add text within the graph. If you wish to enter text near your graphed lines, enter the command gtext(‘text’). Once you enter the command, a cursor will appear on the graph allowing you to click the area you wish to apply the label. The label can be put anywhere in the graph space.
-
6
Add grid lines to the graph. If you wish to put grid lines in your plot for easier reading, enter the command grid into the command window. Entering the command again will remove the grid lines.
-
7
Save your graph. Click file on upper right hand side of the MATLAB graph screen followed by save as in the menu. Save the graph to the desired location.


Advertisement

Ask a Question
200 characters left
Include your email address to get a message when this question is answered.
Submit
Advertisement
Thanks for submitting a tip for review!
About This Article
Thanks to all authors for creating a page that has been read 65,042 times.
Is this article up to date?
Содержание
- Совместная работа Matlab и Excel
- Чтение рабочего листа Excel в числовую матрицу Matlab
- Чтение диапазона ячеек
- Чтение столбца
- Получение числовых, текстовых и необработанных данных
- Вычисление функции на рабочем листе Excel
- Документация
- Синтаксис
- Описание
- Примеры
- Чтение рабочего листа в числовую матрицу
- Чтение области значений ячеек
- Чтение столбца
- Числовой запрос, текст и необработанные данные
- Выполнение функции на рабочем листе
- Запрос пользовательского Вывода
- Входные параметры
- filename FileName вектор символов | строка
- sheet — Рабочий лист вектор символов | представляет в виде строки | положительное целое число
- xlRange — Прямоугольная область значений вектор символов | строка
- Read Spreadsheet Data into Array or Individual Variables
- Read Spreadsheet Data into Matrix
- Read Spreadsheet Data into Cell Array
- Read Spreadsheet Data Columns as Separate Variables
- Using MATLAB with Excel
- Apply MATLAB analysis and visualization capabilities to Excel data
- Import Excel Data into MATLAB
- Access MATLAB from Excel
- Package MATLAB Code as Excel Add-ins
- Read Spreadsheet Data into Table
- Read All Data from Worksheet
- Read Selected Range from Specific Worksheet
- Convert Variables to Datetimes, Durations, or Categoricals
Совместная работа Matlab и Excel
Чтение рабочего листа Excel в числовую матрицу Matlab
Создадим файл Excel с именем myExample.xlsx в рабочем каталоге Matlab. Для этого в окне Matlab выполним следующие команды
Лист с именем Лист1 в файле myExample.xlsx содержит следующие данные:
Прочтем числовые данные с первого рабочего листа Excel.
Чтение диапазона ячеек
Прочтем заданный диапазон ячеек из файла Excel определенного в предыдущем примере.
Чтение столбца
Прочтем второй столбец из файла Excel из первого примера.
Для получения лучшего результата рекомендуется в задаваемый диапазон включать номера строк, например, ‘B2:B4’.
Получение числовых, текстовых и необработанных данных
Примерполучениячисловых,текстовыхинеобработанных(комбинированных) данных из файла Excel, созданного в первом примере.
Вычисление функции на рабочем листе Excel
В Редакторе Matlab (Editor – New – Function) создадим функцию, оперирующую с данными, расположенными на рабочем листе Excel. Значениям, выходящим за пределы диапазона [0.2,0.8] будем присваивать значения 0.2 или 0.8. Функцию сохраним в файле SetMinMax.m в рабочем каталоге.
В Command Window добавим случайные данные к файлу myExample.xlsx .
Порезультатамвыполненияэтихкомандпоявляетсяинформационное предупреждение о том, что к заданному файлу произошло добавление нового рабочего листа и в этот лист занесены определенные нами данные.
Рабочий лист с именем MyData содержит величины в диапазоне от 0
Источник
Документация
(Не рекомендуемый) файл электронной таблицы Read Microsoft Excel
xlsread не рекомендуется. Использование readtable , readmatrix , или readcell вместо этого. Для получения дополнительной информации см. Вопросы совместимости.
Синтаксис
Описание
num = xlsread( filename ) читает первый рабочий лист в Microsoft ® Excel ® рабочая книга электронной таблицы под названием filename и возвращает числовые данные в матрице.
num = xlsread( filename , sheet ) читает заданный рабочий лист.
num = xlsread( filename , xlRange ) чтения от заданной области первого рабочего листа в рабочей книге. Используйте синтаксис области значений Excel, такой как ‘A1:C3’ .
num = xlsread( filename , sheet , xlRange ) чтения из заданного рабочего листа и области значений.
num = xlsread( filename , sheet , xlRange , ‘basic’ ) считывает данные из электронной таблицы в basic импортируйте режим. Если ваш компьютер не имеет Excel для Windows ® или если вы используете MATLAB ® Online™ , xlsread автоматически действует в basic импортируйте режим, который поддерживает XLS, XLSX, XLSM, XLTX и файлы XLTM.
Если вы не задаете все аргументы, используйте пустые символьные вектора, » , как заполнители, например, num = xlsread(filename,»,»,’basic’) .
[ num , txt , raw ] = xlsread( ___ ) дополнительно возвращает текстовые поля в массиве ячеек txt , и и числовые данные и текстовые данные в массиве ячеек raw , использование любого из входных параметров в предыдущих синтаксисах.
___ = xlsread( filename ,-1) открывает окно Excel, чтобы в интерактивном режиме выбрать данные. Выберите рабочий лист, перетащите мышью мышь в области значений, которую вы хотите и нажимаете OK. Этот синтаксис поддерживается только на компьютерах Windows с установленным программным обеспечением Microsoft Excel .
[ num , txt , raw , custom ] = xlsread( filename , sheet , xlRange ,», processFcn ) , где processFcn указатель на функцию, чтения из электронной таблицы, processFcn вызовов на данных, и возвращает конечные результаты как числовые данные в массиве num . xlsread функция возвращает текстовые поля в массиве ячеек txt , и числовые данные и текстовые данные в массиве ячеек raw , и второй выход от processFcn в массиве custom . xlsread функция не изменяет данные, хранимые в электронной таблице. Этот синтаксис поддерживается только на компьютерах Windows с программным обеспечением Excel.
Примеры
Чтение рабочего листа в числовую матрицу
Создайте файл с именем Excel myExample.xlsx .
Sheet1 из myExample.xlsx содержит:
Считайте числовые данные из первого рабочего листа.
Чтение области значений ячеек
Считайте определенную область значений данных из файла Excel в предыдущем примере.
Чтение столбца
Считайте второй столбец из файла Excel в первом примере.
Для лучшей эффективности включайте номера строк в область значений, такие как ‘B1:B3’ .
Числовой запрос, текст и необработанные данные
Запросите числовые данные, текстовые данные и объединенные данные из файла Excel в первом примере.
Выполнение функции на рабочем листе
В Редакторе создайте функцию, чтобы обработать данные из рабочего листа. В этом случае установите значения вне области значений [0.2,0.8] к 0.2 или 0.8 .
В Командном окне добавьте случайные данные в myExample.xlsx .
Рабочий лист под названием MyData содержит значения в пределах от от 0 до 1.
Считайте данные из рабочего листа и сбросьте любые значения вне области значений [0.2,0.8] . Задайте имя листа, но используйте » как заполнители для xlRange и ‘basic’ входные параметры.
Запрос пользовательского Вывода
Выполните функцию на рабочем листе и отобразите пользовательский индекс выход.
В Редакторе измените функциональный setMinMax от предыдущего примера, чтобы возвратить индексы измененных элементов (пользовательский выход).
Считайте данные из рабочего листа MyData , и запросите пользовательский индекс выход, idx .
Входные параметры
filename FileName
вектор символов | строка
Имя файла в виде вектора символов или строки. Если вы не включаете расширение, xlsread поиски файла с указанным именем и поддерживаемым расширением Excel. xlsread может считать данные, сохраненные в файлах, которые в настоящее время открыты в Excel для Windows.
Пример: ‘myFile.xlsx’ или «myFile.xlsx»
Типы данных: char | string
sheet — Рабочий лист
вектор символов | представляет в виде строки | положительное целое число
Рабочий лист в виде одного из следующего:
Вектор символов или строка, которая содержит имя рабочего листа. Имя не может содержать двоеточие ( : ). Чтобы определить имена листов в файле электронной таблицы, используйте xlsfinfo . Для файлов XLS в basic режим, sheet является чувствительным к регистру.
Положительное целое число, которое указывает на индекс рабочего листа. Эта опция не поддерживается для файлов XLS в basic режим.
Типы данных: char | string | single | double | int8 | int16 | int32 | int64 | uint8 | uint16 | uint32 | uint64
xlRange — Прямоугольная область значений
вектор символов | строка
Прямоугольная область значений в виде вектора символов или строки.
Задайте xlRange использование двух противостоящих углов, которые задают область, чтобы читать. Например, ‘D2:H4’ представляет прямоугольную область 3 на 5 между этими двумя углами D2 и H4 на рабочем листе. xlRange вход не является чувствительным к регистру, и использует стиль ссылки Excel A1 (см. справку Excel).
Выбор области значений не поддерживается при чтении файлов XLS в basic режим. В этом случае используйте » вместо xlRange .
Если вы не задаете sheet , затем xlRange должен включать оба угла и символ двоеточия, даже для отдельной ячейки (такие как ‘D2:D2’ ). В противном случае, xlsread интерпретирует вход как имя рабочего листа (такое как ‘sales’ или ‘D2’ ).
Если вы задаете sheet , затем xlRange :
Не должен включать двоеточие и противоположный угол, чтобы описать отдельную ячейку.
Может относиться к именованной области значений, которую вы задали в файле Excel (см. справку Excel).
Когда заданный xlRange объединенные ячейки перекрытий:
На компьютерах Windows с Excel, xlsread расширяет область значений, чтобы включать все объединенные ячейки.
На компьютерах без Excel для Windows, xlsread возвращает данные для заданной области только, с пустым или NaN значения для объединенных ячеек.
Типы данных: char | string
Источник
Read Spreadsheet Data into Array or Individual Variables
The best way to represent spreadsheet data in MATLAB® is in a table, which can store a mix of numeric and text data. However, sometimes you need to import spreadsheet data as a matrix, a cell array, or separate variables. Based on your data and the data type you need in the MATLAB® workspace, use one of these functions:
readmatrix — Import homogeneous numeric or text data as a matrix.
readcell — Import mixed numeric and text data as a cell array.
readvars — Import spreadsheet columns as separate variables.
Read Spreadsheet Data into Matrix
Import numeric data from basic_matrix.xls into a matrix.
You can also select the data to import from the spreadsheet by specifying the Sheet and Range parameters. For example, specify the Sheet parameter as ‘Sheet1’ and the Range parameter as ‘B1:D3’ . The readmatrix function reads a 3 -by- 3 subset of the data, starting at the element in the first row and second column of the sheet named ‘Sheet1’ .
Read Spreadsheet Data into Cell Array
Import the mixed tabular data from airlinesmall_subset.xlsx into a cell array.
You can also select the data to import from the spreadsheet by specifying the Sheet and Range parameters. For example, specify the Sheet parameter as ‘2007’ and the Range parameter as ‘G2:I11’ . The readcell function imports ten rows of data for variables in columns 7 , 8 , and 9 , from the worksheet named ‘2007’ .
Read Spreadsheet Data Columns as Separate Variables
Import the first three columns from airlinesmall_subset.xlsx as separate workspace variables.
You can also select which subset to import from the spreadsheet by specifying the Sheet and Range parameters. For example, import ten rows of the column DayOfMonth from the worksheet named ‘2004’ . Specify the column and number of rows using the Range parameter.
Источник
Using MATLAB with Excel
Apply MATLAB analysis and visualization capabilities to Excel data
When it comes to data analysis and visualization, technical professionals who use Excel ® often encounter functional limitations. MATLAB supplements the capabilities of Excel by providing access to pre-built mathematical and analysis functions, visualization tools, and the ability to automate your analysis workflows.
3 ways to use MATLAB and Excel together:
- Import Excel data into MATLAB
- Access MATLAB from Excel
- Package MATLAB code as Excel add-ins
Import Excel Data into MATLAB
The Import Tool makes it easy to bring data from an Excel spreadsheet into MATLAB. It shows the data both as it exists in Excel and how it will be represented in MATLAB, and recommends the best format for the data in MATLAB. Data import can be integrated into an automated analysis workflow in MATLAB, either by using code automatically generated by the Import Tool, or by calling MATLAB commands readtable and xlsread directly.
Excel data is naturally represented in MATLAB as a table, which organizes tabular data into columns of a single variable.
Access MATLAB from Excel
Spreadsheet Link™ connects Excel with the MATLAB workspace, enabling you to access the MATLAB environment from an Excel spreadsheet. You can exchange data between MATLAB and Excel, taking advantage of the familiar Excel interface while gaining access to MATLAB algorithms in image processing, data analytics, and control engineering.
Package MATLAB Code as Excel Add-ins
With MATLAB Compiler™, you can package math, graphics, and user interfaces created in MATLAB as Excel add-ins to perform analyses with Excel. These Excel add-ins can be distributed royalty-free to users who do not have MATLAB, and require no VBA programming.
With the addition of MATLAB Compiler SDK™, you can deploy add-ins to MATLAB Production Server™ for multiple Excel clients to access your MATLAB algorithms. This deployment ensures that users access the latest version of your analytics automatically with updates made to the algorithms deployed on the server.
Источник
Read Spreadsheet Data into Table
The best way to represent spreadsheet data in MATLAB® is in a table, which can store a mix of numeric and text data, as well as variable and row names. You can read data into tables interactively or programmatically. To interactively select data, click Import Data on the Home tab, in the Variable section. To programmatically import data, use one of these functions:
readtable — Read a single worksheet.
spreadsheetDatastore — Read multiple worksheets or files.
This example shows how to import spreadsheet data programmatically using both functions. The sample data, airlinesmall_subset.xlsx , contains one sheet for each year between 1996 and 2008. The sheet names correspond to the year, such as 2003 .
Read All Data from Worksheet
Call readtable to read all the data in the worksheet called 2008, and then display only the first 10 rows and columns. Specify the worksheet name using the Sheet name-value pair argument. If your data is on the first worksheet in the file, you do not need to specify Sheet .
Read Selected Range from Specific Worksheet
From the worksheet named 1996 , read only 10 rows of data from the first 5 columns by specifying a range, ‘A1:E11’ . The readtable function returns a 10-by-5 table.
Convert Variables to Datetimes, Durations, or Categoricals
During the import process, readtable automatically detects the data types of the variables. However, if your data contains nonstandard dates, durations, or repeated labels, then you can convert those variables to their correct data types. Converting variables to their correct data types lets you perform efficient computations and comparisons and improves memory usage. For instance, represent the variables Year , Month , and DayofMonth as one datetime variable, the UniqueCarrier as categorical , and ArrDelay as duration in minutes.
Find the day of the year with the longest delay, and then display the date.
Источник
Introduction
In the previous tutorial, we learnt how to write to an Excel file from Matlab. This tutorial is a follow-up article on how to read from an Excel file from Matlab.
In this tutorial, we will learn how to read the data from an Excel file and use the data in Matlab. At the end of this tutorial, you will learn how to open an Microsoft Excel file,
read data from a particular column into Matlab and save it in the workspace. Finally, we will plot the data and insert this plot into the same excel file.
Steps
Step 1 : The first step is to create a COM server which runs the Excel Application.
Excel = actxserver('Excel.Application');
This assumes that the Excel Application is installed in your system. If Excel is not installed, this statement will give an error. You can put the above statement within a try-catch block:
try
    Excel = actxserver('Excel.Application');
catch
    Excel = [];
end
Step 2: In this step, we will check the version of Excel.
ExcelVersion = str2num(Excel.Version);
If the Microsoft Excel is 2007, 2010 or above, you would get ExcelVersion would be 12 or above. In such a case, you can handle all the Excel workbook files
with extensions *.xls, *.xlsx and *.xlsm. If the version is less than 12, only *.xls file would be supported.
Step 3: In this step, we will open an Excel file “ResultFile.xls” in the current directory.
ResultFile = [pwd 'ResultFile.xls'];
Workbook = invoke(Excel.Workbooks,'Open', ResultFile);
Step 4: By default, the visibility of the Excel file is set to
FALSE. You can make the Excel file visible using the command:
set(Excel,'Visible',1);
Let us assume, that the Excel file looks something like this as shown in the figure. Let us develop the code to read the data from Column A and Column B in to 2 variables
iter and expResults. We will plot this data and insert this plot into the same excel file.
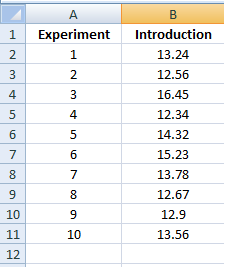
ResultFile = [pwd 'ResultFile.xls'];
Workbook = invoke(Excel.Workbooks,'Open', ResultFile);
resultsheet = 'ExperimentSheet';
try
    sheet = get(Excel.Worksheets,'Item', resultsheet);
    invoke(sheet, 'Activate');
catch
    % If the Excel Sheet ‘ExperimentSheet’ is not found, throw an error message
    errordlg([resultsheet 'not found']);
end
Read Experiment Column
As seen from the Excel sheet, we need to first read Column A from row 2 to row 11. First we need to select the range from A2 till A11. We use the
xlcolumn() function to convert between column
name and number for Excel representation. The xlcolumn() module can be downloaded from
here.
%% Read the Experiment Column
Location = [xlcolumn(1) '2:' xlcolumn(1) int2str(11)];
ExpIteration = get(Excel.Activesheet, 'Range',Location);
ExpIteration.Select;
if(iscell(Excel.Selection.Value))
    iter = cell2mat(Excel.Selection.Value)';
else
    iter = Excel.Selection.Value;
end
% The iter variable will now contain the data from the column A.
Read Result Column
As seen from the Excel sheet, we need to first read Column B from row 2 to row 11. Here again, we need to select the range from B2 till B11.
%% Read the Results Column
Location = [xlcolumn(2) '2:' xlcolumn(2) int2str(11)];
ResultValue  = get(Excel.Activesheet, 'Range',Location);
ResultValue.Select;
if(iscell(Excel.Selection.Value))
    expResults = cell2mat(Excel.Selection.Value)';
else
    expResults = Excel.Selection.Value;
end
% The expResults variable will now contain the data from the column A.
Plot the Data
Since we already have the data in the workspace, we can simply use the plot command in Matlab.
%% Plot the Data
plot(iter, expResults);
legend('Results');
xlabel('Experiment');
ylabel('Results');
Insert the image into Excel Sheet
In order to insert the plot into an excel sheet, we need to convert the figure object into an image.
% Convert the figure object to an image
ResultImage = 'Results.png';
print('-dpng', ResultImage);
To place the image in the Excel sheet, we look for coordinates of the particular cell which is empty and place the image in that cell.
Let’s say, we will place the image starting from column D.
Location = [ xlcolumn(4)  int2str(2) ];
ImageRange= get(Excel.ActiveSheet,'Range',  Location);
Shapes =ExAct.Shapes;
%% Size of theimage.
imgWidth=400;
imgHeight=250;
Shapes.AddPicture([pwd'' ResultImage] ,0,1, ImageRange.Left, ImageRange.Top, imgWidth, imgHeight);
The last step is to save the Excel file and close the Excel application:
%Save and Close the Excel File
delete(Excel);
invoke(Excel,'Quit');
invoke(Workbook,'Save');
Download Download ReadData.zip
- Read Excel XLSX File Using
readtable()Function in MATLAB - Read Excel XLSX File Using
readmatrix()Function in MATLAB - Read Excel XLSX File Using
readcell()Function in MATLAB

In this tutorial, we will discuss how to read the excel file using the readtable(), readmatrix(), and readcell() function in MATLAB.
Read Excel XLSX File Using readtable() Function in MATLAB
You can read the excel file of any extension and many other types of files using the readtable() function. This function reads the file data and saves it in a table that contains variables on each column. If the excel file does not contain variables on each column, the readtable() function will give them a default variable name starting from var1 and so on. For example, see the code below.
data = readtable('fileName.xlsx');
In the above code, we are reading a file with the name fileName that has the extension xlsx. You can change the name of the file and the extension according to the given file. If you defined row names for each row in the excel file, you could import them using the property ReadRowNames, and they will not be saved under a variable. See the code below.
data = readtable('fileName.xlsx','ReadRowNames',true);
If you want to display a portion of the available data, you can do it using the object data in which the data is stored. See the code below.
The above code will print the first three rows and the first two columns. If you want to read specific range data from the excel file, you can define the range of the columns using the property Range. See the example code below.
data = readtable('fileName.xlsx',...
    'Range','C1:E7',...
    'ReadVariableNames',false)
In the above code, we specified a range from column C1 to column E7 present in a spreadsheet. Make sure to check your data range from the spreadsheet before using the range. The property ReadVariableNames is used to specify if you want to read the first row as variables or not. If you have saved the excel file with variables or names of each column, you can use this property. In this way, you will know which variables are being imported and which are not. If you don’t know the variable’s name, their types, and range of the data, you can use the detectImportOptions() function to detect the properties of a spreadsheet. See the example code below.
import_options = detectImportOptions('fileName.xlsx')
Using this function, you will get a lot of useful information about your excel file. Check this link for more information about the readtable() function.
Read Excel XLSX File Using readmatrix() Function in MATLAB
If you have numeric data saved in an excel file, you can use the readmatrix() function to read the data into a matrix. See the example code below.
MyMatrix = readmatrix('fileName.xlsx')
You have to specify the file name along with its extension inside the readmatrix() function to read the file. You can also use the detectImportOptions() function to detect and set the import options. For example, let’s detect and select the sheet number, variable names, and data range of the spreadsheet. See the code below.
Iopts = detectImportOptions('fileName.xlsx')
Iopts.Sheet = '2007';
Iopts.SelectedVariableNames = [1:5];
Iopts.DataRange = '2:11';
data = readmatrix('fileName.xlsx',Iopts);
You can change these properties according to your excel file. You can also define the range of the column to import using the Range property. See the example code below.
data = readmatrix('fileName.xlsx','Range','B1:C10');
Make sure to check your data range from the spreadsheet before using the Range property. Check this link for more information about the readmatrix() function.
Read Excel XLSX File Using readcell() Function in MATLAB
If you have cell data saved in an excel file, you can use the readcell() function to read the data into a cell. See the example code below.
MyCell = readcell('fileName.xlsx')
You have to specify the file name along with its extension inside the readcell() function to read the file. You can also use the detectImportOptions() function to detect and set the import options. See the example code below.
Iopts = detectImportOptions('fileName.xlsx');
Iopts.SelectedVariableNames = {'Variable1','Variable2'};
MyCell = readcell('fileName.xlsx',Iopts);
In the above code, we have selected two variables from which we want to read the data. You can define the variable names according to your excel file and many other properties. You can also define the sheet number and range of the data using the Sheet and Range properties. See the example code below.
MyCell = readcell('fileName.xlsx','Sheet','100','Range','A1:C10')
Make sure to check your excel file before setting any property. Check this link for more information about the readcell() function.