
Время на прочтение
7 мин
Количество просмотров 69K
В современном мире разработки приложений нередко встает необходимость работы с Excel документами. Чаще всего это разного рода отчеты, но иногда xls/x файлы используются в качестве хранилища данных. Например, если пользователь должен иметь возможность загрузить данные в приложение или выгрузить, в человеко-читаемом виде, Excel де-факто является стандартом. Относительно дружелюбный интерфейс, прозрачная структура, в купе с его распространенностью… трудно навскидку назвать решение лучше.

Однако, у многих Excel до сих пор ассоциируется с чем-то тяжелым, неповоротливым и сложным. Давайте посмотрим, как мы — обычные C# разработчики, можем легко сформировать простой Excel документ, на примере табличного отчета.
Историческая справка
Времена, когда доминировал проприетарный формат .xls(Excel Binary File Format) давно прошли и сейчас мы имеем только .xlsx(Excel Workbook), в рамках Office Open XML. Последний представляет собой обычный .zip архив с XML файлами. Не будем углубляться в его структуру, я искренне надеюсь что вам это никогда не понадобится.
На github, и не только, можно найти ряд библиотек, бесплатных и не только. Пожалуй самой популярной является EPPlus. До определенной степени, она довольно хорошо отражает концепцию Excel, именно по этому я всегда использую EPPlus. Версия 4 полностью бесплатна, начиная с 5‐й версии вам потребуется приобрести лицензию для коммерческого использования.
Задача
Итак, предположим, продукт-мэнеджеру ударила в голову идея того, что возможность выгружать некий отчет в формате Excel увеличит кол-во пользователей на 100500%. Проджет-менеджер решает выкатить эту киллер-фичу как хотфикс прямо сегодня — ведь работы всего на пару часов.

Сам по себе, отчет содержит краткое описание компании и историю изменения некоторых экономических показателей. Для простоты все свойства компании — строки. Экономические показатели — большие целые числа и числа с плавающей точкой, а также даты. Предположим, что где-то в недрах микросервисного backend-да есть сервис-генератор подобных отчетов, например по id компании. Однако, поскольку id нет смысла выводить пользователю, идентификатор отсутствует в самой модели отчета.
Аналитик, в свою очередь, выдает задачу с феноменально точным описанием — «Сгенерировать excel отчет на базе данных MarketReport». Что ж, для нашего примера, создадим заглушку — генератор фейковых данных:

Первый запуск
Подключим EPPlus версии 4.5.3.3 и создадим базовую обвязку для будущего генератора.

Сердцем генератора будет метод Generate. ExcelPackage это модель документа, через которую мы и будем осуществлять все взаимодействия с ним. Также имеется конструктор для передачи пути к файлу или потока.

В методе main создается генератор отчетов, а также генератор Excel файлов. Далее полученный файл просто записывается на диск.
При попытке запустить приложение, получаем exception:InvalidOperationException: The workbook must contain at least one worksheet
Все правильно, Excel документ не может существовать без страниц, должна быть хотя бы одна. Добавляем ее, все интуитивно понятно:
var sheet = package.Workbook.Worksheets
		.Add("Market Report");
Запускаем снова и… вот оно! Теперь наше приложение генерирует документ и, хотя там еще ничего нет, он уже весит 2,5KB — значит мы работаем с Excel правильно и все идет как надо.
Вывод данных
Давайте выведем основную информацию по компании в шапку. Для доступа к конкретной ячейки объект Cells на странице пакета снабжен удобным индексатором. При этом, до конкретной ячейки можно достучаться как через номер строки и столбца, так и по привычному всем буквенно-числовому коду:
sheet.Cells["B2"].Value = "Company:";
sheet.Cells[2, 3].Value = report.Company.Name;
Полный код вывода шапки.
sheet.Cells["B2"].Value = "Company:";
sheet.Cells[2, 3].Value = report.Company.Name;
sheet.Cells["B3"].Value = "Location:";
sheet.Cells["C3"].Value = $"{report.Company.Address}, " +
  												$"{report.Company.City}, " +
  												$"{report.Company.Country}";
sheet.Cells["B4"].Value = "Sector:";
sheet.Cells["C4"].Value = report.Company.Sector;
sheet.Cells["B5"].Value = report.Company.Description;
Для вывода исторических данных понадобится как минимум шапка таблицы и цикл по массиву History:
sheet.Cells[8, 2, 8, 4].LoadFromArrays(new object[][]{ new []{"Capitalization", "SharePrice", "Date"} });
var row = 9;
var column = 2;
foreach (var item in report.History)
{
  sheet.Cells[row, column].Value = item.Capitalization;
  sheet.Cells[row, column + 1].Value = item.SharePrice;
  sheet.Cells[row, column + 2].Value = item.Date;
  row++;
}
Предлагаю обратить внимание на метод LoadFromArrays, который заполняет диапазон ячеек рваным(зубчатым) массивом. Здесь мы можем видеть, что типизация теряется и передавая массив object мы ожидаем что EPPlus в конечном итоге использует ToString, чтобы записать переданное в ячейки.
Стилизация
Если вы прямо сейчас откроете документ, то вы возможно увидите не то, что хотелось бы отдать в продакшн в пятницу вечером.
Как это выглядит

Во-первых, шапка никак не выделяется, во-вторых таблица не имеет границ… выравнивание пляшет, даты отображаются магическими числами, а капитализация «уходит в какую-то математику» — как это прокомментировал аналитик.
Да, на все эти красивости у нас уйдет больше года кода, чем на сам вывод данных, и, в конечном тоге, получившаяся каша из логики вывода данных и разметки заставит некоторых усомниться в их компетентности… но, мы же backend разработчики, так давайте сверстаем Excel Sheet!
Размер ячеек
Из коробки у нас есть возможность сделать автофит а так же вручную выставить ширину в соответствии с нашей ситуацией. А ситуация у нас не самая хорошая — по задумке аналитика в шапке у ячеек должен быть автофит, а у ячеек таблицы — тоже автофит. Так в чем же подвох?
Если вы когда-нибудь до этого открывали Excel, то возможно знаете, что ширина ячеек не может отличаться в рамках столбца и автофит будет по самому широкому контенту ячейки. Однако, простые вещи бывает нетак то просто объяснить… Но если вы справитесь, то вот как это будет выглядеть в коде:
sheet.Cells[1, 1, row, column + 2].AutoFitColumns();
sheet.Column(2).Width = 14;
sheet.Column(3).Width = 12;
Формат данных
Как и большая часть стиля ячейки, он задается через одноименное свойство Style. Обратите внимание на вычисление 3-го аргумента индексатора. Это звоночек некачественного кода, но к этому мы вернемся в позже…
sheet.Cells[9, 4, 9 + report.History.Length, 4].Style.Numberformat.Format = "yyyy";
sheet.Cells[9, 2, 9 + report.History.Length, 2].Style.Numberformat.Format =  "### ### ### ##0";
Выравнивание
Его можно задать как на ячейке, так и на диапазоне. На самом деле, для EPPlus, это одна и та же сущность — некий ExcelRange, описывающий диапазон ячеек, в том числе и со всего 1 ячейкой.
sheet.Column(2).Style.HorizontalAlignment = ExcelHorizontalAlignment.Left;
sheet.Cells[8, 3, 8 + report.History.Length, 3].Style.HorizontalAlignment = ExcelHorizontalAlignment.Center;
Стиль текста
Также легко задается, используя Style.Font, кстати, здесь, на 2-й строчке, мы впервые указываем диапазон так, как привыкли его видеть пользователи Excel:
sheet.Cells[8, 2, 8, 4].Style.Font.Bold = true;
sheet.Cells["B2:C4"].Style.Font.Bold = true;
Границы
Задаем стиль линии, а также ее толщину. К этому моменту от кол-ва магических чисел-параметров индексатора уже рябит в глазах, но мы уже на финишной прямой… не так ли?
sheet.Cells[8, 2, 8 + report.History.Length, 4].Style.Border.BorderAround(ExcelBorderStyle.Double);
sheet.Cells[8, 2, 8, 4].Style.Border.Bottom.Style = ExcelBorderStyle.Thin;
График
«Ну что за отчет без графиков, верно, Карл?» — ловко подметит специалист по тестированию, и не важно, что этого не было в ТЗ а на часах уже половина 9-го…
Хотя график как сущность сам по себе сложнее таблиц и с графиками мы не работаем каждый день, EPPlus предоставляет довольно понятный API. Давайте добавим простейший график, отражающий рост капитализации:
var capitalizationChart = sheet.Drawings.AddChart("FindingsChart", OfficeOpenXml.Drawing.Chart.eChartType.Line);
capitalizationChart.Title.Text = "Capitalization";
capitalizationChart.SetPosition(7, 0, 5, 0);
capitalizationChart.SetSize(800, 400);
var capitalizationData = (ExcelChartSerie)(capitalizationChart.Series.Add(sheet.Cells["B9:B28"], sheet.Cells["D9:D28"]));
capitalizationData.Header = report.Company.Currency;
Еще, может понадобиться защитить страницу от редактирования:
sheet.Protection.IsProtected = true;На этом все, репозиторий с рабочим приложением находится здесь.
Заключение
О чем говорит финальная версия метода Generate?
public byte[] Generate(MarketReport report)
{
  var package = new ExcelPackage();

  var sheet = package.Workbook.Worksheets
    	.Add("Market Report");

  sheet.Cells["B2"].Value = "Company:";
  sheet.Cells[2, 3].Value = report.Company.Name;
  sheet.Cells["B3"].Value = "Location:";
  sheet.Cells["C3"].Value = $"{report.Company.Address}, " +
    												$"{report.Company.City}, " +
    												$"{report.Company.Country}";
  sheet.Cells["B4"].Value = "Sector:";
  sheet.Cells["C4"].Value = report.Company.Sector;
  sheet.Cells["B5"].Value = report.Company.Description;

  sheet.Cells[8, 2, 8, 4].LoadFromArrays(new object[][]{ new []{"Capitalization", "SharePrice", "Date"} });
  var row = 9;
  var column = 2;
  foreach (var item in report.History)
  {
    	sheet.Cells[row, column].Value = item.Capitalization;
   		sheet.Cells[row, column + 1].Value = item.SharePrice;
   		sheet.Cells[row, column + 2].Value = item.Date;
    	row++;
  }

  sheet.Cells[1, 1, row, column + 2].AutoFitColumns();
  sheet.Column(2).Width = 14;
  sheet.Column(3).Width = 12;

  sheet.Cells[9, 4, 9+ report.History.Length, 4].Style.Numberformat.Format = "yyyy";
  sheet.Cells[9, 2, 9+ report.History.Length, 2].Style.Numberformat.Format =  "### ### ### ##0";

  sheet.Column(2).Style.HorizontalAlignment = ExcelHorizontalAlignment.Left;
  sheet.Cells[8, 3, 8 + report.History.Length, 3].Style.HorizontalAlignment = ExcelHorizontalAlignment.Center;
  sheet.Column(4).Style.HorizontalAlignment = ExcelHorizontalAlignment.Right;

  sheet.Cells[8, 2, 8, 4].Style.Font.Bold = true;
  sheet.Cells["B2:C4"].Style.Font.Bold = true;

  sheet.Cells[8, 2, 8 + report.History.Length, 4].Style.Border.BorderAround(ExcelBorderStyle.Double);
  sheet.Cells[8, 2, 8, 4].Style.Border.Bottom.Style = ExcelBorderStyle.Thin;

  var capitalizationChart = sheet.Drawings.AddChart("FindingsChart", OfficeOpenXml.Drawing.Chart.eChartType.Line);
  capitalizationChart.Title.Text = "Capitalization";
  capitalizationChart.SetPosition(7, 0, 5, 0);
  capitalizationChart.SetSize(800, 400);
  var capitalizationData = (ExcelChartSerie)(capitalizationChart.Series.Add(sheet.Cells["B9:B28"], sheet.Cells["D9:D28"]));
  capitalizationData.Header = report.Company.Currency;

  sheet.Protection.IsProtected = true;

  return package.GetAsByteArray();
}
Во-первых, прежде всего, о том, что мы успешно справились с задачей, а именно, сгенерировали свой первый Excel отчет, поработали со стилями и даже решили пару попутных проблем.
Во-вторых, возможно имеет смысл искать новою работу, но, забегая вперед, я бы с этим не спешил… Если данная публикация наберет 1+ просмотров, то во второй части мы поговорим о том, как можно отделить стилизацию от логики заполнения данными, упростить манипуляции над ячейками и в целом сделаем код боле поддерживаемым.

Introduction
This is a tutorial about writing code in Excel spreadsheets using Visual Basic for Applications (VBA).
Excel is one of Microsoft’s most popular products. In 2016, the CEO of Microsoft said «Think about a world without Excel. That’s just impossible for me.” Well, maybe the world can’t think without Excel.
- In 1996, there were over 30 million users of Microsoft Excel (source).
- Today, there are an estimated 750 million users of Microsoft Excel. That’s a little more than the population of Europe and 25x more users than there were in 1996.
We’re one big happy family!
In this tutorial, you’ll learn about VBA and how to write code in an Excel spreadsheet using Visual Basic.
Prerequisites
You don’t need any prior programming experience to understand this tutorial. However, you will need:
- Basic to intermediate familiarity with Microsoft Excel
- If you want to follow along with the VBA examples in this article, you will need access to Microsoft Excel, preferably the latest version (2019) but Excel 2016 and Excel 2013 will work just fine.
- A willingness to try new things
Learning Objectives
Over the course of this article, you will learn:
- What VBA is
- Why you would use VBA
- How to get set up in Excel to write VBA
- How to solve some real-world problems with VBA
Important Concepts
Here are some important concepts that you should be familiar with to fully understand this tutorial.
Objects: Excel is object-oriented, which means everything is an object — the Excel window, the workbook, a sheet, a chart, a cell. VBA allows users to manipulate and perform actions with objects in Excel.
If you don’t have any experience with object-oriented programming and this is a brand new concept, take a second to let that sink in!
Procedures: a procedure is a chunk of VBA code, written in the Visual Basic Editor, that accomplishes a task. Sometimes, this is also referred to as a macro (more on macros below). There are two types of procedures:
- Subroutines: a group of VBA statements that performs one or more actions
- Functions: a group of VBA statements that performs one or more actions and returns one or more values
Note: you can have functions operating inside of subroutines. You’ll see later.
Macros: If you’ve spent any time learning more advanced Excel functionality, you’ve probably encountered the concept of a “macro.” Excel users can record macros, consisting of user commands/keystrokes/clicks, and play them back at lightning speed to accomplish repetitive tasks. Recorded macros generate VBA code, which you can then examine. It’s actually quite fun to record a simple macro and then look at the VBA code.
Please keep in mind that sometimes it may be easier and faster to record a macro rather than hand-code a VBA procedure.
For example, maybe you work in project management. Once a week, you have to turn a raw exported report from your project management system into a beautifully formatted, clean report for leadership. You need to format the names of the over-budget projects in bold red text. You could record the formatting changes as a macro and run that whenever you need to make the change.
What is VBA?
Visual Basic for Applications is a programming language developed by Microsoft. Each software program in the Microsoft Office suite is bundled with the VBA language at no extra cost. VBA allows Microsoft Office users to create small programs that operate within Microsoft Office software programs.
Think of VBA like a pizza oven within a restaurant. Excel is the restaurant. The kitchen comes with standard commercial appliances, like large refrigerators, stoves, and regular ole’ ovens — those are all of Excel’s standard features.
But what if you want to make wood-fired pizza? Can’t do that in a standard commercial baking oven. VBA is the pizza oven.

Yum.
Why use VBA in Excel?
Because wood-fired pizza is the best!
But seriously.
A lot of people spend a lot of time in Excel as a part of their jobs. Time in Excel moves differently, too. Depending on the circumstances, 10 minutes in Excel can feel like eternity if you’re not able to do what you need, or 10 hours can go by very quickly if everything is going great. Which is when you should ask yourself, why on earth am I spending 10 hours in Excel?
Sometimes, those days are inevitable. But if you’re spending 8-10 hours everyday in Excel doing repetitive tasks, repeating a lot of the same processes, trying to clean up after other users of the file, or even updating other files after changes are made to the Excel file, a VBA procedure just might be the solution for you.
You should consider using VBA if you need to:
- Automate repetitive tasks
- Create easy ways for users to interact with your spreadsheets
- Manipulate large amounts of data
Getting Set Up to Write VBA in Excel
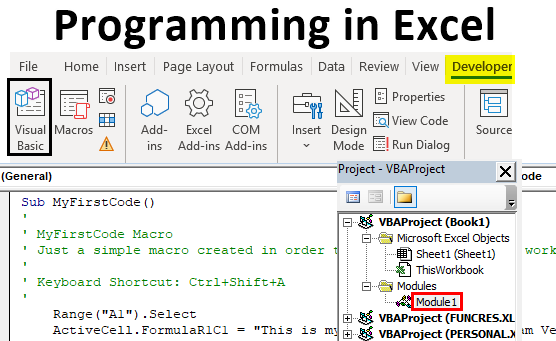
Developer Tab
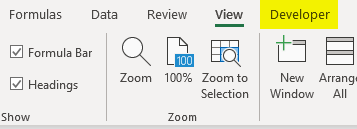
To write VBA, you’ll need to add the Developer tab to the ribbon, so you’ll see the ribbon like this.
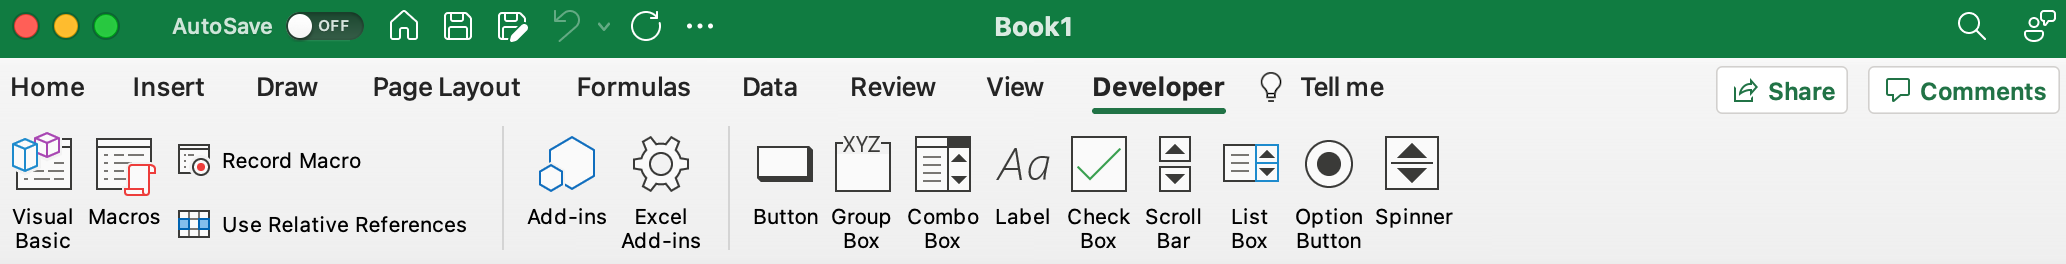
To add the Developer tab to the ribbon:
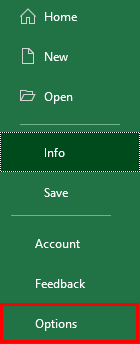
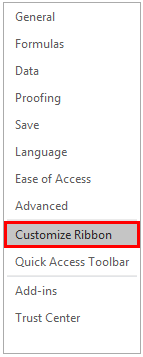
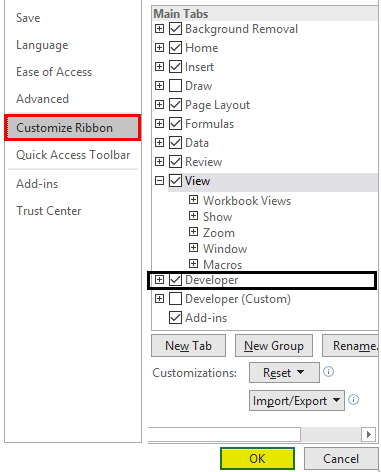
- On the File tab, go to Options > Customize Ribbon.
- Under Customize the Ribbon and under Main Tabs, select the Developer check box.
After you show the tab, the Developer tab stays visible, unless you clear the check box or have to reinstall Excel. For more information, see Microsoft help documentation.
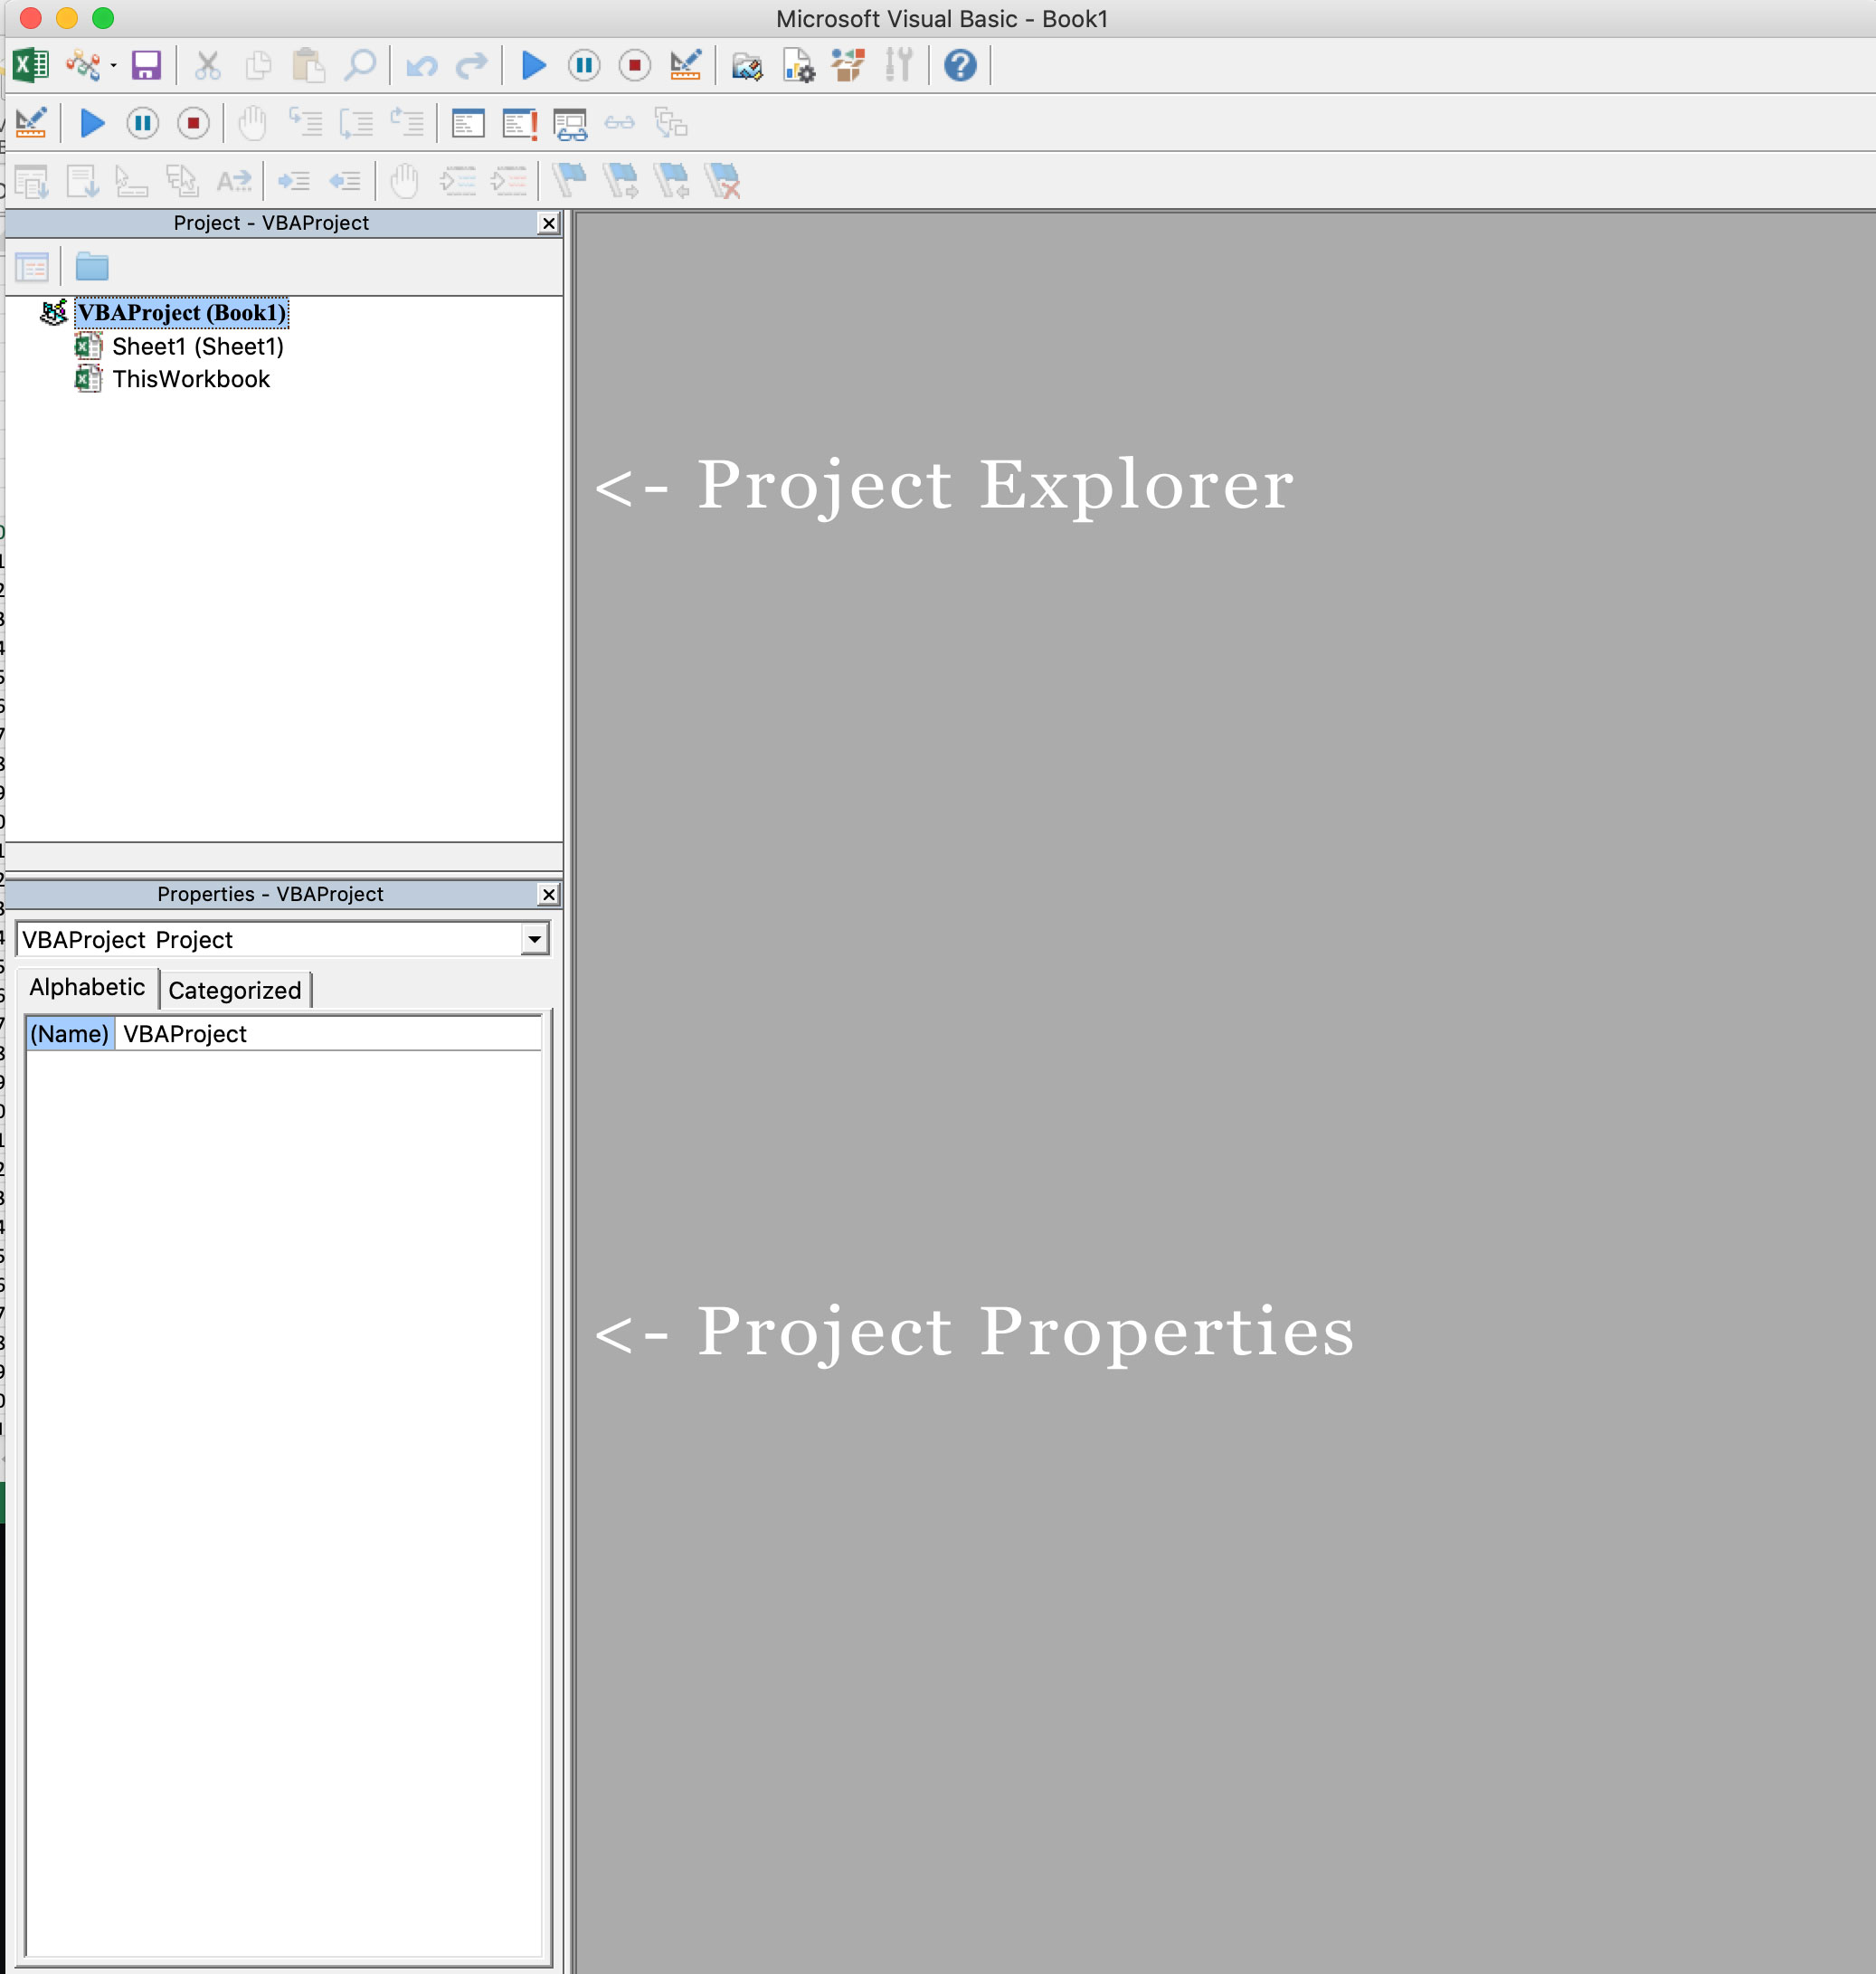
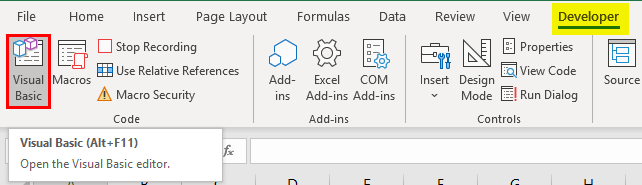
VBA Editor
Navigate to the Developer Tab, and click the Visual Basic button. A new window will pop up — this is the Visual Basic Editor. For the purposes of this tutorial, you just need to be familiar with the Project Explorer pane and the Property Properties pane.
Excel VBA Examples
First, let’s create a file for us to play around in.
- Open a new Excel file
- Save it as a macro-enabled workbook (. xlsm)
- Select the Developer tab
- Open the VBA Editor
Let’s rock and roll with some easy examples to get you writing code in a spreadsheet using Visual Basic.
Example #1: Display a Message when Users Open the Excel Workbook
In the VBA Editor, select Insert -> New Module
Write this code in the Module window (don’t paste!):
Sub Auto_Open()
MsgBox («Welcome to the XYZ Workbook.»)
End Sub
Save, close the workbook, and reopen the workbook. This dialog should display.
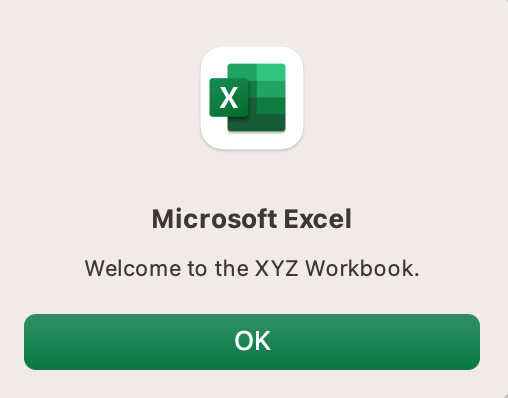
Ta da!
How is it doing that?
Depending on your familiarity with programming, you may have some guesses. It’s not particularly complex, but there’s quite a lot going on:
- Sub (short for “Subroutine): remember from the beginning, “a group of VBA statements that performs one or more actions.”
- Auto_Open: this is the specific subroutine. It automatically runs your code when the Excel file opens — this is the event that triggers the procedure. Auto_Open will only run when the workbook is opened manually; it will not run if the workbook is opened via code from another workbook (Workbook_Open will do that, learn more about the difference between the two).
- By default, a subroutine’s access is public. This means any other module can use this subroutine. All examples in this tutorial will be public subroutines. If needed, you can declare subroutines as private. This may be needed in some situations. Learn more about subroutine access modifiers.
- msgBox: this is a function — a group of VBA statements that performs one or more actions and returns a value. The returned value is the message “Welcome to the XYZ Workbook.”
In short, this is a simple subroutine that contains a function.
When could I use this?
Maybe you have a very important file that is accessed infrequently (say, once a quarter), but automatically updated daily by another VBA procedure. When it is accessed, it’s by many people in multiple departments, all across the company.
- Problem: Most of the time when users access the file, they are confused about the purpose of this file (why it exists), how it is updated so often, who maintains it, and how they should interact with it. New hires always have tons of questions, and you have to field these questions over and over and over again.
- Solution: create a user message that contains a concise answer to each of these frequently answered questions.
Real World Examples
- Use the MsgBox function to display a message when there is any event: user closes an Excel workbook, user prints, a new sheet is added to the workbook, etc.
- Use the MsgBox function to display a message when a user needs to fulfill a condition before closing an Excel workbook
- Use the InputBox function to get information from the user
Example #2: Allow User to Execute another Procedure
In the VBA Editor, select Insert -> New Module
Write this code in the Module window (don’t paste!):
Sub UserReportQuery()
Dim UserInput As Long
Dim Answer As Integer
UserInput = vbYesNo
Answer = MsgBox(«Process the XYZ Report?», UserInput)
If Answer = vbYes Then ProcessReport
End Sub
Sub ProcessReport()
MsgBox («Thanks for processing the XYZ Report.»)
End Sub
Save and navigate back to the Developer tab of Excel and select the “Button” option. Click on a cell and assign the UserReportQuery macro to the button.
Now click the button. This message should display:
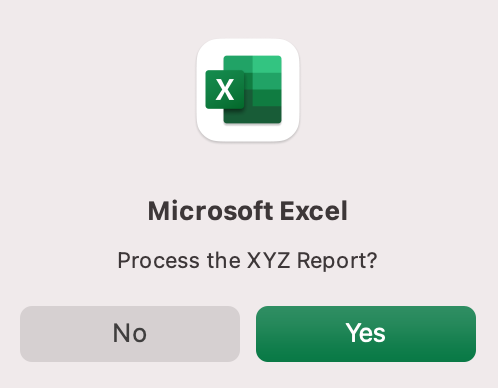
Click “yes” or hit Enter.
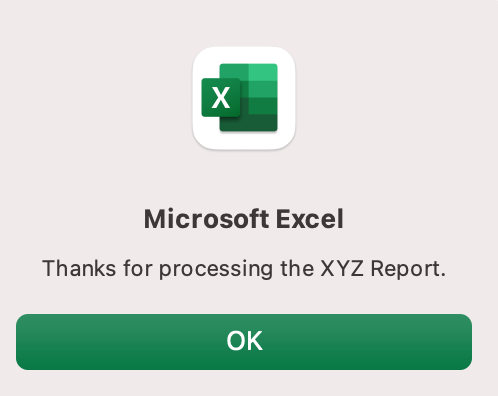
Once again, tada!
Please note that the secondary subroutine, ProcessReport, could be anything. I’ll demonstrate more possibilities in example #3. But first…
How is it doing that?
This example builds on the previous example and has quite a few new elements. Let’s go over the new stuff:
- Dim UserInput As Long: Dim is short for “dimension” and allows you to declare variable names. In this case, UserInput is the variable name and Long is the data type. In plain English, this line means “Here’s a variable called “UserInput”, and it’s a Long variable type.”
- Dim Answer As Integer: declares another variable called “Answer,” with a data type of Integer. Learn more about data types here.
- UserInput = vbYesNo: assigns a value to the variable. In this case, vbYesNo, which displays Yes and No buttons. There are many button types, learn more here.
- Answer = MsgBox(“Process the XYZ Report?”, UserInput): assigns the value of the variable Answer to be a MsgBox function and the UserInput variable. Yes, a variable within a variable.
- If Answer = vbYes Then ProcessReport: this is an “If statement,” a conditional statement, which allows us to say if x is true, then do y. In this case, if the user has selected “Yes,” then execute the ProcessReport subroutine.
When could I use this?
This could be used in many, many ways. The value and versatility of this functionality is more so defined by what the secondary subroutine does.
For example, maybe you have a file that is used to generate 3 different weekly reports. These reports are formatted in dramatically different ways.
- Problem: Each time one of these reports needs to be generated, a user opens the file and changes formatting and charts; so on and so forth. This file is being edited extensively at least 3 times per week, and it takes at least 30 minutes each time it’s edited.
- Solution: create 1 button per report type, which automatically reformats the necessary components of the reports and generates the necessary charts.
Real World Examples
- Create a dialog box for user to automatically populate certain information across multiple sheets
- Use the InputBox function to get information from the user, which is then populated across multiple sheets
Example #3: Add Numbers to a Range with a For-Next Loop
For loops are very useful if you need to perform repetitive tasks on a specific range of values — arrays or cell ranges. In plain English, a loop says “for each x, do y.”
In the VBA Editor, select Insert -> New Module
Write this code in the Module window (don’t paste!):
Sub LoopExample()
Dim X As Integer
For X = 1 To 100
Range(«A» & X).Value = X
Next X
End Sub
Save and navigate back to the Developer tab of Excel and select the Macros button. Run the LoopExample macro.
This should happen:
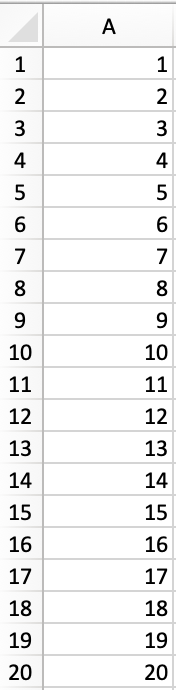
Etc, until the 100th row.
How is it doing that?
- Dim X As Integer: declares the variable X as a data type of Integer.
- For X = 1 To 100: this is the start of the For loop. Simply put, it tells the loop to keep repeating until X = 100. X is the counter. The loop will keep executing until X = 100, execute one last time, and then stop.
- Range(«A» & X).Value = X: this declares the range of the loop and what to put in that range. Since X = 1 initially, the first cell will be A1, at which point the loop will put X into that cell.
- Next X: this tells the loop to run again
When could I use this?
The For-Next loop is one of the most powerful functionalities of VBA; there are numerous potential use cases. This is a more complex example that would require multiple layers of logic, but it communicates the world of possibilities in For-Next loops.
Maybe you have a list of all products sold at your bakery in Column A, the type of product in Column B (cakes, donuts, or muffins), the cost of ingredients in Column C, and the market average cost of each product type in another sheet.
You need to figure out what should be the retail price of each product. You’re thinking it should be the cost of ingredients plus 20%, but also 1.2% under market average if possible. A For-Next loop would allow you to do this type of calculation.
Real World Examples
- Use a loop with a nested if statement to add specific values to a separate array only if they meet certain conditions
- Perform mathematical calculations on each value in a range, e.g. calculate additional charges and add them to the value
- Loop through each character in a string and extract all numbers
- Randomly select a number of values from an array
Conclusion
Now that we’ve talked about pizza and muffins and oh-yeah, how to write VBA code in Excel spreadsheets, let’s do a learning check. See if you can answer these questions.
- What is VBA?
- How do I get set up to start using VBA in Excel?
- Why and when would you use VBA?
- What are some problems I could solve with VBA?
If you have a fair idea of how to you could answer these questions, then this was successful.
Whether you’re an occasional user or a power user, I hope this tutorial provided useful information about what can be accomplished with just a bit of code in your Excel spreadsheets.
Happy coding!
Learning Resources
- Excel VBA Programming for Dummies, John Walkenbach
- Get Started with VBA, Microsoft Documentation
- Learning VBA in Excel, Lynda
A bit about me
I’m Chloe Tucker, an artist and developer in Portland, Oregon. As a former educator, I’m continuously searching for the intersection of learning and teaching, or technology and art. Reach out to me on Twitter @_chloetucker and check out my website at chloe.dev.
Learn to code for free. freeCodeCamp’s open source curriculum has helped more than 40,000 people get jobs as developers. Get started
Excel Programming (Table of Contents)
- Introduction to Programming in Excel
- How to Program in Excel?
Introduction to Programming in Excel
Have you ever been tired of doing a task in Excel which you feel can be automated and save your time? Most of the time, you must have encountered such tasks. However, in order to automate any task, you first need to have programming skills for that particular language. In Excel, you can do programming with the help of Visual Basic for Application (VBA) which is Excel’s own programming language that can help you to automate the tasks. In this article, we will see how we can do programming in Excel VBA. VBA can be used to write a program that can automate the task for you. The piece of lines we write under VBA is called Macro, which is written in such a way that they instruct the Excel system about what to be done.
How to Program in Excel?
Let’s understand how to Program in excel with few illustrations.
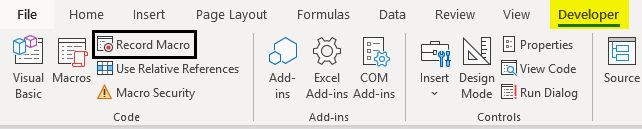
Enabling Developer Tab
The first thing that comes is enabling the developer tab that helps you to record and store a macro (VBA Code). Let us see how we can get that enabled.
- Navigate to the File menu in your excel file and click on it.
- Within the File menu, click on Options, and it will load a new window with all excel options available.
- In the new window that popped up named Excel Options, click on the Customize Ribbon tab. You can see all the customization options you can use for Excel Ribbon, which appears at the top of your Excel file.
- Enable Developer option under Main Tabs dropdown within Customize the Ribbon: section. You can check (tick-mark) the Developer tab to enable it. Click the OK button placed at the bottom right of the Excel Options tab, and that’s it.
- You have successfully enabled the Developer option within your excel. If you check the Excel Ribbon in your file now, you’ll be able to see a new tab added there with the name Developer on it.
This is the first step you need to follow before you start writing macros in Excel. Because the Developer tab is needed to record and run the macro, this option tab is not by default enabled, which is why we tried enabling it here first.
Recording a Macro
- Open the Excel file. Navigate towards the Developer tab you just enabled and then click on the Record Macro button, categorized and can be seen under the Code section.
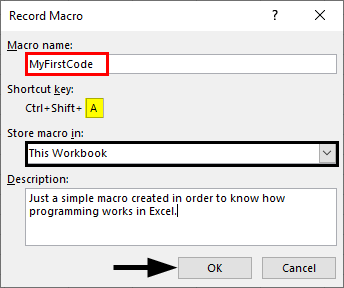
- As soon as you click on the Record Macro button, you’ll see a window popping up; in that window, you must have to assign a name to the macro; you can also assign a shortcut key for this macro to run. Can you add the description, if any, for this macro you are creating? Once you are done with all this, you can click on the OK button placed at the right bottom of the window. See the screenshot below for your reference.
As soon as you click OK, the system starts recording the macro and all the tasks you perform will be recorded and converted to Excel Program in the backend.
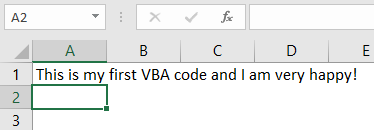
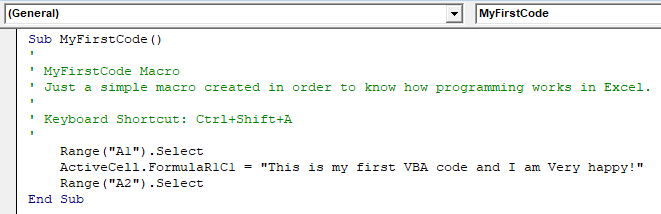
- Try typing the sentence “This is my first VBA code, and I am very happy!” in cell A1 within the Excel sheet and press Enter key. These steps will be recorded in the backend of the macro.
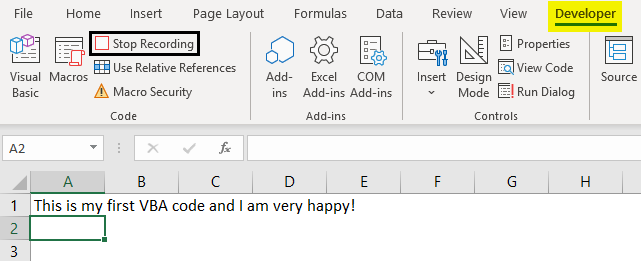
- Under the Code section, you might have observed that the Record Macro button has changed to Stop Recording. This is like Play and Stop. Record Macro Works as Play button and Stop Recording work as Stop button. Click on the Stop Recording button to stop the recording.
The magic behind all this is, Excel has recorded my steps here and converted those into pieces of code so that this task can be automated. It means, every single step, selecting cell A1, inputting the text as “This is my first VBA code, and I am happy!”, clicking Enter to go to the next cell. All these steps are converted into a VBA code. Let’s check the code now.
- In order to go to Visual Basic Editor, you can click on the Visual Basic option under the Code category in the Developer tab, or you can use Alt + F11 as a shortcut for the same.
- Navigate towards the Modules section under VBAProject and click on the plus button under it to see the list of active modules in VBA.
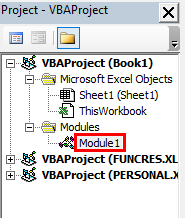
- Inside the Modules folder, you can see Module1 as soon as you click on the plus sign. You can double click on Module1; it is where your code for the task we performed in previous steps (Step 3 and 4) are recorded. Save this code, and you can run it every time to get the same output. See the screenshot below:
Conclusion
- We can record a macro in Excel to automate day to day small tasks, which are simpler for the system to manipulate programmatically.
- The cool thing about it is you don’t need to dig your head deep for the logic behind each step you perform. Excel VBA does it for you.
- For some complex tasks, such as the one which involves looping and conditional statements, you need to write code manually under VBA.
Things to Remember About Programming in Excel
- The Developers tab is not by default enabled and visible to you in Excel Ribbon. You need to enable it through Excel Options.
- Recording a macro works on simple tasks that are repeating, and you need those to be automated. However, for complex tasks which involve looping or Conditional Inputs and Outputs are still need to be coded manually under VBA.
- You need to save the file as an Excel-Macro Enable file format in order to be able to read and run the code again on your excel.
Recommended Articles
This is a guide to Programming in Excel. Here we discuss how to Program in Excel along with practical examples and a downloadable excel template. You can also go through our other suggested articles –
- Ribbon in Excel
- TRIM Formula in Excel
- Project Management Template in Excel
- COUNTIFS in Excel
You all must have worked with Excel at some time in your life and must have felt the need for automating some repetitive or tedious task. Don’t worry in this tutorial we are going to learn about how to work with Excel using Python, or automating Excel using Python. We will be covering this with the help of the Openpyxl module.
Getting Started
Openpyxl is a Python library that provides various methods to interact with Excel Files using Python. It allows operations like reading, writing, arithmetic operations, plotting graphs, etc.
This module does not come in-built with Python. To install this type the below command in the terminal.
pip install openpyxl
Reading from Spreadsheets
To read an Excel file you have to open the spreadsheet using the load_workbook() method. After that, you can use the active to select the first sheet available and the cell attribute to select the cell by passing the row and column parameter. The value attribute prints the value of the particular cell. See the below example to get a better understanding.
Note: The first row or column integer is 1, not 0.
Dataset Used: It can be downloaded from here.
Example:
Python3
import openpyxl
path = "gfg.xlsx"
wb_obj = openpyxl.load_workbook(path)
sheet_obj = wb_obj.active
cell_obj = sheet_obj.cell(row = 1, column = 1)
print(cell_obj.value)
Output:
Name
Reading from Multiple Cells
There can be two ways of reading from multiple cells.
Method 1: We can get the count of the total rows and columns using the max_row and max_column respectively. We can use these values inside the for loop to get the value of the desired row or column or any cell depending upon the situation. Let’s see how to get the value of the first column and first row.
Example:
Python3
import openpyxl
path = "gfg.xlsx"
wb_obj = openpyxl.load_workbook(path)
sheet_obj = wb_obj.active
row = sheet_obj.max_row
column = sheet_obj.max_column
print("Total Rows:", row)
print("Total Columns:", column)
print("nValue of first column")
for i in range(1, row + 1):
cell_obj = sheet_obj.cell(row = i, column = 1)
print(cell_obj.value)
print("nValue of first row")
for i in range(1, column + 1):
cell_obj = sheet_obj.cell(row = 2, column = i)
print(cell_obj.value, end = " ")
Output:
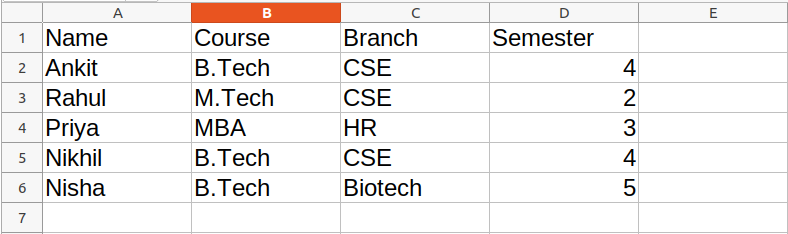
Total Rows: 6
Total Columns: 4

Value of first column
Name
Ankit
Rahul
Priya
Nikhil
Nisha

Value of first row
Ankit  B.Tech CSE 4
Method 2: We can also read from multiple cells using the cell name. This can be seen as the list slicing of Python.
Python3
import openpyxl
path = "gfg.xlsx"
wb_obj = openpyxl.load_workbook(path)
sheet_obj = wb_obj.active
cell_obj = sheet_obj['A1': 'B6']
for cell1, cell2 in cell_obj:
print(cell1.value, cell2.value)
Output:
Name Course
Ankit  B.Tech
Rahul M.Tech
Priya MBA
Nikhil B.Tech
Nisha B.Tech
Refer to the below article to get detailed information about reading excel files using openpyxl.
- Reading an excel file using Python openpyxl module
Writing to Spreadsheets
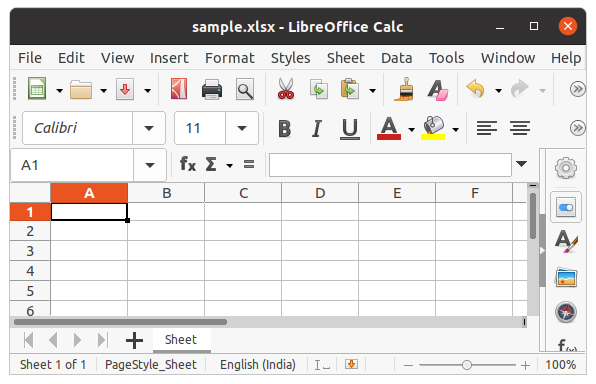
First, let’s create a new spreadsheet, and then we will write some data to the newly created file. An empty spreadsheet can be created using the Workbook() method. Let’s see the below example.
Example:
Python3
from openpyxl import Workbook
workbook = Workbook()
workbook.save(filename="sample.xlsx")
Output:
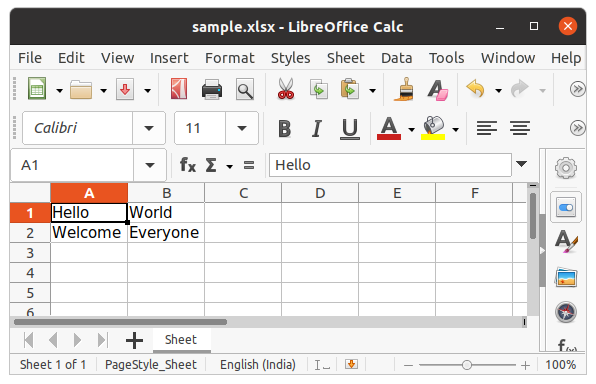
After creating an empty file, let’s see how to add some data to it using Python. To add data first we need to select the active sheet and then using the cell() method we can select any particular cell by passing the row and column number as its parameter. We can also write using cell names. See the below example for a better understanding.
Example:
Python3
import openpyxl
wb = openpyxl.Workbook()
sheet = wb.active
c1 = sheet.cell(row = 1, column = 1)
c1.value = "Hello"
c2 = sheet.cell(row= 1 , column = 2)
c2.value = "World"
c3 = sheet['A2']
c3.value = "Welcome"
c4 = sheet['B2']
c4.value = "Everyone"
wb.save("sample.xlsx")
Output:
Refer to the below article to get detailed information about writing to excel.
- Writing to an excel file using openpyxl module
Appending to the Spreadsheet
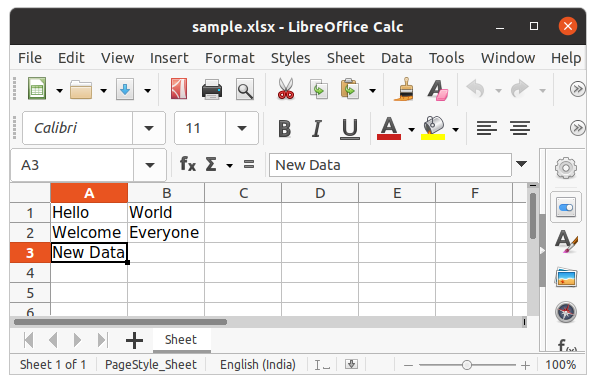
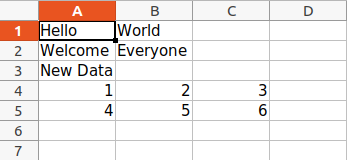
In the above example, you will see that every time you try to write to a spreadsheet the existing data gets overwritten, and the file is saved as a new file. This happens because the Workbook() method always creates a new workbook file object. To write to an existing workbook you must open the file with the load_workbook() method. We will use the above-created workbook.
Example:
Python3
import openpyxl
wb = openpyxl.load_workbook("sample.xlsx")
sheet = wb.active
c = sheet['A3']
c.value = "New Data"
wb.save("sample.xlsx")
Output:
We can also use the append() method to append multiple data at the end of the sheet.
Example:
Python3
import openpyxl
wb = openpyxl.load_workbook("sample.xlsx")
sheet = wb.active
data = (
(1, 2, 3),
(4, 5, 6)
)
for row in data:
sheet.append(row)
wb.save('sample.xlsx')
Output:
Arithmetic Operation on Spreadsheet
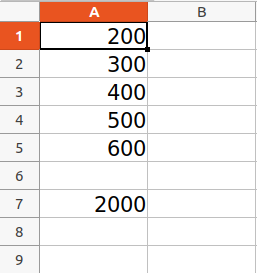
Arithmetic operations can be performed by typing the formula in a particular cell of the spreadsheet. For example, if we want to find the sum then =Sum() formula of the excel file is used.
Example:
Python3
import openpyxl
wb = openpyxl.Workbook()
sheet = wb.active
sheet['A1'] = 200
sheet['A2'] = 300
sheet['A3'] = 400
sheet['A4'] = 500
sheet['A5'] = 600
sheet['A7'] = '= SUM(A1:A5)'
wb.save("sum.xlsx")
Output:
Refer to the below article to get detailed information about the Arithmetic operations on Spreadsheet.
- Arithmetic operations in excel file using openpyxl
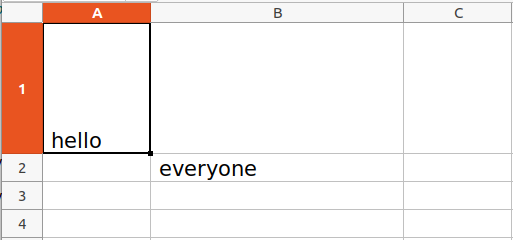
Adjusting Rows and Column
Worksheet objects have row_dimensions and column_dimensions attributes that control row heights and column widths. A sheet’s row_dimensions and column_dimensions are dictionary-like values; row_dimensions contains RowDimension objects and column_dimensions contains ColumnDimension objects. In row_dimensions, one can access one of the objects using the number of the row (in this case, 1 or 2). In column_dimensions, one can access one of the objects using the letter of the column (in this case, A or B).
Example:
Python3
import openpyxl
wb = openpyxl.Workbook()
sheet = wb.active
sheet.cell(row = 1, column = 1).value = ' hello '
sheet.cell(row = 2, column = 2).value = ' everyone '
sheet.row_dimensions[1].height = 70
sheet.column_dimensions['B'].width = 20
wb.save('sample.xlsx')
Output:
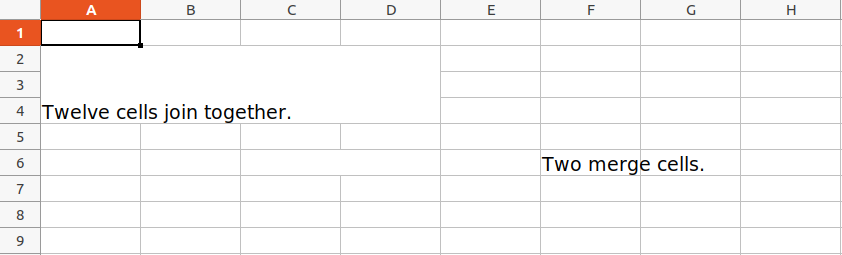
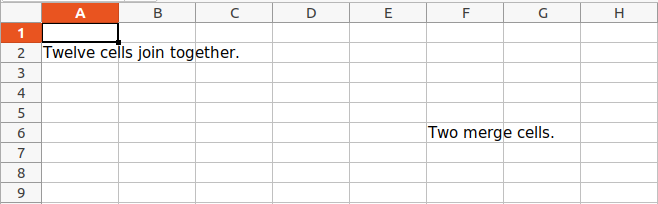
Merging Cells
A rectangular area of cells can be merged into a single cell with the merge_cells() sheet method. The argument to merge_cells() is a single string of the top-left and bottom-right cells of the rectangular area to be merged.
Example:
Python3
import openpyxl
wb = openpyxl.Workbook()
sheet = wb.active
sheet.merge_cells('A2:D4')
sheet.cell(row = 2, column = 1).value = 'Twelve cells join together.'
sheet.merge_cells('C6:D6')
sheet.cell(row = 6, column = 6).value = 'Two merge cells.'
wb.save('sample.xlsx')
Output:
Unmerging Cells
To unmerge cells, call the unmerge_cells() sheet method.
Example:
Python3
import openpyxl
wb = openpyxl.load_workbook('sample.xlsx')
sheet = wb.active
sheet.unmerge_cells('A2:D4')
sheet.unmerge_cells('C6:D6')
wb.save('sample.xlsx')
Output:
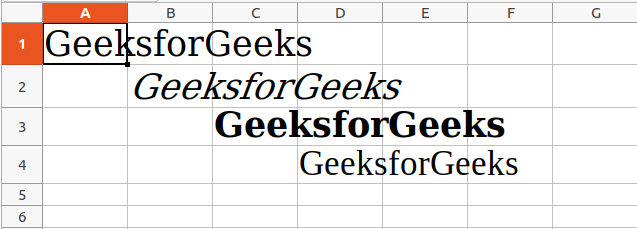
Setting Font Style
To customize font styles in cells, important, import the Font() function from the openpyxl.styles module.
Example:
Python3
import openpyxl
from openpyxl.styles import Font
wb = openpyxl.Workbook()
sheet = wb.active
sheet.cell(row = 1, column = 1).value = "GeeksforGeeks"
sheet.cell(row = 1, column = 1).font = Font(size = 24 )
sheet.cell(row = 2, column = 2).value = "GeeksforGeeks"
sheet.cell(row = 2, column = 2).font = Font(size = 24, italic = True)
sheet.cell(row = 3, column = 3).value = "GeeksforGeeks"
sheet.cell(row = 3, column = 3).font = Font(size = 24, bold = True)
sheet.cell(row = 4, column = 4).value = "GeeksforGeeks"
sheet.cell(row = 4, column = 4).font = Font(size = 24, name = 'Times New Roman')
wb.save('sample.xlsx')
Output:
Refer to the below article to get detailed information about adjusting rows and columns.
- Adjusting rows and columns of an excel file using openpyxl module
Plotting Charts
Charts are composed of at least one series of one or more data points. Series themselves are comprised of references to cell ranges. For plotting the charts on an excel sheet, firstly, create chart objects of specific chart class( i.e BarChart, LineChart, etc.). After creating chart objects, insert data in it, and lastly, add that chart object in the sheet object.
Example 1:
Python3
import openpyxl
from openpyxl.chart import BarChart, Reference
wb = openpyxl.Workbook()
sheet = wb.active
for i in range(10):
sheet.append([i])
values = Reference(sheet, min_col=1, min_row=1,
max_col=1, max_row=10)
chart = BarChart()
chart.add_data(values)
chart.title = " BAR-CHART "
chart.x_axis.title = " X_AXIS "
chart.y_axis.title = " Y_AXIS "
sheet.add_chart(chart, "E2")
wb.save("sample.xlsx")
Output:

Example 2:
Python3
import openpyxl
from openpyxl.chart import LineChart, Reference
wb = openpyxl.Workbook()
sheet = wb.active
for i in range(10):
sheet.append([i])
values = Reference(sheet, min_col=1, min_row=1,
max_col=1, max_row=10)
chart = LineChart()
chart.add_data(values)
chart.title = " LINE-CHART "
chart.x_axis.title = " X-AXIS "
chart.y_axis.title = " Y-AXIS "
sheet.add_chart(chart, "E2")
wb.save("sample.xlsx")
Output:

Refer to the below articles to get detailed information about plotting in excel using Python.
- Plotting charts in excel sheet using openpyxl module | Set 1
- Plotting charts in excel sheet using openpyxl module | Set 2
- Plotting charts in excel sheet using openpyxl module | Set 3
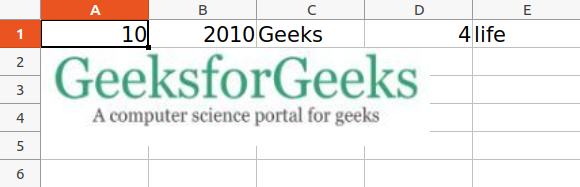
Adding Images
For the purpose of importing images inside our worksheet, we would be using openpyxl.drawing.image.Image. The method is a wrapper over PIL.Image method found in PIL (pillow) library. Due to which it is necessary for the PIL (pillow) library to be installed in order to use this method.
Image Used:

Example:
Python3
import openpyxl
from openpyxl.drawing.image import Image
wb = openpyxl.Workbook()
sheet = wb.active
sheet.append([10, 2010, "Geeks", 4, "life"])
img = Image("geek.jpg")
sheet.add_image(img, 'A2')
wb.save('sample.xlsx')
Output:
Refer to the below article to get detailed information about adding images.
- Openpyxl – Adding Image
Some More Functionality of Excel using Python
- How to delete one or more rows in excel using Openpyxl?
- Trigonometric operations in excel file using openpyxl
- How to copy data from one excel sheet to another
- How to Automate an Excel Sheet in Python?
Excel is considered one of the most popular and widely used spreadsheet applications developed by Microsoft. You can organize, analyze and store your data into tabular sheets with the help of Excel. From analysts and sales managers to CEOs, professionals from every field use Excel for creating quick statistics and for data crunching. These features make excel one of Python programs’ most popular data sources.
Check out the use of Self in Python with examples here.
Spreadsheets are commonly used in the present world because of their intuitive nature and ability to handle large datasets. Most importantly, they can work without any prior technical background.

Finding different ways to work with Excel using code is essential since working with data and in Python has some serious advantages in comparison with Excel’s UI. Developers of Python have implemented ways to read, write and manipulate Excel documents. An instructor-led Python Programming course is a good way to get hands-on experience in using excel within Python.
You can check the quality of your spreadsheet application by going over the checklist below:
- Is the spreadsheet able to represent static data?
- Is the spreadsheet able to mix data, calculations, and reports?
- Is the data in your spreadsheet complete and consistent in nature?
- Does the spreadsheet have an organized worksheet structure?
This checklist will help you in verifying the qualitative nature of the spreadsheet application you’re going to work on.
Practical Applications
In this article, we will be using openpyxl to work on data. With the help of this module, you can extract data from a database into an Excel spreadsheet, or you can also convert an Excel spreadsheet into a programmatic format. There can be a lot of possible situations where you might feel the need to use a package like openpyxl. Let us discuss a few of them to get a comprehensive overview of them.
Importing New Products Into a Database
Consider yourself working in an online store company. When they want to add new products to the online store, they make an Excel spreadsheet with a few hundred rows along with the product’s name, description, price, and a few more basic information, then give it to you.

Now, if you want to import this particular data, you need to iterate over each row of the spreadsheet and then add each of the products to the database of the online store.
Exporting Database Data Into a Spreadsheet
Consider you have a Database table. In this particular table, you have collected information about all your users which includes their names, contact number, email address, and so forth. Now, the Marketing Team is willing to collectively contact all the users and promote a new product of the company. However, neither do they have access to the Database nor do they have any idea about using SQL to extract the information.
In this situation, openpyxl comes to play. You can use it effectively to iterate over each User record and transform the required information into an Excel spreadsheet.
Appending Information to an Existing Spreadsheet
Consider the same online store example we discussed above. You have an Excel spreadsheet with a list of users, and your job is to append to each row the total amount they have spent in your store.
In order to perform this, you have to read the spreadsheet first and then iterate through each row and fetch the total amount spent from the Database. Finally, you need to write it back to the spreadsheet.
Starting openpyxl
You can install the openpyxl package using pip. Open your terminal and write the following command:
$ pip install openpyxl
After you have installed the spreadsheet, you can make up your own simple spreadsheet:
from openpyxl import Workbook

workbook = Workbook()
spreadsheet = workbook.active

spreadsheet["A1"] = "Hello"
spreadsheet["B1"] = "World!"

workbook.save(filename="HelloWorld.xlsx")
How to Read Excel Spreadsheets with openpyxl
Let us start with the most important thing that you can do with a spreadsheet,i.e. read it. We will be using a watch sample dataset which contains a list of 100 watches with information like product name, product ID, review, and so forth.
A Simple Way to Read an Excel Spreadsheet
Let us start by opening our sample spreadsheet:
>>> from openpyxl import load_workbook
>>> workbook = load_workbook(filename="sample.xlsx")
>>> workbook.sheetnames
['Sheet 1']

>>> spreadsheet = workbook.active
>>> spreadsheet
<Worksheet "Sheet 1">

>>> spreadsheet.title
In the example code above, we open the spreadsheet using load_workbook, and then we check all the sheets that are available to work with using workbook.sheetnames. Then Sheet 1 is automatically selected using workbook.active since it is the first sheet available. This is the most common way of opening a spreadsheet.
Now, let us see the code to retrieve data from the spreadsheet:
>>> spreadsheet["A1"]
<Cell 'Sheet 1'.A1>

>>> spreadsheet["A1"].value
'marketplace'

>>> spreadsheet["F10"].value
"G-Shock Men's Grey Sport Watch"
You can retrieve the actual value and the cell value both. To get the actual value, use .valueand to get the cell, you can use .cell():
>>> spreadsheet.cell(row=10, column=6)
<Cell 'Sheet 1'.F10>

>>> spreadsheet.cell(row=10, column=6).value
"G-Shock Men's Grey Sport Watch"
Importing Data from a Spreadsheet
In this section, we will discuss how to iterate through the data and conversion into a more useful format using Python.
Let us first start with iterating through the data. There are a number of iterating methods that depend solely on the user.
You can slice the data with a combination of rows and columns:
>>> spreadsheet["A1:C2"]
((<Cell 'Sheet 1'.A1>, <Cell 'Sheet 1'.B1>, <Cell 'Sheet 1'.C1>),
 (<Cell 'Sheet 1'.A2>, <Cell 'Sheet 1'.B2>, <Cell 'Sheet 1'.C2>))
You can also iterate through the dataset by ranging between rows and columns:
>>> # Get all cells from column A
>>> spreadsheet["A"]
(<Cell 'Sheet 1'.A1>,
 <Cell 'Sheet 1'.A2>,
 ...
 <Cell 'Sheet 1'.A99>,
 <Cell 'Sheet 1'.A100>)

>>> # Get all cells for a range of columns
>>> spreadsheet["A:B"]
((<Cell 'Sheet 1'.A1>,
  <Cell 'Sheet 1'.A2>,
  ...
  <Cell 'Sheet 1'.A99>,
  <Cell 'Sheet 1'.A100>),
 (<Cell 'Sheet 1'.B1>,
  <Cell 'Sheet 1'.B2>,
  ...
  <Cell 'Sheet 1'.B99>,
  <Cell 'Sheet 1'.B100>))

>>> # Get all cells from row 5
>>> spreadsheet[5]
(<Cell 'Sheet 1'.A5>,
 <Cell 'Sheet 1'.B5>,
 ...
 <Cell 'Sheet 1'.N5>,
 <Cell 'Sheet 1'.O5>)

>>> # Get all cells for a range of rows
>>> spreadsheet[5:6]
((<Cell 'Sheet 1'.A5>,
  <Cell 'Sheet 1'.B5>,
  ...
  <Cell 'Sheet 1'.N5>,
  <Cell 'Sheet 1'.O5>),
 (<Cell 'Sheet 1'.A6>,
  <Cell 'Sheet 1'.B6>,
  ...
  <Cell 'Sheet 1'.N6>,
  <Cell 'Sheet 1'.O6>))
Python offers arguments by which you can set limits to the iteration with the help of Python generators like .iter_rows() and .iter_cols():
>>> for row in spreadsheet.iter_rows(min_row=1,
...                           max_row=2,
...                           min_col=1,
...                           max_col=3):
...    print(row)
(<Cell 'Sheet 1'.A1>, <Cell 'Sheet 1'.B1>, <Cell 'Sheet 1'.C1>)
(<Cell 'Sheet 1'.A2>, <Cell 'Sheet 1'.B2>, <Cell 'Sheet 1'.C2>)

>>> for column in spreadsheet.iter_cols(min_row=1,
...                              max_row=2,
...                              min_col=1,
...                              max_col=3):
... print(column)
(<Cell 'Sheet 1'.A1>, <Cell 'Sheet 1'.A2>)
(<Cell 'Sheet 1'.B1>, <Cell 'Sheet 1'.B2>)
(<Cell 'Sheet 1'.C1>, <Cell 'Sheet 1'.C2>)
You can also add Boolean values_only in the above example and set it to True to get the values of cell:
>>> for value in spreadsheet.iter_rows(min_row=1,
...                          max_row=2,
...                          min_col=1,
...                          max_col=3,
...                          values_only=True):
...    print(value)
('marketplace', 'customer_id', 'review_id')
('US', 3653882, 'R3O9SGZBVQBV76')
Since we are now done with iterating the data, let us now manipulate data using Python’s primitive data structures.
Consider a situation where you want to extract information about a product from the sample spreadsheet and then store it in the dictionary. The key to the dictionary would be the product ID.
Convert Data into Python classes
To convert data into Python data classes, let us first decide what we want to store and how to store it.
The two essential elements that can be extracted from the data are as follows:

1. Products 2. Review
• ID • ID
• Title • Customers ID
• Parent • Headline
• Category • Body
• Date
Let us implement the two elements:
import datetime
from dataclasses import dataclass

@dataclass
class Product:
    id: str
    parent: str
    title: str
    category: str
@dataclass
class Review:
    id: str
    customer_id: str
    stars: int
    headline: str
    body: str
    date: datetime.datetime
The next step is to create a mapping between columns and the required fields:
>>> for value in spreadsheet.iter_rows(min_row=1,
...                             max_row=1,
...                             values_only=True):
...    print(value)
('marketplace', 'customer_id', 'review_id', 'product_id', ...)

>>> # Or an alternative
>>> for cell in sheet[1]:
...  print(cell.value)
marketplace
Customer_ID
Review_ID
Product_ID
Product_Parent
...
Finally, let us convert the data into new structures which will parse the data in the spreadsheet into a list of products and review objects:
from datetime import datetime
from openpyxl import load_workbook
from classes import Product,Review
from mapping import PRODUCT_ID,PRODUCT_PARENT,PRODUCT_TITLE,
    PRODUCT_CATEGORY,REVIEW_DATE,REVIEW_ID,REVIEW_CUSTOMER,
    REVIEW_STARS,REVIEW_HEADLINE,REVIEW_BODY

# Using the read_only method since you're not gonna be editing the spreadsheet
workbook = load_workbook(filename="watch_sample.xlsx",read_only=True)
spreadsheet = workbook.active

products = []
reviews = []

# Using the values_only because you just want to return the cell value
for row in spreadsheet .iter_rows(min_row=2, values_only=True):
    product = Product(id=row[PRODUCT_ID],
                      parent=row[PRODUCT_PARENT],
                      title=row[PRODUCT_TITLE],
                      category=row[PRODUCT_CATEGORY])
    products.append(product)
# You need to parse the date from the spreadsheet into a datetime format
spread_date = row[REVIEW_DATE]
parsed_date = datetime.strptime(spread_date,"%Y-%m-%d")

review = Review(id=row[REVIEW_ID],
              Customer_ID=row[REVIEW_CUSTOMER],
              stars=row[REVIEW_STARS],
              headline=row[REVIEW_HEADLINE],
              body=row[REVIEW_BODY],
              date=parsed_date)
reviews.append(review)

print(products[0])
print(reviews[0])
After you execute the code, you will get an output that looks like this:
Product(id='A90FALZ1ZC',parent=937111370,...)
Review(id='D3O9OGZVVQBV76',customer_id=3903882,...)
Appending Data
To understand how to append data, let us hover back to the first sample spreadsheet. We will open the document and append some data to it:
from openpyxl import load_workbook

# Start by opening the spreadsheet and selecting the main sheet
workbook = load_workbook(filename="hello_world.xlsx")
spreadsheet = workbook.active

# Write what you want into a specific cell
spreadsheet["C1"]="Manipulating_Data ;)"

# Save the spreadsheet
workbook.save(filename="hello_world_append.xlsx"
If you open your Excel file, you will notice the additional Manipulating_Data being added to an adjacent cell.
Writing Excel Spreadsheets With openpyxl
A spreadsheet is a file that helps to store data in specific rows and columns. We can calculate and store numerical data and also perform computation using formulas.
So, let’s begin with some simple Spreadsheets and understand what each line means.
1. Creating our first simple Spreadsheet
 1 from openpyxl import Workbook
 2
 3 filename = "first_program.xlsx"
 4
 5 workbook = Workbook()
 6 spreadsheet = workbook.active
 7
 8 sheet["A1"] = "first"
 9 sheet["B1"] = "program!"
10
11 workbook.save(filename=filename)
Line 5: In order to make a Spreadsheet, at first, we have to create an Empty workbook to perform further operations.
Lines 8 and 9: We can add data to a specific cell as per our requirement. In this example, we can see that two values “first” and “program” have been added to specific cells in the sheet.
Line 11: The line shows how to save data after all the operations we have done.
2. Basic Spreadsheet Operations
Before going to the difficult coding part, where a Python advanced certification might be required to land a job, you need to strengthen the building blocks like adding and updating values, managing rows and columns, adding filters, styles, or formulas in a Spreadsheet.
We have already explained the following code by which we can add values to a Spreadsheet:
>>> spreadsheet["A1"] = "the_value_we_want_to_add"
There is another way that we can add values to the Spreadsheet:
>>> cell = sheet["A1"]
>>> cell
<Cell 'Sheet'.A1>

>>> cell.value
'hello'

>>> cell.value = "hey"
Conclusion
You’ve finished that lengthy read, and now you know how to use spreadsheets in Python. Your dependable friend, openpyxl, will do the following for you:
-
Spreadsheets may be used to extract useful data in a Pythonic way.
-
Make your own spreadsheets, regardless of their complexity.
-
Enhance your spreadsheets with fun features like conditional formatting or charts.
Even though this tutorial might not have covered all openpyxl can accomplish, you can always visit the package’s official documentation page to find out more. You may even review the package’s source code and make more improvements.
If you have any questions or would need additional information on any topic, please leave a comment below.