
Excel for Microsoft 365 Excel for Microsoft 365 for Mac Excel for the web Excel 2021 Excel 2021 for Mac Excel 2019 Excel 2019 for Mac Excel 2016 Excel 2016 for Mac Excel 2013 Excel 2010 Excel 2007 Excel for Mac 2011 Excel Starter 2010 More…Less
Estimates standard deviation based on a sample. The standard deviation is a measure of how widely values are dispersed from the average value (the mean).
Important: This function has been replaced with one or more new functions that may provide improved accuracy and whose names better reflect their usage. Although this function is still available for backward compatibility, you should consider using the new functions from now on, because this function may not be available in future versions of Excel.
For more information about the new function, see STDEV.S function.
Syntax
STDEV(number1,[number2],…)
The STDEV function syntax has the following arguments:
-
Number1 Required. The first number argument corresponding to a sample of a population.
-
Number2, … Optional. Number arguments 2 to 255 corresponding to a sample of a population. You can also use a single array or a reference to an array instead of arguments separated by commas.
Remarks
-
STDEV assumes that its arguments are a sample of the population. If your data represents the entire population, then compute the standard deviation using STDEVP.
-
The standard deviation is calculated using the «n-1» method.
-
Arguments can either be numbers or names, arrays, or references that contain numbers.
-
Logical values and text representations of numbers that you type directly into the list of arguments are counted.
-
If an argument is an array or reference, only numbers in that array or reference are counted. Empty cells, logical values, text, or error values in the array or reference are ignored.
-
Arguments that are error values or text that cannot be translated into numbers cause errors.
-
If you want to include logical values and text representations of numbers in a reference as part of the calculation, use the STDEVA function.
-
STDEV uses the following formula:

where x is the sample mean AVERAGE(number1,number2,…) and n is the sample size.

Example
Copy the example data in the following table, and paste it in cell A1 of a new Excel worksheet. For formulas to show results, select them, press F2, and then press Enter. If you need to, you can adjust the column widths to see all the data.
|
Data |
||
|---|---|---|
|
Strength |
||
|
1345 |
||
|
1301 |
||
|
1368 |
||
|
1322 |
||
|
1310 |
||
|
1370 |
||
|
1318 |
||
|
1350 |
||
|
1303 |
||
|
1299 |
||
|
Formula |
Description (Result) |
Result |
|
=STDEV(A3:A12) |
Standard deviation of breaking strength (27.46392) |
27.46392 |
Need more help?
Want more options?
Explore subscription benefits, browse training courses, learn how to secure your device, and more.
Communities help you ask and answer questions, give feedback, and hear from experts with rich knowledge.
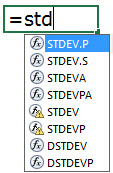
The standard deviation shows the variability of the data values from the mean (average). In Excel, the STDEV and STDEV.S calculate sample standard deviation while STDEVP and STDEV.P calculate population standard deviation. STDEV is available in Excel 2007 and the previous versions. However, STDEV.P and STDEV.S are only available in Excel 2010 and subsequent versions.

You are free to use this image on your website, templates, etc, Please provide us with an attribution linkArticle Link to be Hyperlinked
For eg:
Source: Standard Deviation in Excel (wallstreetmojo.com)
Table of contents
- What is Standard Deviation in Excel?
- Standard Deviation Formulas in Excel
- The Syntax of STDEV.S Function
- The Population vs. Sample
- The STDEV.S and STDEVA Functions
- Calculating Standard Deviation in Excel
- #1 – Calculate Population Standard Deviation in Excel
- #2– Calculate Sample Standard Deviation in Excel
- Frequently Asked Questions
- Recommended Articles
- Standard Deviation Formulas in Excel
Standard Deviation Formulas in Excel
In excel, there are eight formulas to calculate the standard deviation. These are grouped under sample and population.
The functions STDEV.S, STDEVA, STDEV, DSTDEV are under sample and STDEV.P, STDEVP, STDEVPA, DSTDEVP are under population.
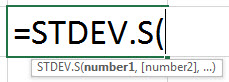
The Syntax of STDEV.S Function
The syntax of the function is stated as follows:
The function accepts the following arguments:
- Number 1: This is the first value of the sample data. It can be expressed as a range.
- Number 2: This is the second value of the sample data.
“Number 1” is mandatory and “number 2” is an optional argument.
Note 1: If the entire sample data is entered as a range, the “number 2” argument becomes optional.
Note 2: The sample standard deviation formula works correctly when the supplied arguments contain at least two numeric values. Otherwise, it returns the “#DIV/0!” error.
The Population vs. Sample
The population and sample are defined as follows:
- The population refers to the whole data set.
- A sample is a subset of the data set. A sample of the population is taken when it is difficult to use the complete data set.
Note: The sample standard deviation helps make conclusions for the population.
The STDEV.S and STDEVA Functions
The two functions are explained as follows:
- The STDEV.S function calculates the standard deviationStandard deviation (SD) is a popular statistical tool represented by the Greek letter ‘σ’ to measure the variation or dispersion of a set of data values relative to its mean (average), thus interpreting the data’s reliability.read more using the numerical values. It ignores the text values. The “S” of the function represents the sample data set.
- The STDEVA function calculates the standard deviation by counting the text values as zero. The logical value “false” is counted as 0 and “true” is counted as 1.
Note: The STDEV.S is available in Excel 2010 and the subsequent versions.
Calculating Standard Deviation in Excel
#1 – Calculate Population Standard Deviation in Excel
Let us consider an example to understand the concept of standard deviation in Excel.
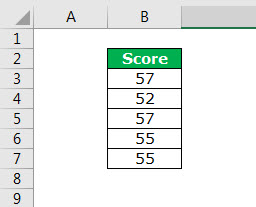
The following are the employee scores of an organization. They indicate the skill levels of the employees.
We want to calculate the standard deviation of the given data set.
The steps to calculate standard deviation in Excel are listed as follows:
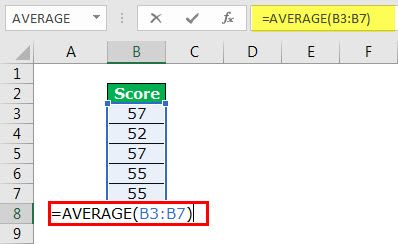
- Calculate the mean (average) of the data.

The output 55.2 signifies the average employee score.

- Calculate the population variance. It is the difference of each score from the mean. The results are summed as shown in the following image.
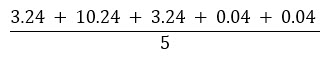
Variance =

Variance =
The population variance is 3.36.
- Calculate the standard deviation. It is the square root of the variance.

Conclusion: The standard deviation is 1.83. This indicates that the employee scores range from 53.37 to 57.03.


#2– Calculate Sample Standard Deviation in Excel
Let us consider an example to understand the working of the STDEV.S function.
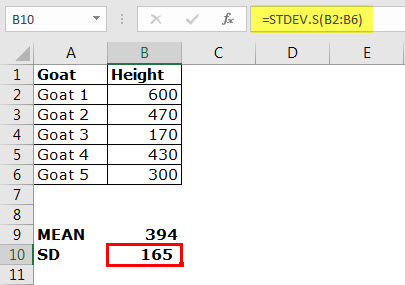
The following table shows the heights of different goats. The height is measured from the shoulder level and is denoted in millimeters.
You can download this Standard Deviation Excel Template here – Standard Deviation Excel Template

Step 1: Calculate the mean of the given data. The output is 394.

Step 2: Apply STDEV.S to the range B2:B6. The output is 165.
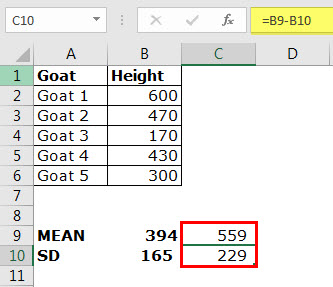
Conclusion: The standard deviation of the height of the goats is 165. This indicates that the usual heights are within the range of 229 and 559 millimeters.
In other words, the heights are on either side of the mean, i.e., 394–165=229 and 394+165=559.
Frequently Asked Questions
1. What is standard deviation in Excel?
The standard deviation measures the dispersion of a given set of values from the mean. It shows the fluctuation of data values. A low standard deviation indicates lower variability and greater accuracy of the mean. On the other hand, a high standard deviation indicates higher variation and lesser reliability of the mean.
While investing, the standard deviation of the returns is evaluated to assess the volatility of a stock. In Excel, the STDEV and STDEV.S calculate sample standard deviation while STDEVP and STDEV.P calculate population standard deviation.
2. Which standard deviation formula should be used in Excel?
To select the appropriate standard deviation formula, the following points must be considered:
• The standard deviation is being calculated for a population or sample.
• The type of values of the data set. These values can be numerical, logical or textual.
• The version of MS Excel which is being used currently.
3. How to create a standard deviation graph in Excel?
The steps to create a standard deviation graph in Excel are listed as follows:
• Create a usual Excel chart with the help of the “charts” group under the Insert tab.
• Select the chart and click the plus (+) sign on the top-right corner.
• In “chart elements,” click the arrow of “error bars,” and select “standard deviation.”
The standard deviation bars for the data points are inserted within the chart.
- STDEV calculates the standard deviation of the sample data supplied as an argument.
- The standard deviation shows the variability of the data values from the mean (average).
- The lower the standard deviation, the closer the data points to the mean.
- The higher the standard deviation, the more scattered the data points from the mean.
- The population refers to the entire data set while a sample is a subset of this data.
- The STDEV.S function calculates the standard deviation using the numerical values only.
- The STDEV.S function accepts two arguments–“number 1” and “number 2” representing the first and the second value of the sample data respectively.
Recommended Articles
This has been a guide to standard deviation in Excel. Here we discuss how to calculate standard deviation in excel using formula and examples. You may also look at these useful functions in Excel –
- Quartile DeviationQuartile deviation is based on the difference between the first quartile and the third quartile in the frequency distribution and the difference is also known as the interquartile range, the difference divided by two is known as quartile deviation or semi interquartile range.read more
- Sample Standard Deviation FormulaSample standard deviation refers to the statistical metric that is used to measure the extent by which a random variable diverges from the mean of the sample.read more
- Standard Deviation Graph in ExcelThe standard deviation is a metric that calculates how values change when compared to or in relation to the mean or average value. Both deviations are represented in a standard deviation graph, with one being positive on the right and the other being negative on the left.read more
- QUARTILE Function in Excel
What is Standard Deviation? | STDEV.P | STDEV.S | Variance
This page explains how to calculate the standard deviation based on the entire population using the STDEV.P function in Excel and how to estimate the standard deviation based on a sample using the STDEV.S function in Excel.
What is Standard Deviation?
Standard deviation is a number that tells you how far numbers are from their mean.
1. For example, the numbers below have a mean (average) of 10.

Explanation: the numbers are all the same which means there’s no variation. As a result, the numbers have a standard deviation of zero. The STDEV function is an old function. Microsoft Excel recommends using the new STEDV.S function which produces the exact same result.
2. The numbers below also have a mean (average) of 10.

Explanation: the numbers are close to the mean. As a result, the numbers have a low standard deviation.
3. The numbers below also have a mean (average) of 10.

Explanation: the numbers are spread out. As a result, the numbers have a high standard deviation.
STDEV.P
The STDEV.P function (the P stands for Population) in Excel calculates the standard deviation based on the entire population. For example, you’re teaching a group of 5 students. You have the test scores of all students. The entire population consists of 5 data points. The STDEV.P function uses the following formula:

In this example, x1 = 5, x2 = 1, x3 = 4, x4 = 6, x5 = 9, μ = 5 (mean), N = 5 (number of data points).
1. Calculate the mean (μ).

2. For each number, calculate the distance to the mean.

3. For each number, square this distance.

4. Sum (∑) these values.

5. Divide by the number of data points (N = 5).

6. Take the square root.

7. Fortunately, the STDEV.P function in Excel can execute all these steps for you.

STDEV.S
The STDEV.S function (the S stands for Sample) in Excel estimates the standard deviation based on a sample. For example, you’re teaching a large group of students. You only have the test scores of 5 students. The sample size equals 5. The STDEV.S function uses the following formula:

In this example, x1=5, x2=1, x3=4, x4=6, x5=9 (same numbers as above), x̄=5 (sample mean), n=5 (sample size).
1. Repeat steps 1-5 above but at step 5 divide by n-1 instead of N.

2. Take the square root.

3. Fortunately, the STDEV.S function in Excel can execute all these steps for you.

Note: why do we divide by n — 1 instead of by n when we estimate the standard deviation based on a sample? Bessel’s correction states that dividing by n-1 instead of by n gives a better estimation of the standard deviation.
Variance
Variance is the square of the standard deviation. It’s that simple. Sometimes it’s easier to use the variance when solving statistical problems.
1. The VAR.P function below calculates the variance based on the entire population.

Note: you already knew this answer (see step 5 under STDEV.P). Take the square root of this result to find the standard deviation based on the entire population.
2. The VAR.S function below estimates the variance based on a sample.

Note: you already knew this answer (see step 1 under STDEV.S). Take the square root of this result to find the standard deviation based on a sample.
3. VAR and VAR.S produce the exact same result.

Note: Microsoft Excel recommends using the new VAR.S function.
![]()
Download Article
Step-by-step tutorial for the STDEV functions
![]()
Download Article
This wikiHow shows you how to find the standard deviation of a dataset in Microsoft Excel. Whether you’re studying for statistics, analyzing data at work, or just researching something for fun, calculating a standard deviation is essential. And, it’s pretty easy to do in Excel! There are built-in functions for calculating the standard deviation.
Things You Should Know
- There are four functions for calculating standard deviation.
- STDEV.P and STDEV.S cover most situations. Use STDEV.P for populations and STDEV.S for samples.
- The function will calculate the standard deviation for a selected range of cells.
Steps
-
1
Enter the values you want to use. Pick a column in which you want to enter your data, then type each data value into individual cells in that column. Using Excel is a great way to organize and analyze your data.
- For example, if you select column «A» as the area in which to enter your data, you might type a number into cell A1, cell A2, cell A3, and so on.
- If needed, you can move columns in your spreadsheet to organize your data.
-
2
Note this information about the different functions. There are four functions in Excel for calculating standard deviation. The functions differ in two ways:[1]
- The selected function will either calculate the standard deviation for a sample (using n — 1) or a population (using n), where n is the sample size.
- The selected function will include or exclude logical values (TRUE and FALSE) and text (numbers represented as text). TRUE is interpreted as a 1, while FALSE is 0.
Advertisement
-
3
Choose a standard deviation function. Here are the four options for calculating standard deviation:
- STDEV.P — Finds the standard deviation of a population. This function doesn’t include logical values or text.[2]
- STDEV.S — Finds the standard deviation of a sample. This function doesn’t include logical values or text.[3]
- STDEVA — Finds the standard deviation of a sample. This function does include logical values or text.[4]
- STDEVPA — Finds the standard deviation of a population. This function does include logical values or text.[5]
- There are also two outdated functions that have been replaced by the above functions. They are still present in Excel for backward compatibility reasons, but may be phased out in future versions.
- STDEV — This function was replaced by STDEV.S. Finds the standard deviation of a sample. This function doesn’t include logical values or text.[6]
- STDEVP — This function was replaced by STDEV.P. Finds the standard deviation of a population. This function doesn’t include logical values or text.[7]
- STDEV — This function was replaced by STDEV.S. Finds the standard deviation of a sample. This function doesn’t include logical values or text.[6]
- STDEV.P — Finds the standard deviation of a population. This function doesn’t include logical values or text.[2]
-
4
Click a blank cell. This should be the cell in which you want to display the standard deviation value. Doing so selects the cell.
-
5
Type in the standard deviation function. In the cell you selected, enter the standard deviation function you want to use. Here is STDEV.S() as an example:
- =STDEV.S()
-
6
Add your value range. To do so:
- In between the parentheses, type the letter and number of the cell containing your first data value.
- Type a colon (:)
- Type the letter and number of the last cell.
- For example, if you entered your data in column «A» from rows 1 through 10, you would have =STDEV.S(A1:A10) typed here.
- If you just want to display the standard deviation of the value of a few scattered cells such as A1, B3, and C5, you can type the cell names separated by commas (e.g., =STDEV.S(A1,B3,C5)).
-
7
Press ↵ Enter. This will prompt Excel to run the formula, displaying the standard deviation of the selected cells in the formula’s cell.
- If you want to check your work, you can calculate the standard deviation by hand.


Advertisement
Add New Question
-
Question
How do I use Excel to calculate 2 standard deviations?

Use =STDEV(), and put your range of values in the parentheses. This can be 2 cells or 2 values (numbers).
Ask a Question
200 characters left
Include your email address to get a message when this question is answered.
Submit
Advertisement
Video
Thanks for submitting a tip for review!
Advertisement
-
The old =STDEV( ) formula doesn’t work in versions of Excel older than 2007.
Advertisement
References
About This Article
Thanks to all authors for creating a page that has been read 444,078 times.
Is this article up to date?
wikiHow Tech Help:
Tech troubles got you down? We’ve got the tips you need
Subscribe
You’re all set!
If you’ve ever taken a statistics class, the words ‘standard deviation’ might intimidate you. This complex formula provides insightful information for datasets that averages alone cannot reveal, and thankfully, Excel makes calculating this statistic easier than putting pencil to paper.

Standard deviation is frequently used by financial professionals as it can help determine risks in stock portfolios and is often applied to return on investment (ROI).
For marketing professionals, standard deviation can reveal variabilities and risks in datasets that will ultimately help guide campaign decisions.
![Download 10 Excel Templates for Marketers [Free Kit]](https://no-cache.hubspot.com/cta/default/53/9ff7a4fe-5293-496c-acca-566bc6e73f42.png)
What is standard deviation?
Simply put, standard deviation is a mathematical term that measures the variation in a set of values. In marketing, standard deviation can help account for widely varying costs or sales. If the numbers in a data set are spread far apart, they have a higher standard deviation.
This measurement can help assess risk when deciding how much budget can be allocated toward certain campaigns based on the standard deviation of the ROI, just to name one example.
There are six standard deviation formulas in Excel, which will be used based on whether you need to calculate sample standard deviation or population standard deviation. This is easy to identify in Excel, as the three formulas for population standard deviation include a P (.P, PA, or P at the end of STDEV).
- STDEV.S
- STDEVA
- STDEV
- STDEV.P, STDEVPA, STDEVP
STDEV.S
If you are dealing with sample standard deviation and do not need to account for text or logical values, STDEV.S is the formula you will use to calculate standard deviation in Excel.
STDEVA
Alternatively, if you do need to account for text and logical values, use STDEVA, which will consider text and FALSE logical values to 0, while TRUE logical values will be read as 1.
STDEV
STDEV is simply the sample standard deviation formula that will work with older forms of Excel (2007 and before). It is the same as STDEV.S.
STDEVP, STDEVPA, STDEVP
You will almost exclusively use STDEV.S, STDEVA, or STDEV. When determining population standard deviation, you would have to include all datasets for the entirety of the population.
This can actually be far more data and much less useful than examining a smaller portion of the data, or a sample, in which case you would use one of the sample standard deviation formulas.
If you did, for some reason, need to determine the population standard deviation, you could still retrieve sample standard deviations and apply them to the larger dataset. The likelihood of needing these population standard deviation formulas is slim.
As stated by Microsoft, “[STDEVP] has been replaced with one or more new functions that may provide improved accuracy and with names that better reflect their usage. Although this function is still available for backward compatibility, you should consider using the new functions from now on, because this function may not be available in future versions of Excel.”
Sample of Standard Deviation in Excel
STDEV.S, STDEVA, or STDEV will be the most common formulas to use for marketers looking to calculate sample standard deviation in Excel.
These formulas specifically calculate standard deviation for a sample of a dataset, so the result will determine the amount of variability from the average (mean) of the data.
Next, we will determine how to find and use standard deviation formulas in an Excel spreadsheet.
Standard Deviation Excel Formula
As mentioned above, there are a total of six standard deviation Excel formulas, although you’ll only need one or two of them (depending on the version of Excel you use).
The syntax of the standard deviation formula in Excel for STDEV.S is
STDEV.S(number1,[number2],…)
Number1 is required and refers to “The first number argument corresponding to a sample of a population. You can also use a single array or a reference to an array instead of arguments separated by commas,” as explained by Microsoft.
Number2, … is optional. You can include up to 254 number arguments that refer to sample sets or data of a population, or you can use an array or reference to an array instead of number arguments.
This is the STDEV.S formula used by Excel:
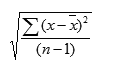
x is the sample mean AVERAGE(number1,number2,…) and n is the sample size. Excel thankfully makes light work of applying this formula to data to calculate standard deviation.
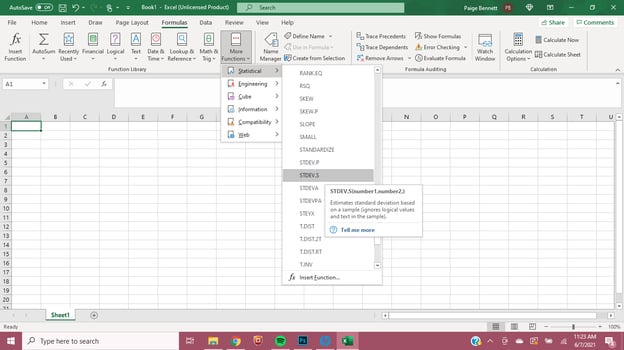
Image via Paige Bennett
Excel Standard Deviation Function
How does one find the Excel standard deviation function that they need? In Excel, navigate to the “Formulas» header in the topmost navigation bar. For Excel versions after 2007, the second navigation bar offers a list of popular formulas, and at the end, “More Functions.” Click “More Functions” then “Statistical” and finally scroll down to the STDEV.S or other standard deviation formula for which you need. You can then input Number1 and Number2, ….
Those using an older version of Excel will not have the STDEV.S formula, but they will similarly be able to navigate to STDEV.
Why Standard Deviation is Important to Marketers
Perhaps this seems simple to some marketing professionals, or maybe this is a lot of statistical speak that sounds complex. Either way, mastering this formula and Excel function is crucial for marketers.
In marketing, discussing averages for datasets is commonplace, and this can be insightful. But it can also leave out some crucial information that could impact a campaign.
Standard deviation can show risks, volatility, or variability in a dataset. An average might show a promising campaign to allocate money toward, but standard deviation can show the potential risk and reward of a campaign. Together, averages and standard deviations can offer a comprehensive look at a dataset, so marketers can make the best decisions based on all of the information at hand.
For example, let’s say we have two companies with different order averages.
Company one has an order average of $1,000. Company two has an order average of $1,500.
But Company two has a standard deviation of $500, while Company one has a standard deviation of $50. Company two has a higher order average on the surface, but a deeper dive shows that it is riskier.
Standard Deviation Can Help Marketers Assess Risk
Averages can be meaningful in showing marketers promising campaigns and to forecast their results. But what averages don’t show are the risk and variability within the data.
A higher average sales number might not show a huge range of variability, and ultimately, risk. While standard deviation has long been used in finance to assess risk of stock portfolios and help professionals determine where to invest or what to expect for ROI, marketers can also benefit from using this statistical analysis in their own work.
They just might find some profitable surprises and avoid risky, volatile campaigns or companies by looking at both averages and standard deviation when making decisions.
