
Do you need to share your report built in Salesforce with external stakeholders? Or you simply want to visualize your Salesforce data using some external dataviz tool, such as Tableau? There are many reasons why you might want to export a Salesforce report to Excel but the options are quite limited. Read on to find out which tool or solution works best for you.
Export Salesforce report to Excel – methods to consider
- Manually export Salesforce report to Excel or CSV – this is the native functionality that allows you to manually download Salesforce reports to Excel. You can export formatted reports as Excel files or the raw data as Excel and CSV files.
- Schedule export of Salesforce data to build custom reports in a spreadsheet – this is the approach for custom reporting. You can automate exports of specific data entities to Google Sheets or Excel. Based on this data, you can create a custom report or dashboard, which will update automatically with every data refresh.
- Export Salesforce reports via the Salesforce API – this is an advanced approach, which may require coding skills to extract data via the Salesforce API. Alternatively, you can use the JSON to Excel connector. This will let you avoid any coding, but you’ll need to map the exported data in Excel.
We’re going to review each section separately. However, if you already know which of these options to export reports from Salesforce to Excel would work best for you, you can skip right to it.
How to export Salesforce report to Excel natively
We’ll check out the flow separately for each Salesforce UI version.
Note: To export reports from Salesforce, a user must have the ‘Export Reports’ permission.
Related Posts


Export Salesforce report to Excel in Lightning Experience
- Go to the Reports tab and open the report you want to export.

- Click the Edit drop-down menu on the right side of your Salesforce report and select Export.
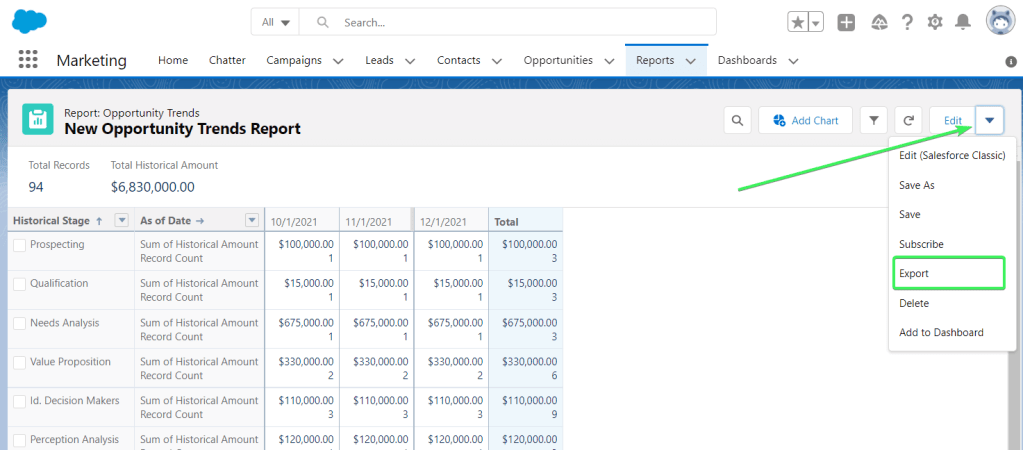
- Select the format for export Salesforce report to Excel
- Formatted Report is available for export only as XLSX Excel file
- Details Only is available for export as XLSX or XLS file, as well as CSV

- Click Export – the file with your Salesforce report will be downloaded to your device.
Here is an example of a New Opportunity Trends Report exported formatted from Salesforce Lightning experience:

Salesforce report export in Salesforce Classic
- Go to the Reports tab and open the report you want to export.

In Salesforce Classic, reports do not have an Export button with exporting formats. You can choose them right away with the following buttons:
- Printable View – to export the formatted report in XLS format
- Export Details – to export the report’s data in XLS or CSV

For example, here is what a New Opportunity Trends Report looks like if exported as Printable View from Salesforce classic:

The difference between Formatted Export (Lightning Experience) and Printable View (Salesforce Classic) is obvious.
At the same time, there is no difference if you export report details from both Salesforce UI versions:

This is how you can export a Salesforce report to Excel. Also, check out the restrictions associated with this action.
Salesforce reports for Excel export limitations
- Up to 5 reports at once.
- Unlimited number of rows and columns for Details Only reports in XLS or CSV formats.
- Up to 100,000 rows and 100 columns for Formatted Reports or Details Only in XLSX format.
- Historical trending reports are not available for export.
- Joined reports can include a maximum of 2,000 rows and are available for export only as Formatted Report.
Can I auto export Salesforce report to Excel?
Unfortunately, Salesforce does not allow you to export Salesforce reports to Excel on a schedule. This is rather frustrating because automation would allow you to save much of the time for your reporting tasks.
However, there is always a solution. Below we’ll introduce a few methods so you can set up automation for your Salesforce reports.
How to export Salesforce report to Excel automatically
In the blog post Salesforce Export Data, we explained how you can schedule exports of data from Salesforce to Excel or Google Sheets. For this, you need Coupler.io, an iPaaS solution that extracts data from apps, such as Airtable, Google Sheets, and so on, and loads it to a chosen destination on a schedule.

Coupler.io provides a dedicated Salesforce integration, which allows you to auto export a bunch of data entities including Contacts, Orders, Opportunities, and many more. Reports are also on the list of exportable data entities, but it only exports a list of reports.
Nevertheless, the method we suggest here is as follows:
- Export raw Salesforce data required for the report
- Build a custom report in Excel and link the exported data to it
This will let you automate reporting on a schedule like every hour or every 15 minutes. Let’s now look at how this works.
Example of how you can connect Salesforce report to Excel
As an example, let’s take the New Opportunity Trends Report that we’ve recently exported manually. For this report, we’ll need information about Opportunity History. To export this data, sign up to Coupler.io, click Add new importer and configure the integration.
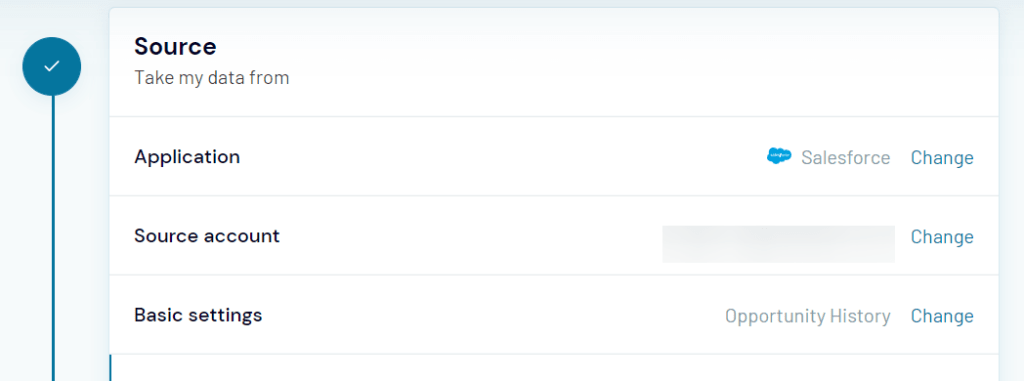
Set up source
- Select Salesforce as a source application.
- Connect your Salesforce account. You will need to log in to Salesforce if you have not already.
- Select Opportunity History as a data entity from a drop down list.
Note: You can filter the data to export from Salesforce to Excel using the Advanced filters section, for example, like this:

Jump to the destination setup.
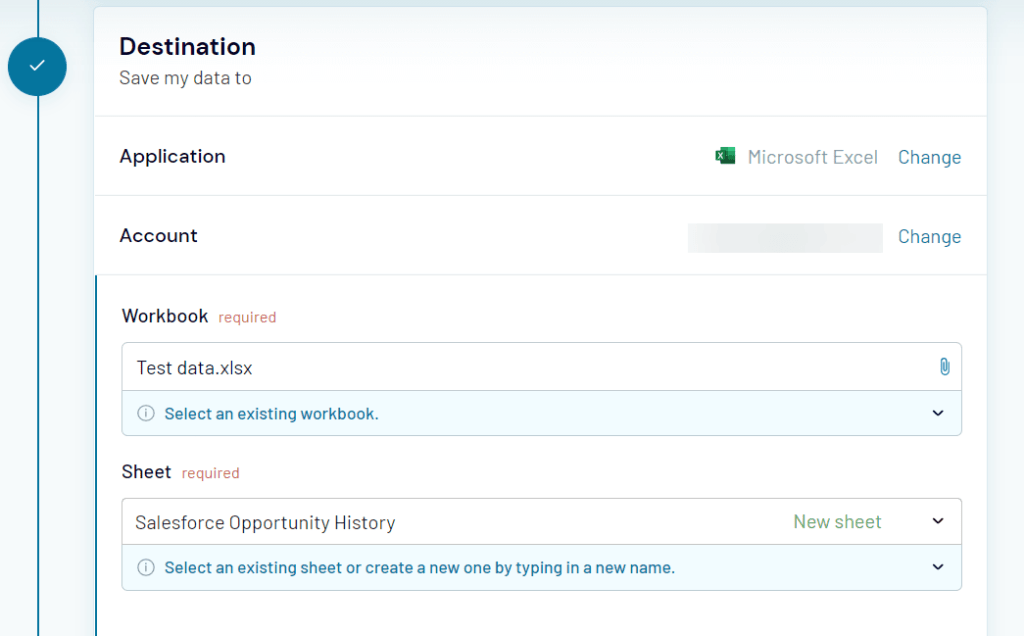
Set up destination
- Select Excel as a destination app from the drop-down list.
- Connect your Microsoft account.
- Select a workbook stored on your OneDrive, as well as the worksheet where to load the Salesforce data. Optionally, you can type in a name to create a new sheet.
Here is what the destination configuration may look like.
Click Save and Run to load Salesforce data to your Excel workbook. Here is how it looks:

This is just raw data, which you can convert into a report as you wish.
Build a report based on the Salesforce data exported to Excel
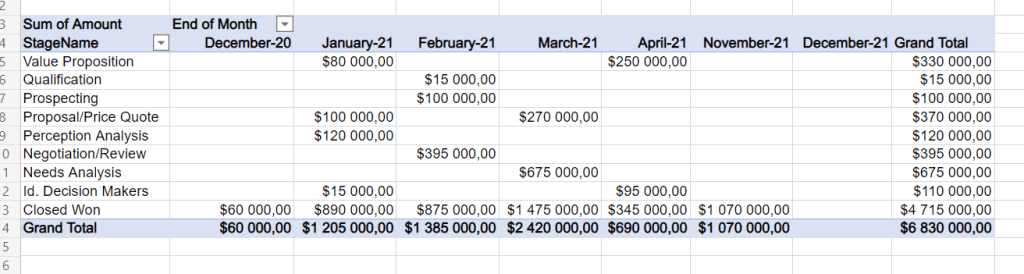
In our example, we inserted a Pivot table to get the format we need.
Here are the steps we took:
- Added a new column with the End of the Month formula to convert values from the CloseDate column.

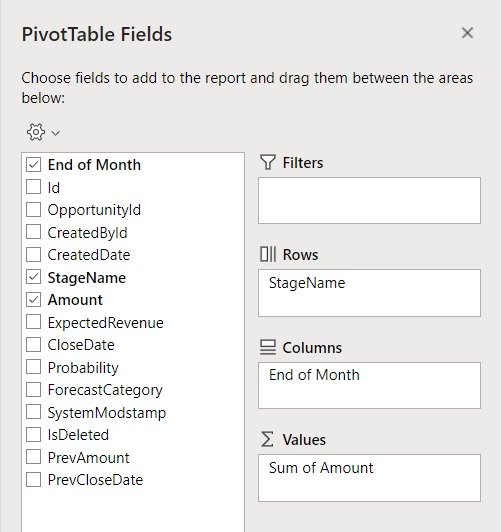
- Inserted a pivot table with the following fields:
- Rows: StageName
- Columns: End of Month
- Values: Sum of Amount
And here is what our custom report looks like compared to the New Opportunity Trends Report that we exported manually from Salesforce to Excel.

The main benefit of the custom report is that it will be updated automatically with every data refresh that you set up in Coupler.io. So, you can use this method for not only reporting but also other tasks, for example, creating a Salesforce backup copy.
Salesforce schedule report Excel
- In your Salesforce to Excel integration, toggle on the Automatic data refresh feature.
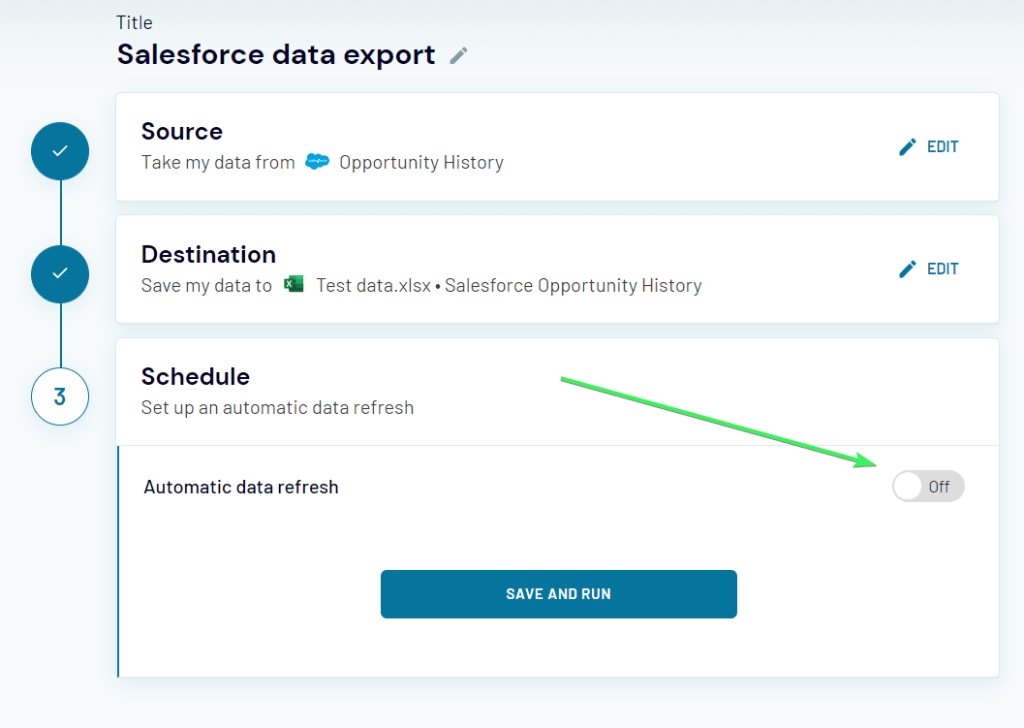
- Then configure the desired frequency for automated exports.

And that’s it! Coupler.io will automatically update data from Salesforce in Excel, so the values in the pivot table will be automatically updated as well.
Note: Pivot table is just an example that we used here. You can create custom reports using Excel functions, Power Query, charts, and other features.
Link Salesforce report to Excel using the Salesforce API
The last option on our list of solutions for exporting Salesforce reports to Excel is the Salesforce REST API. We’ve covered this in more detail in our article on Salesforce Data Export. To do this, you’ll need to complete the following steps:
- Create a Connected App in Salesforce
- Get an access token
With an access token, you can send a GET request to the following API URL:
curl "{instance-URL}/services/data/{api_version}/analytics/reports/{report-ID}
  -H "Authorization: Bearer {access_token}"
where:
{instance-URL}is the instance URL, which you obtained along with the access token, for example,
https://zrecords-dev-ed.my.salesforce.com
{api_version}is the version of the Salesforce API{access_token}is your access token{report-ID}is the Id of your Salesforce report. You can learn the report ID by opening the report and checking the URL bar.

This step is more technical since it requires you to work with the Salesforce API documentation, as well as write a script to extract data and map it into your Excel file.
Alternatively, you can learn how to connect API to Excel without coding.
Do you need the no-code integration for exporting Salesforce reports to Excel?
It’s believed that wishing upon a shooting star makes the wish come true:) Coupler.io suggests that you don’t wait for this moment, but simply let us know whether you need to have the option for exporting reports to Excel or Google Sheets. Fill out this form to submit your request. Many of our integrations came out thanks to the active users who expressed their interest in particular sources. Good luck with your data!
-

A content manager at Coupler.io whose key responsibility is to ensure that the readers love our content on the blog. With 5 years of experience as a wordsmith in SaaS, I know how to make texts resonate with readers’ queries✍🏼

Back to Blog
Focus on your business
goals while we take care of your data!
Try Coupler.io
This article explains how to export a report to XLS format from Preview (Visual Studio, WinForms, WPF), Document Viewer (Web Platforms), and in code. The article also describes export modes and export options you can specify for the exported XLS file.
Note
Export options listed in this article generate WYSIWYG output. Report layouts with misaligned columns, empty spaces, and misaligned headers and footers might produce merged cells and extra columns/rows in the exported XLS file. Refer to the following section for more details: Merged Cells And Extra Columns/Rows: Troubleshooting. To export data to XLS without exact layout replication, use the Spreadsheet Document API instead of the reporting export engine.
Export from Preview (Visual Studio, WinForms, WPF)
You can export a report from the Visual Studio Preview tab, WinForms Print Preview, and WPF Print Preview. Expand the drop-down list of export formats and select XLS File.

Specify export mode and options in the invoked XLS Export Options dialog and click OK.
Export from Document Viewer (Web Platforms)
You can export a report from ASP.NET Web Forms Document Viewer, ASP.NET MVC Document Viewer, or ASP.NET Core Document Viewer. Specify export options in the Export Options dialog, expand the Export To drop-down list in the toolbar, and select XLS.

Export in Code
Use the XtraReport.ExportToXls or XtraReport.ExportToXlsAsync methods to export a report to XLS format. Specify the path/stream to which the report should be exported as the first argument in these methods. If you specify only the path/stream, the report is exported to XLS format with the default options. To change the default options, do the following:
- If you create a report in code: create a XlsExportOptions object, specify export options for this object, then pass the object to the XtraReport.ExportToXls or XtraReport.ExportToXlsAsync methods as the second argument.
- If you create a report in the Visual Studio Designer: change the options in the Properties panel.
Example
View Example: Export a Report to XLS Format
- Form1.cs
- Form1.vb
using DevExpress.XtraPrinting;
using DevExpress.XtraReports.UI;
using System.Windows.Forms;
using System;

namespace XlsExportExample {
    public partial class Form1 : Form {
        public Form1() {
            InitializeComponent();
        }

        private void Form1_Load(object sender, EventArgs e) {
            // Create a report.
            XtraReport report = new XtraReport() {
                Name = "Report Example",
                Bands = {
                    new DetailBand() {
                        Controls = {
                            new XRLabel() {
                                Text = "Some content goes here...",
                            }
                        }
                    }
                }
            };

            // Specify export options.
            XlsExportOptions xlsExportOptions = new XlsExportOptions() {
                ExportMode = XlsExportMode.SingleFile,
                ShowGridLines = true,
                FitToPrintedPageHeight = true
            };

            // Specify the path for the exported XLS file.
            string xlsExportFile =
                Environment.GetFolderPath(Environment.SpecialFolder.UserProfile) +
                @"Downloads" +
                report.Name +
                ".xls";

            // Export the report.
            report.ExportToXls(xlsExportFile, xlsExportOptions);
        }
    }
}
Export Modes
Use the Export Mode option to specify one of the following XLS export modes.
Single File
Exports a report to a file that contains one sheet with all report pages. The report’s page headers, footers, and top/bottom margins appear only once, at the beginning and end of the sheet.
Single File Page-By-Page
Saves every report page as one sheet. The report’s page headers, footers, and top/bottom margins appear on every sheet.
Different Files
Exports a report to multiple files. Each file contains a sheet that corresponds to one report page. Page headers, footers, and top/bottom margins appear on every sheet.
Export Options
The following options are available in the XLS Export Dialog, which you can open from the Visual Studio Print tab, WinForms Print Preview, WPF Print Preview, and in the Export Options dialog of the Document Viewer (Web platforms):
- Page Range
- Sheet Name
- Text Export Mode
- Show Grid Lines
- Export Hyperlinks
- Raw Data Mode
The options below are available only in the Properties panel in the Visual Studio Report Designer, WinForms End-User Report Designer, WPF End-User Report-Designer, …

… and in the Export options dialog of the Document Viewer (Web platforms).
- Image Export Options
- Print Options
- Encryption Options
- Suppress Export Exceptions Options
- Workbook Color Palette Compliance
- Right-to-Left Document
- Ignore Errors
Page Range
The Page Range option specifies the range of pages that should be exported to an XLS file. For example, the “1,3,5-12” range exports pages one, three, and five through twelve.
Sheet Name
Use the Sheet Name option to specify the name of the sheet in the exported XLS file. If you use Single File Page-By-Page mode, a consecutive index is added to the name of each sheet in the exported XLS file.
Text Export Mode
Use the Text Export Mode option to specify one of the following XLS export modes for report data:
-
Value (default)
Exports all data with the same formatting as in the original document. Integer, double, and Boolean values are exported with their original types. All other values are exported as strings. For the XRLabel control, the XlsxFormatString property value is used as a format string. If the property is not specified, the TextFormatString property value is used as a format string.
-
Text
Exports all data as strings.
Show Grid Lines
The Show Grid Lines option specifies whether sheet gridlines are visible in the exported XLS file.
Export Hyperlinks
Use the Export Hyperlinks option to specify whether to include hyperlinks in the exported XLS file. Only absolute URLs of the following types are supported:
|
URL Type |
Example |
|---|---|
|
Email address |
mailto:office@example.com?subject=Inquiries |
|
Web page |
https://www.example.com |
|
File |
file:///D:/Files/Agreement.html |
Raw Data Mode
Enable the Raw Data Mode option to export plain data and ignore images, graphics, font, and appearance settings.
Image Export Options
Enable the Rasterize Images option to rasterize vector images in pictures, charts, and barcodes in the exported XLS file. Use the Rasterization Resolution option to specify image resolution.
Print Options
Enable the Fit To Printed Page Height/Fit To Printed Page Width option to shrink the height/width of the exported document’s printout to one page. Enable both of these options to shrink the width and height of the exported document’s printout to one page.
Encryption Options
Use the Password option to set a password for the exported XLS file. XLS files support ARC4 encryption (except for RC4CryptoAPI). Refer to the following topic for more information: Office Document Cryptography Structure.
Important
Passwords for XLS files are stored as plain text in report definitions. Ensure that only trusted parties have access to report definition files.
Suppress Export Exceptions Options
Use the options below to suppress exceptions that raise if the exported XLS file contains more than 256 columns or 65536 rows:
- Suppress256ColumnsWarning
- Suppress65536RowsWarning
Workbook Color Palette Compliance
Use the WorkbookColorPaletteCompliance property to specify color palette compatibility with different workbook versions.
Right-to-Left Document
If you use right-to-left fonts in a report, enable the Right-to-Left Document option to use the right-to-left layout for sheets in the exported XLS file.
Ignore Errors
Use the Ignore Errors option to specify errors that should be ignored in the exported XLS file.
Limitations
Common
- Values of custom types are not exported to XLS files. If a cell within the exported XLS file contains a value of a custom type, the cell displays the #VALUE! error.
- An XLS cell may contain up to 32,767 characters. If the control’s Text property contains longer text, the text is truncated in the exported XLS file. No errors or warnings are displayed. Refer to the following Microsoft topic for more information: Excel specifications and limits.
- Cross-sheet references work in Single File export only.
Single File Mode
- If a report uses CachedReportSource, changes made in Preview are not included in Single File exports.
- If a report includes a page merged from another document, you cannot export the report as a Single File. The exported file contains only one of the merged reports. As a workaround, use subreports to combine multiple reports into a single document or export each report to a single XLS file, then join these files into one file.
Overlapped Controls
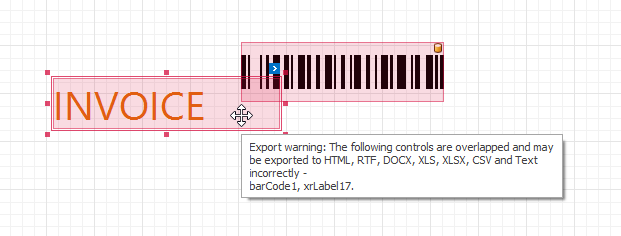
-
Overlapped controls might produce a corrupted layout in the exported XLS file. In the Report Designer, overlapped controls are shown in red. Move the mouse pointer over these controls to show a detailed export warning:

If you create a report in code, use the HasExportWarningControls collection to check if the report contains controls with export warnings.
-
The XRLabel control placed over the XRPictureBox control is exported to an XLS file under the picture.
The BeforePrint Event
If a control is bound to a data source field and the Text Export Mode option is set to Value, data from this field is exported directly to an XLS file. If you modify the control’s Text property value in the BeforePrint event, the changes are not exported to the XLS file. To modify and export the control’s data, use one of the following techniques:
- Assign data to the control’s Value property instead of the Text property in the implemented BeforePrint event.
- Use the EvaluateBinding event instead of BeforePrint. Assign a new value to the e.Value property.
- Set the Text Export Mode option to Text. Note that all values are exported as strings for this mode.
HTML/RTF Export
You can specify HTML content for the XRLabel control and HTML/RTF content for the XRRichText control. Only the following groups of HTML tags and their RTF equivalents are supported in XLS files:
|
Tag Group |
Tags Example |
|---|---|
|
Text format |
<b>, <i>, <u>, <s> |
|
Font settings (name, size, and foreground color) |
<font=[font name]> |
|
Line break |
<br> |
|
Non-breaking space |
<nbsp> |
Refer to the AllowMarkupText property description for information on XRLabel HTML tags supported in XLS files. See the following topic for details on HTML tags that XRRichText supports: HTML Support Limitations: Supported and Unsupported Tags.
Export Report Groups to Separate XLS Sheets
This section explains how you can export each data group into an individual worksheet. You can leverage the Single File Page By Page export mode if you take a few preparatory steps.
Do the following to export each report group to separate XLS sheets:
-
Modify the report layout to place each group on a new report page. Use one of the following methods to separate the report groups:
- If the groups are stored in one report, use the XRPageBreak control or enable the Band.PageBreak property.
- If each group is stored as a separate report, use the XRSubreport control with the GenerateOwnPages property enabled.
-
Fit the content of each group to one report page. To do this, set the XtraReport.RollPaper property to true.
- Enable Single File Page By Page export mode to export each page of the report to a separate XLS sheet.
- (Optional) Use the XlSheetCreated event to change the default name of each XLS sheet.
Note
You may want these layout changes to be applied only to the XLS export and not to on-screen preview or other export formats. In such cases, we recommend that you create a copy of the report and adjust this copy specifically for XLS export purposes. If you create a report in the Visual Studio Designer, you can customize the report in code.
View Example: Export Report Groups to Separate Excel Sheets
Merged Cells And Extra Columns/Rows: Troubleshooting
Export options listed in this article produce WYSIWYG output. Report layouts with misaligned columns, empty spaces, misaligned headers and footers, and overlapped controls might produce merged cells and extra columns/rows in the exported XLS file. This section describes how you can modify a report layout to resolve these issues.
Misaligned Columns
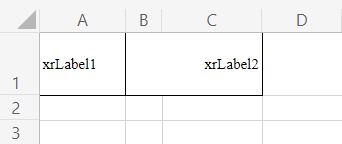
The image below shows a report with a table whose header’s columns are not aligned with the table cells:

The exported XLS file has the following layout:

Only A, C, E, and G columns are visible. Extra B, D, F, and H columns are added to the exported XLS file. The problem occurs because the table header and the cells in the Detail band are not aligned. The image below shows the borders of the misaligned columns:

To remove extra columns, align header and detail cells horizontally:

Empty Spaces
The image below shows a report with empty spaces between controls:
![]()
The exported XLS file has the following layout:
![]()
In the image below, cells with exported controls have a yellow background. As you can see, the export generated additional cells to replicate empty spaces between the controls.
![]()
To fix this issue, move or resize report controls to eliminate empty space. Use the TextAlignment and Padding properties to adjust text position.
![]()
Misaligned Headers And Footers
The image below shows a report with a header in which the control’s borders are not lined up with the report’s table columns.

The exported XLS file has the following layout:

The image below highlights the controls that generate extra columns:

To remove these extra columns, align the controls in the report header and footer to table columns:

Overlapped Controls
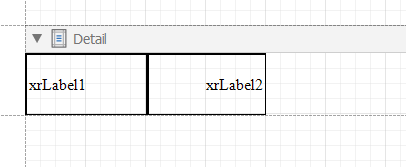
The following image shows a report layout with two overlapped labels:
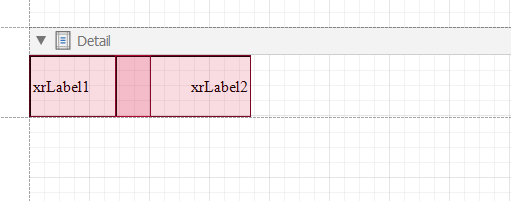
The exported Excel file appears as follows:
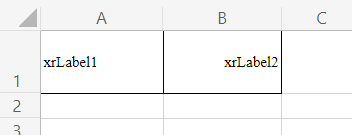
You can see that an extra column named B appears in the exported file. To remove this column, modify your report layout such that the controls do not overlap.
After the modification, the exported file does not contain the extra column:
Introduction
SQL Server Reporting Services (SSRS) has multiple options of exporting data into a variety of formats and we will be
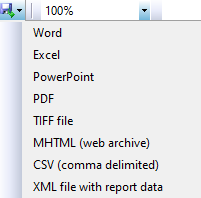
discussing the options of exporting SSRS Reports to multiple sheets of excel. In SSRS, there are multiple formats
available to export reports depending on the user’s needs. Microsoft Word, Microsoft Excel, Microsoft PowerPoint,
Tiff file, MHTML (Web Archive), CSV (comma delimited) and XML file with report data are the popular formats that can
be exported from SSRS as shown in the below screenshot.
As you know, every format has its own features. For example, in Microsoft excel there are sheets that are used to
group the data. Excel savvy users prefer to group the data into sheets. The challenge that many users experience is
exporting SSRS reports to multiple sheets of excel.
There are a couple of scenarios of requirements for exporting SSRS Reports to multiple sheets of excel.
-
Different Tablix in Different sheets: In this requirement, there will be multiple tables/tablixes that you need
to export them to different sheets -
Same Tablix in Different sheets: In this requirement, the same tablix will have different groups of data. For
example, sales tablix will have product categories of Bikes, Components, Clothing, and Accessories. This data
set may require exporting SSRS Reports to multiple sheets of Excel depending on these categories. In other
words, sheets are dynamic as they depend on the data set
Scenario 1
First of all, let us create a sample report in order to demonstrate the feature of exporting SSRS Reports to
multiple sheets of Excel. Let us launch the Visual Studio or SQL Server Data tool (SSDT) and create a Reporting
server project. Then let us add a report to the newly created SSRS project. Next, we will create a connection by
pointing out the AdventureWorksDW sample database.
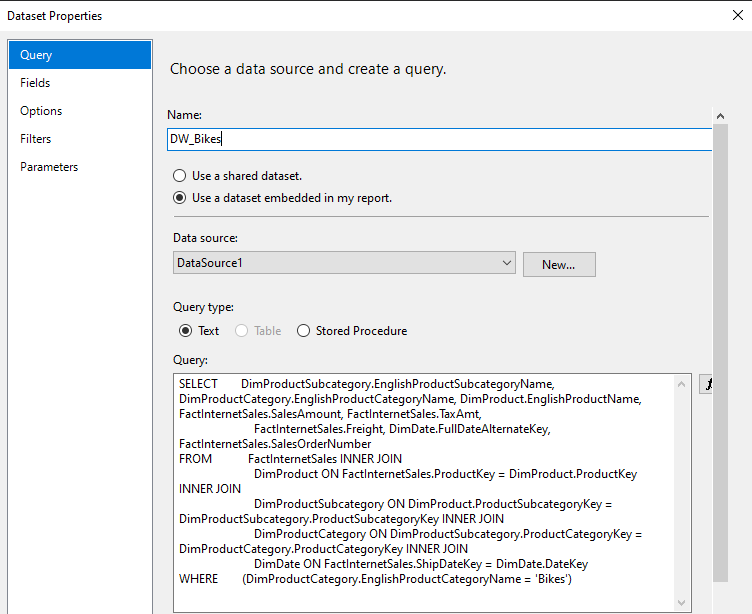
Let us create two data sets where one has the bikes data and the other data set has data of clothing. Following is
the query for one data set by joining FactInternetSales, DimProduct, DimProductCategory and DimProductSubcategory.
SELECT TOP (5) DimProductSubcategory.EnglishProductSubcategoryName, DimProductCategory.EnglishProductCategoryName, DimProduct.EnglishProductName, FactInternetSales.SalesAmount, FactInternetSales.TaxAmt,
FactInternetSales.Freight, DimDate.FullDateAlternateKey, FactInternetSales.SalesOrderNumber
FROM FactInternetSales INNER JOIN
DimProduct ON FactInternetSales.ProductKey = DimProduct.ProductKey INNER JOIN
DimProductSubcategory ON DimProduct.ProductSubcategoryKey = DimProductSubcategory.ProductSubcategoryKey INNER JOIN
DimProductCategory ON DimProductSubcategory.ProductCategoryKey = DimProductCategory.ProductCategoryKey INNER JOIN
DimDate ON FactInternetSales.ShipDateKey = DimDate.DateKey
WHERE (DimProductCategory.EnglishProductCategoryName = ‘Bikes’)
This is configured as shown in the following screenshot:
Similarly, another data set is created for the clothing and two tables are included as follows.
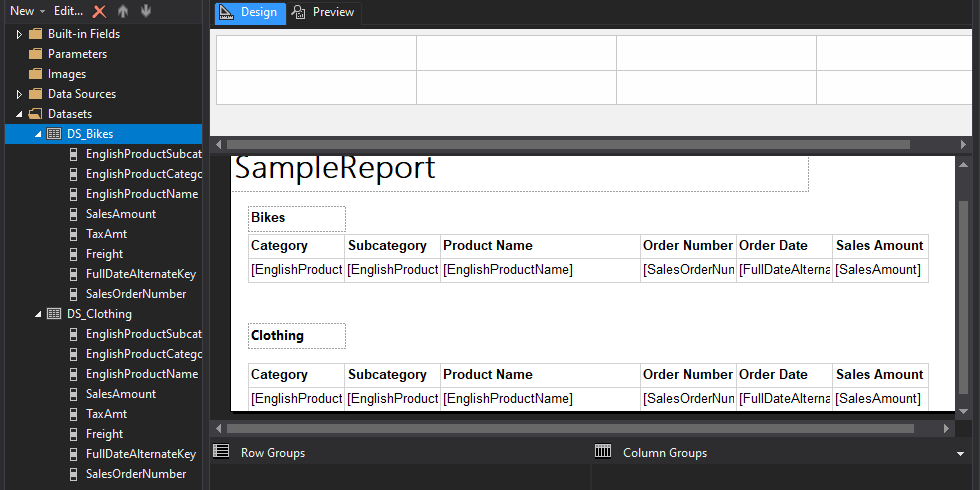
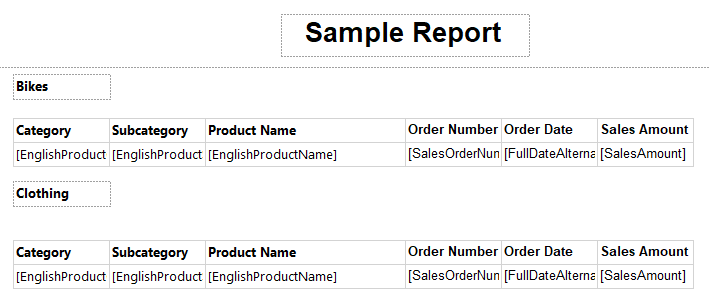
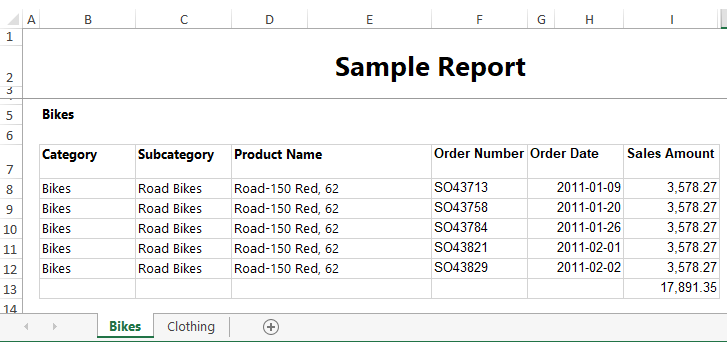
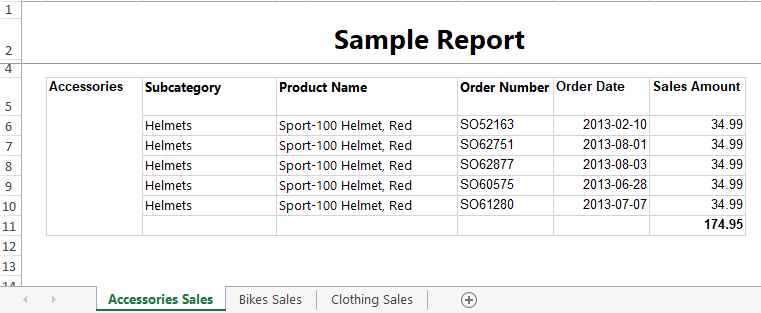
Please note that in order to demonstrate, only the top five records are retrieved and the following screen shows the
output of the report.
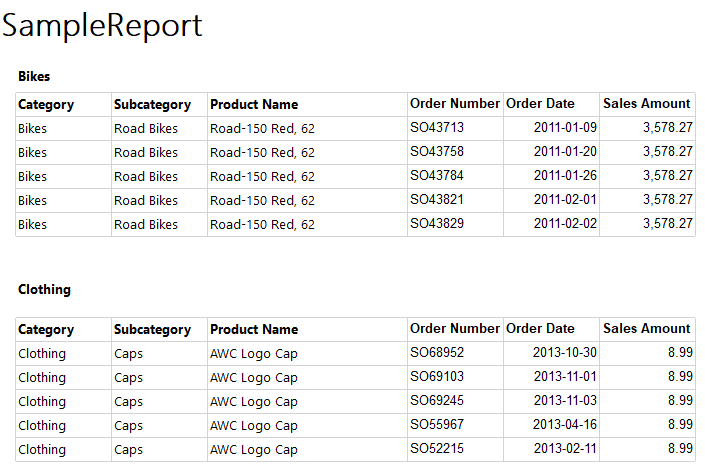
When this is exported to Microsoft excel, typically this will be exported to one sheet whereas the requirement is,
exporting SSRS Reports to multiple sheets of Excel. Further, Sheet names should be Bikes and Clothing.
There are three tasks in order to create multiple sheets.
- Creating a Page Break after the Bikes table
- Naming the Sheets with appropriate names
- Repeat the headings on every page
Three different configurations have to be done for this and let us do this configuration one by to implement
exporting SSRS Reports to Multiple sheets of Excel.
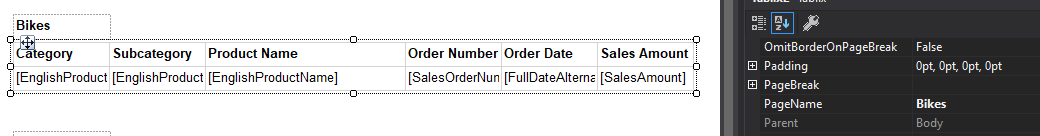
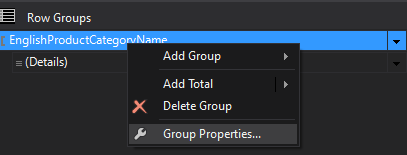
To add a page break, go to the properties of the first table or the tablix as shown below.
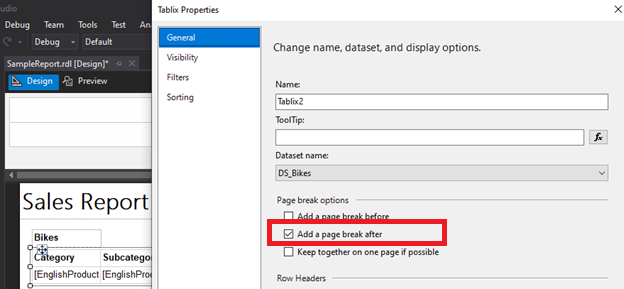
By selecting the Add a page break after, you are adding a page break after this table.
As you know, by default, sheets will be named as Sheet1, Sheet2 etc. However, we would like the name them with a
proper name. For example, we would like to name the sheets as Bikes and Clothing instead of Sheet1, Sheet2.
By selecting the relevant tablix and changing the PageName to Bikes will change the sheet name to Bikes as shown in
the below screenshot.
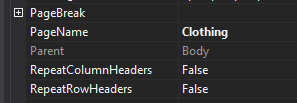
Similarly, the page name of the next tablix is named Clothing as shown in the below screenshot.
The last option is to repeat the heading on every page. There are several options for that and the very basic option
is, configure the RepeatWith property of the Header text box.
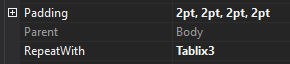
The above configuration shows that the header is repeated with the Tablix3. However, if there are more than two
pages, then this option will not work. Instead, we can add a report header by right-clicking and add a page header
and configure as shown in the following screenshot.
Now you are done with the configuration and let us verify this.
When you preview the report, you will see that both tablixs have appeared in two different pages alone with the
header. When you export it to the excel, you will see that data is in separate sheets with the relevant names.
Further, you will see that you will have the header on both sheets.
This is shown in the following screenshot.
You will see that there are two sheets with appropriate names instead of default sheet names.
Scenario 2
If you look at the above example, you will see that category is kind of hardcoded. In case, there are new
categories, you need to add them to another tablix along with a new query which will not be a good option.
Therefore, we need the option of exporting SSRS Reports to multiple sheets of excel for dynamic groups.
Let us see the report without any page breaks as shown in the below screenshot.
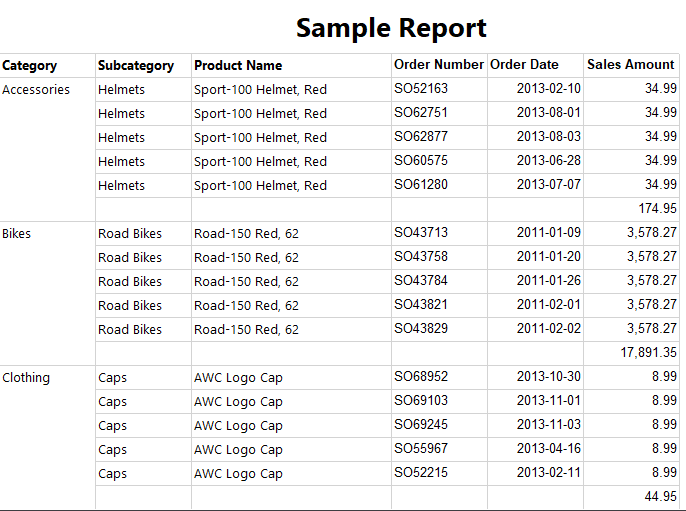
When you export this to Microsoft Excel, we should see three sheets with relevant names. If there are new categories
added later, those should be seen in a new sheet. This means sheets should be dynamic.
First of all, let us create a grouping with the category name by right-clicking the tablix and adding to
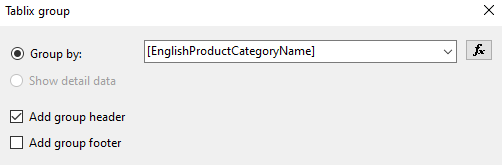
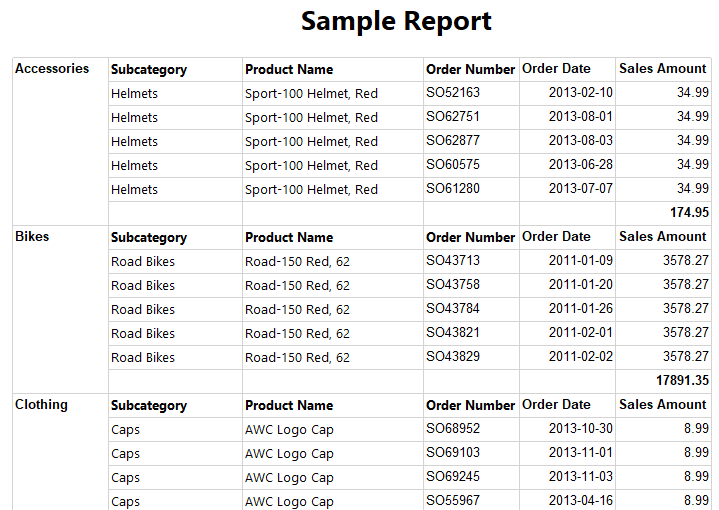
We have enabled the Add group header option so that we can use it to repeat the column headers
later. Then move the tablix headers to the group headers and you will the following report after viewing it.
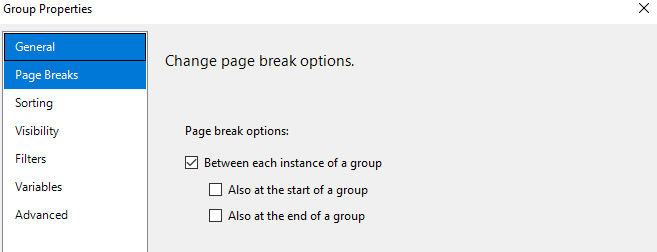
Next is to include the page break to the included groups. To do that, go to the properties of the groups from the
following option.
In the Page Breaks option, choose the Between each instance of a group as shown in the below image.
Now we need to provide the sheet name for when exporting to the Multiple sheets of Excel in SSRS.
Go to the properties of the group and go to Group -> PageName as shown in the below screenshot.
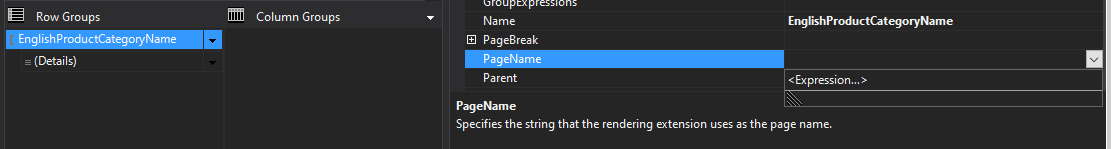
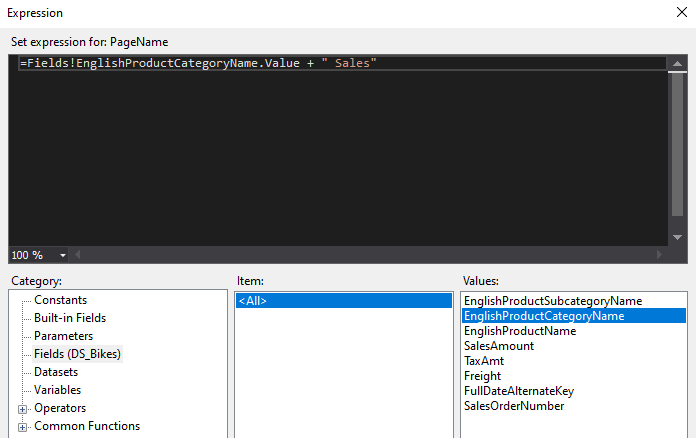
Since the sheet name is dynamic, it has to be an Expression. In the expression property page, you need to provide
the name of the sheet by combining the dataset fields as shown in the below screenshot.
Now everything is set and let us verify whether we get the data in when Exporting SSRS reports to Multiple Sheets of
Excell.
You will observe that when exporting to multiple sheets in Excel, it can be configured dynamically in SSRS.
Conclusion
SQL Server Reporting Services is one of the most common reporting tools used in many organizations by many users.
SSRS has the option of exporting reports to many formats and Microsoft Excel is the most common format that users
use. However, since Microsoft Excel has the Sheet feature, users would like exporting SSRS Reports to multiple
sheets of excel.
We looked at two options for creating multiple sheets in Microsoft Excel. Initially, we looked at how to create two
separate tablixes into multiple sheets and name the sheets accordingly. Next, we looked at the exporting SSRS Report
to multiple sheets of excel in dynamic nature. In that, we used the Grouping feature of the Tablix.
- Author
- Recent Posts

Dinesh Asanka is MVP for SQL Server Category for last 8 years. He has been working with SQL Server for more than 15 years, written articles and coauthored books. He is a presenter at various user groups and universities. He is always available to learn and share his knowledge.
View all posts by Dinesh Asanka

This Power BI tutorial, we will also disucss different approaches to Export Data in Power BI to excel. We will discuss how to export data from Power BI desktop to excel, Export Data from Power BI Dashboard to excel and Export Data from Power BI Report to excel. We will also see, Power BI Export to Excel Limitations.
Also, We will see Power BI Export underlying data details, how to enable the Export option in Power BI Desktop and what are the limitations and considerations in Power BI Export to Excel.
Learn how to export Power BI reports to PDF.
Different approaches to Export Data in Power BI
In Power BI, you can export the data by using three different approaches as:
- Export Data From Power BI Desktop
- Export Data from Power BI Dashboard
- Export Data from Power BI Report
To export the data from the Power BI Desktop, Click on the visual which you want to export.
Once you will click on the visual, you can see the three dots (…) which are present at the top right corner of the visual as you can see in the below screenshot. Select Export data from the drop-down.

Now it will ask you to save the Excel file. For that, you choose your location where you want to save the excel file and Select the Excel File type as CSV. Then click on Save.
In the below example, I have saved the file name as IncomeTaxRate with the type of CSV File.

When you will open the Excel file on your desktop, you can see the table like the below screenshot.
As I have saved my file with IncomeTaxRate name, that’s why the Excel spreadsheet name is appearing with the same name as shown below.

Export Data from Power BI Dashboard
Similarly, you can export the data from the Power BI Dashboard. For that, Go to your particular dashboard where the visual is present that you want to export.
Once you will go to the Power BI Dashboard page, Select your visual and click on the three dots (…) which are present at the top right corner of the visual. Then select Export data option from the drop-down menu as shown below.

When you will select the Export data option, then the below window will appear where you have to choose the Summarized data and the File format as .xlsx (Excel) as shown below. Then click on Export.
Once you will Export, the Excel file will be downloaded and it will be saved as .xlsx file type.

While you will open the downloaded Excel file (.xlsx), then the Excel spreadsheet will appear as the below screenshot. Here the Excel spreadsheet name will be the same as of the visualization name.

Export Data from Power BI Report
This is exactly similar to the Export Data From Power BI Desktop. Both are the same concept and processes. Here, One of the differences between them is, You have to export the data from the Power BI Report in Browser instead of the Power BI Desktop.
In the same way as Power BI Desktop, In the browser Power BI Report, Select your specific visual which you want to export. Then click on the three dots (…) and select Export data from the drop-down menu as shown below.

Select the Summarized data and select the File format as .xlsx (Excel) from the drop-down. Click on Export.
Once you will click on the Export option, then the file will be downloaded and saved as per the name of the visualization.

When you will open the Excel, then the spreadsheet will appear as the below screenshot. The Excel spreadsheet name will be the same as per the visualization name.

Underlying data details in Power BI Export
This Export underlying data details will work depends upon the help of your admin or IT department. In the Reporting view (In Power BI Desktop and Services), the measure option will display in the Field list with a calculator icon.
One most important thing you should know is, the Measures will create by using Power BI Desktop where the Power BI service does not.
In the below Table, It represents all the Visual Contains and what you will see in the Export in Power BI.
| Visual Contains | In Export, What you will see |
| Aggregates | You will see the first aggregate and the data (non-hidden) from the entire table. |
| Aggregates | You will see the related data. That means when the visual uses data from other tables which are related to the data table that contains the aggregate (where the relationship is *:1 or 1:1) |
| Measures | You will see all measures that are present in the visual and all measures from any data table containing a measure that is used in the visual. |
| Measures | You can see all non-hidden data from tables which contains the measure (where the relationship is *:1 or 1:1) |
| Measures | It will help you to show all the data from all tables which are related to tables which contains the measure with the relationship of *:1 or 1:1 |
| Measures only | You will see all the non-hidden columns from all the related tables to expand the measure. |
| Measures only | It will help you to summarize data for any duplicate rows for model measures. |
Enable Export options in Power BI Desktop
To use the Power BI Export to Excel, you must ensure to enable the export option which is present in the Power BI Desktop.
To enable the Export to Excel option, Follow the below steps:
- Go to the Power BI Desktop.
- Select File (from the top left corner) -> Click on Options and Settings-> Select Options.

- Select the Report settings which is present under the CURRENT FILE.
Once you will select the Report settings option, you can see three choices under the Export data section as shown below. The three choices are:
- Allow end-users to export summarized data from the Power BI service or Power BI Report Server
- Allow end-users to export both summarized and underlying data from the service or Report Server
- Don’t allow end-users to export any data from the service or Report Server
To do the Power BI Export to Excel, you need to enable the first choice as you can see in the below screenshot. Once all things are done, just click on OK.

Power BI Export to Excel Limitations
One of the most important things is the Limitations and considerations in Power BI Export to Excel. You should know about each and every limitation which is applied to Power BI Desktop, Power BI Service and Power BI Pro and Premium.
The Power BI Export to Excel limitations are presented below:
- The first thing you need to know is the Power BI permission. To do the Export to Excel in Power BI, you have to build a permission for the underlying dataset.
- Your application should have a maximum 150,000 number of rows which will export from an import mode report to an Excel file (.xlsx file).
- Your application (In Power BI Desktop and Power BI Service) should have a maximum 30,000 number of rows which will export from an import mode report to an Excel file (.csv file).
- In the Power BI Visualization, When you will enable the Show items with no data option, then the Underlying data will not work during Exporting.
- Also, For the below reasons, Underlying data of Power BI Export will not work as:
- If the data source is an Analysis Services Live connection.
- If the version is older than in 2016.
- If the tables in the model don’t have a unique key.
- If an administrator or report designer has disabled this feature.
- 16 MB is the maximum amount of data that Power BI can export when using the DirectQuery.
- In Power BI, the Custom Visuals and R visuals are not supporting currently.
- In Power BI Export to Excel, the Excel spreadsheet name should be the same as the Visualization name.
- If your .csv file contains Unicode character, then the text in Excel will not display properly. In that case, try to open the file in a Notepad and there you can see the Unicode will display correctly. When you want to open the file in Excel, just import the file into .csv.
- To import the file into Excel, follow these below things:
- Open Excel.
- Go to the Data tab.
- Select Get external data > From text
- Go to the local folder where the file is stored and select the .csv.
- If you are the Admin in Power BI, then you can disable the export to Excel of data option.
You may like the below Microsoft Power BI tutorials:
- Power BI Data Analysis Expressions (DAX) Tutorial
- Power BI Query Group Tutorial
- Power BI Change Data Type of a Column
- How to Split Columns in Power BI
- Power BI Buttons
- Enter Data into Power BI Desktop
- Power BI Workbooks
- Power BI Error: This content isn’t available
- Power BI On-premises Data Gateway
- How to share Power BI Dashboard and Report
- Microsoft Power BI Error: This content isn’t available
- Power BI Custom Visuals
Hence in this Microsoft Power BI Tutorial, We discussed What are the different approaches to Export the Data, how to export the data from Power BI Desktop, Export the data from the Power BI Dashboard, Export the data from the Power BI Report.
Also, We saw Power BI Export underlying data details, how to enable the Export option in Power BI Desktop and what are the limitations and considerations in Power BI Export to Excel.

Hello Everyone!! I am Bhawana a SharePoint MVP and having about 10+ years of SharePoint experience as well as in .Net technologies. I have worked in all the versions of SharePoint from wss to Office 365. I have good exposure in Customization and Migration using Nintex, Metalogix tools. Now exploring more in SharePoint 2016 🙂 Hope here I can contribute and share my knowledge to the fullest. As I believe “There is no wealth like knowledge and no poverty like ignorance”
PLANS
- Smartsheet
- Pro
- Business
- Enterprise
In the Smartsheet app, you can export any sheet or report to the following formats:
- Microsoft Excel
- Image (PNG) (Gantt Chart Only)
- Google Sheets
- Microsoft Project (Gantt Chart Only)
After exporting a sheet or report, your browser will save it on your computer. It’ll store the file you exported in a folder based on your browser settings.
Not everything is included with your export. Groupings and summary rows are excluded and attachments are dropped. To include attachments, create a backup of the sheet instead.
To quickly locate the exported file, open the Downloads folder on your browser. Use the keyboard shortcut Crl+J on Windows or Command+Option+L on macOS.
Use Send as Attachment to generate recurring exports
To send yourself or others a PDF or Excel version of your sheet or report through email on a recurring schedule, see the following help articles:
-
Send the entire sheet or report through email as a PDF or Excel (.xls) attachment.
-
Share a Report as an Attachment in Email
Export to Microsoft Excel
To export any sheet or report from Smartsheet for use in Microsoft Excel, select File > Export > Export to Excel.
The exported data may not appear in Excel exactly as it does in Smartsheet. Here is a list of some key differences:
- Gantt charts are excluded: Excel doesn’t support a Gantt chart format. Exporting a Gantt chart to Excel will export only the task list it’s based on.
- Formulas are not preserved: Due to the differences between Excel and Smartsheet formula syntax, formulas aren’t preserved on export.
To work around this, remove the equal sign at the beginning of the formulas to store them as texts, and then save the sheet. Once you open the Excel file, you can add the equal sign back and modify the syntax to make the formulas work in Excel. - Comments and sheet summaries appear on separate tabs in the exported workbook
- Reports are limited to 20,000 rows: If your report has more than 20,000 rows, you can create multiple reports that pull in fewer rows and export each report as a separate Excel file. For more information about working with reports, see Creating Reports.
If a sort was applied to your report, fewer than 20,000 rows may be exported. - Not all column types are supported in Excel: Excel doesn’t support Dropdown, Contact List, Checkbox, and Symbols ( Harvey Balls, etc.) columns. When you export sheets that use these column types, only text values will be exported. Values in Boolean column types (Checkbox, etc.) will be exported as True or False, according to the state of the item in the cell.
Export to Image (PNG Format)
To export any sheet or report that includes a Gantt chart to a PNG format, follow these steps:
- Open the sheet you want to export.
- On the toolbar, switch the sheet or report to Gantt View.
- Select File > Export > Export Gantt to Image (PNG).
- In the Selection section of the Export Gantt to Image (PNG) form, choose to export the entire sheet or selected rows.
- If the Selected Rows option isn’t available, close the Export Gantt to Image (PNG) form, select the rows to print, and then reopen the form.
- In the Options section, select which columns to include in the image.
- By default, only the Primary Column is included, but you can select the Primary Column name—or the Edit button—to include additional columns.
Customize the printed timeline in your image export
If you use a Custom Date Range, the time span shown depends on your Timeline Display choice. For example, in the Project Settings form, you set the Primary heading of your timeline display to Years. You also chose March 1 as your start date and June 30 as your end date. The PDF will show a complete year because of your timeline choice.
To narrow the printed timeline, in the Timeline Display tab of the Project Settings form, change the Primary heading choice to Quarters or Weeks. For more information, see Modify Dependency and Gantt Settings.
Export to a Google Sheet
To export any sheet or report from Smartsheet to Google Sheets, select File > Export > Export to Google Sheets.
Similar to files exported in Excel, files exported to Google Sheets won’t appear exactly as it does in Smartsheet. Here’s a list of key differences:
- Gantt charts are excluded: Google Sheets doesn’t support a Gantt chart format. Exporting a Gantt chart to Google will export only the task list.
- Not all column types are supported in Google Sheets: Similar to Excel, Google Sheets doesn’t support Dropdown, Contact List, Checkbox, and Symbols (Harvey balls, etc.) columns. When you export sheets that use these column types, only text values will be exported. Values in Boolean columns (Checkbox, etc.) will be exported as True or False, according to the state of the item in the cell.
- Sheet summaries appear on a separate tab in the exported workbook
- Formulas are not preserved on file exports: Smartsheet’s formula syntax differs from Google Sheets.
To work around this, remove the equal sign at the beginning of the formulas to store them as texts, and then save the sheet. Once you open the Google Sheet, you can add the equal sign back and modify the syntax to make the formula work in Google Sheets. - To revoke Smartsheet’s access or change the Google account you’re exporting to, see Google’s instructions to remove site or app access.
Can’t find your download? Check your personal Google Drive. That’s where Smartsheet places your export(s).
Export to Microsoft Project
Any sheet that includes a Gantt chart can be exported to Microsoft Project format. This option is not available for reports.
- Open the sheet you want to export.
- On the toolbar, switch the sheet to Gantt View.
- To download the sheet in XML format, select File > Export > Export to MS Project.
- To import the XML file, open Microsoft Project.
Because Smartsheet and Microsoft Project differ in their functionality, the exported sheet may display differently in either application. In these cases, you may want to copy data from one program, and paste it into the other using keyboard shortcuts Ctrl+C and Ctrl+V (Windows) or Command+C and Command+V (macOS).
Export to PDF
To export a sheet or a report to PDF format, select File > Export > Export to PDF.
When exporting a sheet or a report to PDF format, you can set up its layout, and choose which columns to include.
In the Options section of the PDF Setup form, you can’t choose which columns to include in the PDF file if your sheet or report isn’t in Gantt View. Learn more about creating a printable PDF in the Print a sheet or report from Smartsheet help article.