
Basic Concepts
We now show another test for homogeneity of variances using Bartlett’s test statistic B, which is approximately chi-square:
![]()
where k = number of groups, each of which contains nj elements, and s2 is the pooled variance, which as we have seen elsewhere is MSW, and
![]()
B can also be defined as follows:

Here MSW is the pooled variance across all groups. Thus the null hypothesis that all the group variances are equal is rejected if p-value < α where p-value = CHISQ.DIST.RT(B, k–1). B is only approximately chi-square, but the approximation should be good enough if there are at least 3 observations in each sample.
Bartlett’s test is very sensitive to departures from normality. If the samples come from non-normal distributions, then Bartlett’s test may simply be testing for non-normality. Levene’s test is less sensitive to departures from normality.
Example
Example 1: Use Bartlett’s test to determine whether the 4 samples in Example 2 of Basic Concepts for ANOVA have significantly different population variances.

Figure 1 – Bartlett’s test for the data in Example 1
We obtain Bartlett’s test statistic B (cell I6 of Figure 1) by calculating the numerator and denominator of B as described above (cells I4 and I5). To do this we first calculate the values dfj, 1/dfj,  , and ln (cells in the range B13:E16). We also calculate dfW, 1/dfW, MSW, and ln MSW (cells in range F13:F16). Note that MSW = SUMPRODUCT(B13:E13,B15:E15)/F13 in cell F15.
Since p-value = CHISQ.DIST.RT(B, k–1) = CHISQ.DIST.RT(1.88, 3) = .979 > .05 = α, we don’t reject the null hypothesis, and so conclude that there is no significant difference between the variances of the four methods.
Note that if we change the first sample for Method 4 to 185 (instead of 85) and repeat the analysis we would find that there would be a significant difference in the variances (B = 17.23, p-value = .001 < .05 = α). This would be due to this one outlier. That it was an outlier would show up easily in any graphic representation. We would then need to decide whether this item was simply an error in measurement or a true measurement (see Outliers in ANOVA).
Worksheet Function
Real Statistics Function: The Real Statistics Resource Pack provides the following function.
BARTLETT(R1) = p-value of Bartlett’s homogeneity of variances test on the data in range R1
For Example 1, we see that BARTLETT(B4:E11) = .979442.
Examples Workbook
Click here to download the Excel workbook with the examples described on this webpage.
References
NIST (2013) Bartlett’s test
https://www.itl.nist.gov/div898/handbook/eda/section3/eda357.htm#:~:text=Bartlett’s%20test%20(Snedecor%20and%20Cochran,equal%20across%20groups%20or%20samples.
All Things Statistics (2021) Bartletts test. Inferential Statistics
https://allthingsstatistics.com/inferential-statistics/bartle
This tutorial will help you compare several observed variances using Levene’s and Bartlett’s tests, in Excel with the XLSTAT software.
Not sure this is the statistical test you are looking for? Check out this guide.
Dataset for the Levene and Bartlett tests for the comparison of variances
The data are extracted from the Iris example, used in several of our tutorials [Fisher M. (1936), The Use of Multiple Measurements in Taxonomic Problems. Annals of Eugenics, 7, 179 -188] and correspond to 150 Iris flowers, described by their petal width and the corresponding species.
Three different species have been included in this study: setosa, versicolor and virginica.
Our goal is to test if variance of the petal width is identical across species or not.
The same data are displayed in two alternative formats accepted by XLSTAT: either you have one column with the petal widths, and one column with the species, or you can split the data into three columns, one per species.
Setting up a test comparing variance: Levene and Bartlett tests
After opening XLSTAT, select the XLSTAT / Parametric test / k-sample comparison of variances, or click on the corresponding button of the Parametric tests toolbar (see below).

Once you’ve clicked on the button, a dialog box appears. XLSTAT offers two formats to select the data. Either all the numerical data are in one column, and a second column corresponds to the sample descritors, or you have the different samples split into as many columns as there are samples.
The first dialog box displayed below corresponds to the case where you have one column with all the petal widths and one column with the corresponding species.

The second dialog box displayed below corresponds to the case where you have one column for each species.
There are two possibilities for the Levene’s test, one based on the mean and the second on the median. While they often give very close results, the one based on the median is usually recommended.
The computations begin once you have clicked on OK. The results will then be displayed.
Results of a test comparing variance — Levene and Bartlett tests
The first results displayed are the descriptive statistics for the various samples. Then the results of the tests are displayed.

The two tests agree that one should reject the null hypothesis that the variance of the petal widths is identical for the three samples.
Was this article useful?
- Yes
- No
Тест Бартлетта на однородность дисперсий (определение и пример)
17 авг. 2022 г.
читать 2 мин
Тест Бартлетта — это статистический тест, который используется для определения того, равны ли дисперсии между несколькими группами.
Многие статистические тесты (например, однофакторный дисперсионный анализ ) предполагают, что дисперсии одинаковы для всех выборок. Для проверки этого предположения можно использовать тест Бартлетта.
Следующие шаги объясняют, как выполнить тест Бартлетта.
Примечание. Не путайте этот тест с тестом сферичности Бартлетта , который используется для сравнения наблюдаемой корреляционной матрицы с единичной матрицей.
Шаги для выполнения теста Бартлетта
Тест Бартлетта использует следующие нулевые и альтернативные гипотезы :
H 0 : Дисперсия среди каждой группы равна.
H A : По крайней мере, одна группа имеет дисперсию, не равную остальным.
Статистику теста можно рассчитать следующим образом:
B = (nk)lns 2 – Σ(n j -1)lns j 2 / c
куда:
- n: общее количество наблюдений во всех группах.
- k: общее количество групп
- ln: это означает «натуральное бревно».
- s 2 : объединенная дисперсия
- n j : количество наблюдений в группе j
- s j 2 : Дисперсия группы j
И где c рассчитывается как:
- c = 1 + (1/3(k-1))*(Σ(1/(n j -1)) – (1/(nk))
Эта тестовая статистика соответствует распределению хи-квадрат с k-1 степенями свободы. То есть В ~ Х 2 (к-1).
Если значение p , соответствующее тестовой статистике, меньше некоторого уровня значимости (например, α = 0,05), то мы можем отклонить нулевую гипотезу и сделать вывод, что не все группы имеют одинаковую дисперсию.
Пример: тест Бартлетта
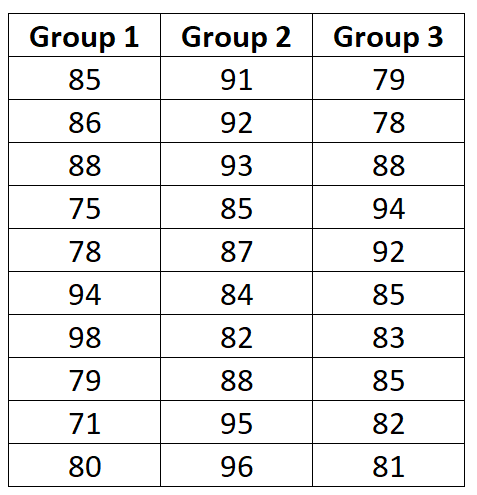
Предположим, профессор хочет знать, приводят ли три разные методики обучения к разным средним экзаменационным баллам.
Она случайным образом назначает 10 студентов для использования каждой техники в течение одной недели, а затем заставляет каждого студента сдать экзамен одинаковой сложности.
Экзаменационные баллы 30 студентов показаны ниже:
Профессор хочет провести односторонний дисперсионный анализ, чтобы увидеть, приводят ли три метода к разным средним экзаменационным баллам, но сначала она должна провести тест Бартлетта, чтобы убедиться, что три группы имеют одинаковые отклонения.
Выполнять тест Бартлетта вручную неудобно, поэтому мы введем следующие значения данных в калькулятор теста Бартлетта :
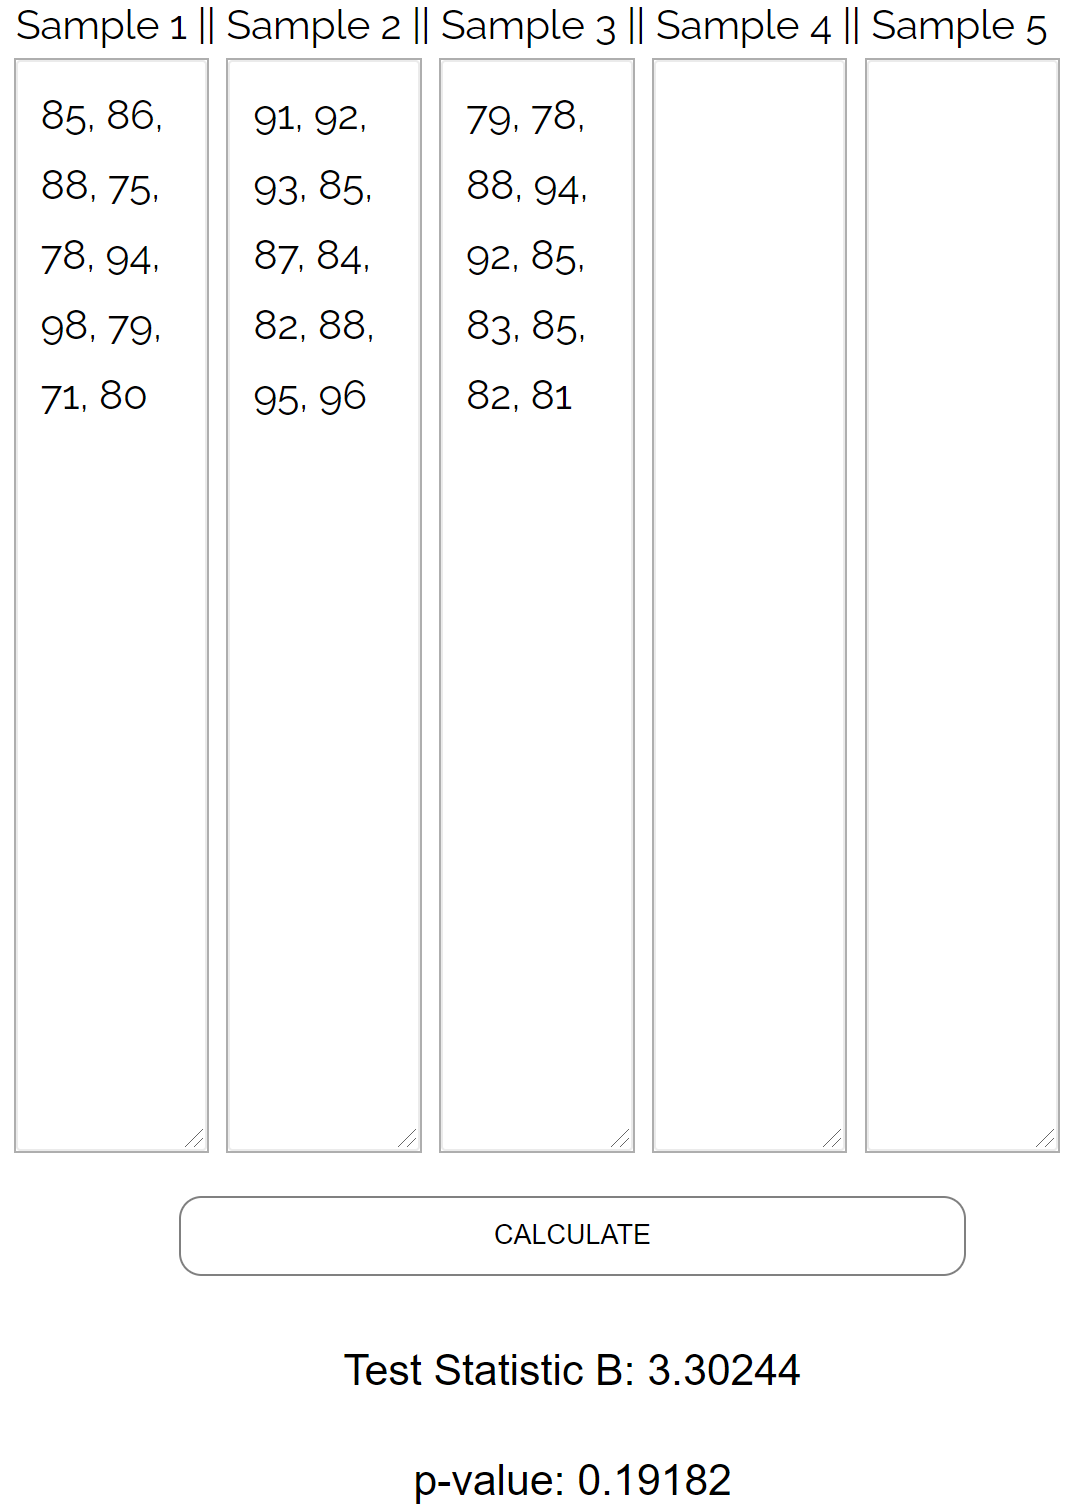
Тест возвращает следующие результаты:
- Статистика теста B : 3,30244
- P-значение: 0,19182
Поскольку p-значение не меньше 0,05, профессор не сможет отвергнуть нулевую гипотезу. Другими словами, у нее нет достаточных доказательств того, что эти три группы имеют разные дисперсии.
Таким образом, она может приступить к выполнению однофакторного дисперсионного анализа.
Дополнительные ресурсы
Как выполнить тест Бартлетта в R (шаг за шагом)
Как выполнить тест Бартлетта в Python (шаг за шагом)
currentPath: /vid/aHR0cHM6Ly93d3cueW91dHViZS5jb20vd2F0Y2g_dj1pVlhnMkZiOGR1WQ%3D%3D; canonicalPath: /vid/aHR0cHM6Ly93d3cueW91dHViZS5jb20vd2F0Y2g_dj1pVlhnMkZiOGR1WQ%3D%3D;
Скачайте это видео через UDL Client
- Видео mp4
HD+
со звуком
- Mp3 в максимальном качестве
- Файлы любого размера

Подождите немного, мы готовим ссылки для удобного просмотра видео без рекламы и его скачивания.
Описание:
I hope this video helps you understand how to do the Bartlett test, which is used to test homogeneity of variances among groups.
…
Готовим варианты загрузки
* — Если видео проигрывается в новой вкладке, перейдите в неё, а затем кликните по видео правой кнопкой мыши и выберите пункт «Сохранить видео как…»
** — Ссылка предназначенная для онлайн воспроизведения в специализированных плеерах
Bartlett’s Test is a statistical test that is used to determine whether or not the variances between several groups are equal.
Many statistical tests (like a one-way ANOVA) assume that variances are equal across samples. Bartlett’s test can be used to verify that assumption.
The following steps explain how to perform Bartlett’s test.
Note: Don’t confuse this test with Bartlett’s Test of Sphericity, which is used to compare an observed correlation matrix to the identity matrix.
Steps to Perform Bartlett’s Test
Bartlett’s Test uses the following null and alternative hypotheses:
H0: The variance among each group is equal.
HA: At least one group has a variance that is not equal to the rest.
The test statistic can be calculated as follows:
B = (n-k)lns2 – Σ(nj-1)lnsj2 / c
where:
- n: The total number of observations across all groups
- k: The total number of groups
- ln: This stands for “natural log”
- s2: The pooled variance
- nj: The number of observations in group j
- sj2: The variance of group j
And where c is calculated as:
- c = 1 + (1/3(k-1))*(Σ(1/(nj-1)) – (1/(n-k))
This test statistic follows a Chi-Square distribution with k-1 degrees of freedom. That is, B ~ X2(k-1).
If the p-value that corresponds to the test statistic is less than some significance level (like α = 0.05) then we can reject the null hypothesis and conclude that not all groups have the same variance.
Example: Bartlett’s Test
Suppose a professor wants to know if three different studying techniques lead to different average exam scores.
She randomly assigns 10 students to use each technique for one week, then makes each student take an exam of equal difficulty.
The exam scores of the 30 students are shown below:

The professor wants to conduct a one-way ANOVA to see if the three techniques lead to different average exam scores, but she first must conduct Bartlett’s Test to verify that the three groups have equal variances.
It’s cumbersome to perform Bartlett’s Test by hand, so we’ll enter the following data values into the Bartlett’s Test Calculator:

The test returns the following results:
- Test statistic B: 3.30244
- P-value: 0.19182
Since the p-value is not less than 0.05, the professor will fail to reject the null hypothesis. In other words, she doesn’t have sufficient evidence to say that the three groups have different variances.
Thus, she can proceed to perform the one-way ANOVA.
Additional Resources
How to Perform Bartlett’s Test in R (Step-by-Step)
How to Perform Bartlett’s Test in Python (Step-by-Step)