
Содержание
- 1 Как создать таблицу в Excel для чайников
- 1.1 Как выделить столбец и строку
- 1.2 Как изменить границы ячеек
- 1.3 Как вставить столбец или строку
- 1.4 Пошаговое создание таблицы с формулами
- 2 Как создать таблицу в Excel: пошаговая инструкция
- 3 Как работать с таблицей в Excel
- 4 Как сделать Турнирную таблицу в программе «Excel».
Таблицы в Excel представляют собой ряд строк и столбцов со связанными данными, которыми вы управляете независимо друг от друга.
Работая в Excel с таблицами, вы сможете создавать отчеты, делать расчеты, строить графики и диаграммы, сортировать и фильтровать информацию.
Если ваша работа связана с обработкой данных, то навыки работы с таблицами в Эксель помогут вам сильно сэкономить время и повысить эффективность.
Как работать в Excel с таблицами. Пошаговая инструкция
Прежде чем работать с таблицами в Эксель, последуйте рекомендациям по организации данных:
- Данные должны быть организованы в строках и столбцах, причем каждая строка должна содержать информацию об одной записи, например о заказе;
- Первая строка таблицы должна содержать короткие, уникальные заголовки;
- Каждый столбец должен содержать один тип данных, таких как числа, валюта или текст;
- Каждая строка должна содержать данные для одной записи, например, заказа. Если применимо, укажите уникальный идентификатор для каждой строки, например номер заказа;
- В таблице не должно быть пустых строк и абсолютно пустых столбцов.
1. Выделите область ячеек для создания таблицы

Выделите область ячеек, на месте которых вы хотите создать таблицу. Ячейки могут быть как пустыми, так и с информацией.
2. Нажмите кнопку “Таблица” на панели быстрого доступа
На вкладке “Вставка” нажмите кнопку “Таблица”.
3. Выберите диапазон ячеек

В всплывающем вы можете скорректировать расположение данных, а также настроить отображение заголовков. Когда все готово, нажмите “ОК”.
4. Таблица готова. Заполняйте данными!

Поздравляю, ваша таблица готова к заполнению! Об основных возможностях в работе с умными таблицами вы узнаете ниже.
Форматирование таблицы в Excel
Для настройки формата таблицы в Экселе доступны предварительно настроенные стили. Все они находятся на вкладке “Конструктор” в разделе “Стили таблиц”:
Если 7-ми стилей вам мало для выбора, тогда, нажав на кнопку, в правом нижнем углу стилей таблиц, раскроются все доступные стили. В дополнении к предустановленным системой стилям, вы можете настроить свой формат.
Помимо цветовой гаммы, в меню “Конструктора” таблиц можно настроить:
- Отображение строки заголовков – включает и отключает заголовки в таблице;
- Строку итогов – включает и отключает строку с суммой значений в колонках;
- Чередующиеся строки – подсвечивает цветом чередующиеся строки;
- Первый столбец – выделяет “жирным” текст в первом столбце с данными;
- Последний столбец – выделяет “жирным” текст в последнем столбце;
- Чередующиеся столбцы – подсвечивает цветом чередующиеся столбцы;
- Кнопка фильтра – добавляет и убирает кнопки фильтра в заголовках столбцов.
Как добавить строку или столбец в таблице Excel
Даже внутри уже созданной таблицы вы можете добавлять строки или столбцы. Для этого кликните на любой ячейке правой клавишей мыши для вызова всплывающего окна:
- Выберите пункт “Вставить” и кликните левой клавишей мыши по “Столбцы таблицы слева” если хотите добавить столбец, или “Строки таблицы выше”, если хотите вставить строку.

- Если вы хотите удалить строку или столбец в таблице, то спуститесь по списку в сплывающем окне до пункта “Удалить” и выберите “Столбцы таблицы”, если хотите удалить столбец или “Строки таблицы”, если хотите удалить строку.

Как отсортировать таблицу в Excel
Для сортировки информации при работе с таблицей, нажмите справа от заголовка колонки “стрелочку”, после чего появится всплывающее окно:

В окне выберите по какому принципу отсортировать данные: “по возрастанию”, “по убыванию”, “по цвету”, “числовым фильтрам”.
Как отфильтровать данные в таблице Excel
Для фильтрации информации в таблице нажмите справа от заголовка колонки “стрелочку”, после чего появится всплывающее окно:

- “Текстовый фильтр” отображается когда среди данных колонки есть текстовые значения;
- “Фильтр по цвету” также как и текстовый, доступен когда в таблице есть ячейки, окрашенные в отличающийся от стандартного оформления цвета;
- “Числовой фильтр” позволяет отобрать данные по параметрам: “Равно…”, “Не равно…”, “Больше…”, “Больше или равно…”, “Меньше…”, “Меньше или равно…”, “Между…”, “Первые 10…”, “Выше среднего”, “Ниже среднего”, а также настроить собственный фильтр.
- В всплывающем окне, под “Поиском” отображаются все данные, по которым можно произвести фильтрацию, а также одним нажатием выделить все значения или выбрать только пустые ячейки.
Если вы хотите отменить все созданные настройки фильтрации, снова откройте всплывающее окно над нужной колонкой и нажмите “Удалить фильтр из столбца”. После этого таблица вернется в исходный вид.
Как посчитать сумму в таблице Excel
Для того чтобы посчитать сумму колонки в конце таблицы, нажмите правой клавишей мыши на любой ячейке и вызовите всплывающее окно:
В списке окна выберите пункт “Таблица” => “Строка итогов”:
Внизу таблица появится промежуточный итог. Нажмите левой клавишей мыши на ячейке с суммой.
В выпадающем меню выберите принцип промежуточного итога: это может быть сумма значений колонки, “среднее”, “количество”, “количество чисел”, “максимум”, “минимум” и т.д.
Как в Excel закрепить шапку таблицы
Таблицы, с которыми приходится работать, зачастую крупные и содержат в себе десятки строк. Прокручивая таблицу “вниз” сложно ориентироваться в данных, если не видно заголовков столбцов. В Эксель есть возможность закрепить шапку в таблице таким образом, что при прокрутке данных вам будут видны заголовки колонок.
Для того чтобы закрепить заголовки сделайте следующее:
- Перейдите на вкладку “Вид” в панели инструментов и выберите пункт “Закрепить области”:
- Выберите пункт “Закрепить верхнюю строку”:
- Теперь, прокручивая таблицу, вы не потеряете заголовки и сможете легко сориентироваться где какие данные находятся:
Как перевернуть таблицу в Excel
Представим, что у нас есть готовая таблица с данными продаж по менеджерам:
На таблице сверху в строках указаны фамилии продавцов, в колонках месяцы. Для того чтобы перевернуть таблицу и разместить месяцы в строках, а фамилии продавцов нужно:
- Выделить таблицу целиком (зажав левую клавишу мыши выделить все ячейки таблицы) и скопировать данные (CTRL+C):
- Переместить курсор мыши на свободную ячейку и нажать правую клавишу мыши. В открывшемся меню выбрать “Специальная вставка” и нажать на этом пункте левой клавишей мыши:
- В открывшемся окне в разделе “Вставить” выбрать “значения” и поставить галочку в пункте “транспонировать”:
- Готово! Месяцы теперь размещены по строкам, а фамилии продавцов по колонкам. Все что остается сделать – это преобразовать полученные данные в таблицу.
В этой статье вы ознакомились с принципами работы в Excel с таблицами, а также основными подходами в их создании. Пишите свои вопросы в комментарии!
Программа Microsoft Excel удобна для составления таблиц и произведения расчетов. Рабочая область – это множество ячеек, которые можно заполнять данными. Впоследствии – форматировать, использовать для построения графиков, диаграмм, сводных отчетов.
Работа в Экселе с таблицами для начинающих пользователей может на первый взгляд показаться сложной. Она существенно отличается от принципов построения таблиц в Word. Но начнем мы с малого: с создания и форматирования таблицы. И в конце статьи вы уже будете понимать, что лучшего инструмента для создания таблиц, чем Excel не придумаешь.
Работа с таблицами в Excel для чайников не терпит спешки. Создать таблицу можно разными способами и для конкретных целей каждый способ обладает своими преимуществами. Поэтому сначала визуально оценим ситуацию.
Посмотрите внимательно на рабочий лист табличного процессора:
Это множество ячеек в столбцах и строках. По сути – таблица. Столбцы обозначены латинскими буквами. Строки – цифрами. Если вывести этот лист на печать, получим чистую страницу. Без всяких границ.
Сначала давайте научимся работать с ячейками, строками и столбцами.
Как выделить столбец и строку
Чтобы выделить весь столбец, щелкаем по его названию (латинской букве) левой кнопкой мыши.
Для выделения строки – по названию строки (по цифре).
Чтобы выделить несколько столбцов или строк, щелкаем левой кнопкой мыши по названию, держим и протаскиваем.
Для выделения столбца с помощью горячих клавиш ставим курсор в любую ячейку нужного столбца – нажимаем Ctrl + пробел. Для выделения строки – Shift + пробел.
Как изменить границы ячеек
Если информация при заполнении таблицы не помещается нужно изменить границы ячеек:
- Передвинуть вручную, зацепив границу ячейки левой кнопкой мыши.
- Когда длинное слово записано в ячейку, щелкнуть 2 раза по границе столбца / строки. Программа автоматически расширит границы.
- Если нужно сохранить ширину столбца, но увеличить высоту строки, воспользуемся кнопкой «Перенос текста» на панели инструментов.
Для изменения ширины столбцов и высоты строк сразу в определенном диапазоне выделяем область, увеличиваем 1 столбец /строку (передвигаем вручную) – автоматически изменится размер всех выделенных столбцов и строк.
Примечание. Чтобы вернуть прежний размер, можно нажать кнопку «Отмена» или комбинацию горячих клавиш CTRL+Z. Но она срабатывает тогда, когда делаешь сразу. Позже – не поможет.
Чтобы вернуть строки в исходные границы, открываем меню инструмента: «Главная»-«Формат» и выбираем «Автоподбор высоты строки»
Для столбцов такой метод не актуален. Нажимаем «Формат» — «Ширина по умолчанию». Запоминаем эту цифру. Выделяем любую ячейку в столбце, границы которого необходимо «вернуть». Снова «Формат» — «Ширина столбца» — вводим заданный программой показатель (как правило это 8,43 — количество символов шрифта Calibri с размером в 11 пунктов). ОК.
Как вставить столбец или строку
Выделяем столбец /строку правее /ниже того места, где нужно вставить новый диапазон. То есть столбец появится слева от выделенной ячейки. А строка – выше.
Нажимаем правой кнопкой мыши – выбираем в выпадающем меню «Вставить» (или жмем комбинацию горячих клавиш CTRL+SHIFT+»=»).
Отмечаем «столбец» и жмем ОК.
Совет. Для быстрой вставки столбца нужно выделить столбец в желаемом месте и нажать CTRL+SHIFT+»=».
Все эти навыки пригодятся при составлении таблицы в программе Excel. Нам придется расширять границы, добавлять строки /столбцы в процессе работы.
Пошаговое создание таблицы с формулами
- Заполняем вручную шапку – названия столбцов. Вносим данные – заполняем строки. Сразу применяем на практике полученные знания – расширяем границы столбцов, «подбираем» высоту для строк.
- Чтобы заполнить графу «Стоимость», ставим курсор в первую ячейку. Пишем «=». Таким образом, мы сигнализируем программе Excel: здесь будет формула. Выделяем ячейку В2 (с первой ценой). Вводим знак умножения (*). Выделяем ячейку С2 (с количеством). Жмем ВВОД.
- Когда мы подведем курсор к ячейке с формулой, в правом нижнем углу сформируется крестик. Он указываем на маркер автозаполнения. Цепляем его левой кнопкой мыши и ведем до конца столбца. Формула скопируется во все ячейки.
- Обозначим границы нашей таблицы. Выделяем диапазон с данными. Нажимаем кнопку: «Главная»-«Границы» (на главной странице в меню «Шрифт»). И выбираем «Все границы».
Теперь при печати границы столбцов и строк будут видны.
С помощью меню «Шрифт» можно форматировать данные таблицы Excel, как в программе Word.
Поменяйте, к примеру, размер шрифта, сделайте шапку «жирным». Можно установить текст по центру, назначить переносы и т.д.
Как создать таблицу в Excel: пошаговая инструкция
Простейший способ создания таблиц уже известен. Но в Excel есть более удобный вариант (в плане последующего форматирования, работы с данными).
Сделаем «умную» (динамическую) таблицу:
- Переходим на вкладку «Вставка» — инструмент «Таблица» (или нажмите комбинацию горячих клавиш CTRL+T).
- В открывшемся диалоговом окне указываем диапазон для данных. Отмечаем, что таблица с подзаголовками. Жмем ОК. Ничего страшного, если сразу не угадаете диапазон. «Умная таблица» подвижная, динамическая.
Примечание. Можно пойти по другому пути – сначала выделить диапазон ячеек, а потом нажать кнопку «Таблица».
Теперь вносите необходимые данные в готовый каркас. Если потребуется дополнительный столбец, ставим курсор в предназначенную для названия ячейку. Вписываем наименование и нажимаем ВВОД. Диапазон автоматически расширится.
Если необходимо увеличить количество строк, зацепляем в нижнем правом углу за маркер автозаполнения и протягиваем вниз.
Как работать с таблицей в Excel
С выходом новых версий программы работа в Эксель с таблицами стала интересней и динамичней. Когда на листе сформирована умная таблица, становится доступным инструмент «Работа с таблицами» — «Конструктор».
Здесь мы можем дать имя таблице, изменить размер.
Доступны различные стили, возможность преобразовать таблицу в обычный диапазон или сводный отчет.
Возможности динамических электронных таблиц MS Excel огромны. Начнем с элементарных навыков ввода данных и автозаполнения:
- Выделяем ячейку, щелкнув по ней левой кнопкой мыши. Вводим текстовое /числовое значение. Жмем ВВОД. Если необходимо изменить значение, снова ставим курсор в эту же ячейку и вводим новые данные.
- При введении повторяющихся значений Excel будет распознавать их. Достаточно набрать на клавиатуре несколько символов и нажать Enter.
- Чтобы применить в умной таблице формулу для всего столбца, достаточно ввести ее в одну первую ячейку этого столбца. Программа скопирует в остальные ячейки автоматически.
- Для подсчета итогов выделяем столбец со значениями плюс пустая ячейка для будущего итога и нажимаем кнопку «Сумма» (группа инструментов «Редактирование» на закладке «Главная» или нажмите комбинацию горячих клавиш ALT+»=»).
Если нажать на стрелочку справа каждого подзаголовка шапки, то мы получим доступ к дополнительным инструментам для работы с данными таблицы.
Иногда пользователю приходится работать с огромными таблицами. Чтобы посмотреть итоги, нужно пролистать не одну тысячу строк. Удалить строки – не вариант (данные впоследствии понадобятся). Но можно скрыть. Для этой цели воспользуйтесь числовыми фильтрами (картинка выше). Убираете галочки напротив тех значений, которые должны быть спрятаны.
Для настоящего болельщика не всегда достаточно смотреть турнирные таблицы на сайтах интернета. Всегда интереснее самому вести статистику сыгранных матчей , проводить аналитику, строить графики эффективности команд и предугадывать результаты матчей на основании проведенных расчетов .
В этом Вам поможет таблица «График турнирная таблица по футболу в Excel» созданная в программе «Эксель». На основании данных таблицы вы сможете не только отслеживать время проведения игр, но и анализировать итоги игр, планировать результаты будущих игр.
Как сделать Турнирную таблицу в программе «Excel».
Для начала следует расчертить «шапку таблицы». В шапку вносятся даты игр, места проведения матчей, наименования команд, результаты сыгранных матчей: количество забитых и пропущенных голов, количество побед, поражений и игр, сыгранных в ничью.
В колонку «Осталось дней до матча.» вносится формула вычисляющая, сколько дней остается до матча: «=ЕСЛИ((C2-СЕГОДНЯ())>0;C2-СЕГОДНЯ(); «Прошел»)».
В колонке «Количество игр» ставится формула, подсчитывающая автоматически количество сыгранных командой игр: «=СЧЁТЕСЛИ($F$2:F2;F2)»
На листе с графиком – турнирной таблицей выведена сводная таблица, которая при обновлении производит подсчет забитых и пропущенных мячей, а так же количество побед.
Skip to content
10/29/22 New Addition:
FIFA World Cup 2022 Team Roster in Excel. This is Macro-free Excel file that includes latest team roster of the 32 countries qualified for FIFA World Cup 2022.
I am excited to announce the FIFA World Cup 2022 Interactive Excel Score Chart. The score charts are available in two versions.
- Macro-free versions:
- The macro free version contains FIFA World Cup 2022 schedule and score table.
- The user manually inputs match scores. Do not require knowledge in Excel.
- Fully automatic score table update.
- Fully automatic team assignments in the knock-out stages.
- Compatible with FIFA tie break rules.
- Excel VB Macro version with Monte Carlo score simulations.
- FIFA World Cup 2022 schedule, calendar and score table.
- Tally scores at group and final stages.
- Predict game scores based on team SPI values.
- Comprehensive SPI from fivethirtyeight.com
- Run Monte Carlo simulations to predict World Cup winner.
- Adjust team SPI strength.
- Support multiple time zones.
- Automated game score and SPI values update.
- Clickable buttons to execute macros. No Excel knowledge required.
Download FIFA World Cup 2022 Interactive Score Chart. Enjoy!
Macro-free version:
Excel VB Macro version with Monte Carlo Simulations:
FIFA World Cup 2022 Team Roster:
FIFA World Cup 2022 Player Stats and Game Stats
Return to the Download page to download other score tables.
Перейти к содержимому
Для настоящего болельщика не всегда достаточно смотреть турнирные таблицы на сайтах интернета. Всегда интереснее самому вести статистику сыгранных матчей , проводить аналитику, строить графики эффективности команд и предугадывать результаты матчей на основании проведенных расчетов .
В этом Вам поможет таблица «График турнирная таблица по футболу в Excel» созданная в программе «Эксель». На основании данных таблицы вы сможете не только отслеживать время проведения игр, но и анализировать итоги игр, планировать результаты будущих игр.
Как сделать Турнирную таблицу в программе «Excel».
Для начала следует расчертить «шапку таблицы». В шапку вносятся даты игр, места проведения матчей, наименования команд, результаты сыгранных матчей: количество забитых и пропущенных голов, количество побед, поражений и игр, сыгранных в ничью.
В колонку «Осталось дней до матча.» вносится формула вычисляющая, сколько дней остается до матча: «=ЕСЛИ((C2-СЕГОДНЯ())>0;C2-СЕГОДНЯ(); «Прошел»)».
В колонке «Количество игр» ставится формула, подсчитывающая автоматически количество сыгранных командой игр: «=СЧЁТЕСЛИ($F$2:F2;F2)»
На листе с графиком – турнирной таблицей выведена сводная таблица, которая при обновлении производит подсчет забитых и пропущенных мячей, а так же количество побед.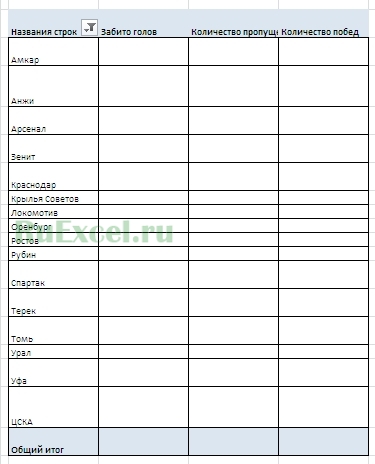
Сделал две формулы. Эту формулу нужно вставить в D2, а затем копировать в строки 2, 4 и так далее через одну
| Код |
|---|
=ЕСЛИ(СЧЁТЕСЛИМН(Календарь!$A:$A;Таблица!D$1;Календарь!$C:$C;Таблица!$B2)=0;"";ВПР($B2;СМЕЩ(ИНДЕКС(Календарь!$A:$A;ПОИСКПОЗ(D$1;Календарь!$A:$A;0)):ИНДЕКС(Календарь!$A:$A;10000);;2;;3);3;0)) |
Эту формулу нужно вставить в D3 и затем копировать в строки 3, 5 и так далее через одну
| Код |
|---|
=ЕСЛИ(СЧЁТЕСЛИМН(Календарь!$A:$A;Таблица!D$1;Календарь!$D:$D;Таблица!$B2)=0;"";ВПР($B2;СМЕЩ(ИНДЕКС(Календарь!$A:$A;ПОИСКПОЗ(D$1;Календарь!$A:$A;0)):ИНДЕКС(Календарь!$A:$A;10000);;3;;2);2;0)) |
Предполагается, что на листе Календарь не более 10 000 строк с данными. Если больше, то нужно корректировать формулы.
Прилагаю файл, как у меня получилось.
Website last updated: 2023-04-13
New (since 27.12.2022):
Manage your own rankings in the same way as the FIFA world rankings  More
More
New (since 25.02.2023):
Tournament schedule for your own Premier League with Excel More
Excel Schedule
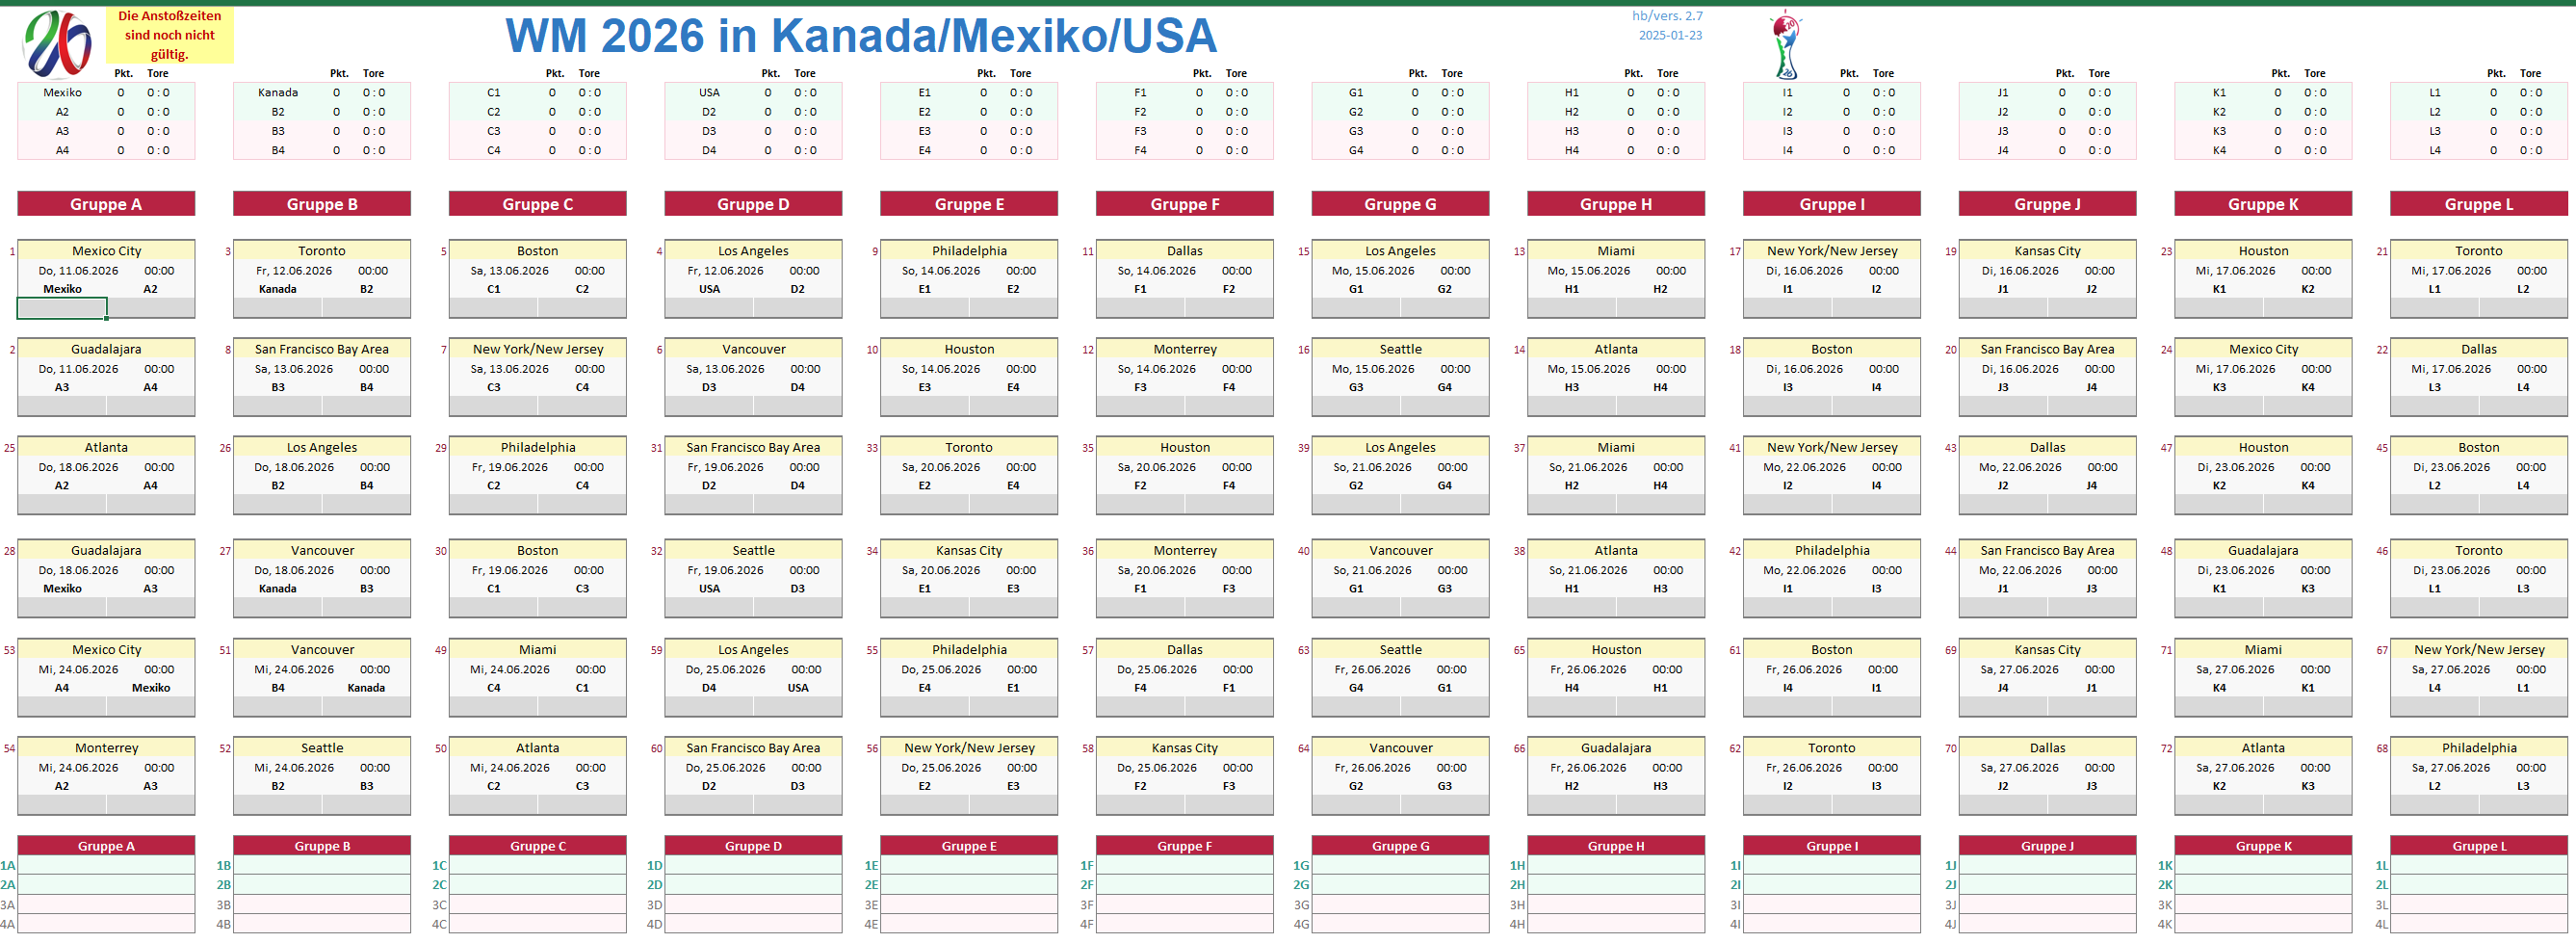
Another change to the tournament mode for the 2026 World Cup (FIFA decision of March 14, 2023):
12 groups of four instead of 8 groups of three. That means: 104 matches instead of 80 matches.
Full picture
Just enter match results — everything else is automatic!
★ NO EXCEL SKILLS REQUIRED ★ 
![]()
Schedule (Last updated: March 26, 2023)
Updated match plan with 12 groups of four!
Download .xlsx
It is a fully automatic Excel schedule with automatic updating of the group tables, automatic assignment of teams in the knockout round, multilingual, choice of time zone, consideration of all FIFA rules including fair play and drawing of lots, highlighting the games of the current day, also an overview of all direct comparisons with the corresponding tables in the case of three teams.
New contest mode
After the World Cup is before the World Cup.
(Original quote from the German national coach Sepp Herberger in 1954: ‘After the match is before the match.’)
The next World Cup is scheduled to take place in June and July 2026. And everything should be different at the next World Cup. That’s what all teams who went home early and disappointed with the early elimination hope for.
But FIFA also wants to do everything differently. It was already decided in 2017 that instead of 32 teams, 48 teams would now take part. In the group stage, there should be sixteen groups of three instead of eight groups of four. The KO round should be extended by a round of 32.
However, this match plan generated a lot of criticism. Mainly, the increased risk of collusion in the last group match was pointed out.
Finally, on March 14, 2023, it was decided to change the tournament mode again. There are twelve groups of four in the group stage. The first and second place winners in each group and the eight best third-placed teams qualify for the round of 32. So the number of matches increases from 64 matches to 104 matches.
What is also new at this World Cup is that the eight best third-placed teams qualify for the knockout round. When planning the encounters in the round of 32, it should be ensured that two teams from the same group do not meet in the round of 32 under any circumstances. Since it is not known in advance from which of the 12 groups the 8 best third-placed teams will come, it must be determined before the tournament which of the group winners has to play against which third-party for each of the possible cases that may arise.
At the UEFA European Championship there are 15 different cases from which groups the top 4 third-placed teams can come. Here at the World Cup, there are now 495(!) different cases from which groups the top 8 third-place finishers can come. This means that FIFA has to create a table with 495 regulations, which group winner plays against which group third party.
In order to bridge the time until FIFA announces its regulation, I calculated a possible solution for the 495 cases using my own computer algorithm. You can see them on the ‘AssignThird’ spreadsheet. As there are more possible solutions than grains of sand on earth, FIFA’s solution will almost certainly not be the same.
More information on FIFA’s World Cup 2026 page
* * *
Assignment of the places to the individual confederations
FIFA allocates a certain number of places to each confederation. This is what it looks like at the 2026 World Cup:
| Confederation | Number of places | Playoff participants |
|---|---|---|
| AFC (Asia) | 8 | 1 |
| CAF (Africa) | 9 | 1 |
| CONCACAF (North and Central America) | 6 | 2 |
| CONMEBOL (South America) | 6 | 1 |
| OFC (Oceania) | 1 | 1 |
| UEFA (Europe) | 16 | — — |
Each confederation holds qualifying rounds to decide who qualifies for those places. Of the 6 playoff participants, 2 qualify for the final tournament. This results in 8 + 9 + 6 + 6 + 1 + 16 + 2 = 48 participants in the final tournament. For the first time, the OFC is assigned a direct place. So far, only one team has qualified through the international playoffs. The hosts Canada, Mexico and USA are automatically qualified.
The tournament is scheduled to take place in June and July 2026. So far, only the date for the finale has been set: July 19, 2026.
* * *
Betting match results
If you’re having fun betting on match results with family or friends and turning it into a little competition, you can show the hidden worksheets
Predictions_1,
Predictions_Ranking_1 and
PrSettings.
Further information is available here: ▸Betting match results.
* * *
* * *
FIFA World Ranking
When the group allocation is drawn on April 1, 2022, the host country Qatar and the top seven in the FIFA world rankings will be in pot 1. Since the world rankings are constantly changing, a key date has to be set. This key date determines which snapshot of the world ranking list is used for the draw of the groups.
How does the FIFA World Ranking come about? — How is the rank actually calculated?
Since August 2018, FIFA calculates the world ranking coefficient according to a new procedure. In the old procedure, an average value was calculated from the match results of a certain period. In the new procedure, the playing strength of a team is indicated by a so-called ELO rating, similar to chess. (Arpad Elo had developed this method of calculating playing strength for the American Chess Federation in 1960). This ELO rating determines the rank in the FIFA world rankings.
The ELO rating of a team changes after each international match. Friendly matches are far less important than, for example, group matches in the World Cup finals. The strength of the opponent also plays a major role in the recalculation. A win against a strong opponent improves the ELO number significantly more than a win against a weak opponent.
▸Detailed explanation of the calculation of the ELO number (with Online Calculator)
Official world ranking published by FIFA
Anyone who would like to have the two FIFA world rankings before and after the 2022 World Cup (6 Oct 2022 and 22 Dec 2022) as an Excel file can download them here:
FIFA_World_Ranking_2022-12-22.xlsx
If you are interested in how the rating numbers in the FIFA women’s world rankings are calculated, you will find a detailed explanation with calculation example, online calculator and Excel file for download here:
Calculation of rating numbers in the FIFA Women’s World Ranking
* * *
Calculate your own rankings with Excel
Download Excel file (Calculate_Rankings_1.2_en.xlsm)
Last modified: 2023-04-13
The file contains VBA code and therefore only runs under Microsoft Excel.
With this Excel file you can calculate your own rankings, analogous to the FIFA world rankings. Just like with FIFA, you enter all match results for a certain period of time. After clicking on a button, Excel then calculates the new ranking list with the current rating numbers.
For example, a regional football association can have its own regional ranking list similar to the FIFA world ranking list and update it at certain intervals.
Since the calculation method is the same as in chess or table tennis (ELO numbers are calculated), the Excel file can also be used in the Chess Club or in the Table Tennis Club to recalculate the playing strengths and thus the ranking of the members. The ELO divisor (400 for chess, 600 for football) can be chosen accordingly. The Swiss Table Tennis Association uses the ELO divisor 200, the German Table Tennis Association 150.
FIFA uses values from 5 to 60 for the weighting. There are three weightings in chess: 40 for beginners and players under the age of eighteen, 20 for intermediate players who have at least 30 ratings, and 10 for top players who have reached a playing strength >2400. In Swiss table tennis, the value 10 applies to all players.
As an example, the Excel file contains the FIFA rating numbers of the 32 World Cup participants from October 6th, 2022 as starting values. The 64 games of the 2022 World Cup are entered on the second spreadsheet and the newly calculated rating numbers are listed. So you can see how the rating numbers have changed due to the World Cup matches. These new numbers do not exactly match the FIFA rating numbers from December 22nd, 2022, because in this example the preparatory matches in the period from October 6th, 2022 to the start of the World Cup on November 20th, 2022 would still have to be incorporated.
* * *
INFORMATION ON THE PAST WORLD CUP 2022 IN QATAR
Downloads for the past World Cup 2022
Interested parties can still download the old match schedule for the 2022 World Cup in Qatar:
World Cup 2022 match schedule (Last updated: 19.01.2023)
There is a detailed tutorial for the 2022 match schedule as a PDF file with precise instructions how this match schedule can be produced, also with an explanation of all Excel formulas contained therein and for each chapter an Excel file that corresponds to the development status after this chapter.
WCup_Tutorial_1.2_en.pdf (Last updated: 2023-01-20)
For the tutorial there are ten Excel files that represent the current status of the project after each of the ten chapters. So you can start at any point or skip chapters.
In any case, everything is explained as clearly as possible.
Excel files for the tutorial (Last updated: 2023-01-25)
If you don’t have Excel, you can still use this World Cup schedule!
You can use a free program like LibreOffice Calc or OpenOffice Calc.
Or you can save the schedule on Microsoft OneDrive and then edit it in the browser with ‘Excel Online’.
It is also possible to save the World Cup schedule to Google Drive and edit it in the browser with Google ‘Sheets’. Here, however, the processing speed is very low. It can sometimes take a few seconds for updating the group table after entering a match result.
* * *
Group assignments
- Group A: Qatar, Ecuador, Senegal, Netherlands
- Group B: England, Iran, USA, Wales
- Group C: Argentina, Saudi Arabia, Mexico, Poland
- Group D: France, Australia, Denmark, Tunisia
- Group E: Spain, Costa Rica, Germany, Japan
- Group F: Belgium, Canada, Morocco, Croatia
- Group G: Brazil, Serbia, Switzerland, Cameroon
- Group H: Portugal, Ghana, Uruguay, South Korea
See Qualifying round for more information.
* * *
Final tournament in Qatar
The tournament started on Sunday, November 20th, 2022 at 7:00 p.m. local time (5:00 p.m. CET) with the opening game Qatar-Ecuador in the Al Bayt Stadium.
On Sunday, December 18th, 2022, at 6:00 p.m. local time (4:00 p.m. CET) the tournament ended with the final in the Lusail Stadium. Argentina is the new World Champion.
In order to shorten the tournament time, four games per day are played in the group stage. They start at 1:00 p.m., 4:00 p.m., 7:00 p.m. and 10:00 p.m. local time. According to CET (Central European Time) these are the times 11:00 a.m., 2:00 p.m., 5:00 p.m. and 8:00 p.m.
Since it is winter time, the temperatures are still pleasant during the day. In summer, on the other hand, temperatures of up to 50°C can occur during the day. For this reason the tournament was postponed to winter time.
The distance between the stadiums is so short that it is theoretically possible for fans to attend several games a day. In the round of 16 and quarter-finals, two games per day will be played (6:00 p.m. and 10:00 p.m. local time respectively 4:00 p.m. and 8:00 p.m. CET), in the semi-finals and the two finals only one game per day.
More information of the FIFA about the final competition:
* * *
Rules for qualifying for the round of 16
The first and second in every group qualify for the round of 16.
In contrast to the UEFA European Championship, the direct comparison has no priority over goal difference and the number of goals scored. A direct comparison is only used if the points, goal difference and number of goals scored are equal. If the direct comparison does not bring a decision either, the minus points of the fair play rating are compared. If there is also a tie, the lot decides.
In summary, the criteria for determining the order of precedence within a group are:
- Score from all group matches
- Goal difference from all group matches
- Number of goals scored in all group matches
- Score from the direct encounters between the teams in question
- Goal difference from the direct encounters between the teams in question
- Number of goals scored from direct encounters between the teams in question
- Fair play scoring based on yellow and red cards received in all group matches
- yellow card = 1 point
- yellow-red card = 3 points
- red card = 4 points
- yellow and red card = 5 points
- Drawing of lots
See also Official FIFA regulations for the 2022 World Cup in Qatar
* * *
Qualifying round
The last matchday of the UEFA qualifiers for World Cup 2022 was 16.11.2021. In the 10 groups of UEFA, the group winners qualified for the World Cup in Qatar. The runners-up in the groups had the chance to qualify retrospectively via the play-offs.
Table of the group winners and runners-up:
| Grp. | Group winner (qualified) |
Runner-up (Play-off participant) |
|---|---|---|
| A | Serbia | Portugal |
| B | Spain | Sweden |
| C | Switzerland | Italy |
| D | France | Ukraine |
| E | Belgium | Wales |
| F | Denmark | Scotland |
| G | Netherlands | Turkey |
| H | Croatia | Russia |
| I | England | Poland |
| J | Germany | North Macedonia |
In the play-offs on March 24 and March 29, 2022, it should be decided who, apart from the 10 group winners, belongs to the 13 European tournament participants. However, two games were postponed to June 2022 because of the Ukraine conflict.
In the play-offs, the 10 runners-up and the two best teams in the UEFA Nations League that have not yet qualified will fight for the last three tickets to Qatar.
In the UEFA Nations League there is a ranking of the last tournament. The first 14 places are occupied by the group winners of the 4 leagues. Since the 4 group winners of League A (France, Spain, Italy, Belgium) have already qualified or are play-off participants, the next group to look at are the group winners of League B. Wales are already play-off participants. Therefore, the next two — Austria and Czechia — get a turn. They are the two teams that went into the play-offs with the 10 group runners-up (March 2022).
Poland, Portugal and Wales qualified in the UEFA play-offs for participating in the finals in Qatar.
For more information see UEFA play-offs.
The last two participants of the tournament were determined in the Intercontinental Play-Offs, which took place on 13./14. June 2022. Two play-offs were played:
| Int. play-off 1: | Australia — Peru | 5 — 4 a. pen. (June 13, 2022) |
| Int. play-off 2: | Costa Rica — New Zealand | 1 — 0 (June 14, 2022) |
Teams qualified:
| Nr. | Team | Qualified since |
|---|---|---|
| 1 | Qatar | 02 Dec 2010 |
| 2 | Germany | 11 Oct 2021 |
| 3 | Denmark | 12 Oct 2021 |
| 4 | Brazil | 11 Nov 2021 |
| 5 | France | 13 Nov 2021 |
| 6 | Belgium | 13 Nov 2021 |
| 7 | Croatia | 14 Nov 2021 |
| 8 | Spain | 14 Nov 2021 |
| 9 | Serbia | 14 Nov 2021 |
| 10 | England | 15 Nov 2021 |
| 11 | Switzerland | 15 Nov 2021 |
| 12 | Netherlands | 16 Nov 2021 |
| 13 | Argentina | 16 Nov 2021 |
| 14 | Iran | 27 Jan 2022 |
| 15 | South Korea | 01 Feb 2022 |
| 16 | Japan | 24 Mar 2022 |
| 17 | Saudi Arabia | 24 Mar 2022 |
| 18 | Ecuador | 24 Mar 2022 |
| 19 | Uruguay | 24 Mar 2022 |
| 20 | Canada | 27 Mar 2022 |
| 21 | Poland | 29 Mar 2022 |
| 22 | Portugal | 29 Mar 2022 |
| 23 | Ghana | 29 Mar 2022 |
| 24 | Senegal | 29 Mar 2022 |
| 25 | Tunisia | 29 Mar 2022 |
| 26 | Morocco | 29 Mar 2022 |
| 27 | Cameroon | 29 Mar 2022 |
| 28 | Mexico | 31.03.2022 |
| 29 | USA | 31.03.2022 |
| 30 | Wales | 05.06.2022 |
| 31 | Australia | 13.06.2022 |
| 32 | Costa Rica | 14.06.2022 |
More information about FIFA Qualifiers:
FIFA Qualifiers
Wiki (all confederations)
Wiki (all groups of UEFA)
* * *
UEFA play-offs
Disastro Italia! — Italia is out!
The European champion was surprisingly eliminated against North Macedonia. After failing to convert one of their numerous scoring chances, the ‘Squadra Azzurra’ were forced to face the fact that they will not take part in the tournament after conceding a goal in the 92nd minute.
The draw for the play-offs to determine the last three UEFA World Cup participants took place on 26.11.2021. In each of three groups of four, two semifinals and one final will be played. The three final winners will take part in the World Cup.
Russia was banned from participating in the tournament. Therefore, the semi-final Russia — Poland didn’t take place. Poland was automatically qualified for the final on March 29th.
Semi-finals on March 24, 2022
Way A:
| Semi-final 1: | Scotland — Ukraine | 1 — 3 (was rescheduled on June 1, 2022) |
| Semi-final 2: | Wales — Austria | 2 — 1 |
The winner of the semi-final 2 has home right in the final.
Way B:
| Semi-final 1: | Russia — Poland | canceled — Poland in the final |
| Semi-final 2: | Sweden — Czechia | 1 — 0 a. e. t. |
The winner of the semi-final 1 has home right in the final.
Way C:
| Semi-final 1: | Italy — North Macedonia | 0 — 1 |
| Semi-final 2: | Portugal — Turkey | 3 — 1 |
The winner of the semi-final 2 has home right in the final.
Finals on March 29, 2022
| Final 1: | Wales — Ukraine | 1 — 0 (was rescheduled on June 5, 2022) |
| Final 2: | Poland — Sweden | 2 — 0 |
| Final 3: | Portugal — North Macedonia | 2 — 0 |
Poland, Portugal and Wales have qualified for the tournament in Qatar.
* * *
The 32 teams for the finals in Qatar
Where do the 32 teams for the finals come from? — How are they determined?
Many nations around the world have a national football association. Most of these associations are members of the FIFA.
In addition, these national associations have merged to form six continental associations (confederations):
-
UEFA
(Union of European Football Associations)
Europe
55 national associations are members of FIFA. -
CONMEBOL
(CONfederatión SudaMEricana de FútBOL)
South America
10 national associations are members of FIFA. -
AFC
(Asian Football Confederation)
Asia
46 national associations are members of FIFA. -
CAF
(Confederation of African Football)
Africa
54 national associations are members of FIFA. -
CONCACAF
(Confederation of North, Central America and Caribbian Association Football)
North America, Central America, Caribbean
35 national associations are members of FIFA. -
OFC
(Oceania Football Confederation)
Oceania
11 national associations are members of FIFA.
For the final tournament in Qatar in 2022, FIFA has allocated a certain number of starting places to each of these continental associations:
| UEFA | 13 |
| CONMEBOL | 4,5 |
| AFC | 4,5 |
| CONCACAF | 3,5 |
| CAF | 5 |
| OFC | 0,5 |
Four half places means that one team from each of the four continental associations CONMEBOL, AFC, CONCACAF and OFC will take part in intercontinental play-offs. Each of the four teams has a first and a second leg. The two winners will qualify for the finals in Qatar.
At fixed starting places we have: 13 + 4 + 4 + 3 + 5 + 0 = 29
Then there are the two winners from the intercontinental play-offs. That means 31 starting places. The last remaining place is for the host country Qatar, which is taking part in the qualifying games almost out of competition.
Each continental association is responsible for organizing the way in which the candidates for the starting places allocated by FIFA are determined. In UEFA there is a group phase and then the play-offs, in CONMEBOL only one group phase, in CAF and AFC two qualifying rounds each, and in CONCACAF even three qualifying rounds. A qualification tournament will take place in the OFC, in which the participant in the intercontinental play-offs will be determined.
* * *
The topic ‘Direct Comparison’
On this subject, many people first think only of the direct comparison between two teams. Here the matter is clear and simple: Whoever has won the direct encounter is the better team in this direct comparison. In the case of a draw, the direct comparison does not lead to a decision.
It is no longer so clear and simple when more than two teams are subjected to a direct comparison. Here there are even several different regulations on how these direct comparisons are to be carried out.
In the direct comparison of three teams under UEFA rules, a further direct comparison of the teams indistinguishable in the first comparison may be carried out.
Under FIFA rules, there is no further direct comparison.
Here is an Example:
Let us assume that the following results were achieved within a group:
| Germany | Italy | 4 — 3 |
| Nigeria | Mexico | 2 — 4 |
| Germany | Nigeria | 2 — 0 |
| Mexico | Italy | 1 — 2 |
| Mexico | Germany | 2 — 1 |
| Italy | Nigeria | 2 — 0 |
Then the final standings of the group table are as follows:
| Place | Team | Points | Goals |
|---|---|---|---|
| 1 | Germany | 6 | 7 — 5 |
| 2 | Italy | 6 | 7 — 5 |
| 3 | Mexico | 6 | 7 — 5 |
| 4 | Nigeria | 0 | 2 — 8 |
According to both FIFA and UEFA rules, there is a direct comparison between the three teams Germany, Italy and Mexico. In this direct comparison, only the matches of these three teams against each other are considered. The direct comparison leads to the following table:
| Place | Team | Points | Goals |
|---|---|---|---|
| 1 | Germany | 3 | 5 — 5 |
| 2 | Italy | 3 | 5 — 5 |
| 3 | Mexico | 3 | 3 — 3 |
Due to the lower number of goals scored, Mexico is in third place. But what about Germany and Italy? They are indistinguishable even in this direct comparison of the three teams.
According to UEFA rules, there would now be another direct comparison between these two teams. Since Germany won 4-3 against Italy, Germany would be in first place. However, there is nothing in FIFA rules about a repeat of the direct comparison. In the event of a tie, the fair-play ranking or the draw of lots decides. Italy could therefore end up in first place through a better fair-play ranking or a draw of lots!
In the FIFA World Cup, a direct comparison only takes place when the teams concerned are tied in points, goal difference and goals scored.
In the UEFA European Championship, on the other hand, a direct comparison takes place even if the teams are tied on points. The direct comparison takes precedence over goal difference and goals scored.
In the example detailed here, Portugal is ranked 2nd under UEFA rules, but would finish 4th in a FIFA World Cup and would thus be eliminated.
* * *
Tournament schedule for your own Premier League
A tournament schedule in Excel for the Premier League? — You don’t need it. — All match results and tables can be viewed multiple times on the Internet.
But if you want to play your own (Premier) League, for example with computer games, you can download a free and freely usable tournament schedule here .
* * *
Tournament schedule for a maximum of 9 participants
If you are interested in an automatic Excel tournament schedule for a maximum of 9 participants, you can download it here (free use, all Excel worksheets can be viewed).
Everyone plays against everyone — optionally with or without return matches.
* * *