
Neural Excel — это аналитическая надстройка для Microsoft Excel, позволяющая работать с нейронными сетями. Простая в использовании надстройка позволяет быстро сконфигурировать и обучить нейронную сеть прямо в среде Microsoft Excel. Инструмент ориентирован на людей, которые хотят быстро получить отдачу от использования нейронных сетей и при этом не сильно углубляться в теорию. Надстройка позволяет использовать обученные сети как непосредственно в Microsoft Excel, так и интегрировать их в свои собственные приложения. Простота использования и минимум настроек делают это приложение отличным выбором для студентов и начинающих специалистов в области нейронных сетей.
Области применения
Финансовые операции:
-
Прогнозирование поведения клиента
-
Прогнозирование и оценка риска предстоящей сделки
-
Прогнозирование возможных мошеннических действий
-
Прогнозирование остатков средств на корреспондентских счетах банка
-
Прогнозирование движения наличности, объемов оборотных средств
-
Прогнозирование экономических параметров и фондовых индексов
Бизнес-аналитика и поддержка принятия решений:
-
Выявление тенденций, корреляций, типовых образцов и исключений в больших объемах данных
-
Анализ работы филиалов компании
-
Сравнительный анализ конкурирующих фирм
Планирование работы предприятия:
-
Прогнозирование объемов продаж
-
Прогнозирование загрузки производственных мощностей
-
Прогнозирование спроса на новую продукцию
Другие приложения:
-
Оценка стоимости недвижимости
-
Контроль качества выпускаемой продукции
-
Системы слежения за состоянием оборудования
-
Проектирование и оптимизация сетей связи, сетей электроснабжения
-
Прогнозирование потребления энергии
Функциональные возможности программы
Neural Excel выполнена в виде надстройки Microsoft Excel, что дает возможность очень простой установки. Программа позволяет конфигурировать и обучать многослойные нейронные сети непосредственно в Microsoft Excel, начиная с 2007 версии.
Конфигурация сети может быть задана как пользователем, так и получена автоматически в процессе обучения.
Обученные нейронные сети могут быть сохранены непосредственно в книге Microsoft Excel в виде формул (функция поддерживается на версиях Microsoft Excel, начиная с 2010). Кроме того, использование сетей в виде формул позволяет автоматически пересчитывать выходные данные при изменении входных параметров.
Обученные нейронные сети могут быть также сохранены в файл, а учитывая, что в комплекте с программой поставляются компоненты Delphi (а в ближайшее время будут добавлены и компоненты для Visual Studio) с исходными кодами, то пользователь имеет возможность интегрировать сети в свои собственные приложения буквально несколькими строчками кода.
Опционально можно задавать генерацию листов с итоговой статистикой, копией обучающего множества и листа с шаблоном тестового множества.
Условия использования
Neural Excel является бесплатной программой для использования как в учебных, так и в коммерческих целях. По возможности, просим указывать в своих работах, что использовалось приложение Neural Excel, и давать ссылку на наш сайт.
Презентация программы…
Поддержка проекта
Программа является полностью бесплатной, но Вы можете поддержать авторов, предложив новые идеи по совершенствованию функционала или описав найденную ошибку.
При описании ошибки обязательно укажите версию и разрядность офиса, текст ошибки (а лучше приложите скриншот окна) и последовательность Ваших действий, после которых возникла ошибка.

Работаете с табличными данными в Excel или других программах — тут вам может помочь нейросеть. Буквально за несколько последних месяцев применение нейросетей в обыденной работе приобрела массовую популярность. Кто-то редактирует картинки, кто-то презентации, а мы вот посмотрим, как можно использовать таблицы в Excel для обучения нейросетей.
Содержание
- 1 Как обучить нейросеть в таблицах Microsoft Excel
- 1.1 Neural Excel
- 1.2 Какие возможности есть:
- 1.3 Варианты использования:
Как обучить нейросеть в таблицах Microsoft Excel
Если вы ищите ответ на вопрос, как сделать нейросеть через эксель таблицы, как их обучить в Microsoft Excel и использовать для собственных уже готовые сети — вы по адресу.

Neural Excel
Это пока-что единственный ресурс, который может помочь вам в работе с табличными данными. Очень простой в использовании сайт, позволяет быстро сконфигурировать и обучить нейронную сеть прямо в Excel. Скачать её можно по ссылке — https://www.neurotechlab.ru/download.
Neural Excel — это аналитическая надстройка для Microsoft Excel, позволяющая работать с нейронными сетями.
Если вы не хотите углубляться в теорию и составлять карты сетей — сервис именно для вас и это не реклама, а констатация факта. Отлично подойдет для новичков.
Какие возможности есть:
- Можно обучить нейросети
- Можно сохранить настройки обучения прямо в Microsoft Excel в виде формулы
Условия использования — бесплатно! Можно использовать как в коммерческих, так и обучающих целях.

Варианты использования:
- Прогнозировать поведение клиентов
- Возможность рассчитать риски сделок
- Спрогнозировать варианты мошенничества
- Прогнозировать возможные финансовые остатки по счету
- Трейдеры могут применять для прогнозирования фондовых индексов
- Анализируйте работу своих дочерних компаний
- Можно анализировать работу конкурентов
- Анализ работы филиалов компании
- Применяйте для анализа продаж и производства товаров
- Можете обучить нейросеть по анализу возможного спроса на товар
- Риелторы и строительные фирмы могут проводить оценку стоимости недвижимости
- Отслеживать состояние оборудования и производства
- Можно спрогнозировать количество потребляемых коммунальных услуг
Introduction
This article is written for you who is curious of the mathematics behind neural networks, NN. It might also be useful if you are trying to develop your own NN. It is a cell by cell walk through of a three layer NN with two neurons in each layer. Excel is used for the implementation.
- Download neuralnetwork Sigmoid — 1.2
- Download neuralnetwork Leaky ReLu — 1.2
Background
If you are still reading this, we probably have at least one thing in common. We are both curious about Machine Learning and Neural Networks. There are several frameworks and free api:s in this area and it might be smarter to use them than inventing something that is already there. But on the other hand, it does not hurt to know how machine learning works in depth. And it is also a lot more fun to explore things in depth.
My journey into machine learning has perhaps just started. And I started by Googling, reading a lot of great stuff on the internet. I also saw a few good YouTube videos. But I it was hard to gain enough knowledge to start coding my own AI.
Finally, I found this blog post: A Step by Step Backpropagation Example by Matt Mazur. It suited me, and the rest of this text is based on it.
Construction
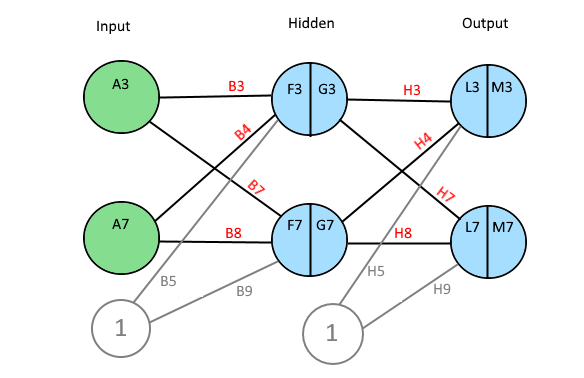
A Neural Network, NN, consists of many layers of neurons. A Neuron has a value and connections with weights to all other neurons in the next layer.
The first layer is the input layer and the last layer is the output layer. Between input and output, there might be one or many hidden layers. The number of neurons in a layer is variable.
If a NN is used to, for example, classify images, the number of neurons in the input layer is of course equal to the number of pixels in the image. Then in the output, each neuron represents a classification of the image. (E.g., a type of animal, a flower or a digit.)
Calculations
Before the calculations, all the weights in the NN have to be initialized with random numbers.
The image below is a print screen of the spread sheet that I refer to in the rest of this article. It might be a good idea to keep an open window of that sheet. That should make it easier to follow along.
A tip: Row 2 is the order of calculations.

Step 1 — 3. Forward Pass
The value of one neuron is calculated by taking the sum of every previous neuron multiplied by its weight.
An extra bias weight which has no neuron is also added:
F3 = A3 * B3 + A7 * B4 + B5
The value is normalized through a activation function. There are several different activation functions used in neural networks.
I have used the logistic function: 
G3 = 1 / (1 + EXP(-F3))
Step 4 — 5. Forward Pass
The neurons of the output layer is calculated the same way as hidden layer.
L3 = G3 * H3 + G7 * H4 + H5
and
M3 = 1 / (1 + EXP(-L3))
Step 6 — 7. The Error
The error of each output neuron is calculated using an expected or a target value. When classifying images, it is common to set one neuron close to 1 and the rest of the neurons close to zero.
For the errors in column Q:
Q3 = (M3 — O3)²
and:
Q7 = (M7 — O7)²
The total Error R5 is the average of all errors and should get closer and closer to zero as the network is trained.
R5 = (Q3 + Q7) / 2
Backward Propagation
A Neural Network is trained by passing it lots of train data repeatedly.
Then, for every iteration, errors and deltas are calculated. This is used to make small adjustments to all the weights in such a way that the network becomes better and better.
This is called backpropagation.
Since the total error can be expressed as a mathematical functions of each weight, one can derive those functions to obtain the slopes of the function curves in one point. The slopes indicate the direction towards a minimum for the total error and proportionally how much each weight should be adjusted in order for the total error to approach zero.
A delta value is calculated below for each weight. The deltas are stored in column I and D, for output and hidden layer respectively.
Chain Rule — Friend of Backpropagation
In practice, we want to derive the total error R5 with respect to H3 so we first to express R5 as a function of H3 using substitutions.
Since
R5 = (Q3 + Q7) / 2
R5 = (M3 - O3)² / 2 + (M7 - O7)² / 2


The above function does not look very easy to derive. Is it even possible?
We will instead use the chain rule2.
It states that if we have a composition of two or more functions f(g(x)) and let F(x) = f(g(x)), we can derive like this:
F’(x) = f’(g(x)) * g’(x) or in another notation:

In our case, we have the following dependency:
R5(M3(L3(H3))) and we can write:

Step 9. Output layer Deltas
The function for the total error R5 is derived with respect to the first weight H3 of the output layer.
In the above formula, the chain rule is used to make it simpler to derive.

Since:


Proof of derivation of Logistic function found in this article3.
Since  will be used later in the backpropagation, it is stored in the cell
 P3.
P3 = (M3-O3) * M3 * (1 - M3)
The last derivative of the chain of derivatives above is simpler.
Since L3 = G3 * H3 + G7 * H4 + H5

We can now put everything together and store  into cell I3.
I3 = P3 * G3
The rest of the weights in output layer is calculated the same way and we get:
P7 = (M7-O7) * M7 * (1 - M7)

I4 = G7 * P3
I5 = 1 * P3 (bias neuron)
I7 = G3 * P7
I8 = G7 * P7
I9 = 1 * P7 (bias neuron)
Step 10. Backpropagation in Hidden Layer
In this step, we calculate:

The chain rule from previous steps helps to transform it to something we can use:

First term also must be split up on both errors Q3 and Q7 so:

First look at this:

It can be further split up like this:

First  is already stored in
 P3 = (M3-O3) * M3* (1 - M3)
Since L3 = G3 * H3 + G7 * H4 + H5

When we put the above together, we get:

And in the same way as above:

First problem is solved.

Time for 
We know that:

And we have previously learned to derive the logistic function.

And now:

Because:

We now put the above together to get one expression for the derivative of the total error with respect to first weight of the hidden layer.

This is stored in cell C3.
The calculations for the above is repeated for all hidden layer weights:
C3 = (P3 * H3 + P7 *H7) * (G3 *(1 - G3)) * A3
C4 = (P3 * H3 + P7 *H7) * (G3 *(1 - G3)) * A7
C5 = (P3 * H3 + P7 *H7) * (G3 *(1 - G3)) * 1
C7 = (P3 * H4 + P7 *H8) * (G7 *(1 - G7)) * A3
C8 = (P3 * H4 + P7 *H8) * (G7 *(1 - G7)) * A7
C9 = (P3 * H4 + P7 *H8) * (G7 *(1 - G7)) * 1
Now it is easy to calculate new weights using a selected learning rate from cell A13.
For example: (new B3)
D3 = B3 - C3 * A13
There is a macro connected to the train button in the Excel document. The macro iterates many times and we can see how the output neurons in column M gets closer and closer to their target values and that the total Error in R5 gets closer and closer to zero.

Update in version 1.1:
I discovered that it is possible to improve learning rate and accuracy by using the activation function Leaky Relu4:
f(x) = x if x > 0 otherwise f(x) = x/20
It may be a good exercise to replace the Logistic Function with Leaky Relu.
Hints:
G3 = IFS(F3 > 0; F3; F3 <= 0; F3/20)
and
P3= (M3-O3) * IFS(M3 > 0;1;M3<=0;1/20)
(Also attaching new version of the xls file, just in case…)
Final Words
I realize this article might take some time to digest. I tried to explain it as I understood it. Please comment below if you find any errors.
After I sorted out how NNs work in Excel, I wrote a C# program that can interpret hand written digits. It has a Windows Forms user interface which works well. It seems to recognize almost any digit I draw, even ugly once. That was a proof to me that my understanding of Artificial Neural Networks is correct so far.
That article can be found here:
Handwritten digits reader UI5
Links
- A Step by Step Backpropagation Example — Matt Mazur.
- Chain rule — Wikipedia
- Logistic function — Wikipedia
- Rectifier (neural networks) — Wikipedia
- Handwritten digits reader UI — Kristian Ekman
History
- 1st January, 2019 — Version 1.0
- 8th January, 2019 — Version 1.1
- Replaced Logistic activation function with LeakyReLu
- 11th January, 2019 — Version 1.2
- Update of names of biases in diagrams
- 23th Januray, 2019 — Version 1.3
- Changed du calculation to the total error to the average av errors
This member has not yet provided a Biography. Assume it’s interesting and varied, and probably something to do with programming.