
Добавьте в свою презентацию диаграмму или блок-схему
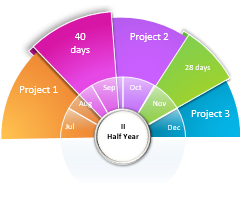
Эта обширная коллекция диаграмм содержит все инструменты для коммуникации и отслеживания, которые потребуются вам для работы, учебы, дома или игры. Найдите блок-схему из разных стилей, цветов и временных интервалов, чтобы создать расписание и пометить вехи для проекта любого размера. Блок-схема может содержать различные данные, например ответственных за задачи, даты начала и окончания, а также различные функции, такие как автоматическое обновление. Для процессов, включающих несколько групп, функциональная блок-схема — это универсальное средство для описания сложных действий и определения обязанностей. Эта коллекция также включает классическую диаграмму Ганта с различными макетами. Для добавления текстуры в блок-схему просмотрите различные панели коллекции, чтобы найти конкретные графические элементы, включая кольцевые, линейчатые и круговые диаграммы, карты и шкалы. И не забудьте о полезной организационной диаграмме, поделившись ею с новыми сотрудниками или проверив с ее помощью цепочку подотчетности. Шаблоны диаграмм для личного использования включают диаграммы планирования пенсии, журналы питания и упражнений, временные шкалы событий, генеалогические древа, маршруты поездок, схемы рассадки гостей и даже турнирные сетки. Ознакомьтесь с шаблонами диаграмм, чтобы найти подходящий для вас.
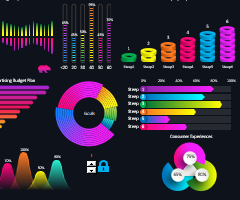
Бесплатно скачать готовые примеры шаблонов для дашбордов, динамических графиков и диаграмм с интерактивным функционалом.
Каталог шаблонов дашбордов и диаграмм
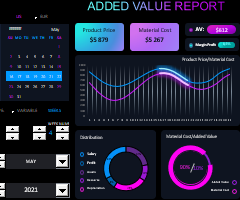 Пример добавленной стоимости скачать бесплатно в Excel
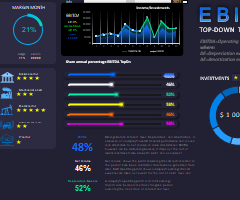 Дашборд для анализа EBITDA инвестиций в Excel скачать
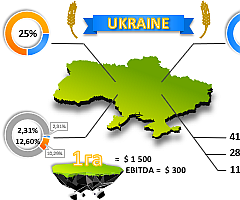 Презентация анализа стоимости пахотной земли скачать в Excel
 Дашборд облачного аудита скачать бесплатно в Excel
 Красивый дашборд для анализа силы бренда в Excel
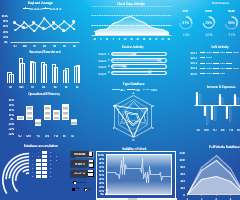
 Простой пример создания элементов инфографики в Excel
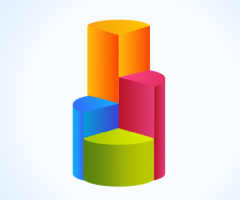 График рейтинга данных для визуализации скачать в Excel
 График ранжирования для визуализации данных скачать в Excel
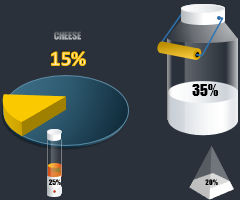 3D-инфографика для презентации в Excel отчета продаж сыра
 Простой пример 3D-диаграммы со значением больше 100% в Excel
 Сравнительная диаграмма и создание инфографики 20/80 в Excel
 Ассоциативные приемы визуализации выборки данных в Excel
 Дашборд для анализа диверсификации и теста бизнес-ниш в Excel
 Визуализация для анализа истории болезни пациента в Excel
 Сравнительный анализ продаж по дням недели в Excel
 5 красивых идей для создания интерактивной инфографики в Excel
 Дашборд взаимосвязи бизнес-интеллекта менеджера и продаж в Excel
 Дашборд для анализа факторов ранжирования продаж в Excel
 Красивая диаграмма для презентации отчетов в Excel
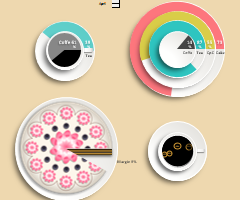 Скачать шаблон анализа учета продаж продуктов кафе в Excel
 График с визуализацией данных для лабораторных работ в Excel
1
2
3
4
5
скачать шаблоны диаграмм для excel

Excel 37. Шаблон диаграммы
Достаточно часто мне проходится делать презентации с большим количеством диаграмм. Чтобы сберечь время на создание диаграмм, я использую шаблон диаграммы и даже не один. По окончании этого урока вы сможете: Создать шаблон диаграммы Применить шаблон Дальше

5 шаблонов профессиональных и популярных диаграмм в Excel
Ссылка на это место страницы:
#more
ДИАГРАММЫ, КОТОРЫЕ ВЫ ПОЛУЧИТЕ
А здесь вы можете увидеть,
как работать с полным набором из
100+ профессиональных диаграмм в Excel
Свяжитесь с нами любым удобным способом, чтобы получить на него ответ.
Using templates in Microsoft Excel isn’t only a great way to save time, but also increases your productivity. Work without having to worry about the design of your workbook, and avoid having to set up complex formulas from scratch — templates get it all done for you.
Whether you use Excel to create simple spreadsheets, inventory management, budgets, analytics, and reports, or manage tasks, there’s a template out there for you. Luckily, you don’t have to spend hours on end to find the perfect one. We’ve done the searching for you.
Below, you can find a curated list of the best 51 Excel templates to give your work and productivity a boost, picked by our expert staff.
How to use Excel templates
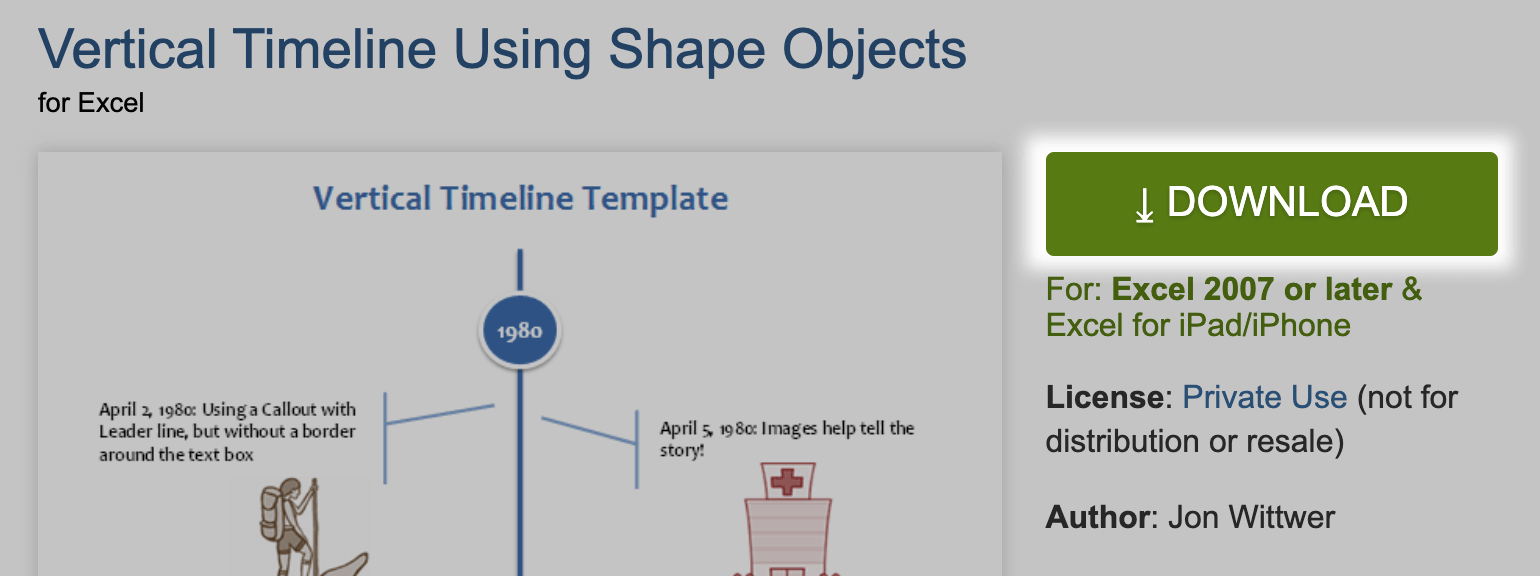
With each template in our list, we’ve included a link to an official or safe-to-use source where you can download the template. Not every website works the same, however, you can usually see a large Download button to obtain the file. See the example below.
Once your template file finishes downloading, all you have to do is open it. You can do this by double-clicking on the .xls or .xlsx file, or head to Excel and open it from the File menu.
Every template can be edited and customized for your own needs. They simply serve as the base for your project but have no set-in-stone elements. Feel free to make a template unique and truly yours.
The best 51 templates for Excel productivity
1. Family budget planner
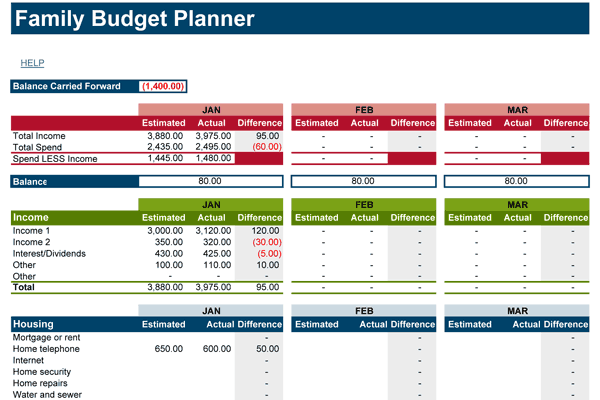
Keep track of finances within your family or team with this simple, extremely useful template. With fields for total income, individual earnings, spendings, and other fields, you can optimize your finances with ease.
Download Family budget planner:
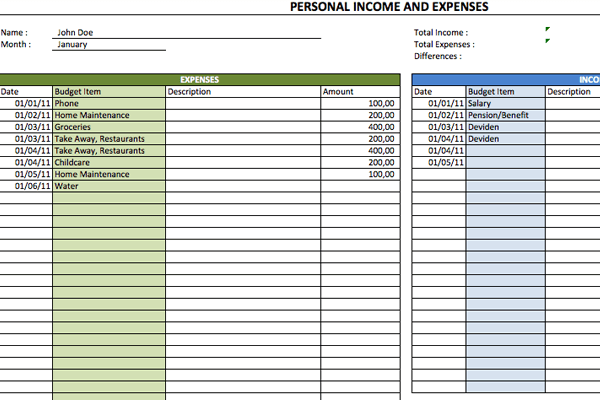
2. Personal budget spreadsheet
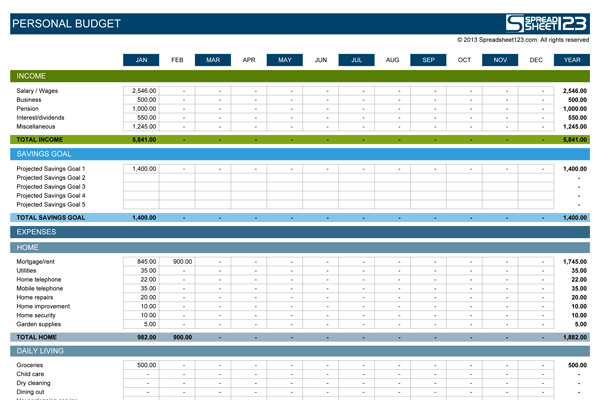
Working alone? This personal budget allows you to get a better, more clear overview of your earnings, spendings, and how you could save money. So, if you’re sucking in a personal budget planning, then we recommend this template.
Download Personal Budget Spreadsheet
3. Household budget planner

This budgeting template includes charts and a list of monthly expenses that can be customized for your own team’s needs. If you’re wondering, how do I create a household budget in excel, then this template will provide you with the solution you’re looking for.
Download this household budget template excel
4. Weekly budget worksheet
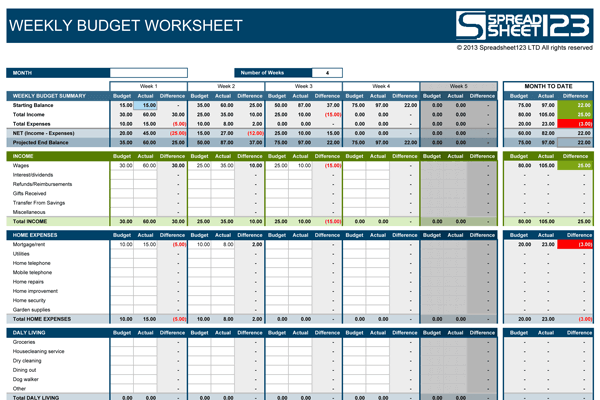
Don’t want to plan too much ahead? Focus on the now and use a weekly budget planner. As you fill the planner in, you’ll still be able to notice crucial details about how you handle your money.
Download weekly budget Excel planner
5. Event fundraiser

If you’re raising funds for an event, it’s important you always know who contributed to the cause, how much they donated, and the total amount needed. This template automatically updates as you input information, and shows you a visual chart to quickly get caught up at a glance.
Download this event fundraiser excel template
6. Social media calendar
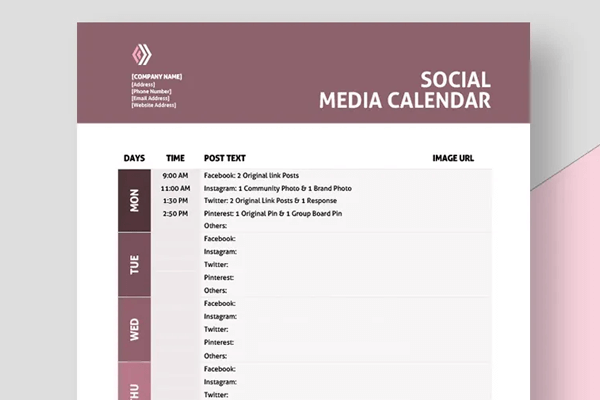
Big on social media? Download this premium template to plan your next posts down to the minute it goes live.
Download social media excel planner
7. Project Gantt chart

This advanced and powerful template gives you control to accurately manage schedules, resources, and deliverables. Track every single deliverable of your project using this gannt chart template.
Download Gantt chart Excel Template:
8. Net worth statement
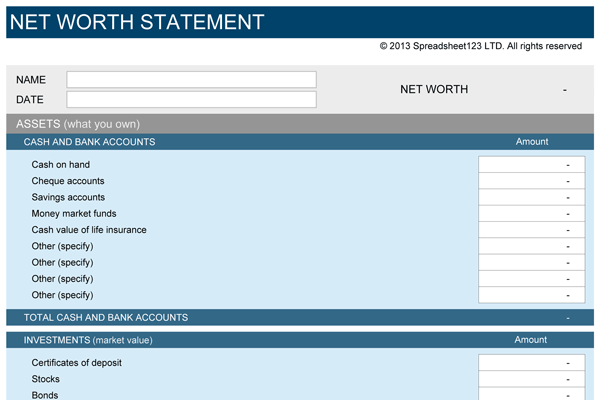
Do you know what your current financial worth is? If not, use this simple yet effective template to calculate it with ease. «It’s not your salary that makes you rich, it’s your spending habits.»
Track your expenditure with this net worth template
9. Bubble chart timeline
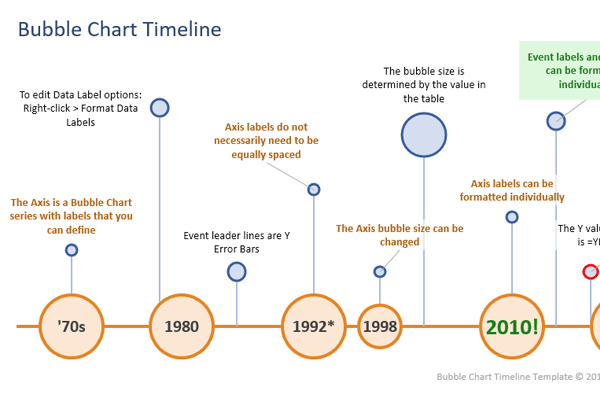
Create a timeline for your project with this template. Add various branches and information with the smaller bubbles, while creating a large overview using the main timeline.
Download: Bubble Chart Timeline
10. Employee payroll register

With this template, employers can better manage payrolls. Keep a record of employee information, payroll payments, and hours worked to accurately calculate their earnings.
Download: Employee Payroll Register Template
11. Employee scheduling template

Use this template to create a schedule for the upcoming week.
Download: Employee Scheduling Template
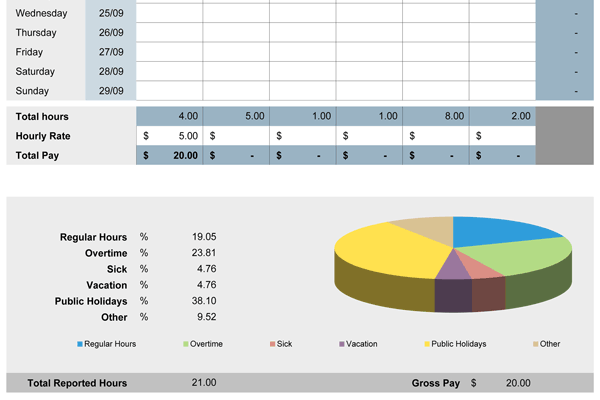
12. Project timecard summary

Calculate total hours for a week broken down by project.
Download: Project timecard summary
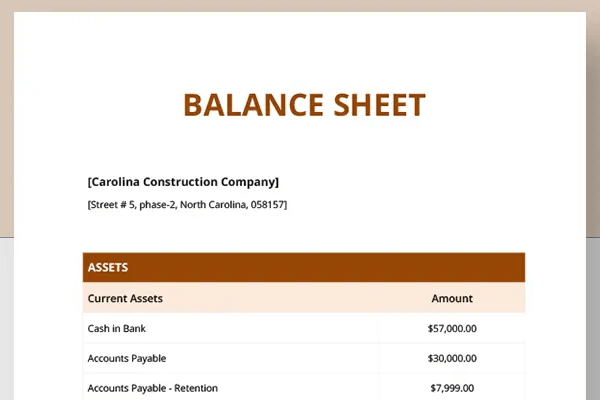
13. Company balance sheet

Create an accurate illustration of your company’s current net worth. This template includes your company’s assets, liabilities, and equity at a particular point in time.
Download: Company balance sheet
14. Weekly timesheet template
Record and monitor the exact amount of work hours weekly and bi-weekly basis.
Download: Weekly Timesheet Template
15. Billing statement
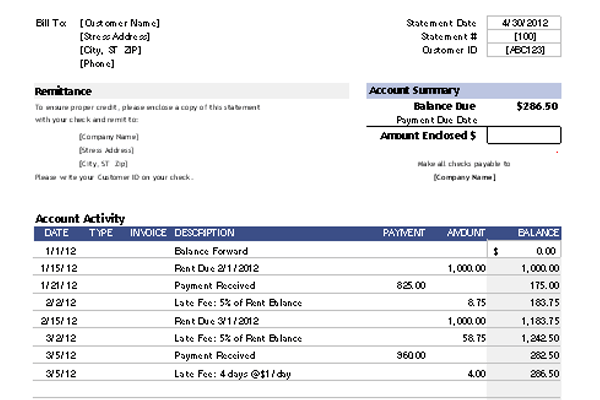
Use this billing statement template for invoice tracking, simple customer account management, and general billing.
Download: Billing statement
16. Invoice tracking
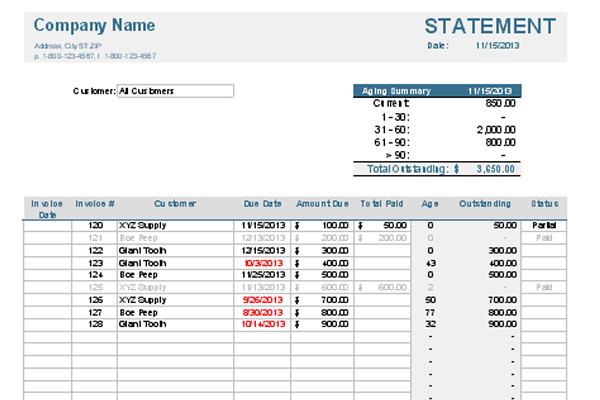
Use any system you want to create and send invoices with this template. Use statements from PayPal, other templates, or a combination of both.
Download: Invoice Tracking
17. Cash flow statement
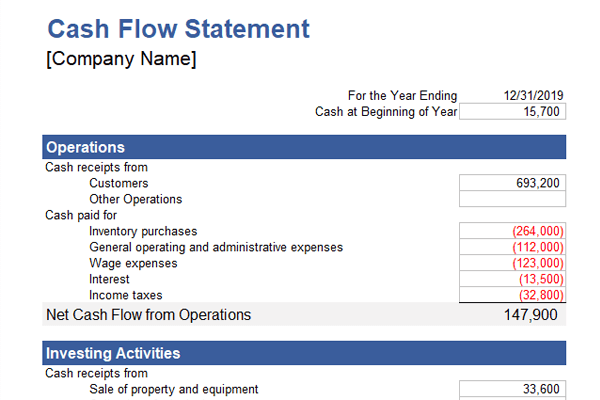
Create a summary of your company’s inflow and outflow of cash. Track where your business’s money came from (cash receipts) and where it went (cash paid).
Download: Cash Flow Statement
18. Price list template
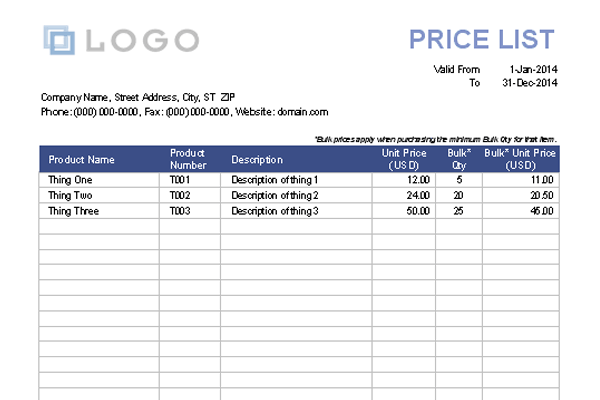
Create a professional price list for your products or services that you provide to your customers.
Download: Price List Template
19. Sales invoice template
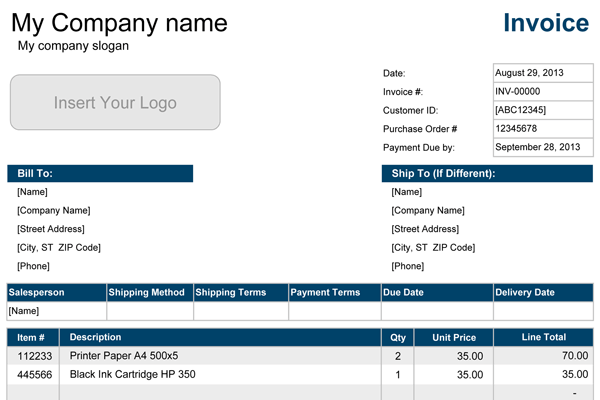
This invoice template includes all information that you would expect to give out to customers after a purchase. Note down shipping information, product code, special notes, and instructions.
Download: Sales Invoice Template
20. Monthly attendance checker

This monthly attendance form template allows you to record whether students, workers, or team members were present, absent, tardy, unexcused, or excused.
Download: Monthly Attendance Checker
21. World meeting planner
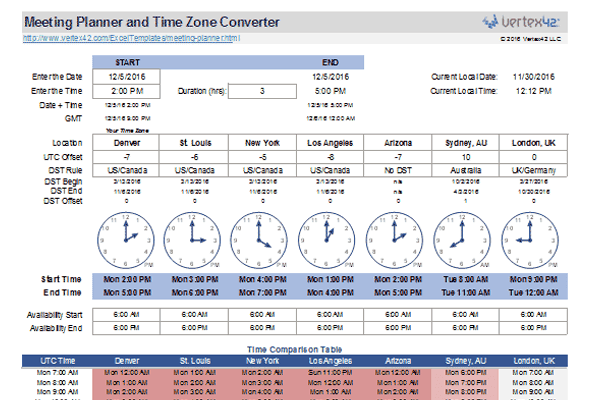
This meeting planner spreadsheet is set up to assist you in the planning of conference calls and meetings with people in different time zones.
Download: World Meeting Planner Template
22. Fax cover sheet
The template makes it easy to customize a printable fax cover sheet for your company, organization, or personal needs.
Download: Fax cover sheet Template
23. Profit and Loss Statement

This template is a valuable asset in helping you create an annual income projection. Use it to help show investors and creditors why they should get on board with your business.
Download: Profit and Loss Statement Template
24. Employee succession planner

Create a functional organizational chart that illustrates the success and planning of your organization.
Download: Employee Succession Planner Template
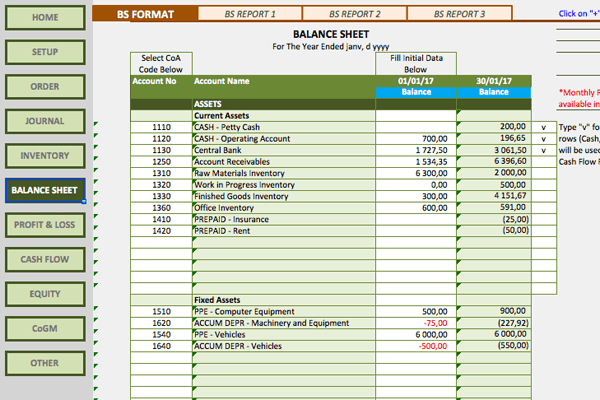
25. Simple balance sheet
Create finance balance reports using this professionally-made template by financial professionals. All things that need to be considered are included.
Download: Simple balance sheet Template
26. Annual sales report

Determine which areas of the business are contributors to your success, and calculate further growth of your business for the upcoming year.
Download: Annual Sales Report Template
27. Milestone chart

A commitment to delivering is as important as the project itself. A milestone chart is an effective tool to depict project scope and timelines.
Download: Milestone Chart Template
28. Manufacturing Business Accounting
Record and create financial reports for manufacturing companies with this extremely detailed and automated template.
Download: Manufacturing Business Accounting Template
29. SWOT Chart
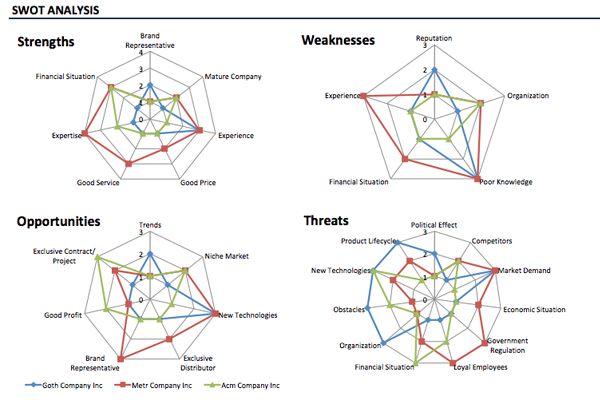
Plan ahead for the launch of a new product. Measure its position among established companies that already exist on the market by looking at SWOT (strengths, weaknesses, opportunities, and threats).
Download: SWOT Chart Template
30. Year-end Inventory Analysis

Use the various charts included in this template to analyze end-of-the-year reports and data. Notice trends and use this overview to perform better in the upcoming year.
Download: Year-end Inventory Analysis Template
31. Bill of sale (general form)
Provide a general bill sale form from Excel using this template.
Download: Bill of Sale (General Form) Template
32. Digital marketing strategy

Put together an awesome marketing strategy to bring your business to the next level with this template.
Download: Digital Marketing Strategy Template
33. Background check form

Send this template out to perform a thorough background check before hiring someone for a job or service.
Download: Background Check Form Template
34. Dynamic Pareto chart
Pareto Chart is based on the Pareto principle (also known as the 80/20 rule), which is a well-known concept in project management. Use this template to easily implement it into your spreadsheets.
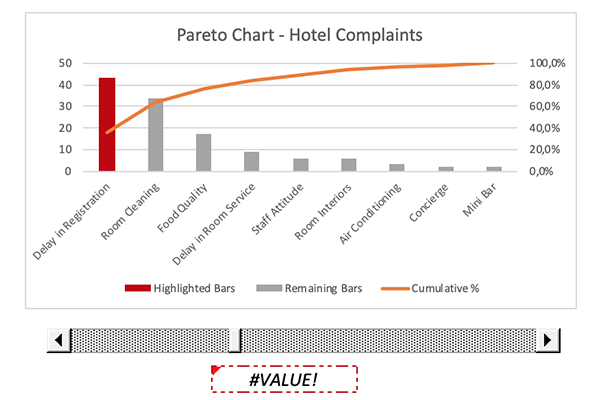
Download: Dynamic Pareto Chart Template
35. Payment schedule sample form
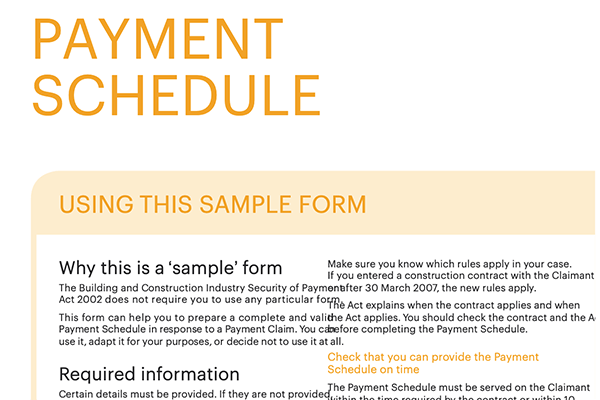
Use this amazing payment schedule template to accurately follow the rules and regulations related to payment schedules.
Download: Payment Schedule Sample Form Template
36. Simple personal budget
Create a simple financial plan that shows you the amount of money that will be spent on any expenses category in any period of time.
Download: Simple Personal Budget Template
37. To-do list with priorities

Never forget about a task in your new to-do list template. What makes this simple workbook effective is its priority rating column, showing you which tasks need to be done first.
Download: To-do List with Priorities Template
38. General Analysis Charts

Another visually pleasing collection of charts from Template WPS. Use these to break down and analyze various sets of data.
Download: General Analysis Charts Template
39. Automated Emails

Get this free rapid email tool to save you time when sending out a large amount of emails. With this template, you can quickly create emails in Excel to send them to groups of people.
Please follow the included tutorial on the ExcelTemplate website.
Download: Automated Emails Template
40. Sales Performance Report

Get an accurate report of your sales, completed with useful charts to further analyze the performance data of your business or product.
Download: Sales Performance Report Template
41. Conference and Meeting Agenda

Prepare for a conference using this agenda planner. Note down topics, breaks, timestamps, and add notes when needed.
Download: Conference and Meeting Agenda Template
42. Simple Contract
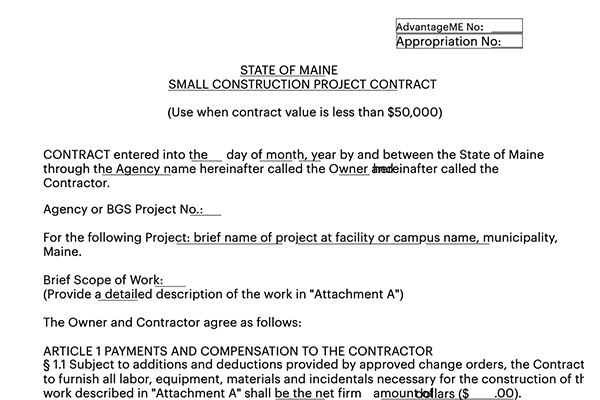
Ensure no details are missed when hiring new personnel or wanting to make a contract with a client. This template includes all the necessary details to create a successful contract agreement.
Download: Simple Contract Template
43. Break-Even Analysis
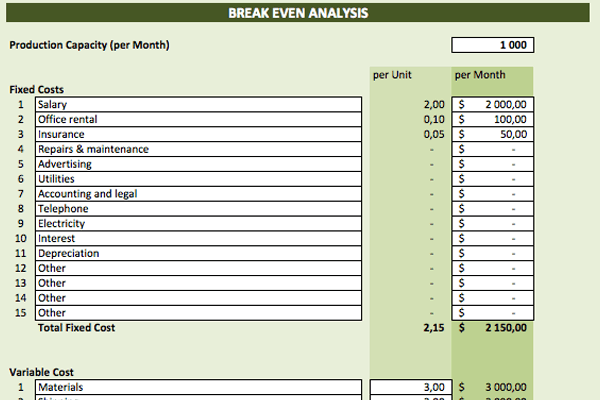
Use this template to determine whether your business revenue can cover all of your expenses within a particular time period.
Download: Break-Even Analysis Template
44. Credit Memo
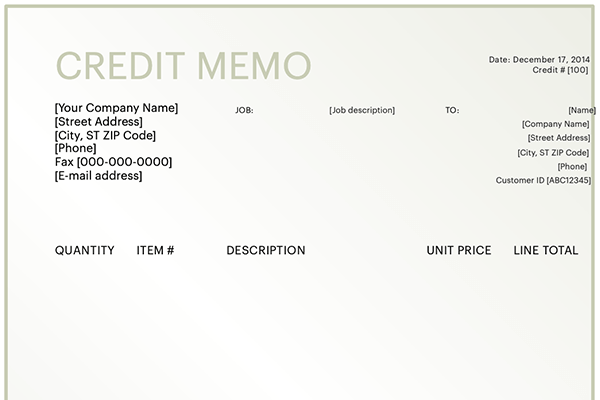
A simple yet stylish credit memo that works effectively.
Download: Credit Memo Template
45. Sales Receipt

Write a receipt using this template. Includes fields for taxes, discounts, unit price, subtotal, and more.
Download: Sales Receipt Template
46. Fishbone Diagram

Use this fishbone diagram template to see a project from a different perspective.
Download: Fishbone Diagram Template
47. Employee Training Tracker
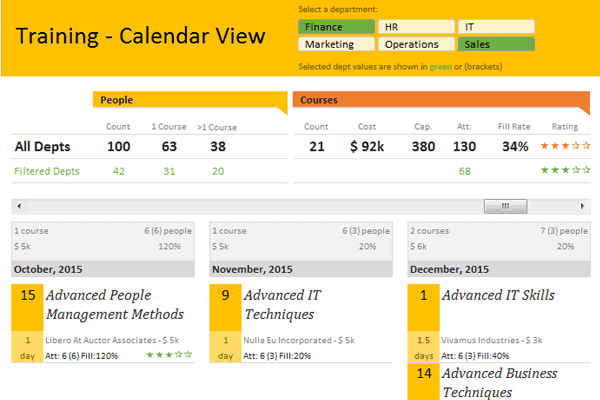
Keep track of information and help the coordination between employees, trainers, department heads, and venues during a training period.
Download: Employee Training Tracker Template
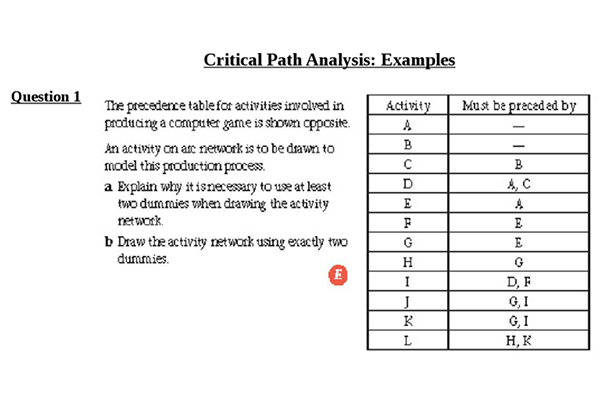
48. Critical Path Analysis
Take advantage of this simple yet effective template to analyze possible paths for your projects.
Download: Critical Path Analysis Template
49. Timeline Editing

This stylish timeline template will help you set up goals to reach over a period of time in chronological order.
Download: Timeline Editing Template
50. Report Card

Generate report cards for students or employees using this simple to customize the template.
Download: Report Card Template
51. Sales Funnel Chart

This funnel chart template allows you to take a systematic approach towards selling a product or service.
Download: Sales Funnel Chart Template
Final thoughts
We hope this article was helpful in finding the perfect Excel template you need to tackle your next project. Don’t forget to bookmark this page for any future Excel projects!
If you’re looking for more guides or want to read more tech-related articles, consider subscribing to our newsletter. We regularly publish tutorials, news articles, and guides to help you.

Существует множество шаблонов для диаграммы ганта в Excel. Какой из них лучше? Мы рады, что вы спросили! Мы проделали большую работу и сделали для Вас принципиально новый шаблон диаграммы ганта в экселе, который Вы можете прямо сейчас скачать бесплатно!
Шаблон диаграммы ганта в excel совместим со всеми версиями эксель (Excel 2007, Excel 2010, Excel 2013, Excel 2016), а также отлично работает для Mac и Windows.
Услуги по составлению план-графиков в Primavera
Услуги по переводу графиков из Excel в Primavera

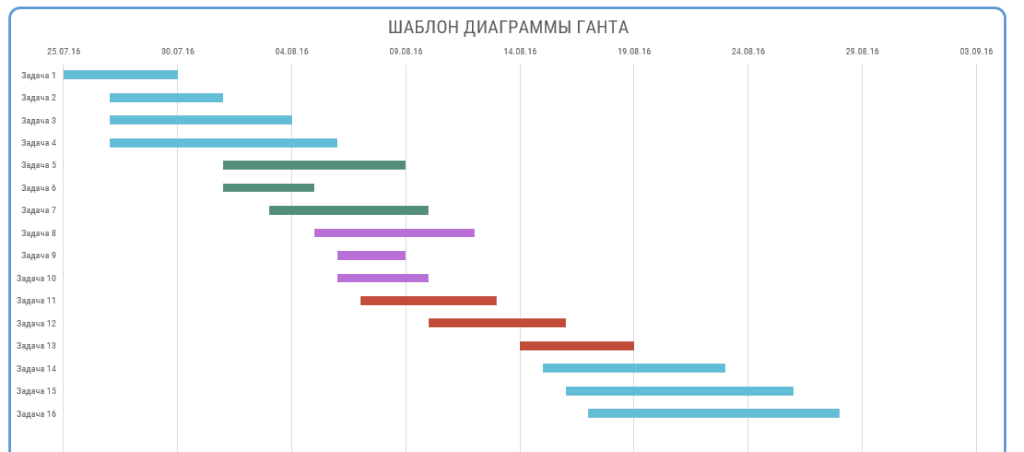
Используйте наш готовый шаблон графика в excel (По ссылке на скачивание доступен редактируемый шаблон диаграммы ганта в excel + разные варианты дизайна, без макросов и тд.) и сэкономьте кучу времени, легко организовав свои проекты и построение графиков! Все, что вам нужно сделать, это добавить ваши задачи и сроки, и у вас будет качественная презентация диаграммы ганта в формате Excel. Хотите узнать как построить диаграмму ганта в excel? Все уже сделано за вас! Во-первых, скачайте шаблоны диаграмм ганта
ЧТОБЫ СКАЧАТЬ ШАБЛОН ДИАГРАММЫ ГАНТА НАЖМИТЕ НА КНОПКУ
Скриншоты

Как использовать бесплатный шаблон графика ганта в Excel?
Мы сделали эту таблицу ганта в excel такой простой, мощной и легкой в использовании, насколько это возможно для построения сетевого графика. График ганта может использоваться для построения разных календарных план-графиков. Пример: Диаграмма ганта для строительства – используется как основной инструмент для планирования задач и отслеживания сроков. Можно ли использовать график ганта для личных проектов? Отвечаем — Да! И не только можно, но и нужно. Можно сделать хоть график отпусков! Хотя, есть разные мнения на этот счет почитайте статью «За что не любят диаграмму ганта»
Excel шаблон сетевого графика уже настроен и готов для использования, вам остается только подкорректировать существующие или включать в него задачи вашего проекта. Ниже приведена подробная информация о настройке каждого столбца, а также ответы на частые вопросы.

Как настроить новые задачи?
Во-первых, переименовать существующие задачи, чтобы они соответствовали вашему проекту. Задачи нумеруются по умолчанию. Просто щелкните на любой ячейке в столбце «Название задачи» и переименуйте его.

Обновите даты начала и окончания
Далее в шаблоне графика ганта обновите начальную и конечную даты у задач в Excel. Эти ячейки были предварительно отформатированы по датам в стандартном временном формате ДД.ММ.ГГ, однако, вы можете изменить этот формат, в зависимости от ваших предпочтений. Чтобы изменить этот временной формат в сетевом графике, щелкните правой кнопкой на диаграмму ганта, выберете параметры оси и во вкладке число введите новый формат отображения дат.

Длительности задачи рассчитываются автоматически
В шаблоне диаграммы ганта столбец длительность, для каждой задачи, рассчитывается автоматически, путем вычитания даты начала и конца. После того, как вы введите начальную и конечную дату, столбец длительность заполнится самостоятельно. Продолжительность установлена в днях по умолчанию.
ВОПРОСЫ И ОТВЕТЫ
Мы собрали самые частые вопросы по настройке шаблона диаграммы Ганта в Excel. Если вы не нашли ответ на свой вопрос, пишите в комментариях.
Как добавить заголовок к диаграмме ганта
Возможно, вы уже это знаете, но на всякий случай.
- Чтобы добавить название диаграммы, выделите диаграмму и щелкните на «Конструктор» в верхней части меню Excel;
- Затем нажмите кнопку «Добавить элемент диаграммы» → «Название диаграммы» → «Над диаграммой»;
- Введите название вашей диаграммы ганта. Если вы хотите отформатировать текст, вы можете сделать это в главном меню так же, как и форматирования любого другого текста на листе.
Изменение цвета панели задач в диаграмме ганта
Давайте сделаем это красиво!
- Нажмите на одну полоску в два раза. Не дважды щелкните по ней, а просто щелкните по ней один раз, чтобы выделить все столбцы в диаграмме ганта, а затем нажмите на нее снова, чтобы выделить только панель задач, которую вы хотите изменить. Затем, правой кнопкой мыши, выберите пункт “Формат данных.”
- Выберите ведро с краской и затем выберите цвет на панели задач. Повторите для любых других задач, которые вы хотите изменить.

Добавление дополнительных строк в диаграмме ганта
Много работы!
Календарные графики бывают разных форм и размеров. Шаблон диаграммы ганта можно довольно легко расширить, чтобы он соответствовал вашим потребностям. Если ваш сетевой график работ нуждается в более чем 25 строках, вы можете довольно просто добавить дополнительные строки:
- Выделите последнюю заполненную строку в шаблоне таблицы excel, кликните правой кнопкой мыши, в верхней части появившегося окна нажмите кнопку Вставить → строку.
- Затем будет добавлена строка, которая имеет соответствующие формулы для расчета длительности задачи и такое же форматирование, как и другие панели задач.

Печать диаграммы Ганта
Ведь некоторые люди все еще используют бумагу, верно?
- Чтобы распечатать только диаграмму ганта, мы сначала должны установить область печати. Щелкните ячейку в одном из углов диаграммы ганта и выделите поле, которое охватывает весь сетевой график проекта. Затем перейдите к разметке страниц → область печати → Задать область печати.

- Теперь, область печати задана, вернитесь в файл → печать. В зависимости от размера вашего графика, вам, вероятно, нужно либо регулировать масштаб план-графика, чтобы ваш проект поместился на одной странице, либо распределить сетевую диаграмму ганта на несколько страниц, а затем вручную склеить их вместе, чтобы сделать один большой календарно-сетевой графика проекта после печати.

- Чтобы напечатать всю книгу, включая диаграмму ганта, просто перейдите к файл → печать. Опять же, в зависимости от размера вашего проекта, вам, нужно будет либо масштабировать сетевую диаграмму ганта, чтобы ваш план поместился на одной странице, либо распределить график на несколько страниц, а затем вручную склеить их вместе, чтобы сделать один большой график после печати.


Как изменить дату начала
Меняем дату начала в диаграмме Ганта
Чтобы изменить временную шкалу и поставить требуемое начало нужно сделать несколько шагов, к сожалению проще в экселе никак не сделать. Допустим нам нужен график с 25.07.2019 по 28.08.2019
Шаг 1. Смотрим в ячейку I4. Число 42576 соответствует дате 25.07.2016

Шаг.2 Меняем дату начала в диаграмме ганта на 25.07.2019 получаем число 43671, которое соответствует этой дате. У нас получилась отрицательная длительность и шкала осталась таже. Записываем или копируем это число как дату начала.

Шаг. 3 Вставляем 28.08.2019 в ту же ячейку и получаем число 43705. Копируем или записываем.

Шаг 4. Немного магии. Выделяем ось дат на диаграмме. Правой кнопкой мыши кликаем, выбираем формат оси.

Шаг 5. Теперь нам пригодятся наши записи. Переходим в параметры оси -> Границы. В Минимум вставляем 43671,0 дату начала ( 25.07.2019 ) , в Максимум 43705,0 дату окончания (28.08.2019). Все, шкала изменилась.
Посмотрите в комментариях — там возможно решен ваш вопрос.
Напишите спасибо, если мы сделали вашу жизнь немного легче)))
СПАСИБО!
Мы рады вам помочь, в таком нелегком деле как управление проектами. Спасибо за ваши отзывы! Подписывайтесь на наши каналы в соцсетях и оставайтесь в курсе всех событий по проектному управлению в России и Зарубежом. Актуальные новости, инфографику и юмор гарантируем!
Антон, инженер
«Просто это то, что я искал. С ней я могу делать профессиональные графики, бесплатно. Молодцы команда Gantbpm»
Николай, Планировщик
«Особенность диаграммы ганта в экселе — это то, что она невероятно проста. Я перепробовал много инструментов и облачных, и десктопных, но старый добрый эксель — лучше всего. Спасибо за создание»
Наталья, Руководитель проекта
«Диаграмма Ганта в Excel — это очень удобно, быстро и имеет большие возможности…. Для моих проектов диаграмма ганта читается легко и понятно. Моя команда проекта любит этот инструмент.»
Просмотры: 2 964
excel гант, excel диаграмма, гант график, гант диаграмма, график ганта в excel, график ганта в excel скачать, график ганта в excel шаблон, график ганта в excel шаблон скачать, график ганта пример excel, график построение, график пример, график работ в excel диаграмма ганта, график работ диаграммы ганта, диаграмма в экселе, диаграмма в эксель, диаграмма ганта, диаграмма ганта бесплатно, диаграмма ганта в excel, диаграмма ганта в excel 2007, диаграмма ганта в excel 2010, диаграмма ганта в excel 2013, диаграмма ганта в excel 2016, диаграмма ганта в excel как сделать, диаграмма ганта в excel скачать бесплатно, диаграмма ганта в excel шаблон, диаграмма ганта в excel шаблон на русском, диаграмма ганта в excel шаблон скачать, диаграмма ганта в excel шаблон скачать бесплатно, диаграмма ганта в таблице, диаграмма ганта в управлении проектами, диаграмма ганта в экселе, диаграмма ганта в экселе пример, диаграмма ганта в эксель, диаграмма ганта в эксель шаблон, диаграмма ганта график отпусков скачать excel, диаграмма ганта для mac, диаграмма ганта для чего нужна, диаграмма ганта как делать, диаграмма ганта календарь, диаграмма ганта отражает, диаграмма ганта отчет, диаграмма ганта позволяет, диаграмма ганта презентация, диаграмма ганта пример, диаграмма ганта пример excel, диаграмма ганта скачать, диаграмма ганта скачать бесплатно, диаграмма ганта создать, диаграмма ганта шаблон, диаграмма ганта шаблон скачать, диаграмма ганта шаблон скачать бесплатно, диаграмма пример, диаграмма шаблон, диаграммы в excel, как нарисовать диаграмму ганта в excel, как построить график ганта в excel, как построить график ганта в excel 2016, как построить диаграмму ганта, как построить диаграмму ганта в excel, как построить диаграмму ганта в excel 2010, как построить диаграмму ганта в экселе, как построить диаграмму ганта в эксель, как сделать диаграмму ганта, как сделать диаграмму ганта в excel 2007, как сделать диаграмму ганта в excel 2010, как создать диаграмму ганта в excel, как составить диаграмму ганта, как составить диаграмму ганта в excel, календарный график, линейная диаграмма ганта, нарисовать диаграмму ганта, план график срок, планирование диаграмма ганта, построение графика ганта в excel, построение диаграммы ганта, построение диаграммы ганта в excel, построение сетевого графика, пример диаграммы ганта в excel скачать, проекты диаграмма ганта, распечатать диаграмму ганта, сетевая диаграмма ганта, сетевой график, сетевой график в excel, сетевой график и диаграмма ганта, сетевой график пример, сетевой график проекта, сетевой график работ, сетевые графики ганта, скачать готовую проектную диаграмму ганта в excel, скачать график проекта ганта в excel, скачать диаграмму ганта в excel, создание диаграммы ганта, создание диаграммы ганта в excel, составление диаграммы ганта, таблица ганта в excel, что называется диаграммой ганта, шаблон excel, шаблоны диаграмм excel 2013, шаблоны диаграмм excel скачать, шаблоны диаграмм excel скачать бесплатно, шаблоны диаграмм и графиков
Excel Chart Templates — Free Downloads

PINE BI: Ultimate Excel Charting Add-in: Insert custom charts with a simple click & other charting tools!
Excel also allows almost unlimited chart customizations, by which you can create many advanced chart types, not found in Excel. Below you will also find these advanced chart templates available for download.
You will also find some chart templates available for download for standard Excel charts.
Instead, click here if you are looking for information about creating, saving, and using Chart Templates within Excel.
Advanced Chart Templates

Gauge Chart
Also known as: Dial Chart, Speedometer Chart
Description: Gauge charts use needles to show information as a reading on a dial. They are often used when comparing KPIs or business results against a stated goal.
Learn More: Gauge Chart Tutorial
Gauge Chart Builder Add-in
7 Different Gauge Chart Templates. 5 Style Presets. 9 Color Palettes. Fully customizable.

Tornado Chart
Also known as: Sales Funnel Chart, Butterfly Chart
Description: A Tornado Chart is a modified version of the bar chart where the data categories are displayed vertically in a way that resembles a tornado.
Learn More: Tornado Chart Tutorial

Burndown Chart
Also known as: N/A
Description: Burndown charts represent work left to do vs. time. It is useful for predicting when all work will be completed.
Learn More: Burndown Chart Tutorial

Step Chart
Also known as: N/A
Description: A Step Chart is a line chart that uses vertical and horizontal lines to connect data points in a series, creating a step-like progression.
Learn More: Step Chart Tutorial

Thermometer Chart
Also known as: Goal Chart
Description: Thermometer charts show the current completed percentage of a task or goal relative to the goal.
Learn More: Thermometer Tutorial

Quadrant Chart
Also known as: N/A
Description: Quadrant charts are scatter charts with a background that is divided into four equal sections, allowing you to categorize data points into the four quadrants
Learn More: Quadrant Tutorial

Ogive Chart
Also known as: Cumulative Frequency Graph
Description: Ogive charts are graphs used in statistics to illustrate cumulative frequencies.
Learn More: Ogive Chart Tutorial

Bullet Chart
Also known as: Steven Few’s Bullet Graph
Description: A modified column or bar chart used for tracking performance(s) against goal(s). Alternative to Gauge chart.
Learn More: Bullet Chart Tutorial

Mekko Chart
Also known as: Marimekko Chart, Mosaic Plot
Description: 2D stacked chart where the column width usually represents the relative size of a segment and the height breaks down each segment.
Learn More: Mekko Chart Tutorial

Normal Distribution Curve
Also known as: Bell Curve, Gaussian Curve, Bell Plot
Description: Symmetrical graph that illustrates the tendency of data to cluster around the mean.
Learn More: Bell Curve Tutorial

Stem and Leaf Plot
Also known as: Stemplot
Description: Diagram that splits each data point into a «stem» (the first number(s)) and «leaf» (usually last digit) to display the frequency distribution of a data set.
Learn More: Stem and Leaf Tutorial

Polar Plot
Also known as: N/A
Description: A polar plot is used to define points in space within what is called the polar coordinate system.
Learn More: Polar Plot Tutorial

Venn Diagram
Also known as: N/A
Description: A Venn Diagram uses circles to show relationships among sets where sets have some commonalities.
Learn More: Venn Diagram Tutorial

Panel Chart
Also known as: N/A
Description: Panel charts are charts that have multiple regions, each region displaying a different set of data, rather than showing all data in a single region.
Learn More: Panel Chart Tutorial

Timeline Chart
Also known as: Milestone Chart
Description: Timeline charts are used to visualize status of projects in chronological order.
Learn More: Timeline Chart Tutorial

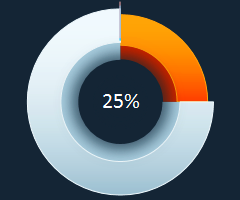
Progress (Bar and Circle) Charts
Also known as: N/A
Description: Progress charts are used to display your progress towards a goal.
Learn More: Progress Chart Tutorial

Population Pyramid
Also known as: N/A
Description: Population Pyramids are used to visually display subsets within a population.
Learn More: Population Pyramid Tutorial

Excel Basic Chart Templates

Column Charts
Description: A Column Chart is a data visualization where each item is represented by a rectangle, where the magnitude of the values determines the height of the rectangle.
Learn More: Column Chart Tutorial

Bar Charts
Description: A Bar Chart is a data visualization where each item is represented by a rectangle, where the magnitude of the values determines the width of the rectangle.
Learn More: Bar Chart Tutorial

Area Charts
Description: An Area Chart is similar to a line chart, except the area below the line is colored in to emphasize magnitude.
Learn More: Area Chart Tutorial

Line Charts
Description: A line chart is a graph that uses lines to connect individual data points over a time interval.
Learn More: Line Chart Tutorial

Pareto Chart
Description: A Pareto Chart is a hybrid of column and line charts that displays the relative importance of factors in a data set.
Learn More: Pareto Chart Tutorial

Waterfall Chart
Also Known As: Bridge Chart, Flying Bricks Chart, Cascade Chart, or Mario Chart
Description: A Waterfall Chart visually breaks down the cumulative impact of sequential positive or negative values on a final outcome (ex. various income and expense items on the final profitability).
Learn More: Waterfall Chart Tutorial

Sales Funnel Chart
Description: A Sales Funnel Chart dissects different stages of a process, typically sorting the values in descending order (from largest to smallest) in a way that visually looks like a funnel—hence the name.
Learn More: Sales Funnel Chart Tutorial

Candlestick Charts
Description: A candlestick chart shows the open, high, low, close prices of an asset over a period of time.
Learn More: Candlestick Chart Tutorial
Чтобы вам было удобнее, приложен Excel-файл с подробным описанием, как такие диаграммы построить. Скачивайте и применяйте 🙂
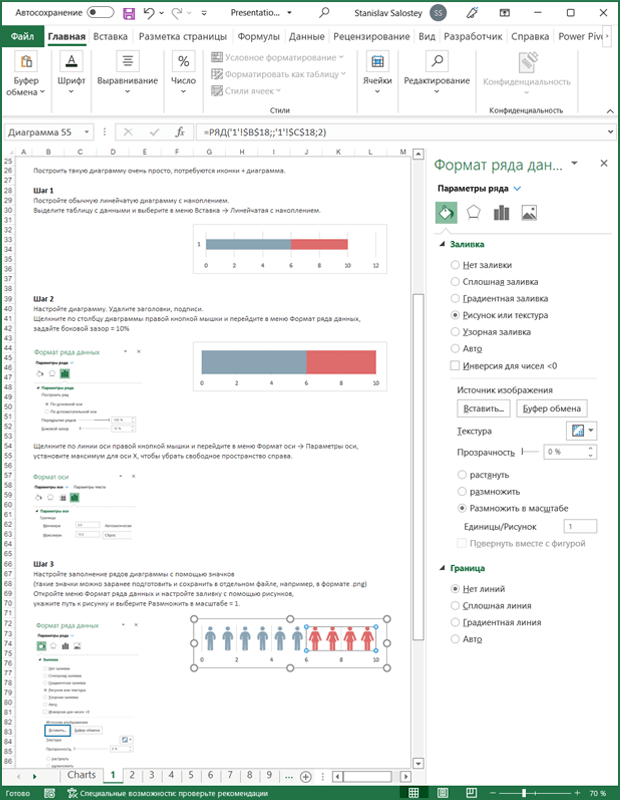
Пиктограммы в Excel
Pictorial Chart
пиктограммы

На пиктограммах – диаграммах с иконками – данные представляют в виде значков, размещенных в столбцах или линиях. Число повторений рисунков показывает соотношение данных или пропорции.
Pictorial Chart
пиктограммы в несколько рядов
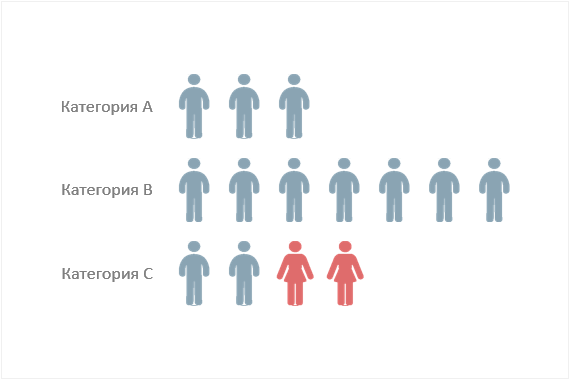
Пиктограммы можно создавать как в одну линию, так и в несколько линий или столбцов. В Excel это можно сделать с помощью линейчатых и столбиковых диаграмм.
Pictorial Fraction Chart
рисунки с частичной заливкой

Заливка помогает выделить главное, обозначая основные цифры ярким цветом, а второстепенные – контуром или более светлым цветом. И ещё тут можно показать долю числа частичным заполнением, например 3,6 из 5.
Pictorial Fraction Chart
рисунки с частичной заливкой

Диаграммы с рисунками помогают рассказывать истории.
Proportional Chart (Icon)
диаграммы с «вытянутыми» рисунками
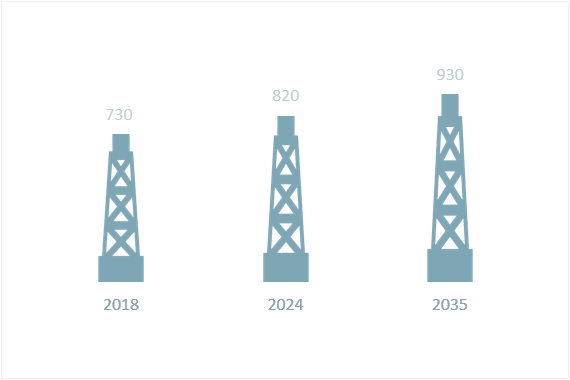
На диаграммах этого типа рисунок «вытягивается» с помощью масштабирования. Высота рисунка пропорциональна отображаемым значениям.
Proportional Chart (Icon)
диаграммы с «вытянутыми» рисунками
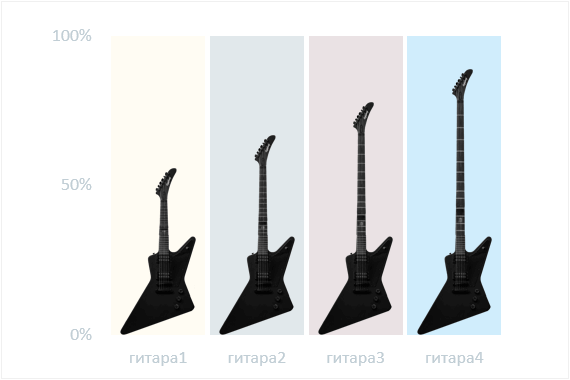
Бывают изображения, которые лучше не «растягивать», например, фотографии. Тогда можно поменять часть изображения, чтобы сохранить вид отдельных деталей.
Pictorial Fraction Chart
пиктограммы с частичной заливкой

Пример для одного изображения.
Диаграмма Термометр
бонус 🙂
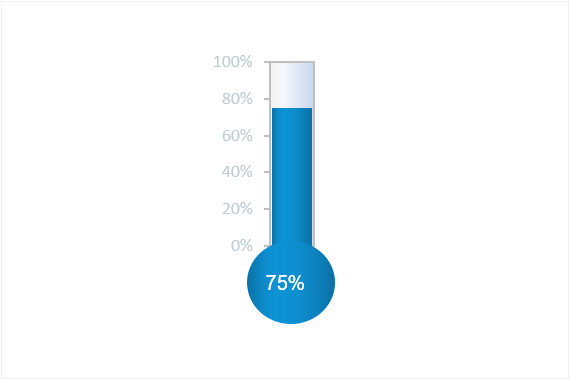
Диаграмма-термометр подойдет для презентаций или дашбордов «узкой» тематики, например, связанных с медициной. Не используйте её часто и везде.