
Время на прочтение
6 мин
Количество просмотров 349K
Добрый день, уважаемые читатели.
В сегодняшней статье я хотел бы, как можно подробнее, рассмотреть интеграцию приложений Python и MS Excel. Данные вопрос может возникнуть, например, при создании какой-либо системы онлайн отчетности, которая должна выгружать результаты в общепринятый формат ну или какие-либо другие задачи. Также в статье я покажу и обратную интеграцию, т.е. как использовать функцию написанную на python в Excel, что также может быть полезно для автоматизации отчетов.
Работаем с файлами MS Excel на Python
Для работы с Excel файлами из Python мне известны 2 варианта:
- Использование библиотек, таких как xlrd, xlwt, xlutils или openpyxl
- Работа с com-объектом
Рассмотрим работу с этими способами подробнее. В качестве примера будем использовать готовый файл excel из которого мы сначала считаем данные из первой ячейки, а затем запишем их во вторую. Таких простых примеров будет достаточно для первого ознакомления.
Использование библиотек
Итак, первый метод довольно простой и хорошо описан. Например, есть отличная статья для описания работы c xlrd, xlwt, xlutils. Поэтому в данном материале я приведу небольшой кусок кода с их использованием.
Для начала загрузим нужные библиотеки и откроем файл xls на чтение и выберем
нужный лист с данными:
import xlrd, xlwt
#открываем файл
rb = xlrd.open_workbook('../ArticleScripts/ExcelPython/xl.xls',formatting_info=True)

#выбираем активный лист
sheet = rb.sheet_by_index(0)
Теперь давайте посмотрим, как считать значения из нужных ячеек:
#получаем значение первой ячейки A1
val = sheet.row_values(0)[0]

#получаем список значений из всех записей
vals = [sheet.row_values(rownum) for rownum in range(sheet.nrows)]
Как видно чтение данных не составляет труда. Теперь запишем их в другой файл. Для этого создам новый excel файл с новой рабочей книгой:
wb = xlwt.Workbook()
ws = wb.add_sheet('Test')
Запишем в новый файл полученные ранее данные и сохраним изменения:
#в A1 записываем значение из ячейки A1 прошлого файла
ws.write(0, 0, val[0])

#в столбец B запишем нашу последовательность из столбца A исходного файла
i = 0
for rec in vals:
    ws.write(i,1,rec[0])
    i =+ i

#сохраняем рабочую книгу
wb.save('../ArticleScripts/ExcelPython/xl_rec.xls')
Из примера выше видно, что библиотека xlrd отвечает за чтение данных, а xlwt — за запись, поэтому нет возможности внести изменения в уже созданную книгу без ее копирования в новую. Кроме этого указанные библиотеки работают только с файлами формата xls (Excel 2003) и у них нет поддержки нового формата xlsx (Excel 2007 и выше).
Чтобы успешно работать с форматом xlsx, понадобится библиотека openpyxl. Для демонстрации ее работы проделаем действия, которые были показаны для предыдущих библиотек.
Для начала загрузим библиотеку и выберем нужную книгу и рабочий лист:
import openpyxl
wb = openpyxl.load_workbook(filename = '../ArticleScripts/ExcelPython/openpyxl.xlsx')
sheet = wb['test']
Как видно из вышеприведенного листинга сделать это не сложно. Теперь посмотрим как можно считать данные:
#считываем значение определенной ячейки
val = sheet['A1'].value

#считываем заданный диапазон
vals = [v[0].value for v in sheet.range('A1:A2')]
Отличие от прошлых библиотек в том, что openpyxl дает возможность отображаться к ячейкам и последовательностям через их имена, что довольно удобно и понятно при чтении программы.
Теперь посмотрим как нам произвести запись и сохранить данные:
#записываем значение в определенную ячейку
sheet['B1'] = val

#записываем последовательность
i = 0
for rec in vals:
    sheet.cell(row=i, column=2).value = rec
    i =+ 1

# сохраняем данные
wb.save('../ArticleScripts/ExcelPython/openpyxl.xlsx')
Из примера видно, что запись, тоже производится довольно легко. Кроме того, в коде выше, можно заметить, что openpyxl кроме имен ячеек может работать и с их индексами.
К недостаткам данной библиотеки можно отнести, то что, как и в предыдущем примере, нет возможности сохранить изменения без создания новой книги.
Как было показано выше, для более менее полноценной работы с excel файлами, в данном случае, нужно 4 библиотеки, и это не всегда удобно. Кроме этого, возможно нужен будет доступ к VBA (допустим для какой-либо последующей обработки) и с помощью этих библиотек его не получить.
Однако, работа с этими библиотеками достаточно проста и удобна для быстрого создания Excel файлов их форматирования, но если Вам надо больше возможностей, то следующий подпункт для Вас.
Работа с com-объектом
В своих отчетах я предпочитаю использовать второй способ, а именно использование файла Excel через com-объект с использованием библиотеки win32com. Его преимуществом, является то, что вы можете выполнять с файлом все операции, которые позволяет делать обычный Excel с использованием VBA.
Проиллюстрируем это на той же задаче, что и предыдущие примеры.
Для начала загрузим нужную библиотеку и создадим COM объект.
import win32com.client
Excel = win32com.client.Dispatch("Excel.Application")
Теперь мы можем работать с помощью объекта Excel мы можем получить доступ ко всем возможностям VBA. Давайте, для начала, откроем любую книгу и выберем активный лист. Это можно сделать так:
wb = Excel.Workbooks.Open(u'D:\Scripts\DataScience\ArticleScripts\ExcelPython\xl.xls')
sheet = wb.ActiveSheet
Давайте получим значение первой ячейки и последовательности:
#получаем значение первой ячейки
val = sheet.Cells(1,1).value

#получаем значения цепочки A1:A2
vals = [r[0].value for r in sheet.Range("A1:A2")]
Как можно заметить, мы оперируем здесь функциями чистого VBA. Это очень удобно если у вас есть написанные макросы и вы хотите использовать их при работе с Python при минимальных затратах на переделку кода.
Посмотрим, как можно произвести запись полученных значений:
#записываем значение в определенную ячейку
sheet.Cells(1,2).value = val

#записываем последовательность
i = 1
for rec in vals:
    sheet.Cells(i,3).value = rec
    i = i + 1

#сохраняем рабочую книгу
wb.Save()

#закрываем ее
wb.Close()

#закрываем COM объект
Excel.Quit()
Из примера видно, что данные операции тоже довольно просто реализовываются. Кроме этого, можно заметить, что изменения мы сохранили в той же книге, которую открыли для чтения, что достаточно удобно.
Однако, внимательный читатель, обратит внимание на переменную i, которая инициализируется не 0, как принято python, а 1. Это связано с тем, что мы работаем с индексами ячеек как из VBA, а там нумерация начинается не с 0, а с 1.
На этом закончим разбор способов работы с excel файлами в python и перейдем к обратной задаче.
Вызываем функции Python из MS Excel
Может возникнуть такая ситуация, что у вас уже есть какой-либо функция, которая обрабатывает данные на python, и нужно перенести ее функциональность в Excel. Конечно же можно переписать ее на VBA, но зачем?
Для использования функций python в Excel есть прекрасная надстройка ExcelPython. С ее помощью вы сможете вызывать функции написанные на python прямо из Excel, правда придется еще написать небольшую обертку на VBA, и все это будет показано ниже.
Итак, предположим у нас есть функция, написанная на python, которой мы хотим воспользоваться:
def get_unique(lists):
    sm = 0
    for i in lists:
        sm = sm + int(i.pop())
    return sm
На вход ей подается список, состоящий из списков, это одно из условий, которое должно выполняться для работы данной функции в Excel.
Сохраним функцию в файле plugin.py и положим его в ту же директорию, где будет лежать наш excel файл, с которым мы будем работать.
Теперь установим ExcelPython. Установка происходит через запуск exe-файла и не вызывает затруднений.
Когда все приготовления выполнены, открываем тестовый файл excel и вызовем редактор VBA (Alt+F11). Для работы с вышеуказанной надстройкой необходимо ее подключить, через Tools->References, как показано на рисунке:

Ну что же, теперь можно приступить к написанию функции-обертки для нашего Python-модуля plugin.py. Выглядеть она будет следующим образом:
Function sr(lists As Range)
    On Error GoTo do_error
        Set plugin = PyModule("plugin", AddPath:=ThisWorkbook.Path)
        Set result = PyCall(plugin, "get_unique", PyTuple(lists.Value2))
        sr = WorksheetFunction.Transpose(PyVar(result))
        Exit Function
do_error:
        sr = Err.Description
End Function
Итак, что же происходит в данной функции?
Для начала, с помощью PyModule, мы подключаем нужный модуль. Для этого в качестве параметров ей передается имя модуля без расширения, и путь до папки в которой он находится. На выходе работы PyModule мы получаем объект для работы с модулем.
Затем, с помощью PyCall, вызываем нужную нам функцию из указанного модуля. В качестве параметров PyCall получает следующее:
- Объект модуля, полученный на предыдущем шаге
- Имя вызываемой функции
- Параметры, передаваемые функции (передаются в виде списка)
Функция PyTuple, получает на вход какие-либо значения и преобразует их в объект tuple языка Python.
Ну и, соответственно, PyVar выполняет операцию преобразования результата функции python, к типу понятному Excel.
Теперь, чтобы убедиться в работоспособности нашей связки, вызовем нашу свежеиспеченую функцию на листе в Excel:

Как видно из рисунка все отработало правильно.
Надо отметить, что в данном материале используется старая версия ExcelPython, и на GitHub’e автора доступна новая версия.
Заключение
В качестве заключения, надо отметить, примеры в данной статье самые простые и для более глубоко изучения данных методов, я рекомендую обратиться к
документации по нужным пакетам.
Также хочу заметить, что указанные пакеты не являются единственными и в статье опущено рассмотрение, таких пакетов как xlsxwriter для генерации excel файлов или xlwings, который может работать с Excel файлами «на лету», а также же PyXLL, который выполняет аналогичные функции ExcelPython.
Кроме этого в статье я попытался несколько обобщить разборасанный по сети материал, т.к. такие вопросы часто фигурируют на форумах и думаю некоторым будет полезно иметь, такую «шпаргалку» под рукой.
Узнайте, как читать и импортировать файлы Excel в Python, как записывать данные в эти таблицы и какие библиотеки лучше всего подходят для этого.
Известный вам инструмент для организации, анализа и хранения ваших данных в таблицах — Excel — применяется и в data science. В какой-то момент вам придется иметь дело с этими таблицами, но работать именно с ними вы будете не всегда. Вот почему разработчики Python реализовали способы чтения, записи и управления не только этими файлами, но и многими другими типами файлов.
Из этого учебника узнаете, как можете работать с Excel и Python. Внутри найдете обзор библиотек, которые вы можете использовать для загрузки и записи этих таблиц в файлы с помощью Python. Вы узнаете, как работать с такими библиотеками, как pandas, openpyxl, xlrd, xlutils и pyexcel.
Данные как ваша отправная точка
Когда вы начинаете проект по data science, вам придется работать с данными, которые вы собрали по всему интернету, и с наборами данных, которые вы загрузили из других мест — Kaggle, Quandl и тд
Но чаще всего вы также найдете данные в Google или в репозиториях, которые используются другими пользователями. Эти данные могут быть в файле Excel или сохранены в файл с расширением .csv … Возможности могут иногда казаться бесконечными, но когда у вас есть данные, в первую очередь вы должны убедиться, что они качественные.
В случае с электронной таблицей вы можете не только проверить, могут ли эти данные ответить на вопрос исследования, который вы имеете в виду, но также и можете ли вы доверять данным, которые хранятся в электронной таблице.
Проверяем качество таблицы
- Представляет ли электронная таблица статические данные?
- Смешивает ли она данные, расчеты и отчетность?
- Являются ли данные в вашей электронной таблице полными и последовательными?
- Имеет ли ваша таблица систематизированную структуру рабочего листа?
- Проверяли ли вы действительные формулы в электронной таблице?
Этот список вопросов поможет убедиться, что ваша таблица не грешит против лучших практик, принятых в отрасли. Конечно, этот список не исчерпывающий, но позволит провести базовую проверку таблицы.
Лучшие практики для данных электронных таблиц
Прежде чем приступить к чтению вашей электронной таблицы на Python, вы также должны подумать о том, чтобы настроить свой файл в соответствии с некоторыми основными принципами, такими как:
- Первая строка таблицы обычно зарезервирована для заголовка, а первый столбец используется для идентификации единицы выборки;
- Избегайте имен, значений или полей с пробелами. В противном случае каждое слово будет интерпретироваться как отдельная переменная, что приведет к ошибкам, связанным с количеством элементов на строку в вашем наборе данных. По возможности, используйте:
- подчеркивания,
- тире,
- горбатый регистр, где первая буква каждого слова пишется с большой буквы
- объединяющие слова
- Короткие имена предпочтительнее длинных имен;
- старайтесь не использовать имена, которые содержат символы ?, $,%, ^, &, *, (,), -, #,? ,,, <,>, /, |, , [,], {, и };
- Удалите все комментарии, которые вы сделали в вашем файле, чтобы избежать добавления в ваш файл лишних столбцов или NA;
- Убедитесь, что все пропущенные значения в вашем наборе данных обозначены как NA.
Затем, после того, как вы внесли необходимые изменения или тщательно изучили свои данные, убедитесь, что вы сохранили внесенные изменения. Сделав это, вы можете вернуться к данным позже, чтобы отредактировать их, добавить дополнительные данные или изменить их, сохранив формулы, которые вы, возможно, использовали для расчета данных и т.д.
Если вы работаете с Microsoft Excel, вы можете сохранить файл в разных форматах: помимо расширения по умолчанию .xls или .xlsx, вы можете перейти на вкладку «Файл», нажать «Сохранить как» и выбрать одно из расширений, которые указаны в качестве параметров «Сохранить как тип». Наиболее часто используемые расширения для сохранения наборов данных в data science — это .csv и .txt (в виде текстового файла с разделителями табуляции). В зависимости от выбранного варианта сохранения поля вашего набора данных разделяются вкладками или запятыми, которые образуют символы-разделители полей вашего набора данных.
Теперь, когда вы проверили и сохранили ваши данные, вы можете начать с подготовки вашего рабочего окружения.
Готовим рабочее окружение
Как убедиться, что вы все делаете хорошо? Проверить рабочее окружение!
Когда вы работаете в терминале, вы можете сначала перейти в каталог, в котором находится ваш файл, а затем запустить Python. Убедитесь, что файл лежит именно в том каталоге, к которому вы обратились.
Возможно, вы уже начали сеанс Python и у вас нет подсказок о каталоге, в котором вы работаете. Тогда можно выполнить следующие команды:
# Import `os`
import os

# Retrieve current working directory (`cwd`)
cwd = os.getcwd()
cwd

# Change directory
os.chdir("/path/to/your/folder")

# List all files and directories in current directory
os.listdir('.')
Круто, да?
Вы увидите, что эти команды очень важны не только для загрузки ваших данных, но и для дальнейшего анализа. А пока давайте продолжим: вы прошли все проверки, вы сохранили свои данные и подготовили рабочее окружение.
Можете ли вы начать с чтения данных в Python?
Установите библиотеки для чтения и записи файлов Excel
Даже если вы еще не знаете, какие библиотеки вам понадобятся для импорта ваших данных, вы должны убедиться, что у вас есть все, что нужно для установки этих библиотек, когда придет время.
Подготовка к дополнительной рабочей области: pip
Вот почему вам нужно установить pip и setuptools. Если у вас установлен Python2 ⩾ 2.7.9 или Python3 ⩾ 3.4, то можно не беспокоиться — просто убедитесь, что вы обновились до последней версии.
Для этого выполните следующую команду в своем терминале:
# Для Linux/OS X
pip install -U pip setuptools

# Для Windows
python -m pip install -U pip setuptools
Если вы еще не установили pip, запустите скрипт python get-pip.py, который вы можете найти здесь. Следуйте инструкциям по установке.
Установка Anaconda
Другой вариант для работы в data science — установить дистрибутив Anaconda Python. Сделав это, вы получите простой и быстрый способ начать заниматься data science, потому что вам не нужно беспокоиться об установке отдельных библиотек, необходимых для работы.
Это особенно удобно, если вы новичок, но даже для более опытных разработчиков это способ быстро протестировать некоторые вещи без необходимости устанавливать каждую библиотеку отдельно.
Anaconda включает в себя 100 самых популярных библиотек Python, R и Scala для науки о данных и несколько сред разработки с открытым исходным кодом, таких как Jupyter и Spyder.
Установить Anaconda можно здесь. Следуйте инструкциям по установке, и вы готовы начать!
Загрузить файлы Excel в виде фреймов Pandas
Все, среда настроена, вы готовы начать импорт ваших файлов.
Один из способов, который вы часто используете для импорта ваших файлов для обработки данных, — с помощью библиотеки Pandas. Она основана на NumPy и предоставляет простые в использовании структуры данных и инструменты анализа данных Python.
Эта мощная и гибкая библиотека очень часто используется дата-инженерами для передачи своих данных в структуры данных, очень выразительных для их анализа.
Если у вас уже есть Pandas, доступные через Anaconda, вы можете просто загрузить свои файлы в Pandas DataFrames с помощью pd.Excelfile():
# импорт библиотеки pandas
import pandas as pd

# Загружаем ваш файл в переменную `file` / вместо 'example' укажите название свого файла из текущей директории
file = 'example.xlsx'

# Загружаем spreadsheet в объект pandas
xl = pd.ExcelFile(file)

# Печатаем название листов в данном файле
print(xl.sheet_names)

# Загрузить лист в DataFrame по его имени: df1
df1 = xl.parse('Sheet1')
Если вы не установили Anaconda, просто выполните pip install pandas, чтобы установить библиотеку Pandas в вашей среде, а затем выполните команды, которые включены в фрагмент кода выше.
Проще простого, да?
Для чтения в файлах .csv у вас есть аналогичная функция для загрузки данных в DataFrame: read_csv(). Вот пример того, как вы можете использовать эту функцию:
# Импорт библиотеки pandas
import pandas as pd

# Загрузить csv файл
df = pd.read_csv("example.csv")
Разделитель, который будет учитывать эта функция, по умолчанию является запятой, но вы можете указать альтернативный разделитель, если хотите. Перейдите к документации, чтобы узнать, какие другие аргументы вы можете указать для успешного импорта!
Обратите внимание, что есть также функции read_table() и read_fwf() для чтения файлов и таблиц с фиксированной шириной в формате DataFrames с общим разделителем. Для первой функции разделителем по умолчанию является вкладка, но вы можете снова переопределить это, а также указать альтернативный символ-разделитель. Более того, есть и другие функции, которые вы можете использовать для получения данных в DataFrames: вы можете найти их здесь.
Как записать Pandas DataFrames в файлы Excel
Допустим, что после анализа данных вы хотите записать данные обратно в новый файл. Есть также способ записать ваши Pandas DataFrames обратно в файлы с помощью функции to_excel().
Но, прежде чем использовать эту функцию, убедитесь, что у вас установлен XlsxWriter, если вы хотите записать свои данные в несколько листов в файле .xlsx:
# Установим `XlsxWriter`
pip install XlsxWriter

# Указать writer библиотеки
writer = pd.ExcelWriter('example.xlsx', engine='xlsxwriter')

# Записать ваш DataFrame в файл
yourData.to_excel(writer, 'Sheet1')

# Сохраним результат
writer.save()
Обратите внимание, что в приведенном выше фрагменте кода вы используете объект ExcelWriter для вывода DataFrame.
Иными словами, вы передаете переменную Writer в функцию to_excel() и также указываете имя листа. Таким образом, вы добавляете лист с данными в существующую рабочую книгу: вы можете использовать ExcelWriter для сохранения нескольких (немного) разных DataFrames в одной рабочей книге.
Все это означает, что если вы просто хотите сохранить один DataFrame в файл, вы также можете обойтись без установки пакета XlsxWriter. Затем вы просто не указываете аргумент движка, который вы передаете в функцию pd.ExcelWriter(). Остальные шаги остаются прежними.
Аналогично функциям, которые вы использовали для чтения в файлах .csv, у вас также есть функция to_csv() для записи результатов обратно в файл, разделенный запятыми. Он снова работает так же, как когда вы использовали его для чтения в файле:
# Запишите DataFrame в csv
df.to_csv("example.csv")
Если вы хотите иметь файл, разделенный табуляцией, вы также можете передать t аргументу sep. Обратите внимание, что есть другие функции, которые вы можете использовать для вывода ваших файлов. Вы можете найти их все здесь.
Пакеты для разбора файлов Excel и обратной записи с помощью Python
Помимо библиотеки Pandas, который вы будете использовать очень часто для загрузки своих данных, вы также можете использовать другие библиотеки для получения ваших данных в Python. Наш обзор основан на этой странице со списком доступных библиотек, которые вы можете использовать для работы с файлами Excel в Python.
Далее вы увидите, как использовать эти библиотеки с помощью некоторых реальных, но упрощенных примеров.
Использование виртуальных сред
Общий совет для установки — делать это в Python virtualenv без системных пакетов. Вы можете использовать virtualenv для создания изолированных сред Python: он создает папку, содержащую все необходимые исполняемые файлы для использования пакетов, которые потребуются проекту Python.
Чтобы начать работать с virtualenv, вам сначала нужно установить его. Затем перейдите в каталог, в который вы хотите поместить свой проект. Создайте virtualenv в этой папке и загрузите в определенную версию Python, если вам это нужно. Затем вы активируете виртуальную среду. После этого вы можете начать загрузку в другие библиотеки, начать работать с ними и т. д.
Совет: не забудьте деактивировать среду, когда закончите!
# Install virtualenv
$ pip install virtualenv

# Go to the folder of your project
$ cd my_folder

# Create a virtual environment `venv`
$ virtualenv venv

# Indicate the Python interpreter to use for `venv`
$ virtualenv -p /usr/bin/python2.7 venv

# Activate `venv`
$ source venv/bin/activate

# Deactivate `venv`
$ deactivate
Обратите внимание, что виртуальная среда может показаться немного проблемной на первый взгляд, когда вы только начинаете работать с данными с Python. И, особенно если у вас есть только один проект, вы можете не понять, зачем вам вообще нужна виртуальная среда.
С ней будет гораздо легче, когда у вас одновременно запущено несколько проектов, и вы не хотите, чтобы они использовали одну и ту же установку Python. Или когда ваши проекты имеют противоречащие друг другу требования, виртуальная среда пригодится!
Теперь вы можете, наконец, начать установку и импорт библиотек, о которых вы читали, и загрузить их в таблицу.
Как читать и записывать файлы Excel с openpyxl
Этот пакет обычно рекомендуется, если вы хотите читать и записывать файлы .xlsx, xlsm, xltx и xltm.
Установите openpyxl с помощью pip: вы видели, как это сделать в предыдущем разделе.
Общий совет для установки этой библиотеки — делать это в виртуальной среде Python без системных библиотек. Вы можете использовать виртуальную среду для создания изолированных сред Python: она создает папку, которая содержит все необходимые исполняемые файлы для использования библиотек, которые потребуются проекту Python.
Перейдите в каталог, в котором находится ваш проект, и повторно активируйте виртуальную среду venv. Затем продолжите установку openpyxl с pip, чтобы убедиться, что вы можете читать и записывать файлы с ним:
# Активируйте virtualenv
$ source activate venv

# Установим `openpyxl` в `venv`
$ pip install openpyxl
Теперь, когда вы установили openpyxl, вы можете загружать данные. Но что это за данные?
Доспутим Excel с данными, которые вы пытаетесь загрузить в Python, содержит следующие листы:
Функция load_workbook() принимает имя файла в качестве аргумента и возвращает объект рабочей книги, который представляет файл. Вы можете проверить это, запустив type (wb). Убедитесь, что вы находитесь в том каталоге, где находится ваша таблица, иначе вы получите error при импорте.
# Import `load_workbook` module from `openpyxl`
from openpyxl import load_workbook

# Load in the workbook
wb = load_workbook('./test.xlsx')

# Get sheet names
print(wb.get_sheet_names())
Помните, что вы можете изменить рабочий каталог с помощью os.chdir().
Вы видите, что фрагмент кода выше возвращает имена листов книги, загруженной в Python.Можете использовать эту информацию, чтобы также получить отдельные листы рабочей книги.
Вы также можете проверить, какой лист в настоящее время активен с wb.active. Как видно из кода ниже, вы можете использовать его для загрузки другого листа из вашей книги:
# Get a sheet by name
sheet = wb.get_sheet_by_name('Sheet3')

# Print the sheet title
sheet.title

# Get currently active sheet
anotherSheet = wb.active

# Check `anotherSheet`
anotherSheet
На первый взгляд, с этими объектами рабочего листа вы не сможете многое сделать.. Однако вы можете извлечь значения из определенных ячеек на листе вашей книги, используя квадратные скобки [], в которые вы передаете точную ячейку, из которой вы хотите получить значение.
Обратите внимание, что это похоже на выбор, получение и индексирование массивов NumPy и Pandas DataFrames, но это не все, что вам нужно сделать, чтобы получить значение. Вам нужно добавить атрибут value:
# Retrieve the value of a certain cell
sheet['A1'].value

# Select element 'B2' of your sheet
c = sheet['B2']

# Retrieve the row number of your element
c.row

# Retrieve the column letter of your element
c.column

# Retrieve the coordinates of the cell
c.coordinate
Как вы можете видеть, помимо значения, есть и другие атрибуты, которые вы можете использовать для проверки вашей ячейки, а именно: row, column и coordinate.
Атрибут row вернет 2;
Добавление атрибута column к c даст вам ‘B’
coordinate вернет ‘B2’.
Вы также можете получить значения ячеек с помощью функции cell(). Передайте row и column, добавьте к этим аргументам значения, соответствующие значениям ячейки, которую вы хотите получить, и, конечно же, не забудьте добавить атрибут value:
# Retrieve cell value
sheet.cell(row=1, column=2).value

# Print out values in column 2
for i in range(1, 4):
     print(i, sheet.cell(row=i, column=2).value)
Обратите внимание, что если вы не укажете атрибут value, вы получите <Cell Sheet3.B1>, который ничего не говорит о значении, которое содержится в этой конкретной ячейке.
Вы видите, что вы используете цикл for с помощью функции range(), чтобы помочь вам распечатать значения строк, имеющих значения в столбце 2. Если эти конкретные ячейки пусты, вы просто вернете None. Если вы хотите узнать больше о циклах for, пройдите наш курс Intermediate Python для Data Science.
Есть специальные функции, которые вы можете вызывать для получения некоторых других значений, например, get_column_letter() и column_index_from_string.
Две функции указывают примерно то, что вы можете получить, используя их, но лучше сделать их четче: хотя вы можете извлечь букву столбца с предшествующего, вы можете сделать обратное или получить адрес столбца, когда вы задаёте букву последнему. Вы можете увидеть, как это работает ниже:
# Импорт необходимых модулей из  `openpyxl.utils`
from openpyxl.utils import get_column_letter, column_index_from_string

# Вывод 'A'
get_column_letter(1)

# Return '1'
column_index_from_string('A')
Вы уже получили значения для строк, которые имеют значения в определенном столбце, но что вам нужно сделать, если вы хотите распечатать строки вашего файла, не сосредотачиваясь только на одном столбце? Использовать другой цикл, конечно!
Например, вы говорите, что хотите сфокусироваться на области между «А1» и «С3», где первая указывает на левый верхний угол, а вторая — на правый нижний угол области, на которой вы хотите сфокусироваться. ,
Эта область будет так называемым cellObj, который вы видите в первой строке кода ниже. Затем вы говорите, что для каждой ячейки, которая находится в этой области, вы печатаете координату и значение, которое содержится в этой ячейке. После конца каждой строки вы печатаете сообщение, которое указывает, что строка этой области cellObj напечатана.
# Напечатать строчку за строчкой
for cellObj in sheet['A1':'C3']:
      for cell in cellObj:
              print(cells.coordinate, cells.value)
      print('--- END ---')
Еще раз обратите внимание, что выбор области очень похож на выбор, получение и индексирование списка и элементов массива NumPy, где вы также используете [] и : для указания области, значения которой вы хотите получить. Кроме того, вышеприведенный цикл также хорошо использует атрибуты ячейки!
Чтобы сделать вышеприведенное объяснение и код наглядным, вы можете проверить результат, который вы получите после завершения цикла:
('A1', u'M')
('B1', u'N')
('C1', u'O')
--- END ---
('A2', 10L)
('B2', 11L)
('C2', 12L)
--- END ---
('A3', 14L)
('B3', 15L)
('C3', 16L)
--- END ---
Наконец, есть некоторые атрибуты, которые вы можете использовать для проверки результата вашего импорта, а именно max_row и max_column. Эти атрибуты, конечно, и так — общие способы проверки правильности загрузки данных, но они все равно полезны.
# Вывести максимальное количество строк
sheet.max_row

# Вывести максимальное количество колонок
sheet.max_column
Наверное, вы думаете, что такой способ работы с этими файлами сложноват, особенно если вы еще хотите манипулировать данными.
Должно быть что-то попроще, верно? Так и есть!
openpyxl поддерживает Pandas DataFrames! Вы можете использовать функцию DataFrame() из библиотеки Pandas, чтобы поместить значения листа в DataFrame:
# Import `pandas`
import pandas as pd

# конвертировать Лист в DataFrame
df = pd.DataFrame(sheet.values)
Если вы хотите указать заголовки и индексы, вам нужно добавить немного больше кода:
# Put the sheet values in `data`
data = sheet.values

# Indicate the columns in the sheet values
cols = next(data)[1:]

# Convert your data to a list
data = list(data)

# Read in the data at index 0 for the indices
idx = [r[0] for r in data]

# Slice the data at index 1
data = (islice(r, 1, None) for r in data)

# Make your DataFrame
df = pd.DataFrame(data, index=idx, columns=cols)
Затем вы можете начать манипулировать данными со всеми функциями, которые предлагает библиотека Pandas. Но помните, что вы находитесь в виртуальной среде, поэтому, если библиотека еще не представлена, вам нужно будет установить ее снова через pip.
Чтобы записать ваши Pandas DataFrames обратно в файл Excel, вы можете легко использовать функцию dataframe_to_rows() из модуля utils:
# Import `dataframe_to_rows`
from openpyxl.utils.dataframe import dataframe_to_rows

# Initialize a workbook
wb = Workbook()

# Get the worksheet in the active workbook
ws = wb.active

# Append the rows of the DataFrame to your worksheet
for r in dataframe_to_rows(df, index=True, header=True):
    ws.append(r)
Но это точно не все! Библиотека openpyxl предлагает вам высокую гибкость при записи ваших данных обратно в файлы Excel, изменении стилей ячеек или использовании режима write-only. Эту библиотеку обязательно нужно знать, когда вы часто работаете с электронными таблицами ,
Совет: читайте больше о том, как вы можете изменить стили ячеек, перейти в режим write-only или как библиотека работает с NumPy здесь.
Теперь давайте также рассмотрим некоторые другие библиотеки, которые вы можете использовать для получения данных вашей электронной таблицы в Python.
Прежде чем закрыть этот раздел, не забудьте отключить виртуальную среду, когда закончите!
Чтение и форматирование Excel-файлов: xlrd
Эта библиотека идеально подходит для чтения и форматирования данных из Excel с расширением xls или xlsx.
# Import `xlrd`
import xlrd

# Open a workbook
workbook = xlrd.open_workbook('example.xls')

# Loads only current sheets to memory
workbook = xlrd.open_workbook('example.xls', on_demand = True)
Когда вам не нужны данные из всей Excel-книги, вы можете использовать функции sheet_by_name() или sheet_by_index() для получения листов, которые вы хотите получить в своём анализе
# Load a specific sheet by name
worksheet = workbook.sheet_by_name('Sheet1')

# Load a specific sheet by index
worksheet = workbook.sheet_by_index(0)

# Retrieve the value from cell at indices (0,0)
sheet.cell(0, 0).value
Также можно получить значение в определённых ячейках с вашего листа.
Перейдите к xlwt и xlutils, чтобы узнать больше о том, как они относятся к библиотеке xlrd.
Запись данных в Excel-файлы с xlwt
Если вы хотите создать таблицу со своими данными, вы можете использовать не только библиотеку XlsWriter, но и xlwt. xlwt идеально подходит для записи данных и форматирования информации в файлах с расширением .xls
Когда вы вручную создаёте файл:
# Import `xlwt`
import xlwt
# Initialize a workbook
book = xlwt.Workbook(encoding="utf-8")
# Add a sheet to the workbook
sheet1 = book.add_sheet("Python Sheet 1")
# Write to the sheet of the workbook
sheet1.write(0, 0, "This is the First Cell of the First Sheet")
# Save the workbook
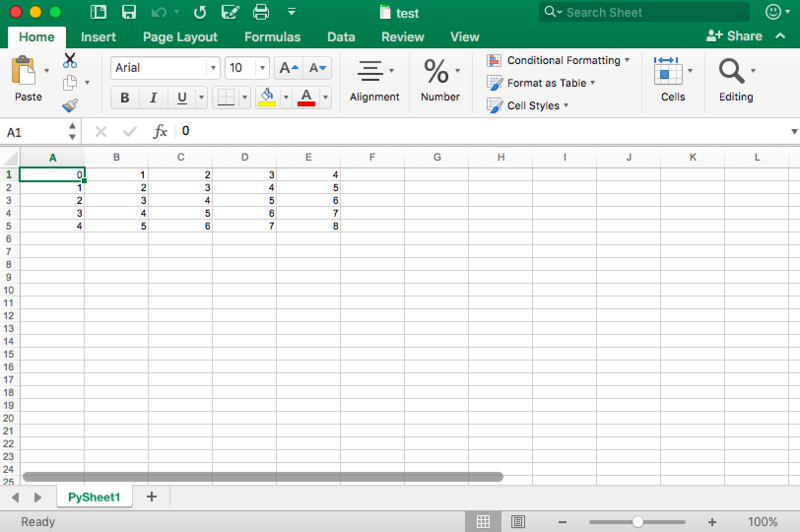
book.save("spreadsheet.xls")Если вы хотите записать данные в файл, но не хотите делать все самостоятельно, вы всегда можете прибегнуть к циклу for, чтобы автоматизировать весь процесс. Составьте сценарий, в котором вы создаёте книгу и в которую добавляете лист. Укажите список со столбцами и один со значениями, которые будут заполнены на листе.
Далее у вас есть цикл for, который гарантирует, что все значения попадают в файл: вы говорите, что для каждого элемента в диапазоне от 0 до 4 (5 не включительно) вы собираетесь что-то делать. Вы будете заполнять значения построчно. Для этого вы указываете элемент строки, который появляется в каждом цикле. Далее у вас есть еще один цикл for, который будет проходить по столбцам вашего листа. Вы говорите, что для каждой строки на листе, вы будете смотреть на столбцы, которые идут с ним, и вы будете заполнять значение для каждого столбца в строке. Заполнив все столбцы строки значениями, вы перейдете к следующей строке, пока не останется строк.
# Initialize a workbook
book = xlwt.Workbook()

# Add a sheet to the workbook
sheet1 = book.add_sheet("Sheet1")

# The data
cols = ["A", "B", "C", "D", "E"]
txt = [0,1,2,3,4]

# Loop over the rows and columns and fill in the values
for num in range(5):
      row = sheet1.row(num)
      for index, col in enumerate(cols):
          value = txt[index] + num
          row.write(index, value)

# Save the result
book.save("test.xls")
На скриншоте ниже представлен результат выполнения этого кода:
Теперь, когда вы увидели, как xlrd и xlwt работают друг с другом, пришло время взглянуть на библиотеку, которая тесно связана с этими двумя: xlutils.
Сборник утилит: xlutils
Эта библиотека — сборник утилит, для которого требуются и xlrd и xlwt, и которая может копировать, изменять и фильтровать существующие данные. О том, как пользоваться этими командами рассказано в разделе по openpyxl.
Вернитесь в раздел openpyxl, чтобы получить больше информации о том, как использовать этот пакет для получения данных в Python.
Использование pyexcel для чтения .xls или .xlsx файлов
Еще одна библиотека, которую можно использовать для чтения данных электронных таблиц в Python — это pyexcel; Python Wrapper, который предоставляет один API для чтения, записи и работы с данными в файлах .csv, .ods, .xls, .xlsx и .xlsm. Конечно, для этого урока вы просто сосредоточитесь на файлах .xls и .xls.
Чтобы получить ваши данные в массиве, вы можете использовать функцию get_array(), которая содержится в пакете pyexcel:
# Import `pyexcel`
import pyexcel

# Get an array from the data
my_array = pyexcel.get_array(file_name="test.xls")
Вы также можете получить свои данные в упорядоченном словаре списков. Вы можете использовать функцию get_dict():
# Import `OrderedDict` module
from pyexcel._compact import OrderedDict

# Get your data in an ordered dictionary of lists
my_dict = pyexcel.get_dict(file_name="test.xls", name_columns_by_row=0)

# Get your data in a dictionary of 2D arrays
book_dict = pyexcel.get_book_dict(file_name="test.xls")
Здесь видно, что если вы хотите получить словарь двумерных массивов или получить все листы рабочей книги в одном словаре, вы можете прибегнуть к get_book_dict().
Помните, что эти две структуры данных, которые были упомянуты выше, массивы и словари вашей таблицы, позволяют вам создавать DataFrames ваших данных с помощью pd.DataFrame(). Это облегчит обработку данных.
Кроме того, вы можете просто получить записи из таблицы с помощью pyexcel благодаря функции get_records(). Просто передайте аргумент file_name в функцию, и вы получите список словарей:
# Retrieve the records of the file
records = pyexcel.get_records(file_name="test.xls")
Чтобы узнать, как управлять списками Python, ознакомьтесь с примерами из документации о списках Python.
Запись в файл с pyexcel
С помощью этой библиотеки можно не только загружать данные в массивы, вы также можете экспортировать свои массивы обратно в таблицу. Используйте функцию save_as() и передайте массив и имя файла назначения в аргумент dest_file_name:
# Get the data
data = [[1, 2, 3], [4, 5, 6], [7, 8, 9]]

# Save the array to a file
pyexcel.save_as(array=data, dest_file_name="array_data.xls")
Обратите внимание, что если вы хотите указать разделитель, вы можете добавить аргумент dest_delimiter и передать символ, который вы хотите использовать в качестве разделителя между «».
Однако если у вас есть словарь, вам нужно использовать функцию save_book_as(). Передайте двумерный словарь в bookdict и укажите имя файла:
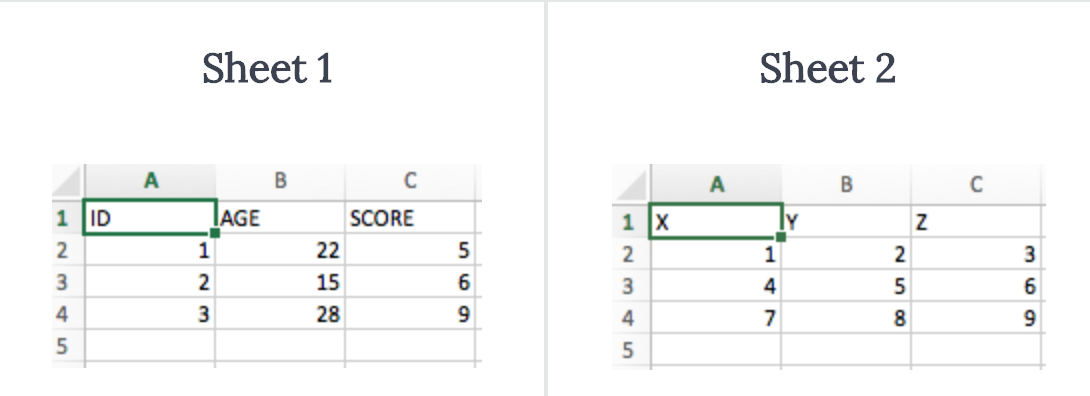
# The data
2d_array_dictionary = {'Sheet 1': [
                                   ['ID', 'AGE', 'SCORE']
                                   [1, 22, 5],
                                   [2, 15, 6],
                                   [3, 28, 9]
                                  ],
                       'Sheet 2': [
                                    ['X', 'Y', 'Z'],
                                    [1, 2, 3],
                                    [4, 5, 6]
                                    [7, 8, 9]
                                  ],
                       'Sheet 3': [
                                    ['M', 'N', 'O', 'P'],
                                    [10, 11, 12, 13],
                                    [14, 15, 16, 17]
                                    [18, 19, 20, 21]
                                   ]}

# Save the data to a file
pyexcel.save_book_as(bookdict=2d_array_dictionary, dest_file_name="2d_array_data.xls")
При использовании кода, напечатанного в приведенном выше примере, важно помнить, что порядок ваших данных в словаре не будет сохранен. Если вы не хотите этого, вам нужно сделать небольшой обход. Вы можете прочитать все об этом здесь.
Чтение и запись .csv файлов
Если вы все еще ищете библиотеки, которые позволяют загружать и записывать данные в файлы .csv, кроме Pandas, лучше всего использовать пакет csv:
# import `csv`
import csv

# Read in csv file
for row in csv.reader(open('data.csv'), delimiter=','):
      print(row)

# Write csv file
data = [[1, 2, 3], [4, 5, 6], [7, 8, 9]]
outfile = open('data.csv', 'w')
writer = csv.writer(outfile, delimiter=';', quotechar='"')
writer.writerows(data)
outfile.close()
Обратите внимание, что в пакете NumPy есть функция genfromtxt(), которая позволяет загружать данные, содержащиеся в файлах .csv, в массивы, которые затем можно поместить в DataFrames.
Финальная проверка данных
Когда у вас есть данные, не забудьте последний шаг: проверить, правильно ли загружены данные. Если вы поместили свои данные в DataFrame, вы можете легко и быстро проверить, был ли импорт успешным, выполнив следующие команды:
# Check the first entries of the DataFrame
df1.head()

# Check the last entries of the DataFrame
df1.tail()
Если у вас есть данные в массиве, вы можете проверить их, используя следующие атрибуты массива: shape, ndim, dtype и т.д .:
# Inspect the shape
data.shape

# Inspect the number of dimensions
data.ndim

# Inspect the data type
data.dtype
Что дальше?
Поздравляем! Вы успешно прошли наш урок и научились читать файлы Excel на Python.
Если вы хотите продолжить работу над этой темой, попробуйте воспользоваться PyXll, который позволяет писать функции в Python и вызывать их в Excel.
Watch Now This tutorial has a related video course created by the Real Python team. Watch it together with the written tutorial to deepen your understanding: Editing Excel Spreadsheets in Python With openpyxl
Excel spreadsheets are one of those things you might have to deal with at some point. Either it’s because your boss loves them or because marketing needs them, you might have to learn how to work with spreadsheets, and that’s when knowing openpyxl comes in handy!
Spreadsheets are a very intuitive and user-friendly way to manipulate large datasets without any prior technical background. That’s why they’re still so commonly used today.
In this article, you’ll learn how to use openpyxl to:
- Manipulate Excel spreadsheets with confidence
- Extract information from spreadsheets
- Create simple or more complex spreadsheets, including adding styles, charts, and so on
This article is written for intermediate developers who have a pretty good knowledge of Python data structures, such as dicts and lists, but also feel comfortable around OOP and more intermediate level topics.
Before You Begin
If you ever get asked to extract some data from a database or log file into an Excel spreadsheet, or if you often have to convert an Excel spreadsheet into some more usable programmatic form, then this tutorial is perfect for you. Let’s jump into the openpyxl caravan!
Practical Use Cases
First things first, when would you need to use a package like openpyxl in a real-world scenario? You’ll see a few examples below, but really, there are hundreds of possible scenarios where this knowledge could come in handy.
Importing New Products Into a Database
You are responsible for tech in an online store company, and your boss doesn’t want to pay for a cool and expensive CMS system.
Every time they want to add new products to the online store, they come to you with an Excel spreadsheet with a few hundred rows and, for each of them, you have the product name, description, price, and so forth.
Now, to import the data, you’ll have to iterate over each spreadsheet row and add each product to the online store.
Exporting Database Data Into a Spreadsheet
Say you have a Database table where you record all your users’ information, including name, phone number, email address, and so forth.
Now, the Marketing team wants to contact all users to give them some discounted offer or promotion. However, they don’t have access to the Database, or they don’t know how to use SQL to extract that information easily.
What can you do to help? Well, you can make a quick script using openpyxl that iterates over every single User record and puts all the essential information into an Excel spreadsheet.
That’s gonna earn you an extra slice of cake at your company’s next birthday party!
Appending Information to an Existing Spreadsheet
You may also have to open a spreadsheet, read the information in it and, according to some business logic, append more data to it.
For example, using the online store scenario again, say you get an Excel spreadsheet with a list of users and you need to append to each row the total amount they’ve spent in your store.
This data is in the Database and, in order to do this, you have to read the spreadsheet, iterate through each row, fetch the total amount spent from the Database and then write back to the spreadsheet.
Not a problem for openpyxl!
Learning Some Basic Excel Terminology
Here’s a quick list of basic terms you’ll see when you’re working with Excel spreadsheets:
| Term | Explanation |
|---|---|
| Spreadsheet or Workbook | A Spreadsheet is the main file you are creating or working with. |
| Worksheet or Sheet | A Sheet is used to split different kinds of content within the same spreadsheet. A Spreadsheet can have one or more Sheets. |
| Column | A Column is a vertical line, and it’s represented by an uppercase letter: A. |
| Row | A Row is a horizontal line, and it’s represented by a number: 1. |
| Cell | A Cell is a combination of Column and Row, represented by both an uppercase letter and a number: A1. |
Getting Started With openpyxl
Now that you’re aware of the benefits of a tool like openpyxl, let’s get down to it and start by installing the package. For this tutorial, you should use Python 3.7 and openpyxl 2.6.2. To install the package, you can do the following:
After you install the package, you should be able to create a super simple spreadsheet with the following code:
from openpyxl import Workbook

workbook = Workbook()
sheet = workbook.active

sheet["A1"] = "hello"
sheet["B1"] = "world!"

workbook.save(filename="hello_world.xlsx")
The code above should create a file called hello_world.xlsx in the folder you are using to run the code. If you open that file with Excel you should see something like this:
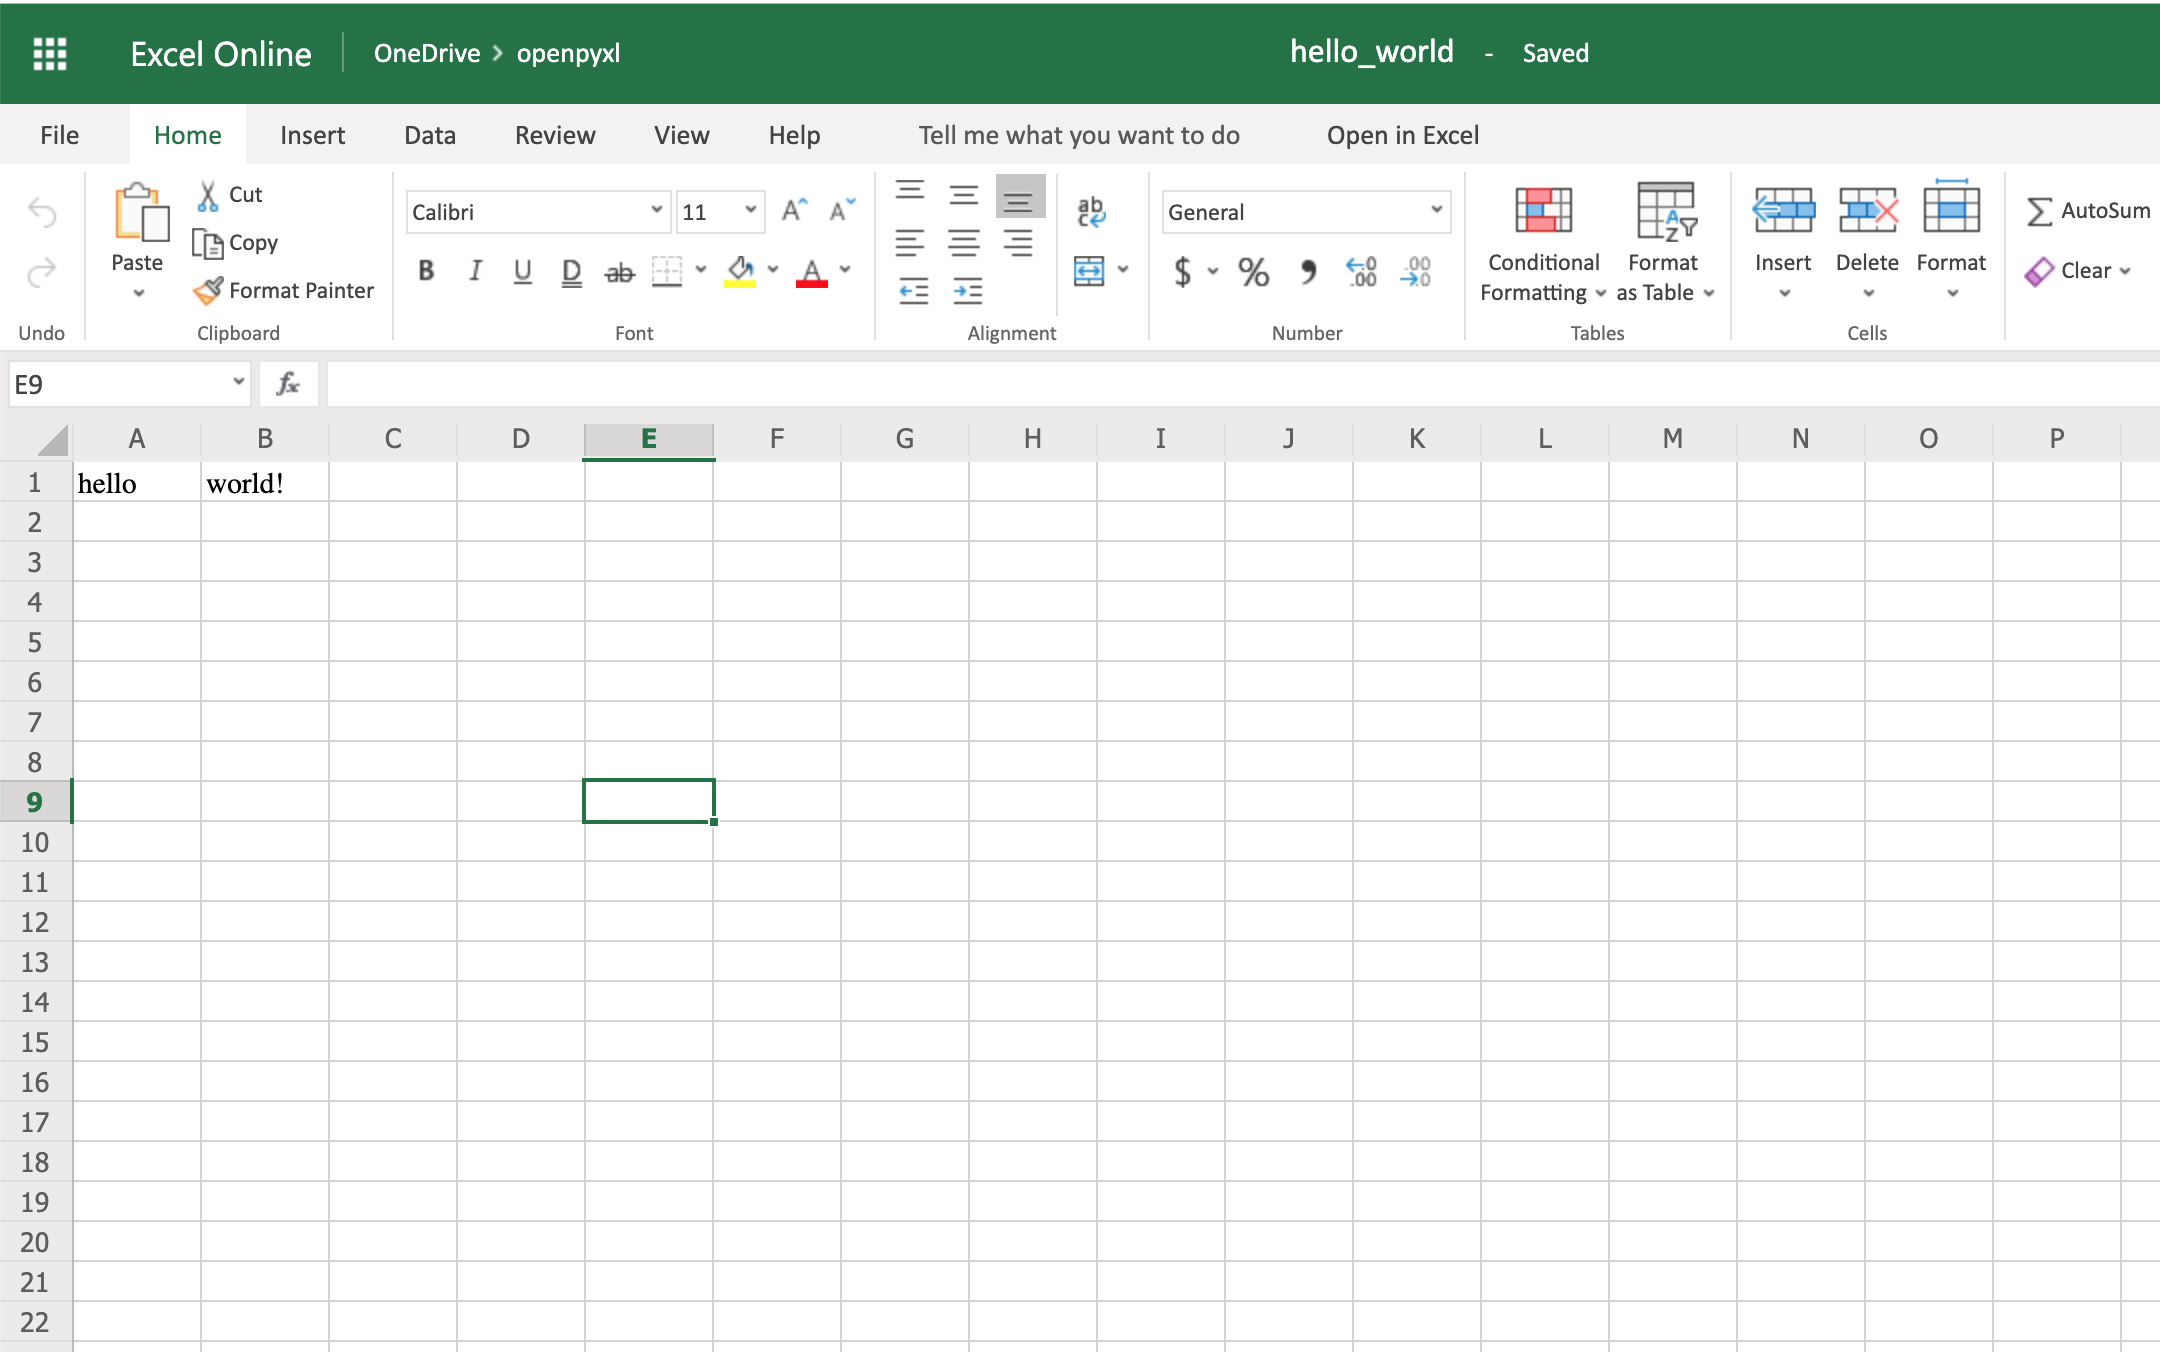
Woohoo, your first spreadsheet created!
Reading Excel Spreadsheets With openpyxl
Let’s start with the most essential thing one can do with a spreadsheet: read it.
You’ll go from a straightforward approach to reading a spreadsheet to more complex examples where you read the data and convert it into more useful Python structures.
Dataset for This Tutorial
Before you dive deep into some code examples, you should download this sample dataset and store it somewhere as sample.xlsx:
This is one of the datasets you’ll be using throughout this tutorial, and it’s a spreadsheet with a sample of real data from Amazon’s online product reviews. This dataset is only a tiny fraction of what Amazon provides, but for testing purposes, it’s more than enough.
A Simple Approach to Reading an Excel Spreadsheet
Finally, let’s start reading some spreadsheets! To begin with, open our sample spreadsheet:
>>>
>>> from openpyxl import load_workbook
>>> workbook = load_workbook(filename="sample.xlsx")
>>> workbook.sheetnames
['Sheet 1']

>>> sheet = workbook.active
>>> sheet
<Worksheet "Sheet 1">

>>> sheet.title
'Sheet 1'
In the code above, you first open the spreadsheet sample.xlsx using load_workbook(), and then you can use workbook.sheetnames to see all the sheets you have available to work with. After that, workbook.active selects the first available sheet and, in this case, you can see that it selects Sheet 1 automatically. Using these methods is the default way of opening a spreadsheet, and you’ll see it many times during this tutorial.
Now, after opening a spreadsheet, you can easily retrieve data from it like this:
>>>
>>> sheet["A1"]
<Cell 'Sheet 1'.A1>

>>> sheet["A1"].value
'marketplace'

>>> sheet["F10"].value
"G-Shock Men's Grey Sport Watch"
To return the actual value of a cell, you need to do .value. Otherwise, you’ll get the main Cell object. You can also use the method .cell() to retrieve a cell using index notation. Remember to add .value to get the actual value and not a Cell object:
>>>
>>> sheet.cell(row=10, column=6)
<Cell 'Sheet 1'.F10>

>>> sheet.cell(row=10, column=6).value
"G-Shock Men's Grey Sport Watch"
You can see that the results returned are the same, no matter which way you decide to go with. However, in this tutorial, you’ll be mostly using the first approach: ["A1"].
The above shows you the quickest way to open a spreadsheet. However, you can pass additional parameters to change the way a spreadsheet is loaded.
Additional Reading Options
There are a few arguments you can pass to load_workbook() that change the way a spreadsheet is loaded. The most important ones are the following two Booleans:
- read_only loads a spreadsheet in read-only mode allowing you to open very large Excel files.
- data_only ignores loading formulas and instead loads only the resulting values.
Importing Data From a Spreadsheet
Now that you’ve learned the basics about loading a spreadsheet, it’s about time you get to the fun part: the iteration and actual usage of the values within the spreadsheet.
This section is where you’ll learn all the different ways you can iterate through the data, but also how to convert that data into something usable and, more importantly, how to do it in a Pythonic way.
Iterating Through the Data
There are a few different ways you can iterate through the data depending on your needs.
You can slice the data with a combination of columns and rows:
>>>
>>> sheet["A1:C2"]
((<Cell 'Sheet 1'.A1>, <Cell 'Sheet 1'.B1>, <Cell 'Sheet 1'.C1>),
 (<Cell 'Sheet 1'.A2>, <Cell 'Sheet 1'.B2>, <Cell 'Sheet 1'.C2>))
You can get ranges of rows or columns:
>>>
>>> # Get all cells from column A
>>> sheet["A"]
(<Cell 'Sheet 1'.A1>,
 <Cell 'Sheet 1'.A2>,
 ...
 <Cell 'Sheet 1'.A99>,
 <Cell 'Sheet 1'.A100>)

>>> # Get all cells for a range of columns
>>> sheet["A:B"]
((<Cell 'Sheet 1'.A1>,
  <Cell 'Sheet 1'.A2>,
  ...
  <Cell 'Sheet 1'.A99>,
  <Cell 'Sheet 1'.A100>),
 (<Cell 'Sheet 1'.B1>,
  <Cell 'Sheet 1'.B2>,
  ...
  <Cell 'Sheet 1'.B99>,
  <Cell 'Sheet 1'.B100>))

>>> # Get all cells from row 5
>>> sheet[5]
(<Cell 'Sheet 1'.A5>,
 <Cell 'Sheet 1'.B5>,
 ...
 <Cell 'Sheet 1'.N5>,
 <Cell 'Sheet 1'.O5>)

>>> # Get all cells for a range of rows
>>> sheet[5:6]
((<Cell 'Sheet 1'.A5>,
  <Cell 'Sheet 1'.B5>,
  ...
  <Cell 'Sheet 1'.N5>,
  <Cell 'Sheet 1'.O5>),
 (<Cell 'Sheet 1'.A6>,
  <Cell 'Sheet 1'.B6>,
  ...
  <Cell 'Sheet 1'.N6>,
  <Cell 'Sheet 1'.O6>))
You’ll notice that all of the above examples return a tuple. If you want to refresh your memory on how to handle tuples in Python, check out the article on Lists and Tuples in Python.
There are also multiple ways of using normal Python generators to go through the data. The main methods you can use to achieve this are:
.iter_rows().iter_cols()
Both methods can receive the following arguments:
min_rowmax_rowmin_colmax_col
These arguments are used to set boundaries for the iteration:
>>>
>>> for row in sheet.iter_rows(min_row=1,
...                            max_row=2,
...                            min_col=1,
...                            max_col=3):
...     print(row)
(<Cell 'Sheet 1'.A1>, <Cell 'Sheet 1'.B1>, <Cell 'Sheet 1'.C1>)
(<Cell 'Sheet 1'.A2>, <Cell 'Sheet 1'.B2>, <Cell 'Sheet 1'.C2>)


>>> for column in sheet.iter_cols(min_row=1,
...                               max_row=2,
...                               min_col=1,
...                               max_col=3):
...     print(column)
(<Cell 'Sheet 1'.A1>, <Cell 'Sheet 1'.A2>)
(<Cell 'Sheet 1'.B1>, <Cell 'Sheet 1'.B2>)
(<Cell 'Sheet 1'.C1>, <Cell 'Sheet 1'.C2>)
You’ll notice that in the first example, when iterating through the rows using .iter_rows(), you get one tuple element per row selected. While when using .iter_cols() and iterating through columns, you’ll get one tuple per column instead.
One additional argument you can pass to both methods is the Boolean values_only. When it’s set to True, the values of the cell are returned, instead of the Cell object:
>>>
>>> for value in sheet.iter_rows(min_row=1,
...                              max_row=2,
...                              min_col=1,
...                              max_col=3,
...                              values_only=True):
...     print(value)
('marketplace', 'customer_id', 'review_id')
('US', 3653882, 'R3O9SGZBVQBV76')
If you want to iterate through the whole dataset, then you can also use the attributes .rows or .columns directly, which are shortcuts to using .iter_rows() and .iter_cols() without any arguments:
>>>
>>> for row in sheet.rows:
...     print(row)
(<Cell 'Sheet 1'.A1>, <Cell 'Sheet 1'.B1>, <Cell 'Sheet 1'.C1>
...
<Cell 'Sheet 1'.M100>, <Cell 'Sheet 1'.N100>, <Cell 'Sheet 1'.O100>)
These shortcuts are very useful when you’re iterating through the whole dataset.
Manipulate Data Using Python’s Default Data Structures
Now that you know the basics of iterating through the data in a workbook, let’s look at smart ways of converting that data into Python structures.
As you saw earlier, the result from all iterations comes in the form of tuples. However, since a tuple is nothing more than an immutable list, you can easily access its data and transform it into other structures.
For example, say you want to extract product information from the sample.xlsx spreadsheet and into a dictionary where each key is a product ID.
A straightforward way to do this is to iterate over all the rows, pick the columns you know are related to product information, and then store that in a dictionary. Let’s code this out!
First of all, have a look at the headers and see what information you care most about:
>>>
>>> for value in sheet.iter_rows(min_row=1,
...                              max_row=1,
...                              values_only=True):
...     print(value)
('marketplace', 'customer_id', 'review_id', 'product_id', ...)
This code returns a list of all the column names you have in the spreadsheet. To start, grab the columns with names:
product_idproduct_parentproduct_titleproduct_category
Lucky for you, the columns you need are all next to each other so you can use the min_column and max_column to easily get the data you want:
>>>
>>> for value in sheet.iter_rows(min_row=2,
...                              min_col=4,
...                              max_col=7,
...                              values_only=True):
...     print(value)
('B00FALQ1ZC', 937001370, 'Invicta Women's 15150 "Angel" 18k Yellow...)
('B00D3RGO20', 484010722, "Kenneth Cole New York Women's KC4944...)
...
Nice! Now that you know how to get all the important product information you need, let’s put that data into a dictionary:
import json
from openpyxl import load_workbook

workbook = load_workbook(filename="sample.xlsx")
sheet = workbook.active

products = {}

# Using the values_only because you want to return the cells' values
for row in sheet.iter_rows(min_row=2,
                           min_col=4,
                           max_col=7,
                           values_only=True):
    product_id = row[0]
    product = {
        "parent": row[1],
        "title": row[2],
        "category": row[3]
    }
    products[product_id] = product

# Using json here to be able to format the output for displaying later
print(json.dumps(products))
The code above returns a JSON similar to this:
{
  "B00FALQ1ZC": {
    "parent": 937001370,
    "title": "Invicta Women's 15150 ...",
    "category": "Watches"
  },
  "B00D3RGO20": {
    "parent": 484010722,
    "title": "Kenneth Cole New York ...",
    "category": "Watches"
  }
}
Here you can see that the output is trimmed to 2 products only, but if you run the script as it is, then you should get 98 products.
Convert Data Into Python Classes
To finalize the reading section of this tutorial, let’s dive into Python classes and see how you could improve on the example above and better structure the data.
For this, you’ll be using the new Python Data Classes that are available from Python 3.7. If you’re using an older version of Python, then you can use the default Classes instead.
So, first things first, let’s look at the data you have and decide what you want to store and how you want to store it.
As you saw right at the start, this data comes from Amazon, and it’s a list of product reviews. You can check the list of all the columns and their meaning on Amazon.
There are two significant elements you can extract from the data available:
- Products
- Reviews
A Product has:
- ID
- Title
- Parent
- Category
The Review has a few more fields:
- ID
- Customer ID
- Stars
- Headline
- Body
- Date
You can ignore a few of the review fields to make things a bit simpler.
So, a straightforward implementation of these two classes could be written in a separate file classes.py:
import datetime
from dataclasses import dataclass

@dataclass
class Product:
    id: str
    parent: str
    title: str
    category: str

@dataclass
class Review:
    id: str
    customer_id: str
    stars: int
    headline: str
    body: str
    date: datetime.datetime
After defining your data classes, you need to convert the data from the spreadsheet into these new structures.
Before doing the conversion, it’s worth looking at our header again and creating a mapping between columns and the fields you need:
>>>
>>> for value in sheet.iter_rows(min_row=1,
...                              max_row=1,
...                              values_only=True):
...     print(value)
('marketplace', 'customer_id', 'review_id', 'product_id', ...)

>>> # Or an alternative
>>> for cell in sheet[1]:
...     print(cell.value)
marketplace
customer_id
review_id
product_id
product_parent
...
Let’s create a file mapping.py where you have a list of all the field names and their column location (zero-indexed) on the spreadsheet:
# Product fields
PRODUCT_ID = 3
PRODUCT_PARENT = 4
PRODUCT_TITLE = 5
PRODUCT_CATEGORY = 6

# Review fields
REVIEW_ID = 2
REVIEW_CUSTOMER = 1
REVIEW_STARS = 7
REVIEW_HEADLINE = 12
REVIEW_BODY = 13
REVIEW_DATE = 14
You don’t necessarily have to do the mapping above. It’s more for readability when parsing the row data, so you don’t end up with a lot of magic numbers lying around.
Finally, let’s look at the code needed to parse the spreadsheet data into a list of product and review objects:
from datetime import datetime
from openpyxl import load_workbook
from classes import Product, Review
from mapping import PRODUCT_ID, PRODUCT_PARENT, PRODUCT_TITLE,
    PRODUCT_CATEGORY, REVIEW_DATE, REVIEW_ID, REVIEW_CUSTOMER,
    REVIEW_STARS, REVIEW_HEADLINE, REVIEW_BODY

# Using the read_only method since you're not gonna be editing the spreadsheet
workbook = load_workbook(filename="sample.xlsx", read_only=True)
sheet = workbook.active

products = []
reviews = []

# Using the values_only because you just want to return the cell value
for row in sheet.iter_rows(min_row=2, values_only=True):
    product = Product(id=row[PRODUCT_ID],
                      parent=row[PRODUCT_PARENT],
                      title=row[PRODUCT_TITLE],
                      category=row[PRODUCT_CATEGORY])
    products.append(product)

    # You need to parse the date from the spreadsheet into a datetime format
    spread_date = row[REVIEW_DATE]
    parsed_date = datetime.strptime(spread_date, "%Y-%m-%d")

    review = Review(id=row[REVIEW_ID],
                    customer_id=row[REVIEW_CUSTOMER],
                    stars=row[REVIEW_STARS],
                    headline=row[REVIEW_HEADLINE],
                    body=row[REVIEW_BODY],
                    date=parsed_date)
    reviews.append(review)

print(products[0])
print(reviews[0])
After you run the code above, you should get some output like this:
Product(id='B00FALQ1ZC', parent=937001370, ...)
Review(id='R3O9SGZBVQBV76', customer_id=3653882, ...)
That’s it! Now you should have the data in a very simple and digestible class format, and you can start thinking of storing this in a Database or any other type of data storage you like.
Using this kind of OOP strategy to parse spreadsheets makes handling the data much simpler later on.
Appending New Data
Before you start creating very complex spreadsheets, have a quick look at an example of how to append data to an existing spreadsheet.
Go back to the first example spreadsheet you created (hello_world.xlsx) and try opening it and appending some data to it, like this:
from openpyxl import load_workbook

# Start by opening the spreadsheet and selecting the main sheet
workbook = load_workbook(filename="hello_world.xlsx")
sheet = workbook.active

# Write what you want into a specific cell
sheet["C1"] = "writing ;)"

# Save the spreadsheet
workbook.save(filename="hello_world_append.xlsx")
Et voilà, if you open the new hello_world_append.xlsx spreadsheet, you’ll see the following change:
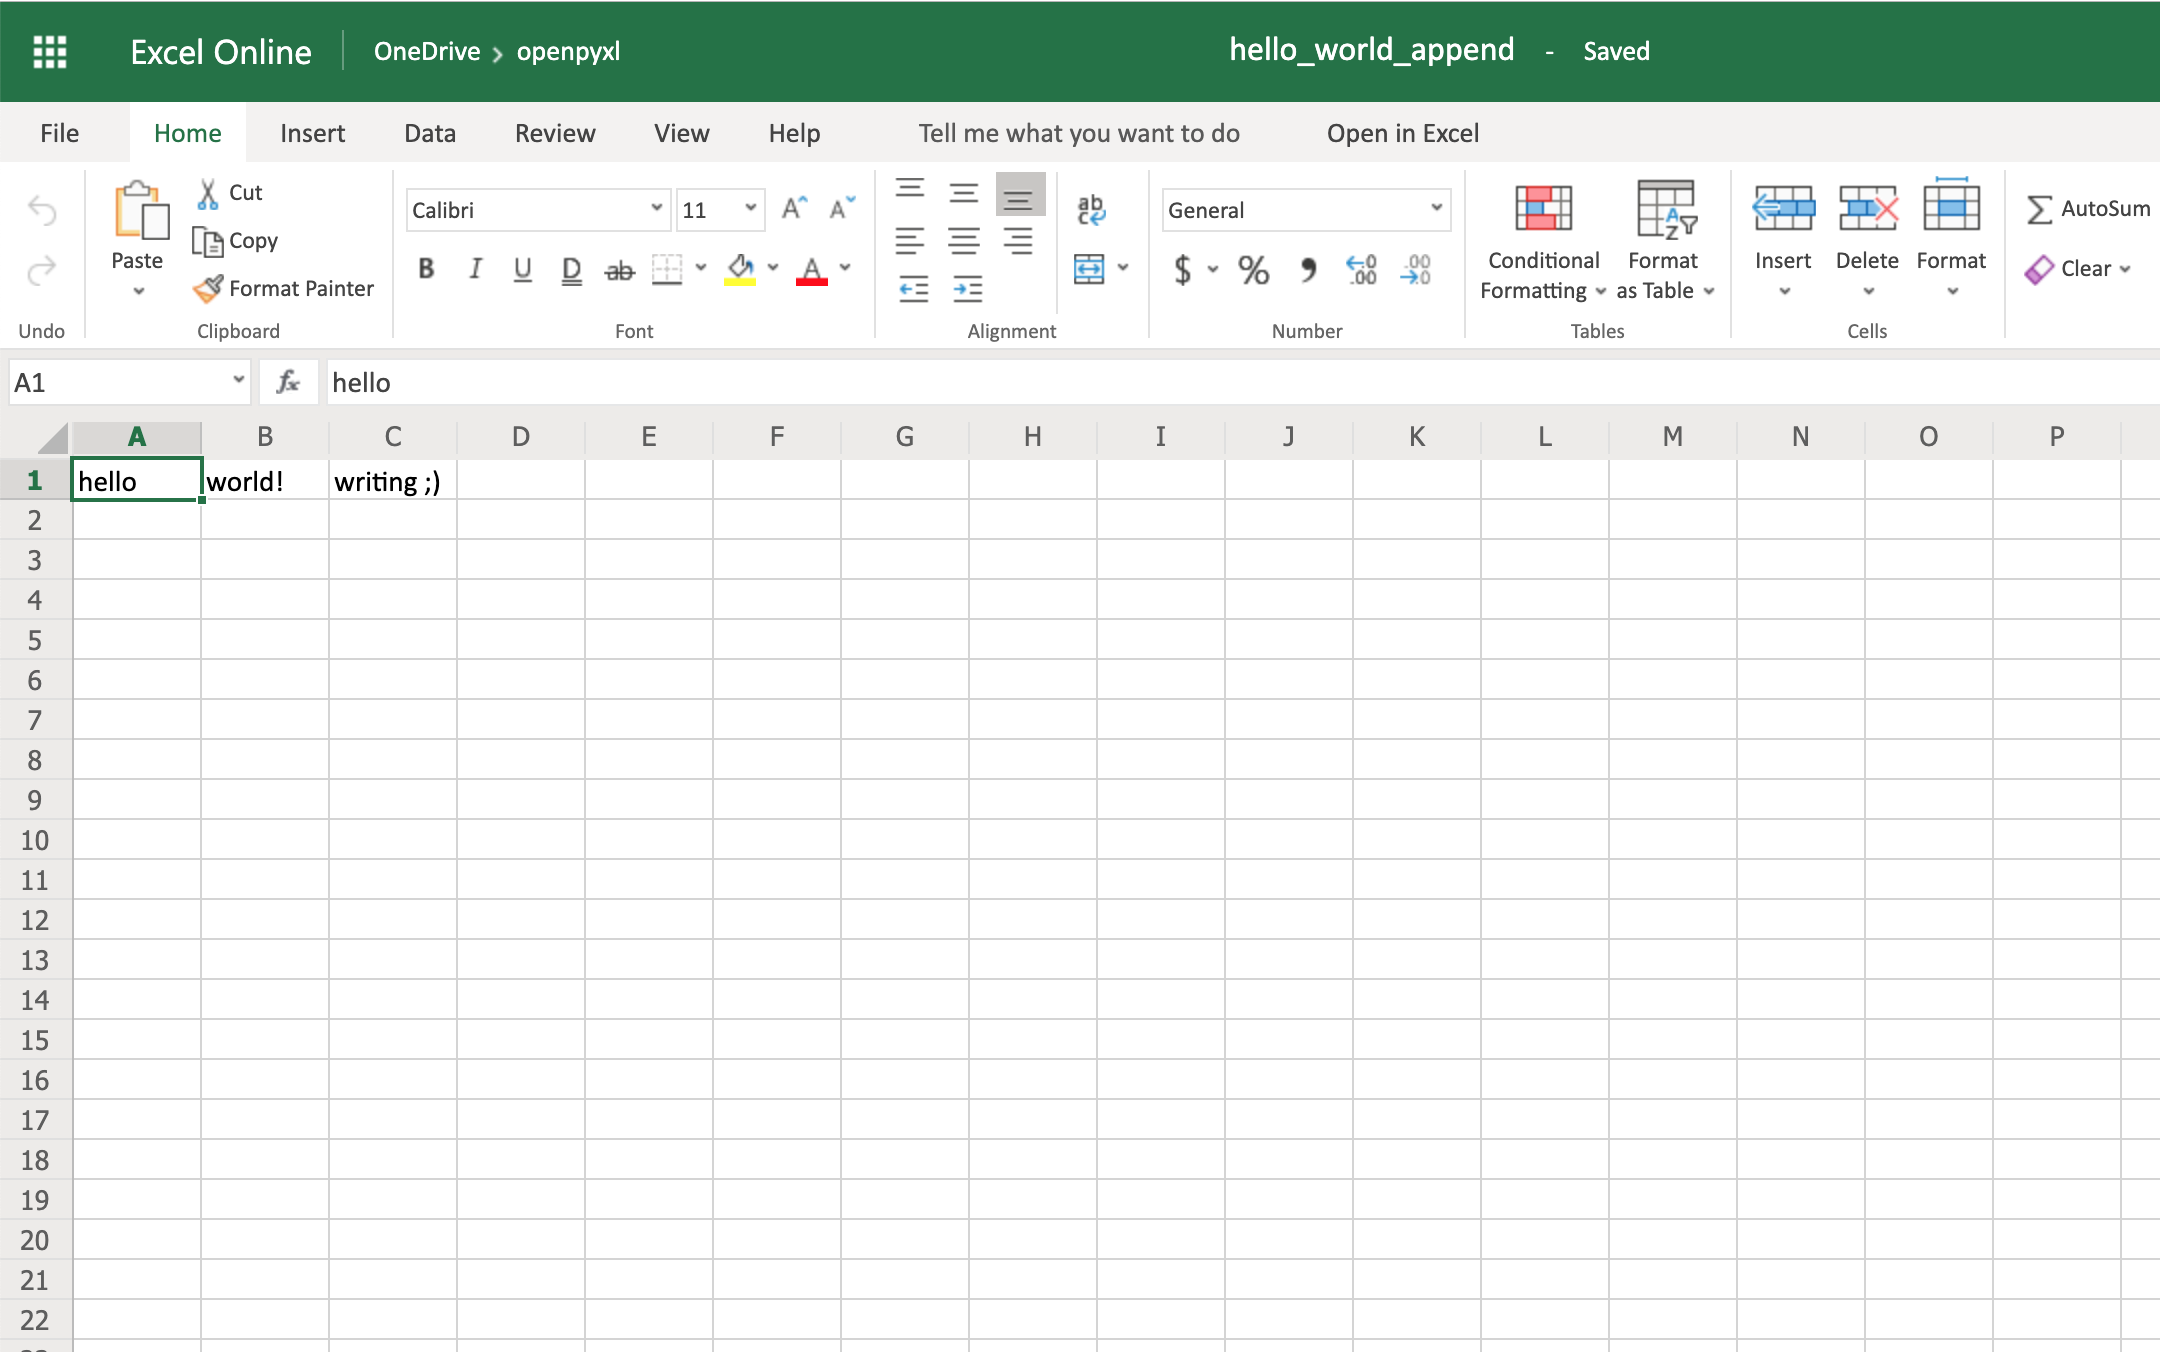
Notice the additional writing  on cell
 C1.
Writing Excel Spreadsheets With openpyxl
There are a lot of different things you can write to a spreadsheet, from simple text or number values to complex formulas, charts, or even images.
Let’s start creating some spreadsheets!
Creating a Simple Spreadsheet
Previously, you saw a very quick example of how to write “Hello world!” into a spreadsheet, so you can start with that:
 1from openpyxl import Workbook
 2
 3filename = "hello_world.xlsx"
 4
 5workbook = Workbook()
 6sheet = workbook.active
 7
 8sheet["A1"] = "hello"
 9sheet["B1"] = "world!"
10
11workbook.save(filename=filename)
The highlighted lines in the code above are the most important ones for writing. In the code, you can see that:
- Line 5 shows you how to create a new empty workbook.
- Lines 8 and 9 show you how to add data to specific cells.
- Line 11 shows you how to save the spreadsheet when you’re done.
Even though these lines above can be straightforward, it’s still good to know them well for when things get a bit more complicated.
One thing you can do to help with coming code examples is add the following method to your Python file or console:
>>>
>>> def print_rows():
...     for row in sheet.iter_rows(values_only=True):
...         print(row)
It makes it easier to print all of your spreadsheet values by just calling print_rows().
Basic Spreadsheet Operations
Before you get into the more advanced topics, it’s good for you to know how to manage the most simple elements of a spreadsheet.
Adding and Updating Cell Values
You already learned how to add values to a spreadsheet like this:
>>>
>>> sheet["A1"] = "value"
There’s another way you can do this, by first selecting a cell and then changing its value:
>>>
>>> cell = sheet["A1"]
>>> cell
<Cell 'Sheet'.A1>

>>> cell.value
'hello'

>>> cell.value = "hey"
>>> cell.value
'hey'
The new value is only stored into the spreadsheet once you call workbook.save().
The openpyxl creates a cell when adding a value, if that cell didn’t exist before:
>>>
>>> # Before, our spreadsheet has only 1 row
>>> print_rows()
('hello', 'world!')

>>> # Try adding a value to row 10
>>> sheet["B10"] = "test"
>>> print_rows()
('hello', 'world!')
(None, None)
(None, None)
(None, None)
(None, None)
(None, None)
(None, None)
(None, None)
(None, None)
(None, 'test')
As you can see, when trying to add a value to cell B10, you end up with a tuple with 10 rows, just so you can have that test value.
Managing Rows and Columns
One of the most common things you have to do when manipulating spreadsheets is adding or removing rows and columns. The openpyxl package allows you to do that in a very straightforward way by using the methods:
.insert_rows().delete_rows().insert_cols().delete_cols()
Every single one of those methods can receive two arguments:
idxamount
Using our basic hello_world.xlsx example again, let’s see how these methods work:
>>>
>>> print_rows()
('hello', 'world!')

>>> # Insert a column before the existing column 1 ("A")
>>> sheet.insert_cols(idx=1)
>>> print_rows()
(None, 'hello', 'world!')

>>> # Insert 5 columns between column 2 ("B") and 3 ("C")
>>> sheet.insert_cols(idx=3, amount=5)
>>> print_rows()
(None, 'hello', None, None, None, None, None, 'world!')

>>> # Delete the created columns
>>> sheet.delete_cols(idx=3, amount=5)
>>> sheet.delete_cols(idx=1)
>>> print_rows()
('hello', 'world!')

>>> # Insert a new row in the beginning
>>> sheet.insert_rows(idx=1)
>>> print_rows()
(None, None)
('hello', 'world!')

>>> # Insert 3 new rows in the beginning
>>> sheet.insert_rows(idx=1, amount=3)
>>> print_rows()
(None, None)
(None, None)
(None, None)
(None, None)
('hello', 'world!')

>>> # Delete the first 4 rows
>>> sheet.delete_rows(idx=1, amount=4)
>>> print_rows()
('hello', 'world!')
The only thing you need to remember is that when inserting new data (rows or columns), the insertion happens before the idx parameter.
So, if you do insert_rows(1), it inserts a new row before the existing first row.
It’s the same for columns: when you call insert_cols(2), it inserts a new column right before the already existing second column (B).
However, when deleting rows or columns, .delete_... deletes data starting from the index passed as an argument.
For example, when doing delete_rows(2) it deletes row 2, and when doing delete_cols(3) it deletes the third column (C).
Managing Sheets
Sheet management is also one of those things you might need to know, even though it might be something that you don’t use that often.
If you look back at the code examples from this tutorial, you’ll notice the following recurring piece of code:
This is the way to select the default sheet from a spreadsheet. However, if you’re opening a spreadsheet with multiple sheets, then you can always select a specific one like this:
>>>
>>> # Let's say you have two sheets: "Products" and "Company Sales"
>>> workbook.sheetnames
['Products', 'Company Sales']

>>> # You can select a sheet using its title
>>> products_sheet = workbook["Products"]
>>> sales_sheet = workbook["Company Sales"]
You can also change a sheet title very easily:
>>>
>>> workbook.sheetnames
['Products', 'Company Sales']

>>> products_sheet = workbook["Products"]
>>> products_sheet.title = "New Products"

>>> workbook.sheetnames
['New Products', 'Company Sales']
If you want to create or delete sheets, then you can also do that with .create_sheet() and .remove():
>>>
>>> workbook.sheetnames
['Products', 'Company Sales']

>>> operations_sheet = workbook.create_sheet("Operations")
>>> workbook.sheetnames
['Products', 'Company Sales', 'Operations']

>>> # You can also define the position to create the sheet at
>>> hr_sheet = workbook.create_sheet("HR", 0)
>>> workbook.sheetnames
['HR', 'Products', 'Company Sales', 'Operations']

>>> # To remove them, just pass the sheet as an argument to the .remove()
>>> workbook.remove(operations_sheet)
>>> workbook.sheetnames
['HR', 'Products', 'Company Sales']

>>> workbook.remove(hr_sheet)
>>> workbook.sheetnames
['Products', 'Company Sales']
One other thing you can do is make duplicates of a sheet using copy_worksheet():
>>>
>>> workbook.sheetnames
['Products', 'Company Sales']

>>> products_sheet = workbook["Products"]
>>> workbook.copy_worksheet(products_sheet)
<Worksheet "Products Copy">

>>> workbook.sheetnames
['Products', 'Company Sales', 'Products Copy']
If you open your spreadsheet after saving the above code, you’ll notice that the sheet Products Copy is a duplicate of the sheet Products.
Freezing Rows and Columns
Something that you might want to do when working with big spreadsheets is to freeze a few rows or columns, so they remain visible when you scroll right or down.
Freezing data allows you to keep an eye on important rows or columns, regardless of where you scroll in the spreadsheet.
Again, openpyxl also has a way to accomplish this by using the worksheet freeze_panes attribute. For this example, go back to our sample.xlsx spreadsheet and try doing the following:
>>>
>>> workbook = load_workbook(filename="sample.xlsx")
>>> sheet = workbook.active
>>> sheet.freeze_panes = "C2"
>>> workbook.save("sample_frozen.xlsx")
If you open the sample_frozen.xlsx spreadsheet in your favorite spreadsheet editor, you’ll notice that row 1 and columns A and B are frozen and are always visible no matter where you navigate within the spreadsheet.
This feature is handy, for example, to keep headers within sight, so you always know what each column represents.
Here’s how it looks in the editor:
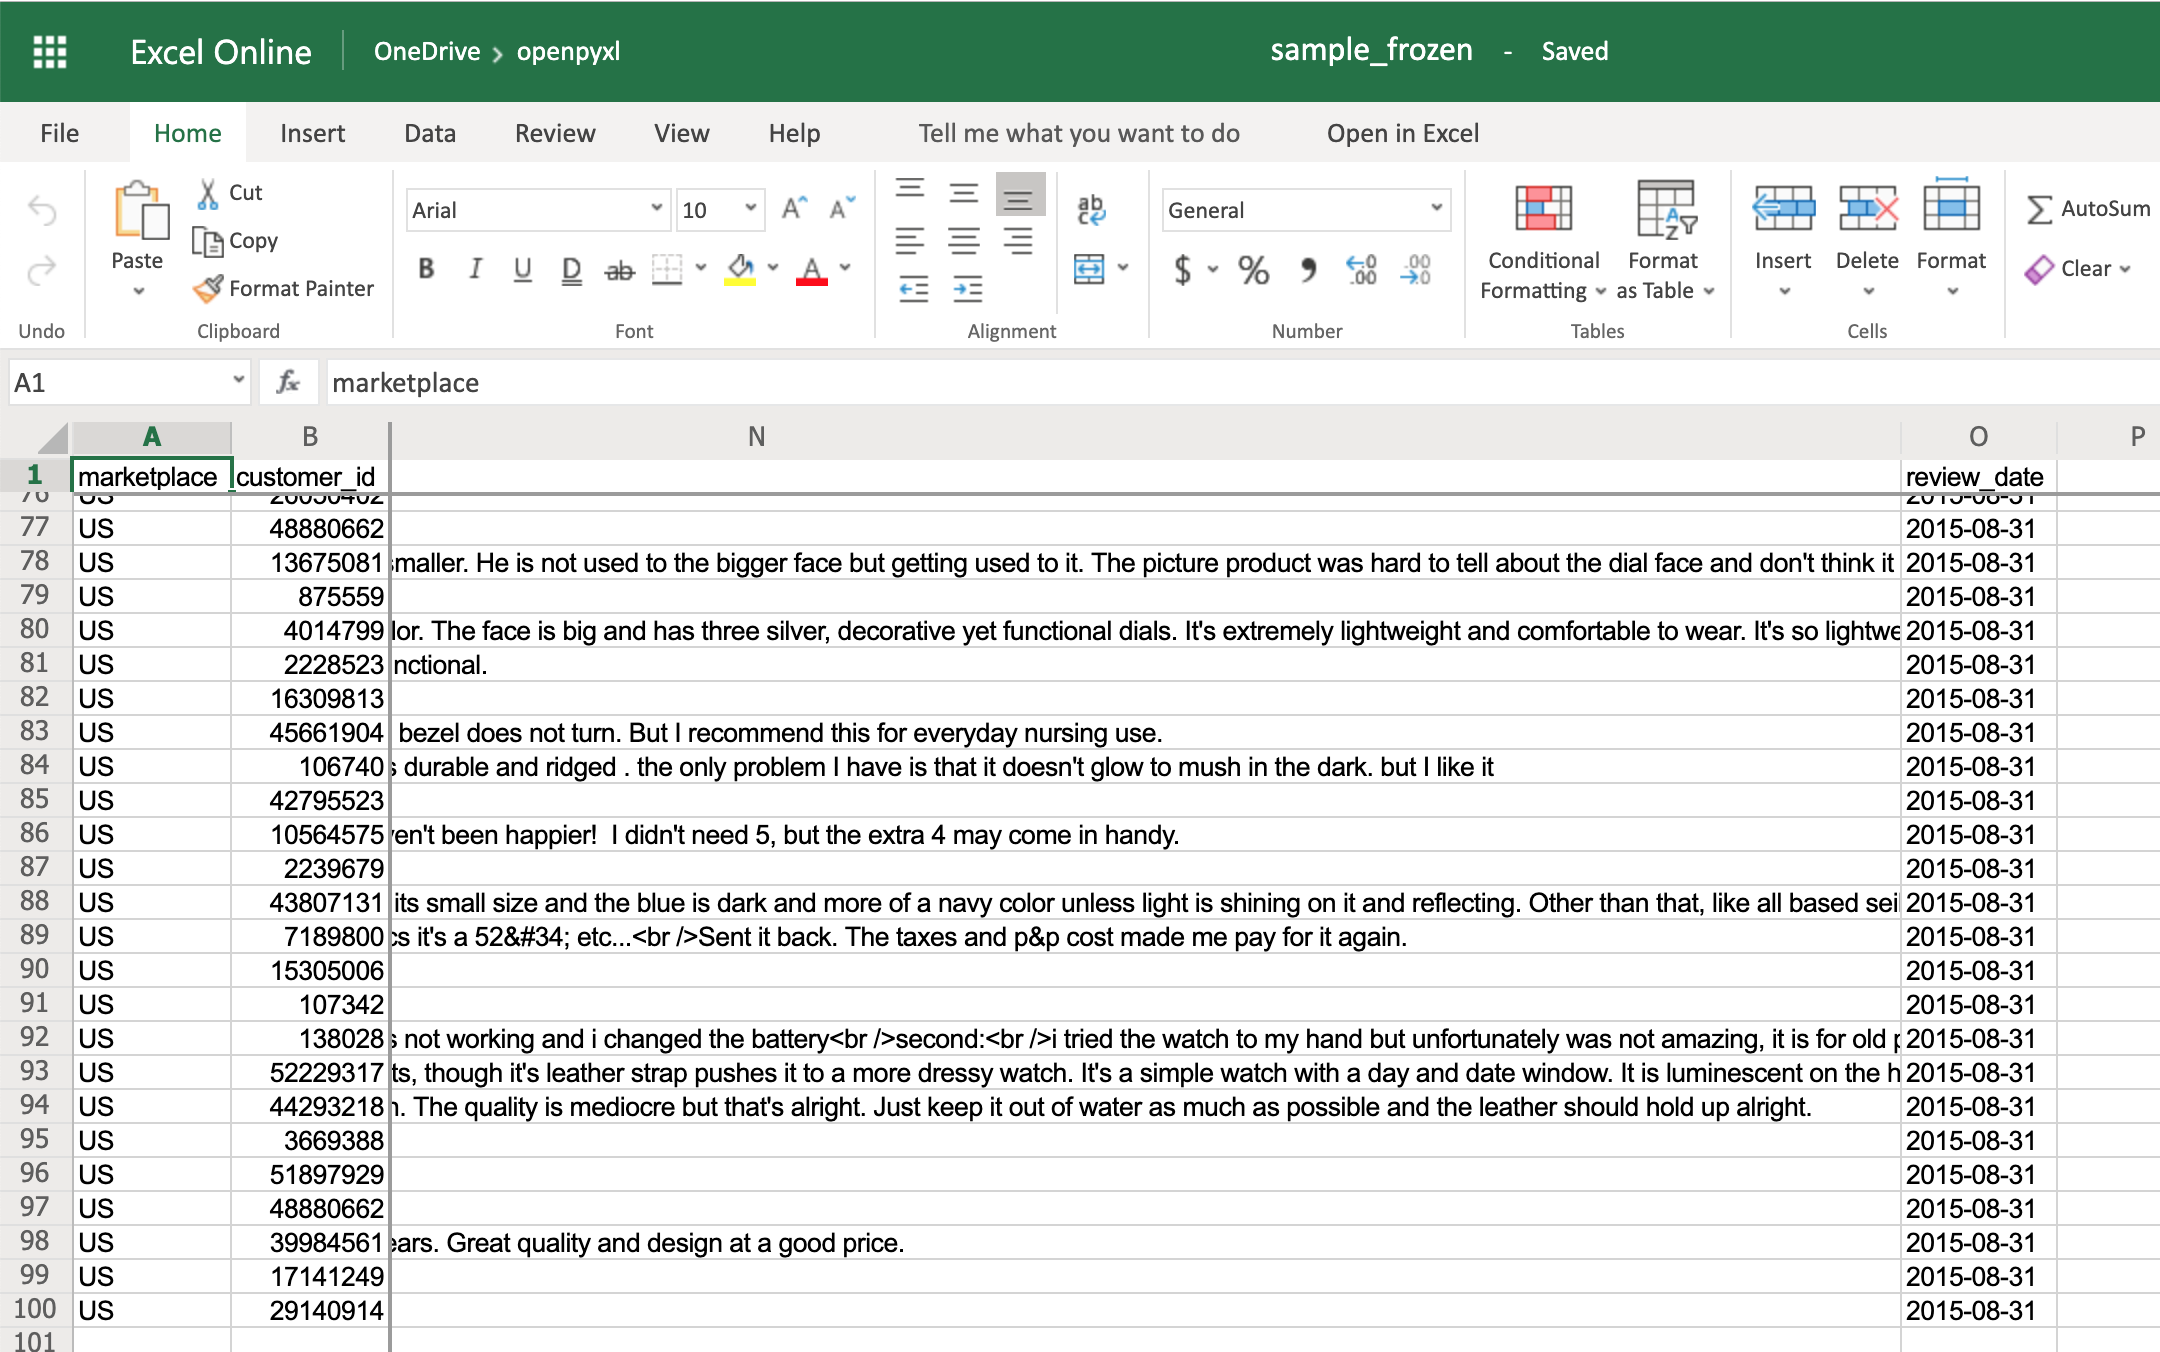
Notice how you’re at the end of the spreadsheet, and yet, you can see both row 1 and columns A and B.
Adding Filters
You can use openpyxl to add filters and sorts to your spreadsheet. However, when you open the spreadsheet, the data won’t be rearranged according to these sorts and filters.
At first, this might seem like a pretty useless feature, but when you’re programmatically creating a spreadsheet that is going to be sent and used by somebody else, it’s still nice to at least create the filters and allow people to use it afterward.
The code below is an example of how you would add some filters to our existing sample.xlsx spreadsheet:
>>>
>>> # Check the used spreadsheet space using the attribute "dimensions"
>>> sheet.dimensions
'A1:O100'
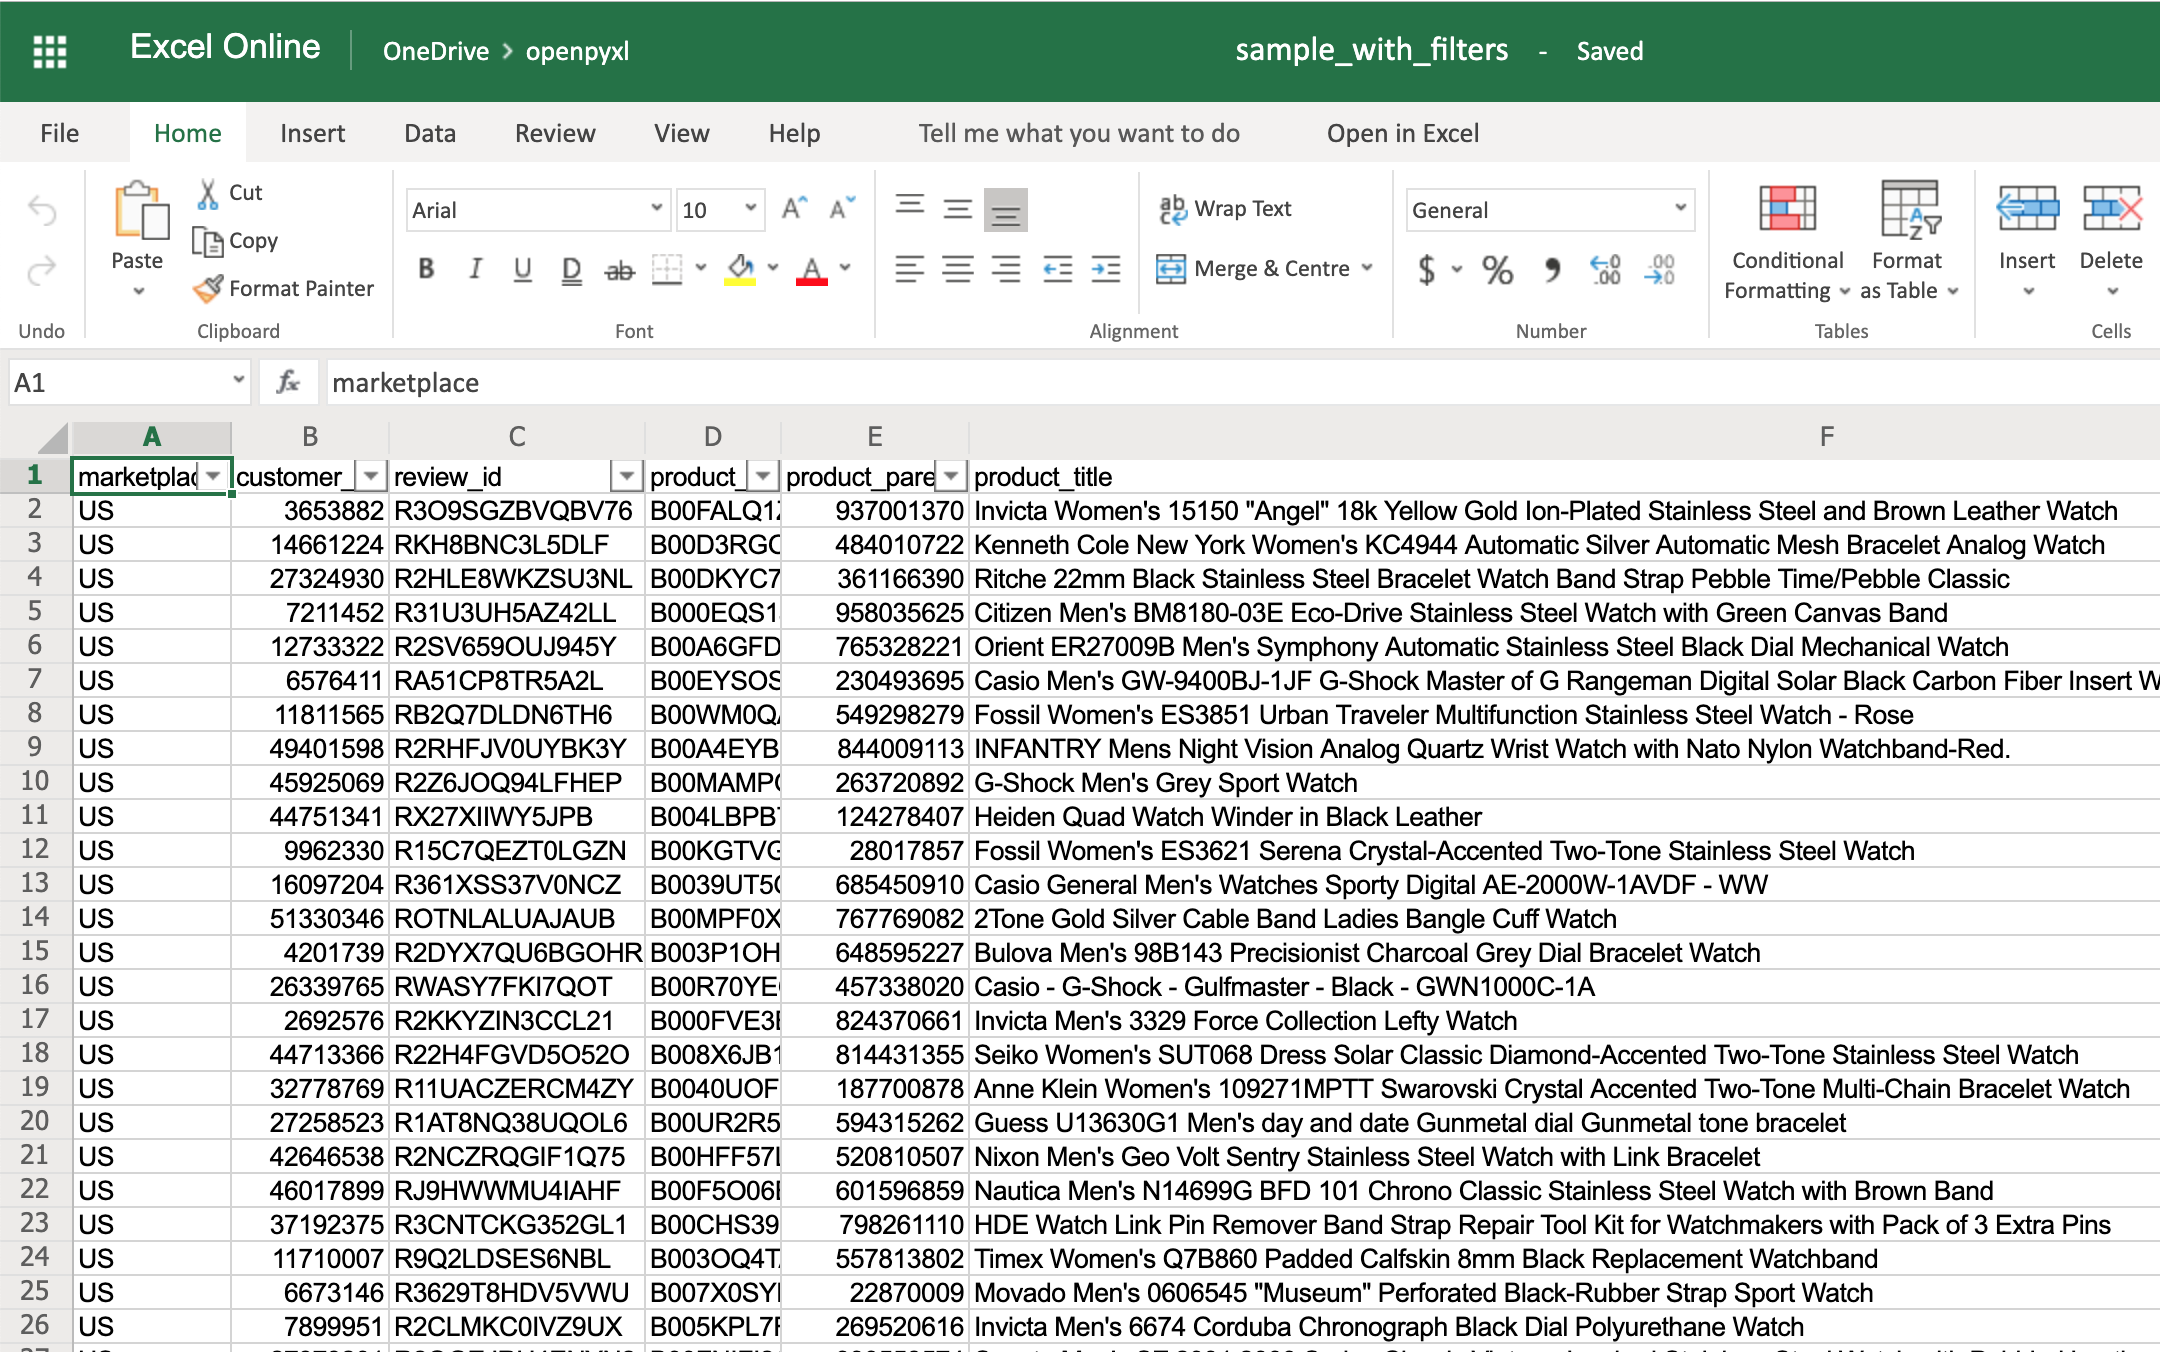
>>> sheet.auto_filter.ref = "A1:O100"
>>> workbook.save(filename="sample_with_filters.xlsx")
You should now see the filters created when opening the spreadsheet in your editor:
You don’t have to use sheet.dimensions if you know precisely which part of the spreadsheet you want to apply filters to.
Adding Formulas
Formulas (or formulae) are one of the most powerful features of spreadsheets.
They gives you the power to apply specific mathematical equations to a range of cells. Using formulas with openpyxl is as simple as editing the value of a cell.
You can see the list of formulas supported by openpyxl:
>>>
>>> from openpyxl.utils import FORMULAE
>>> FORMULAE
frozenset({'ABS',
           'ACCRINT',
           'ACCRINTM',
           'ACOS',
           'ACOSH',
           'AMORDEGRC',
           'AMORLINC',
           'AND',
           ...
           'YEARFRAC',
           'YIELD',
           'YIELDDISC',
           'YIELDMAT',
           'ZTEST'})
Let’s add some formulas to our sample.xlsx spreadsheet.
Starting with something easy, let’s check the average star rating for the 99 reviews within the spreadsheet:
>>>
>>> # Star rating is column "H"
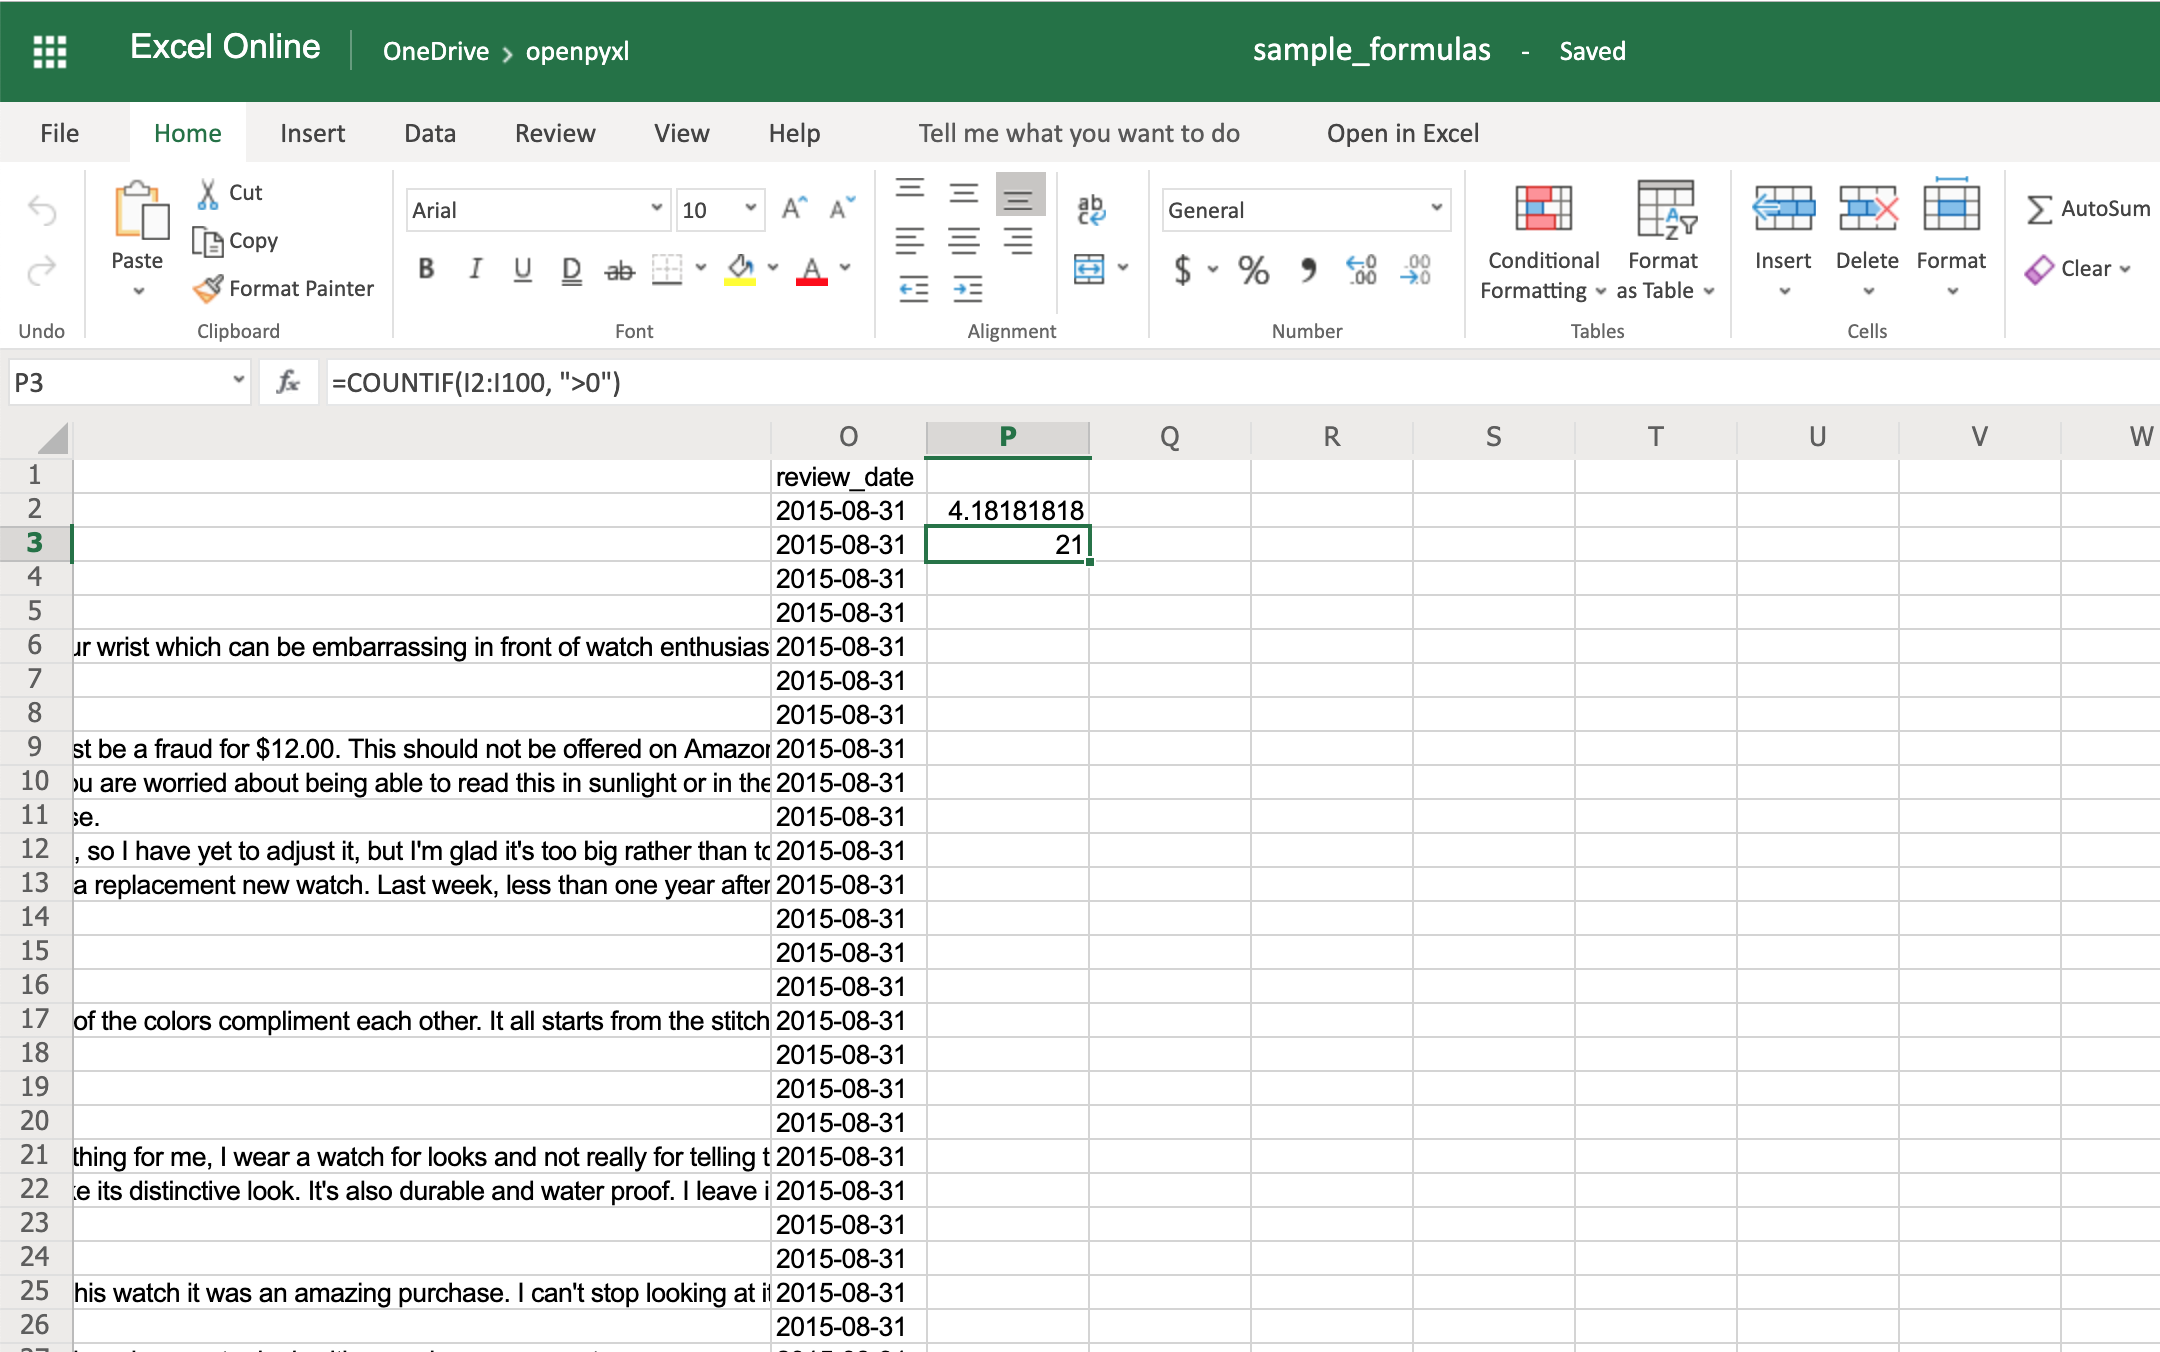
>>> sheet["P2"] = "=AVERAGE(H2:H100)"
>>> workbook.save(filename="sample_formulas.xlsx")
If you open the spreadsheet now and go to cell P2, you should see that its value is: 4.18181818181818. Have a look in the editor:

You can use the same methodology to add any formulas to your spreadsheet. For example, let’s count the number of reviews that had helpful votes:
>>>
>>> # The helpful votes are counted on column "I"
>>> sheet["P3"] = '=COUNTIF(I2:I100, ">0")'
>>> workbook.save(filename="sample_formulas.xlsx")
You should get the number 21 on your P3 spreadsheet cell like so:
You’ll have to make sure that the strings within a formula are always in double quotes, so you either have to use single quotes around the formula like in the example above or you’ll have to escape the double quotes inside the formula: "=COUNTIF(I2:I100, ">0")".
There are a ton of other formulas you can add to your spreadsheet using the same procedure you tried above. Give it a go yourself!
Adding Styles
Even though styling a spreadsheet might not be something you would do every day, it’s still good to know how to do it.
Using openpyxl, you can apply multiple styling options to your spreadsheet, including fonts, borders, colors, and so on. Have a look at the openpyxl documentation to learn more.
You can also choose to either apply a style directly to a cell or create a template and reuse it to apply styles to multiple cells.
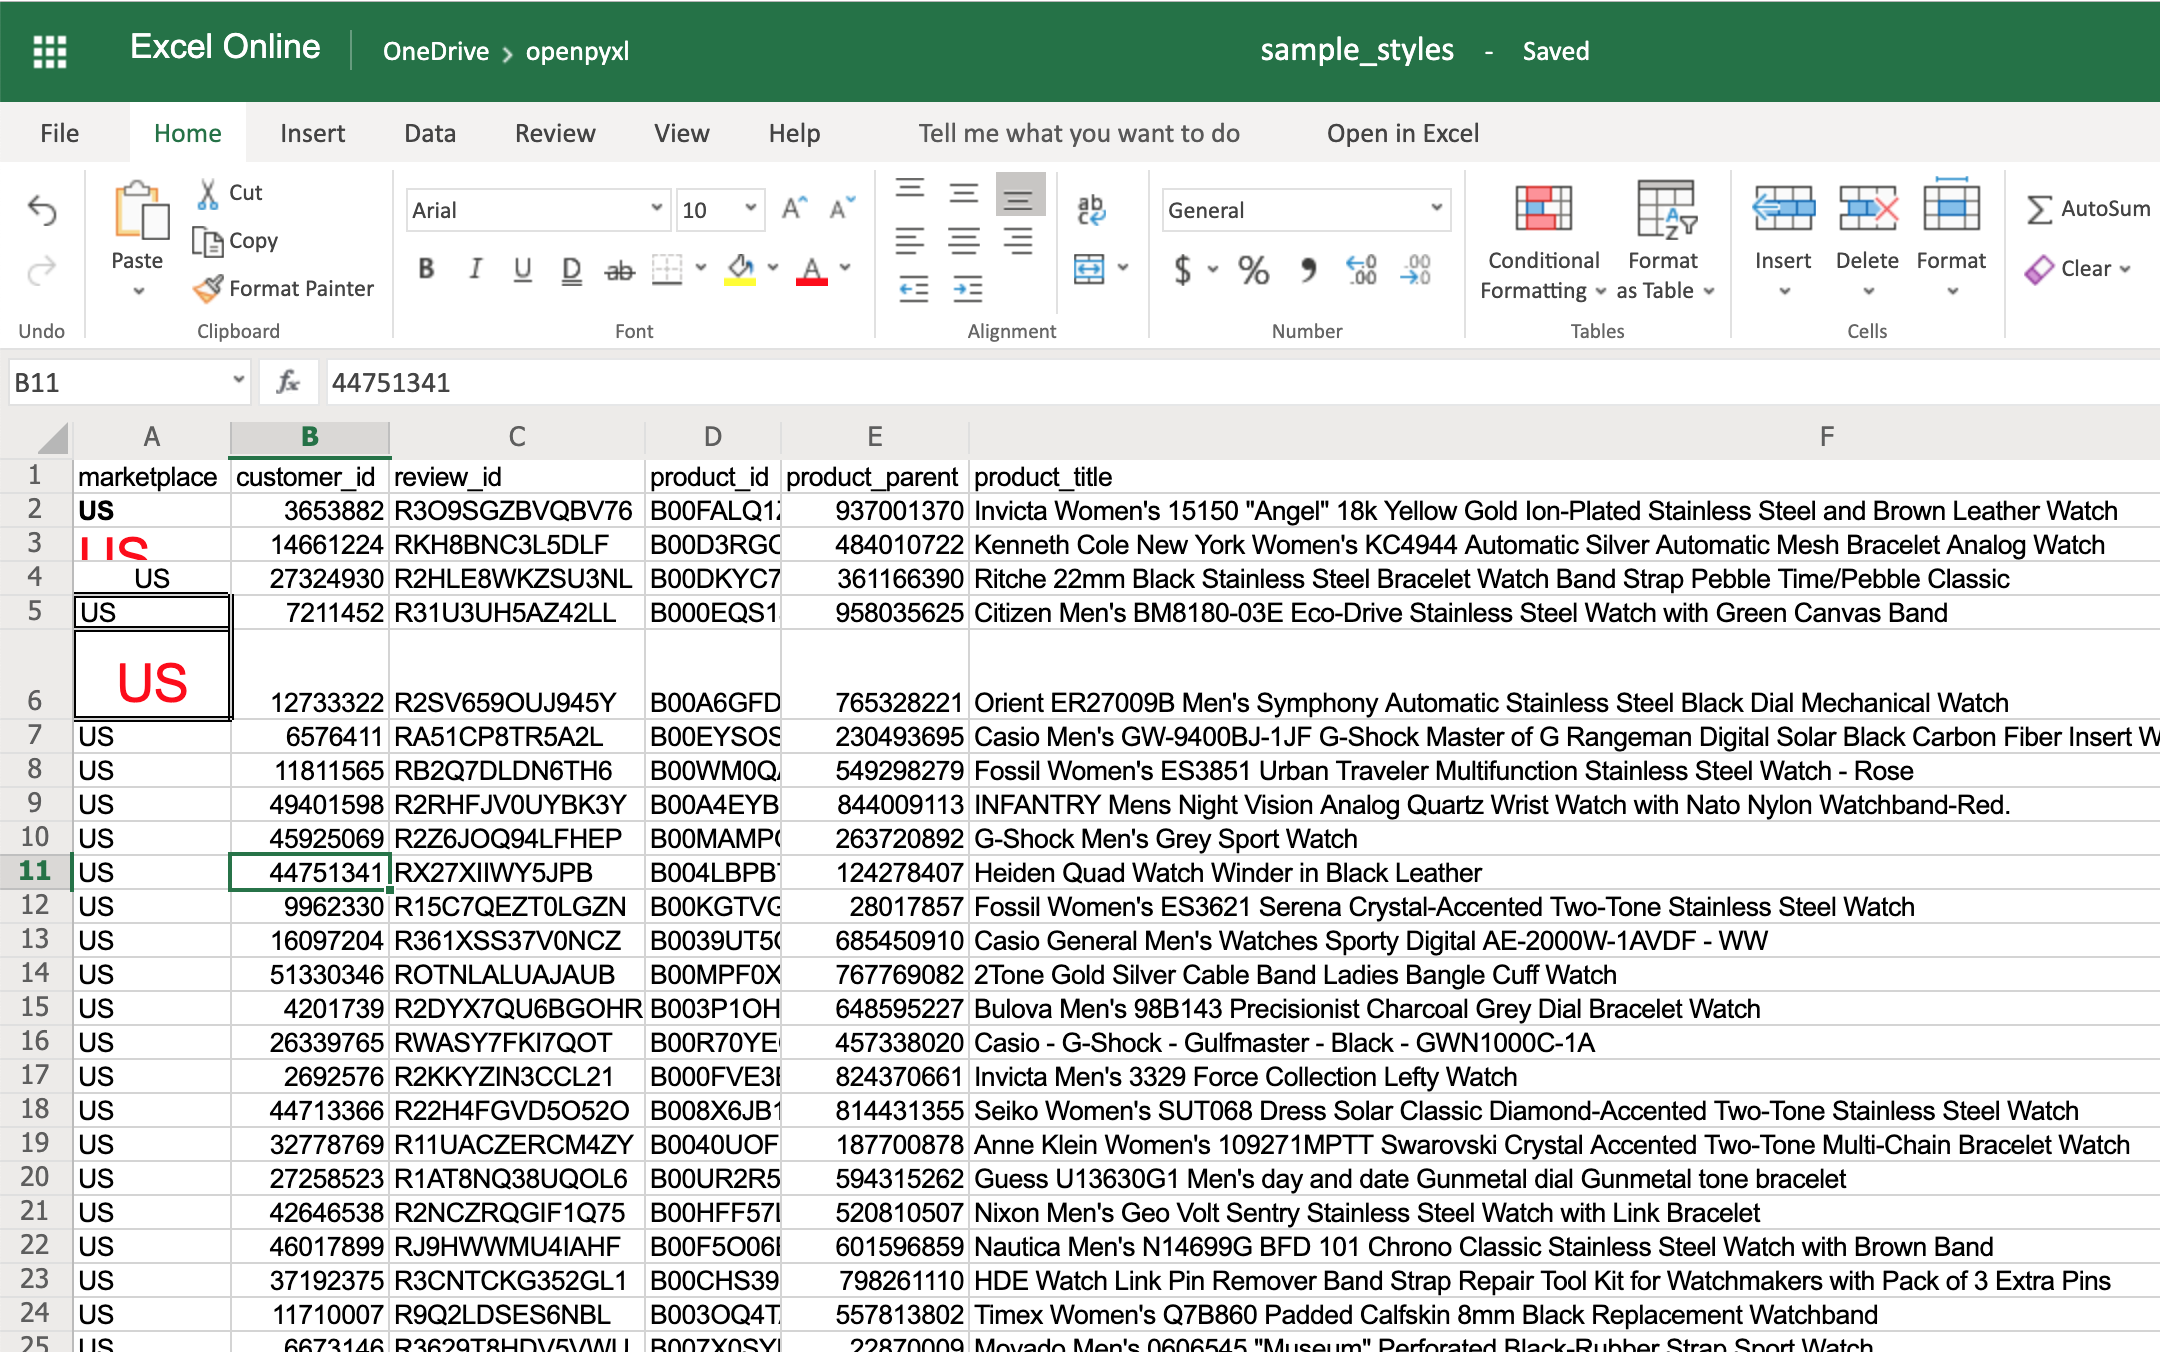
Let’s start by having a look at simple cell styling, using our sample.xlsx again as the base spreadsheet:
>>>
>>> # Import necessary style classes
>>> from openpyxl.styles import Font, Color, Alignment, Border, Side

>>> # Create a few styles
>>> bold_font = Font(bold=True)
>>> big_red_text = Font(color="00FF0000", size=20)
>>> center_aligned_text = Alignment(horizontal="center")
>>> double_border_side = Side(border_style="double")
>>> square_border = Border(top=double_border_side,
...                        right=double_border_side,
...                        bottom=double_border_side,
...                        left=double_border_side)

>>> # Style some cells!
>>> sheet["A2"].font = bold_font
>>> sheet["A3"].font = big_red_text
>>> sheet["A4"].alignment = center_aligned_text
>>> sheet["A5"].border = square_border
>>> workbook.save(filename="sample_styles.xlsx")
If you open your spreadsheet now, you should see quite a few different styles on the first 5 cells of column A:
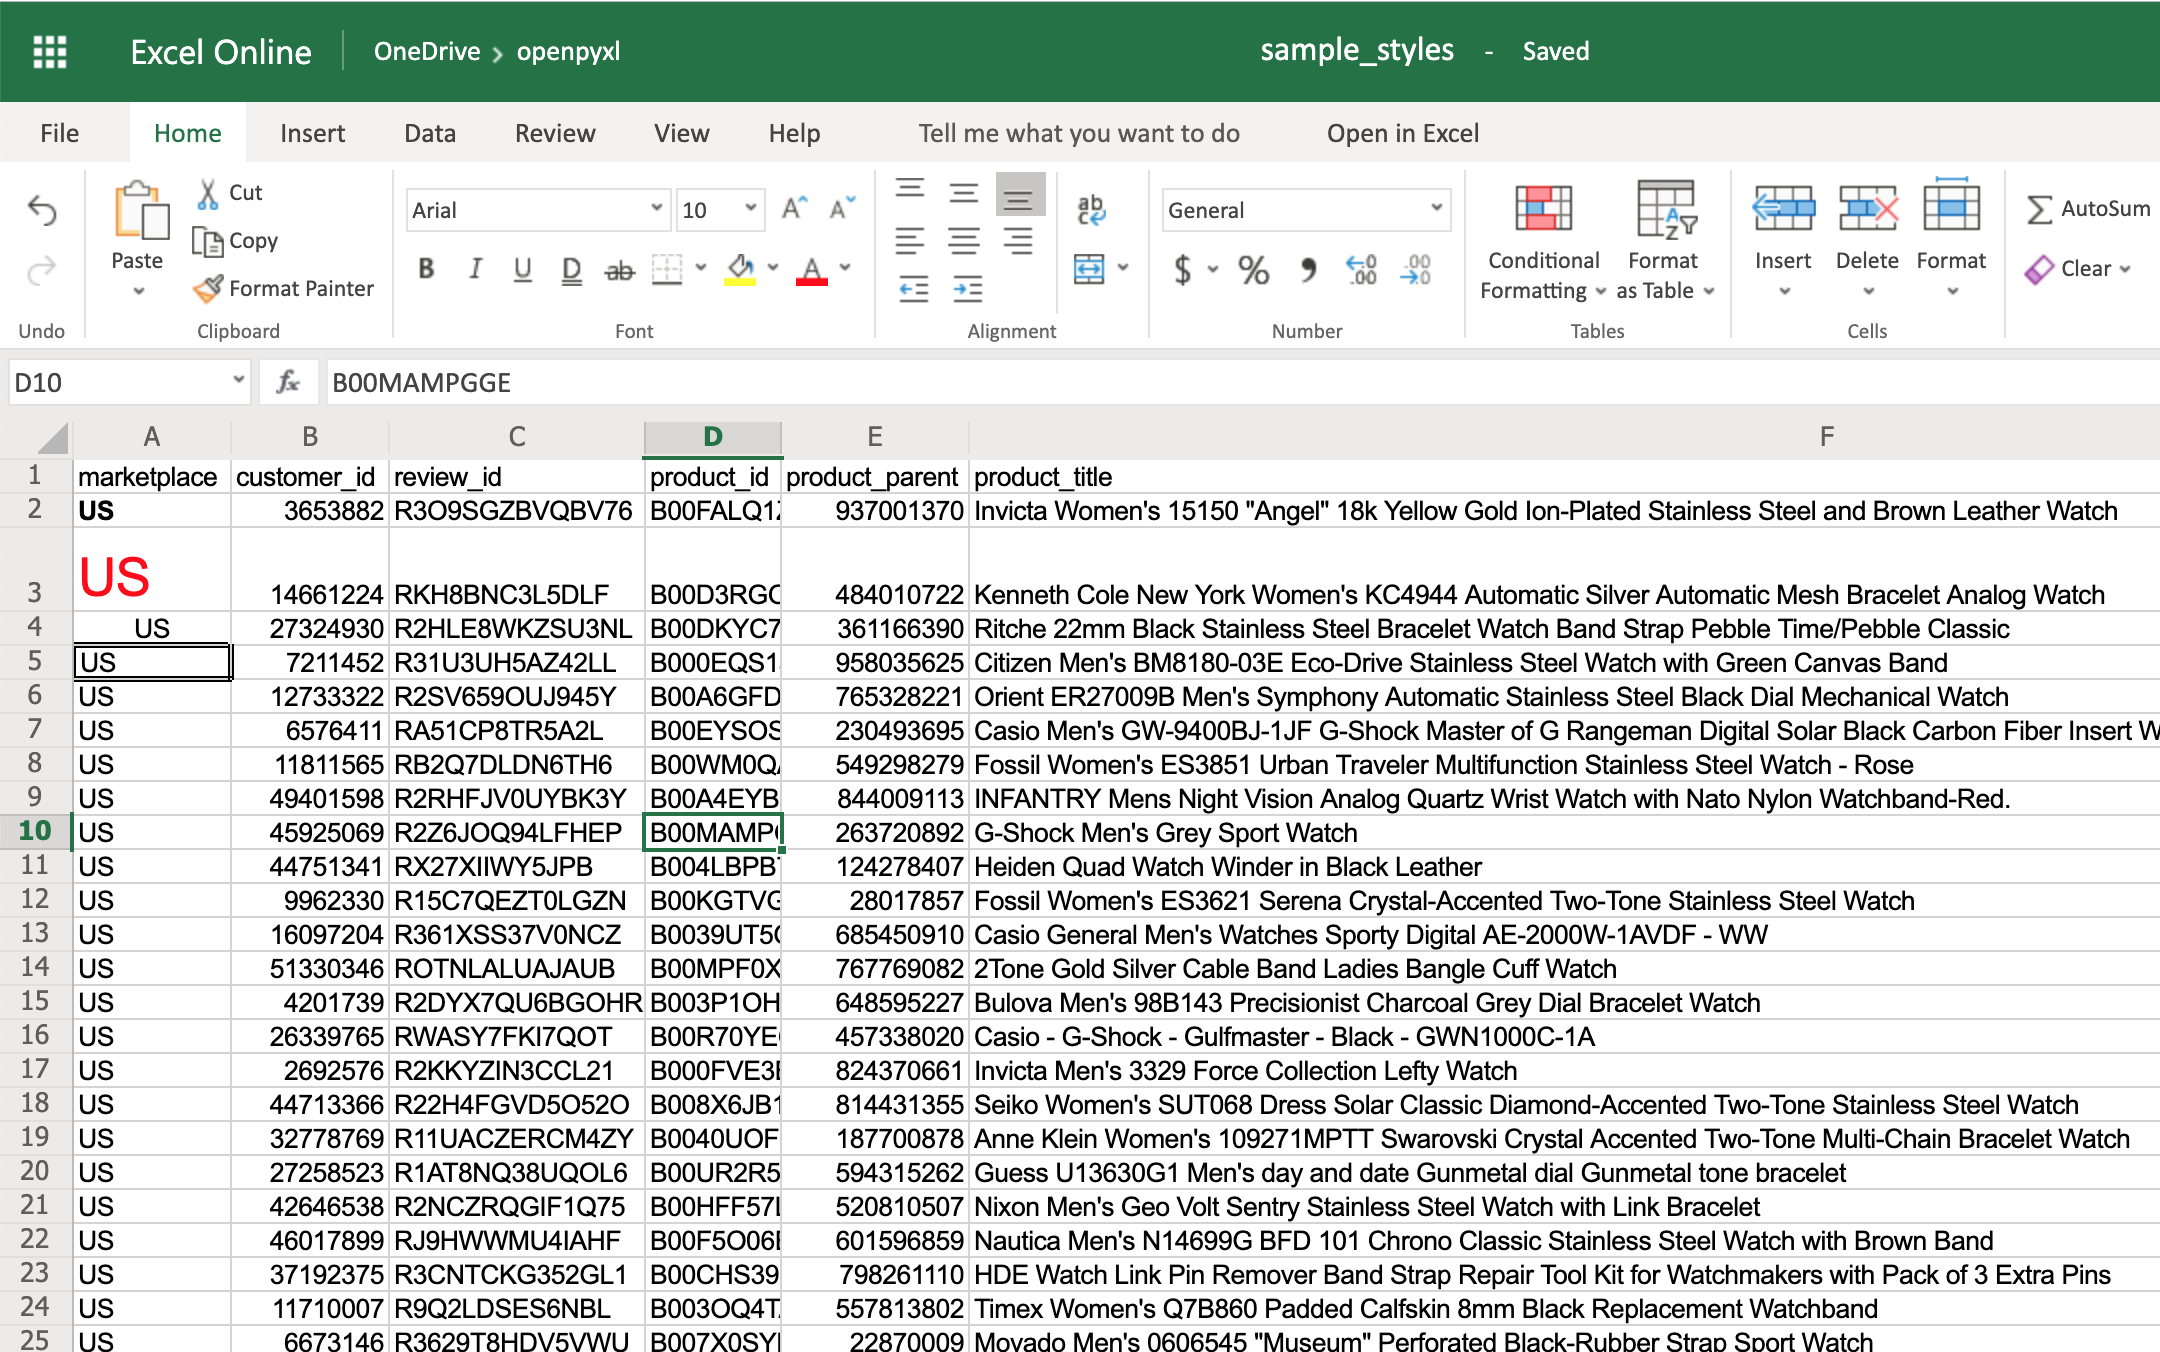
There you go. You got:
- A2 with the text in bold
- A3 with the text in red and bigger font size
- A4 with the text centered
- A5 with a square border around the text
You can also combine styles by simply adding them to the cell at the same time:
>>>
>>> # Reusing the same styles from the example above
>>> sheet["A6"].alignment = center_aligned_text
>>> sheet["A6"].font = big_red_text
>>> sheet["A6"].border = square_border
>>> workbook.save(filename="sample_styles.xlsx")
Have a look at cell A6 here:
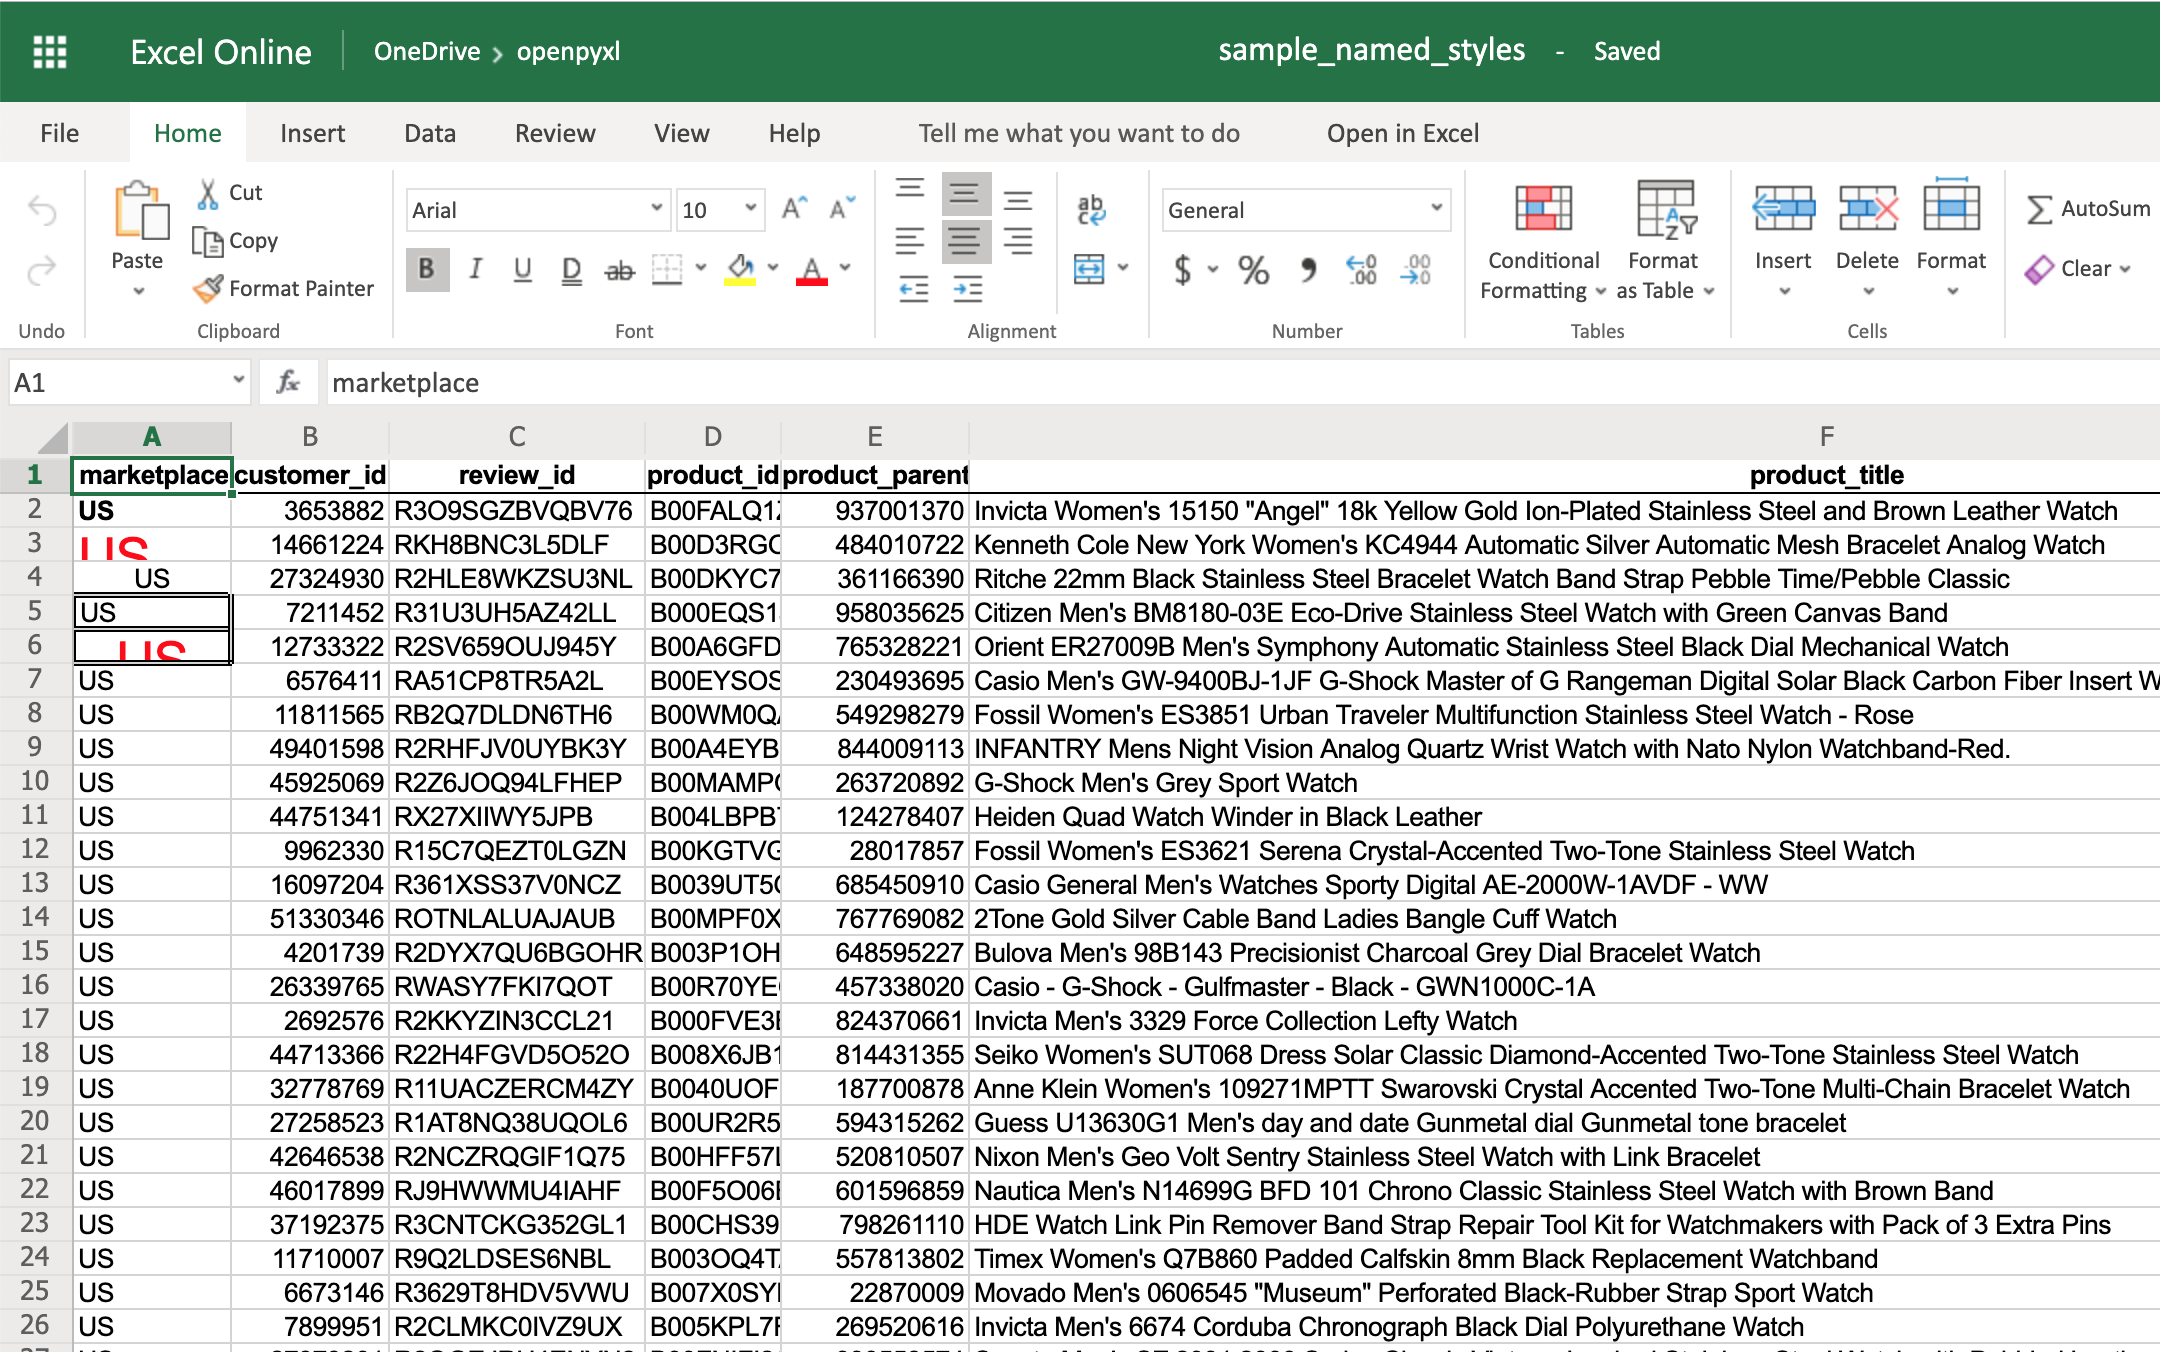
When you want to apply multiple styles to one or several cells, you can use a NamedStyle class instead, which is like a style template that you can use over and over again. Have a look at the example below:
>>>
>>> from openpyxl.styles import NamedStyle

>>> # Let's create a style template for the header row
>>> header = NamedStyle(name="header")
>>> header.font = Font(bold=True)
>>> header.border = Border(bottom=Side(border_style="thin"))
>>> header.alignment = Alignment(horizontal="center", vertical="center")

>>> # Now let's apply this to all first row (header) cells
>>> header_row = sheet[1]
>>> for cell in header_row:
...     cell.style = header

>>> workbook.save(filename="sample_styles.xlsx")
If you open the spreadsheet now, you should see that its first row is bold, the text is aligned to the center, and there’s a small bottom border! Have a look below:
As you saw above, there are many options when it comes to styling, and it depends on the use case, so feel free to check openpyxl documentation and see what other things you can do.
Conditional Formatting
This feature is one of my personal favorites when it comes to adding styles to a spreadsheet.
It’s a much more powerful approach to styling because it dynamically applies styles according to how the data in the spreadsheet changes.
In a nutshell, conditional formatting allows you to specify a list of styles to apply to a cell (or cell range) according to specific conditions.
For example, a widespread use case is to have a balance sheet where all the negative totals are in red, and the positive ones are in green. This formatting makes it much more efficient to spot good vs bad periods.
Without further ado, let’s pick our favorite spreadsheet—sample.xlsx—and add some conditional formatting.
You can start by adding a simple one that adds a red background to all reviews with less than 3 stars:
>>>
>>> from openpyxl.styles import PatternFill
>>> from openpyxl.styles.differential import DifferentialStyle
>>> from openpyxl.formatting.rule import Rule

>>> red_background = PatternFill(fgColor="00FF0000")
>>> diff_style = DifferentialStyle(fill=red_background)
>>> rule = Rule(type="expression", dxf=diff_style)
>>> rule.formula = ["$H1<3"]
>>> sheet.conditional_formatting.add("A1:O100", rule)
>>> workbook.save("sample_conditional_formatting.xlsx")
Now you’ll see all the reviews with a star rating below 3 marked with a red background:

Code-wise, the only things that are new here are the objects DifferentialStyle and Rule:
DifferentialStyleis quite similar toNamedStyle, which you already saw above, and it’s used to aggregate multiple styles such as fonts, borders, alignment, and so forth.Ruleis responsible for selecting the cells and applying the styles if the cells match the rule’s logic.
Using a Rule object, you can create numerous conditional formatting scenarios.
However, for simplicity sake, the openpyxl package offers 3 built-in formats that make it easier to create a few common conditional formatting patterns. These built-ins are:
ColorScaleIconSetDataBar
The ColorScale gives you the ability to create color gradients:
>>>
>>> from openpyxl.formatting.rule import ColorScaleRule
>>> color_scale_rule = ColorScaleRule(start_type="min",
...                                   start_color="00FF0000",  # Red
...                                   end_type="max",
...                                   end_color="0000FF00")  # Green

>>> # Again, let's add this gradient to the star ratings, column "H"
>>> sheet.conditional_formatting.add("H2:H100", color_scale_rule)
>>> workbook.save(filename="sample_conditional_formatting_color_scale.xlsx")
Now you should see a color gradient on column H, from red to green, according to the star rating:

You can also add a third color and make two gradients instead:
>>>
>>> from openpyxl.formatting.rule import ColorScaleRule
>>> color_scale_rule = ColorScaleRule(start_type="num",
...                                   start_value=1,
...                                   start_color="00FF0000",  # Red
...                                   mid_type="num",
...                                   mid_value=3,
...                                   mid_color="00FFFF00",  # Yellow
...                                   end_type="num",
...                                   end_value=5,
...                                   end_color="0000FF00")  # Green

>>> # Again, let's add this gradient to the star ratings, column "H"
>>> sheet.conditional_formatting.add("H2:H100", color_scale_rule)
>>> workbook.save(filename="sample_conditional_formatting_color_scale_3.xlsx")
This time, you’ll notice that star ratings between 1 and 3 have a gradient from red to yellow, and star ratings between 3 and 5 have a gradient from yellow to green:

The IconSet allows you to add an icon to the cell according to its value:
>>>
>>> from openpyxl.formatting.rule import IconSetRule

>>> icon_set_rule = IconSetRule("5Arrows", "num", [1, 2, 3, 4, 5])
>>> sheet.conditional_formatting.add("H2:H100", icon_set_rule)
>>> workbook.save("sample_conditional_formatting_icon_set.xlsx")
You’ll see a colored arrow next to the star rating. This arrow is red and points down when the value of the cell is 1 and, as the rating gets better, the arrow starts pointing up and becomes green:
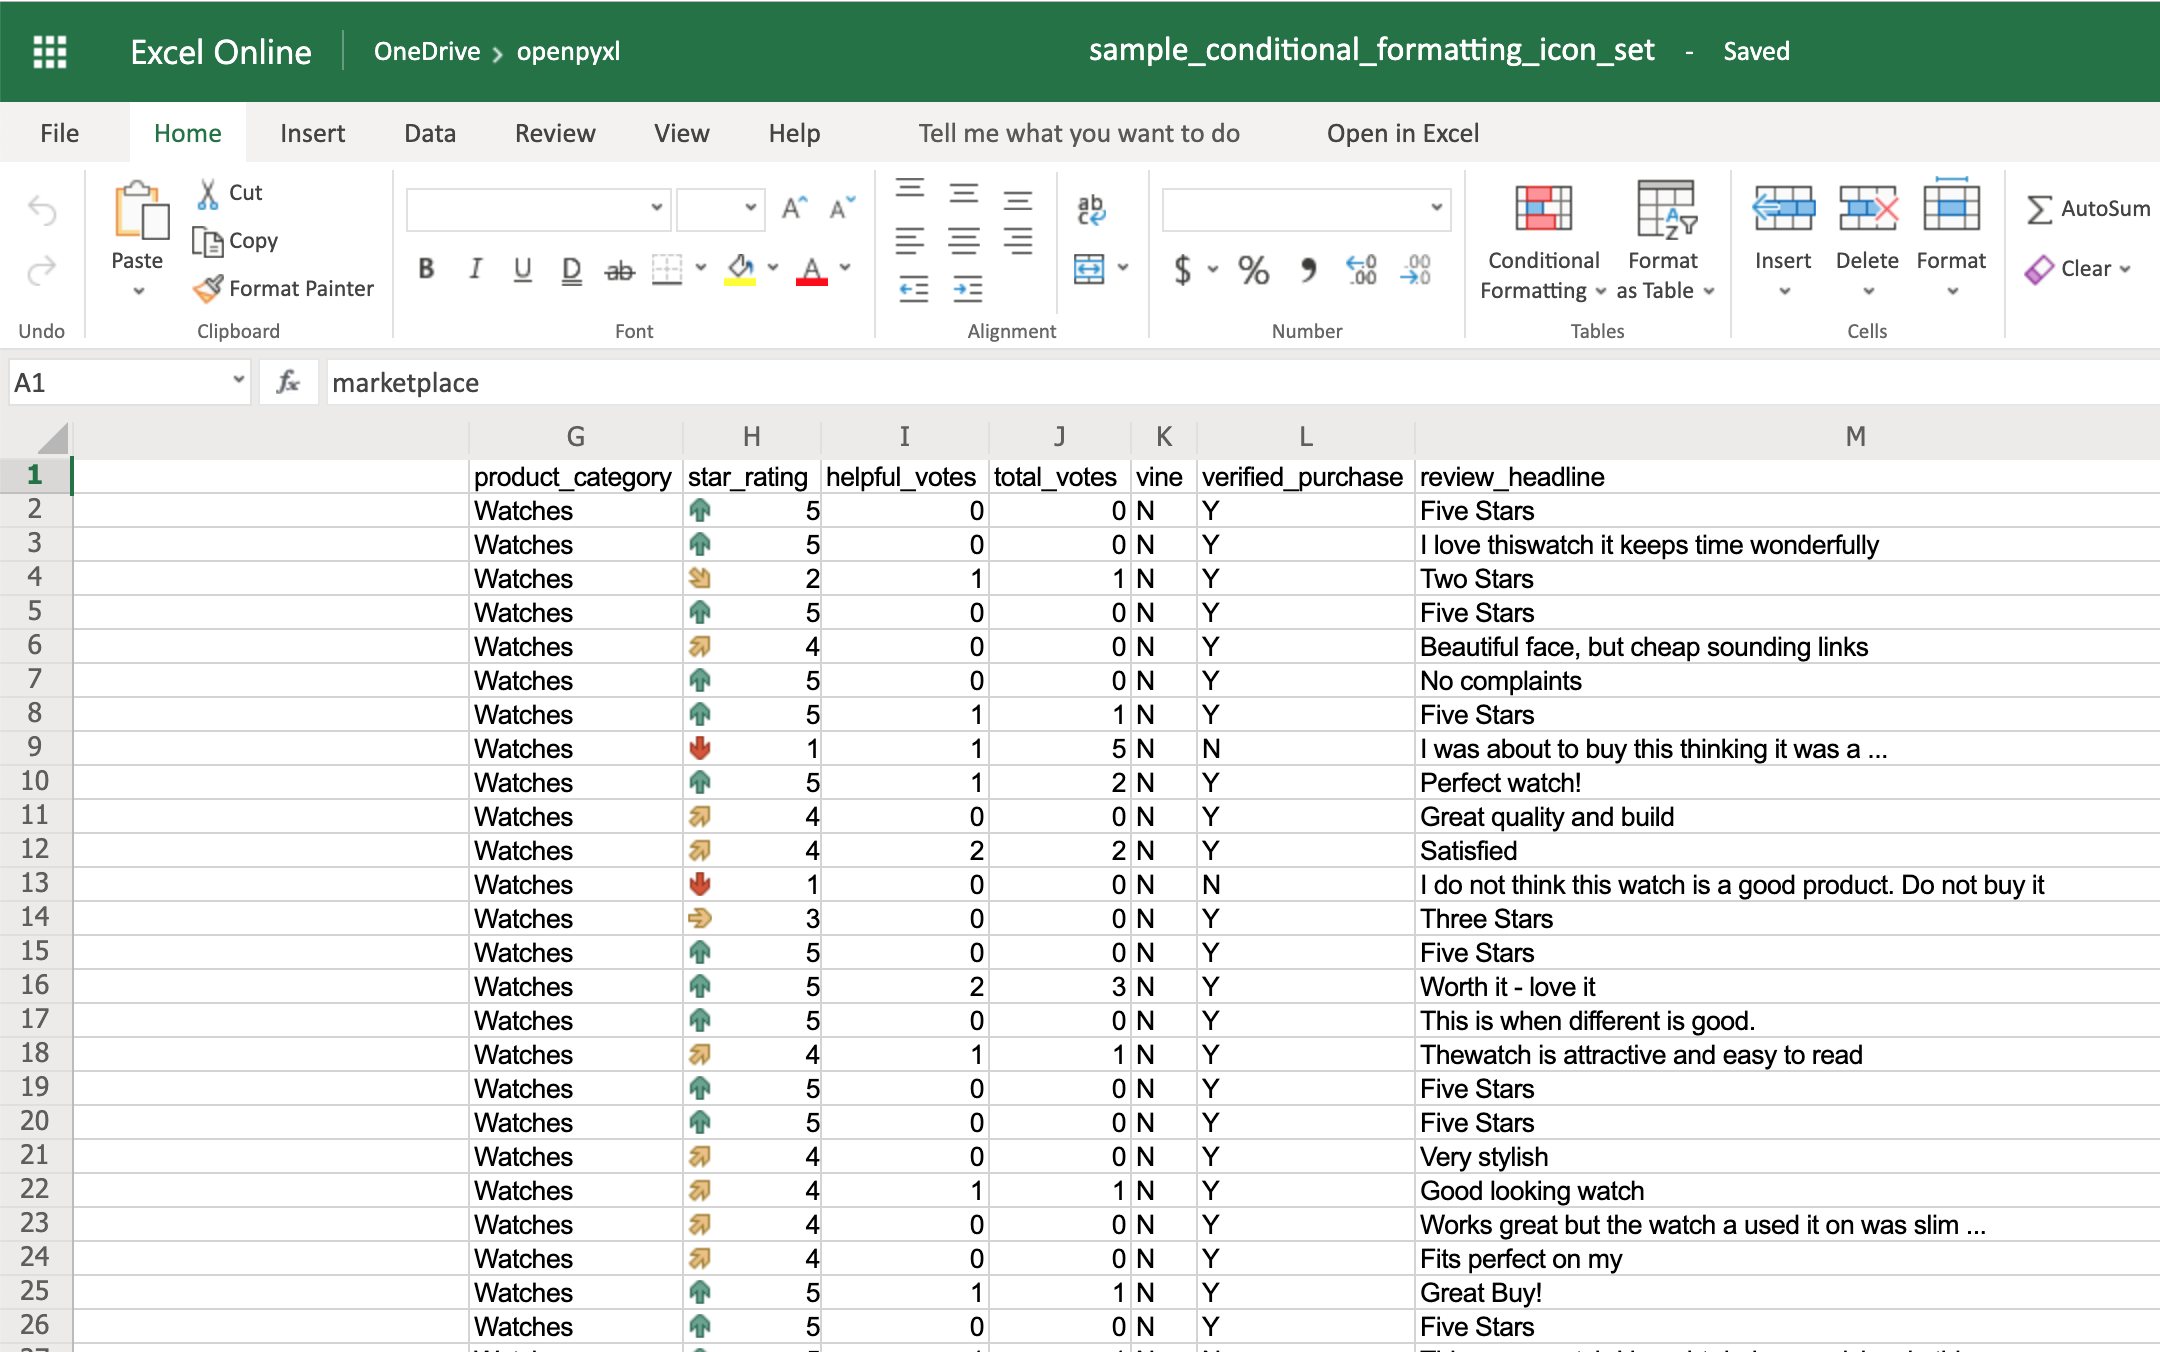
The openpyxl package has a full list of other icons you can use, besides the arrow.
Finally, the DataBar allows you to create progress bars:
>>>
>>> from openpyxl.formatting.rule import DataBarRule

>>> data_bar_rule = DataBarRule(start_type="num",
...                             start_value=1,
...                             end_type="num",
...                             end_value="5",
...                             color="0000FF00")  # Green
>>> sheet.conditional_formatting.add("H2:H100", data_bar_rule)
>>> workbook.save("sample_conditional_formatting_data_bar.xlsx")
You’ll now see a green progress bar that gets fuller the closer the star rating is to the number 5:
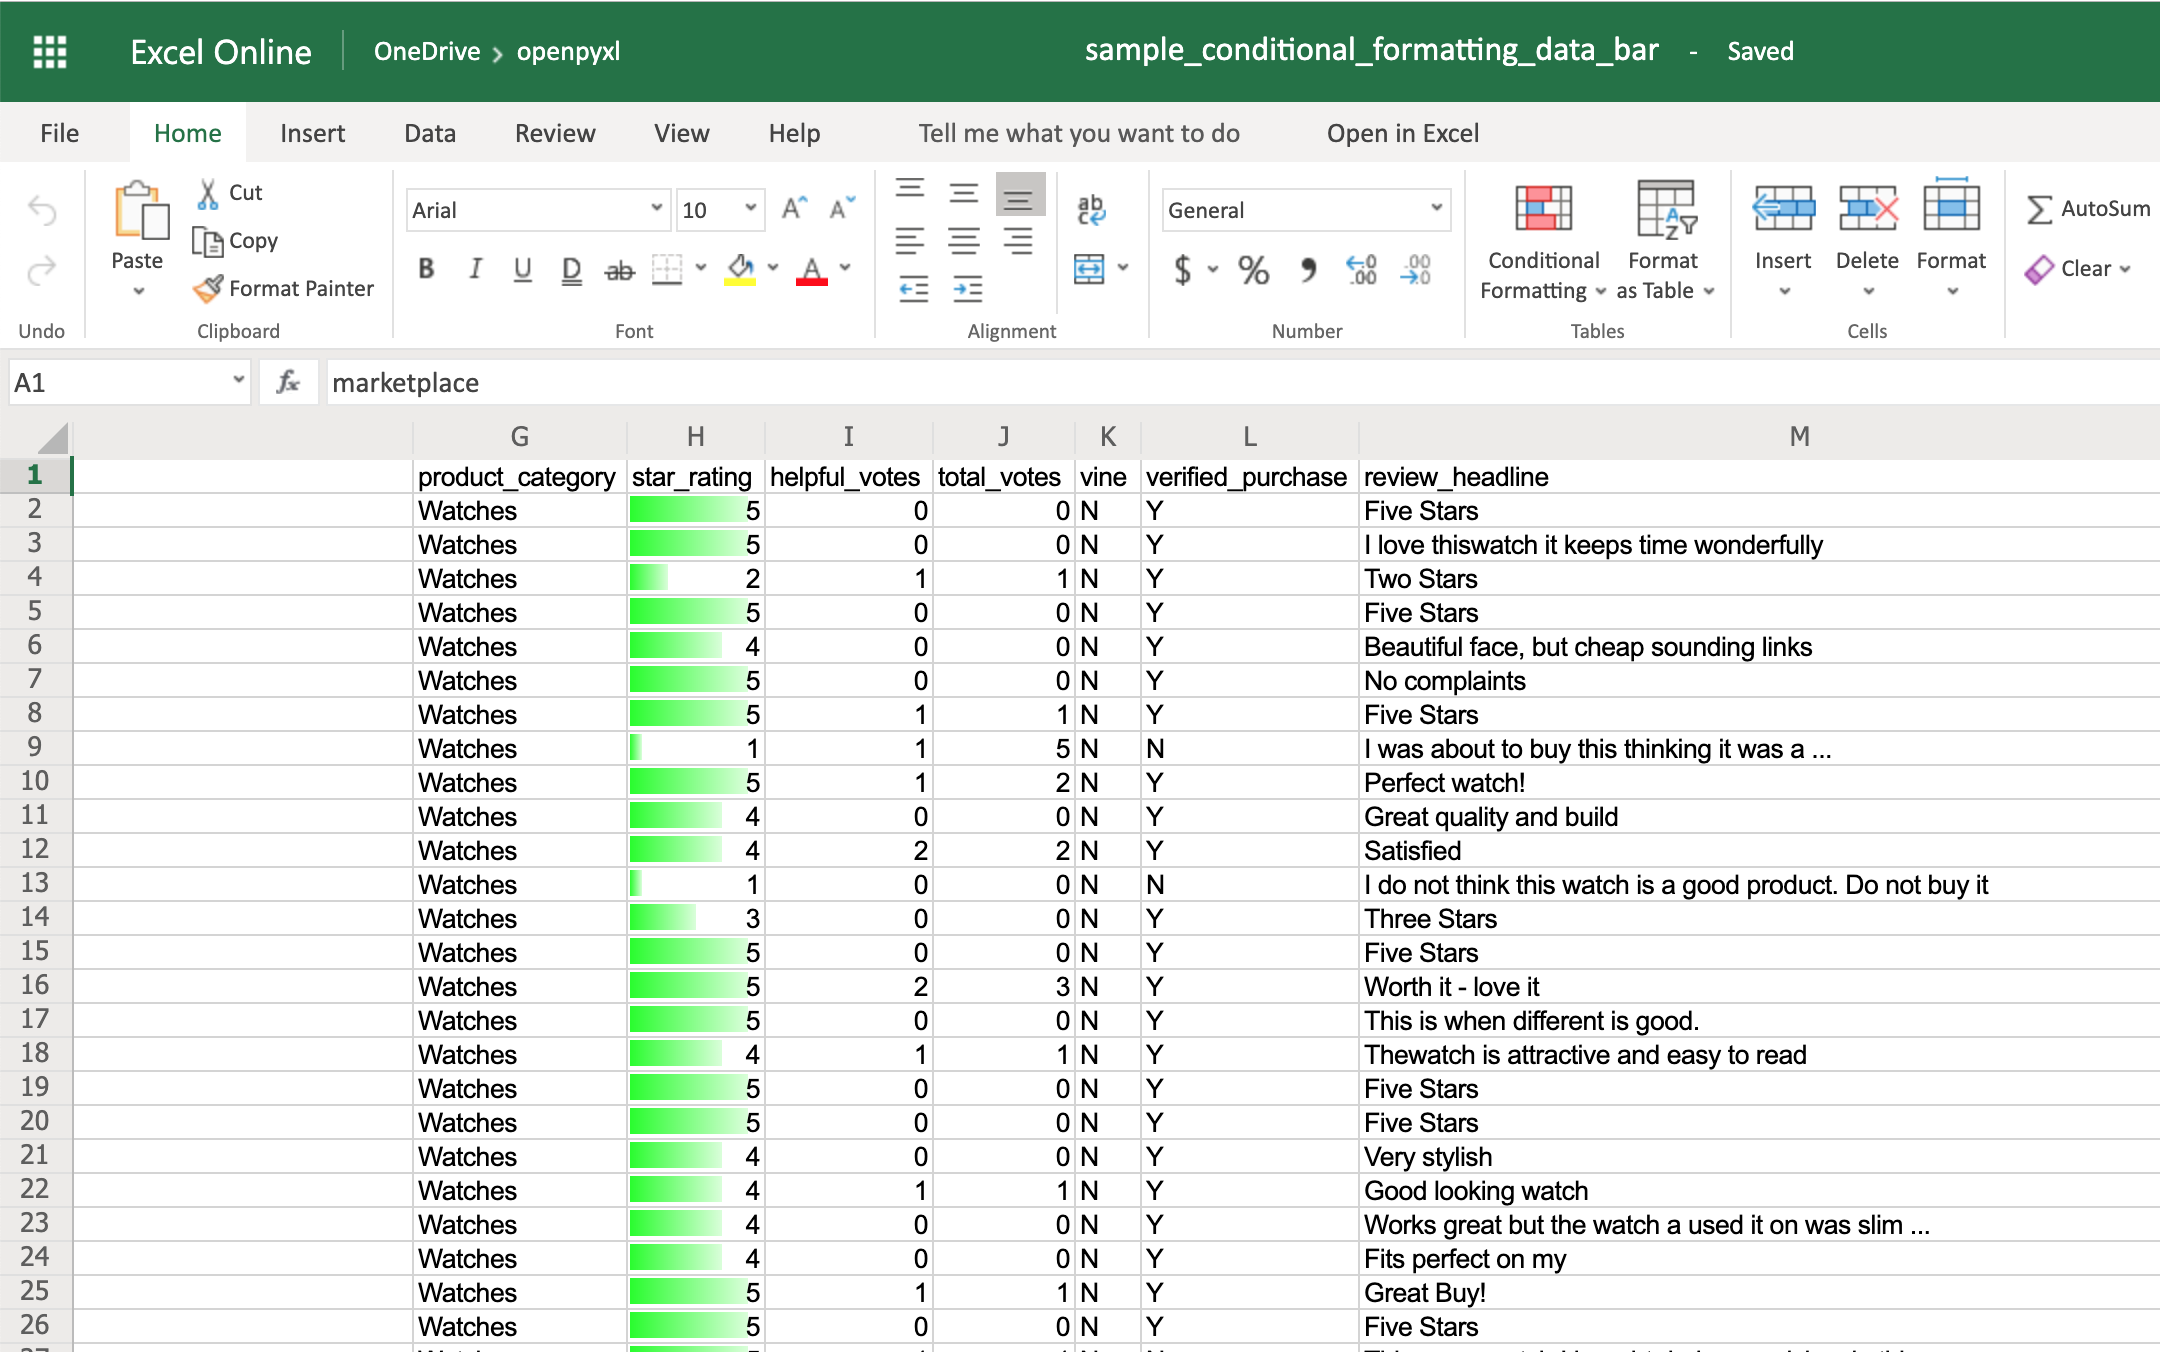
As you can see, there are a lot of cool things you can do with conditional formatting.
Here, you saw only a few examples of what you can achieve with it, but check the openpyxl documentation to see a bunch of other options.
Adding Images
Even though images are not something that you’ll often see in a spreadsheet, it’s quite cool to be able to add them. Maybe you can use it for branding purposes or to make spreadsheets more personal.
To be able to load images to a spreadsheet using openpyxl, you’ll have to install Pillow:
Apart from that, you’ll also need an image. For this example, you can grab the Real Python logo below and convert it from .webp to .png using an online converter such as cloudconvert.com, save the final file as logo.png, and copy it to the root folder where you’re running your examples:
![]()
Afterward, this is the code you need to import that image into the hello_word.xlsx spreadsheet:
from openpyxl import load_workbook
from openpyxl.drawing.image import Image

# Let's use the hello_world spreadsheet since it has less data
workbook = load_workbook(filename="hello_world.xlsx")
sheet = workbook.active

logo = Image("logo.png")

# A bit of resizing to not fill the whole spreadsheet with the logo
logo.height = 150
logo.width = 150

sheet.add_image(logo, "A3")
workbook.save(filename="hello_world_logo.xlsx")
You have an image on your spreadsheet! Here it is:
The image’s left top corner is on the cell you chose, in this case, A3.
Adding Pretty Charts
Another powerful thing you can do with spreadsheets is create an incredible variety of charts.
Charts are a great way to visualize and understand loads of data quickly. There are a lot of different chart types: bar chart, pie chart, line chart, and so on. openpyxl has support for a lot of them.
Here, you’ll see only a couple of examples of charts because the theory behind it is the same for every single chart type:
For any chart you want to build, you’ll need to define the chart type: BarChart, LineChart, and so forth, plus the data to be used for the chart, which is called Reference.
Before you can build your chart, you need to define what data you want to see represented in it. Sometimes, you can use the dataset as is, but other times you need to massage the data a bit to get additional information.
Let’s start by building a new workbook with some sample data:
 1from openpyxl import Workbook
 2from openpyxl.chart import BarChart, Reference
 3
 4workbook = Workbook()
 5sheet = workbook.active
 6
 7# Let's create some sample sales data
 8rows = [
 9    ["Product", "Online", "Store"],
10    [1, 30, 45],
11    [2, 40, 30],
12    [3, 40, 25],
13    [4, 50, 30],
14    [5, 30, 25],
15    [6, 25, 35],
16    [7, 20, 40],
17]
18
19for row in rows:
20    sheet.append(row)
Now you’re going to start by creating a bar chart that displays the total number of sales per product:
22chart = BarChart()
23data = Reference(worksheet=sheet,
24                 min_row=1,
25                 max_row=8,
26                 min_col=2,
27                 max_col=3)
28
29chart.add_data(data, titles_from_data=True)
30sheet.add_chart(chart, "E2")
31
32workbook.save("chart.xlsx")
There you have it. Below, you can see a very straightforward bar chart showing the difference between online product sales online and in-store product sales:
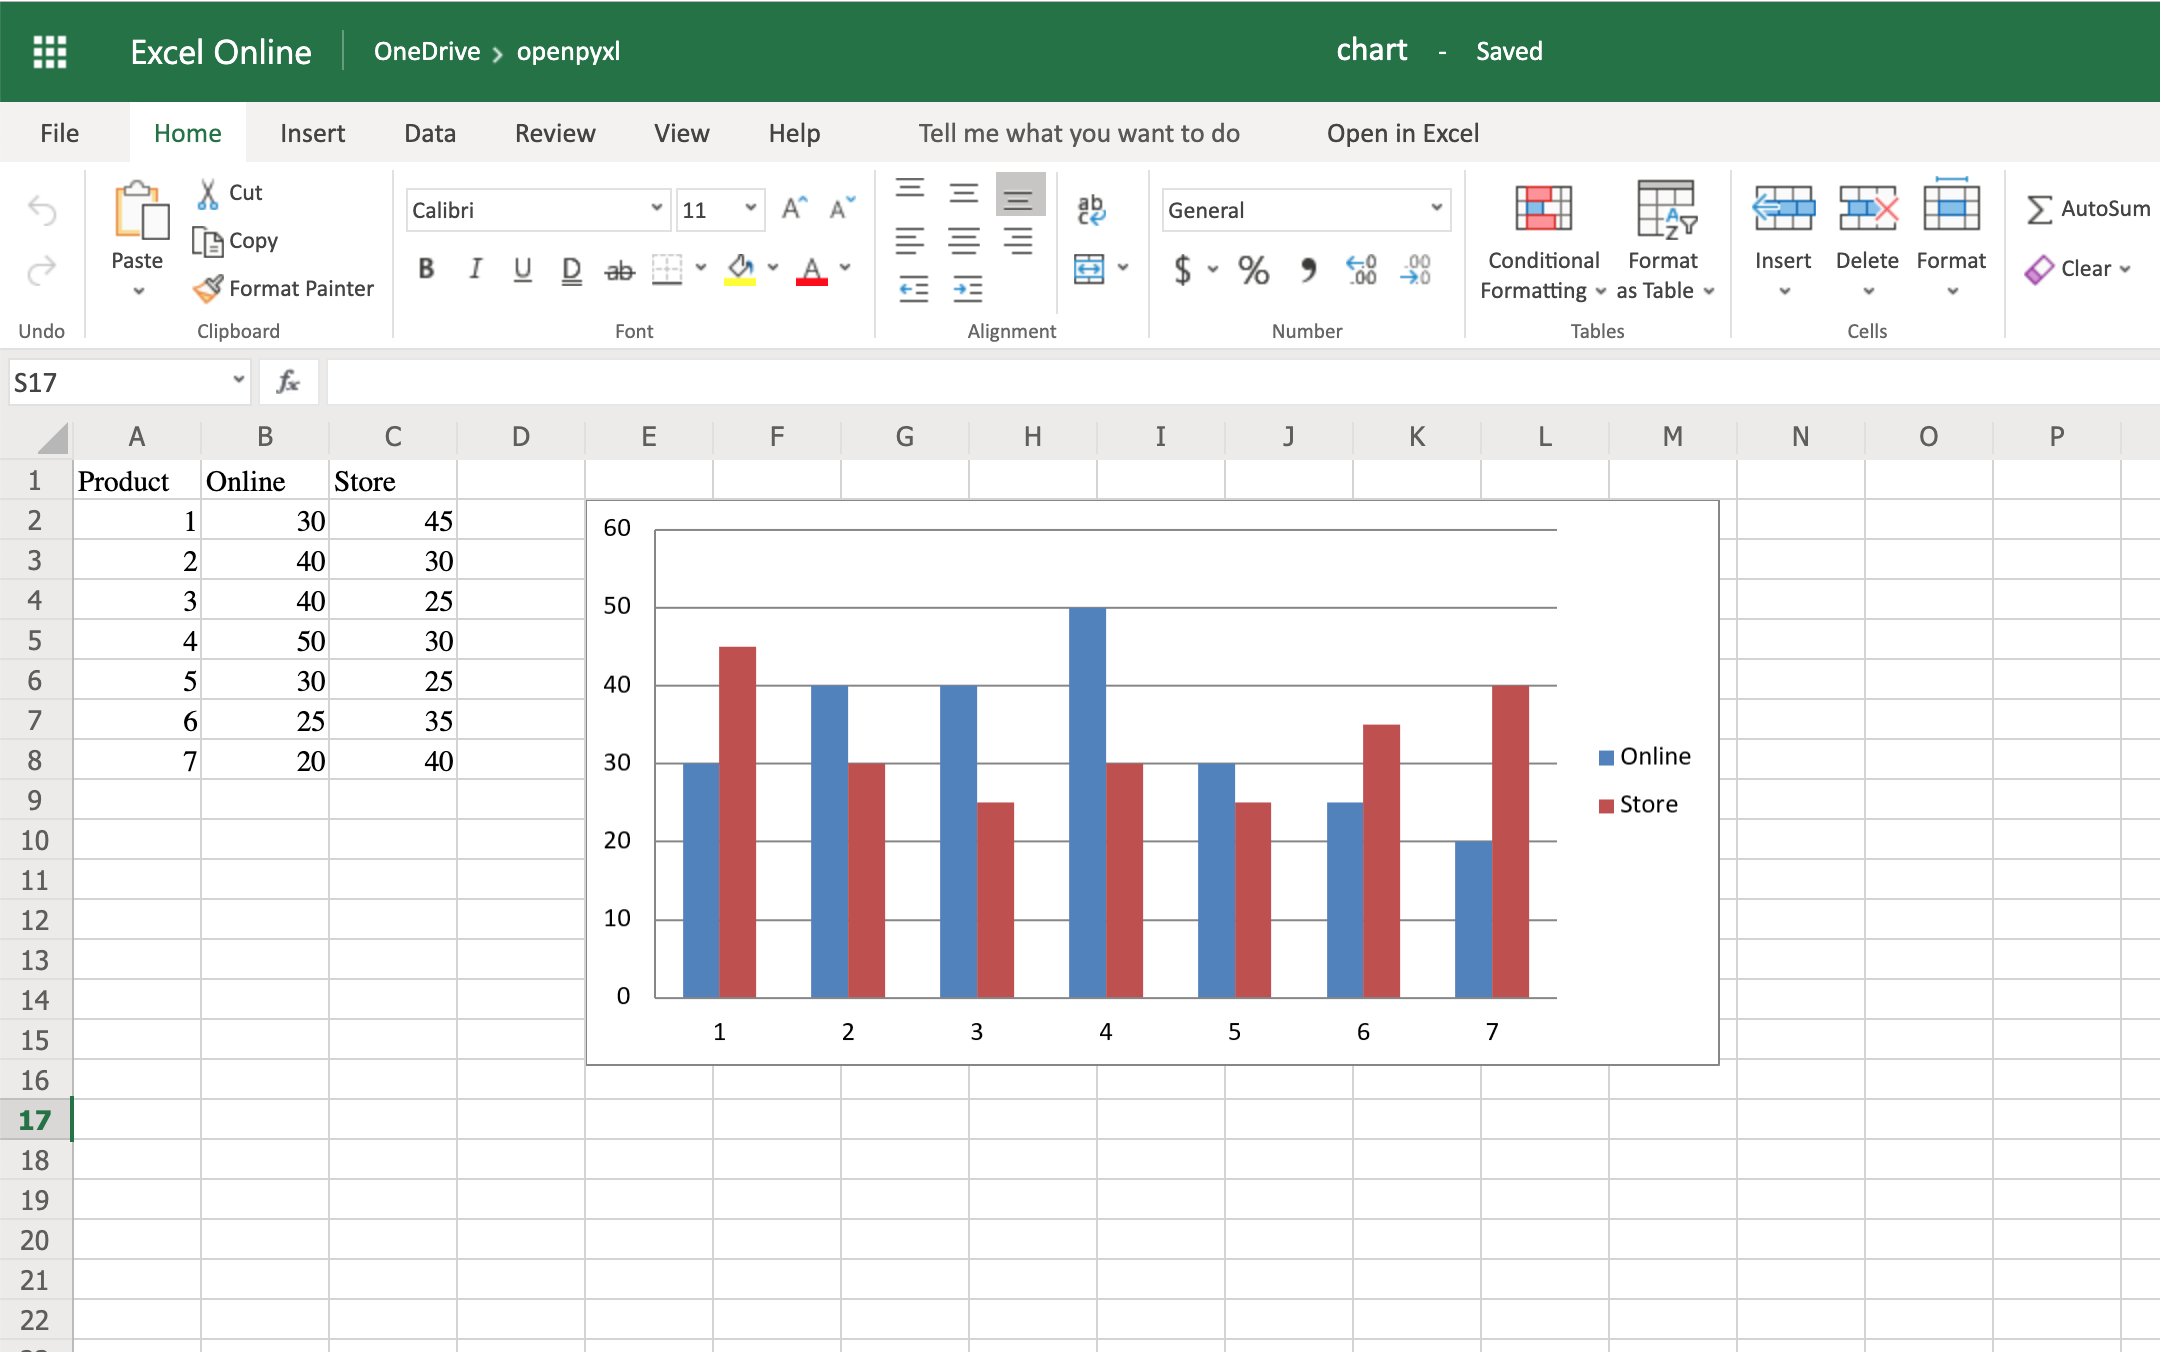
Like with images, the top left corner of the chart is on the cell you added the chart to. In your case, it was on cell E2.
Try creating a line chart instead, changing the data a bit:
 1import random
 2from openpyxl import Workbook
 3from openpyxl.chart import LineChart, Reference
 4
 5workbook = Workbook()
 6sheet = workbook.active
 7
 8# Let's create some sample sales data
 9rows = [
10    ["", "January", "February", "March", "April",
11    "May", "June", "July", "August", "September",
12     "October", "November", "December"],
13    [1, ],
14    [2, ],
15    [3, ],
16]
17
18for row in rows:
19    sheet.append(row)
20
21for row in sheet.iter_rows(min_row=2,
22                           max_row=4,
23                           min_col=2,
24                           max_col=13):
25    for cell in row:
26        cell.value = random.randrange(5, 100)
With the above code, you’ll be able to generate some random data regarding the sales of 3 different products across a whole year.
Once that’s done, you can very easily create a line chart with the following code:
28chart = LineChart()
29data = Reference(worksheet=sheet,
30                 min_row=2,
31                 max_row=4,
32                 min_col=1,
33                 max_col=13)
34
35chart.add_data(data, from_rows=True, titles_from_data=True)
36sheet.add_chart(chart, "C6")
37
38workbook.save("line_chart.xlsx")
Here’s the outcome of the above piece of code:

One thing to keep in mind here is the fact that you’re using from_rows=True when adding the data. This argument makes the chart plot row by row instead of column by column.
In your sample data, you see that each product has a row with 12 values (1 column per month). That’s why you use from_rows. If you don’t pass that argument, by default, the chart tries to plot by column, and you’ll get a month-by-month comparison of sales.
Another difference that has to do with the above argument change is the fact that our Reference now starts from the first column, min_col=1, instead of the second one. This change is needed because the chart now expects the first column to have the titles.
There are a couple of other things you can also change regarding the style of the chart. For example, you can add specific categories to the chart:
cats = Reference(worksheet=sheet,
                 min_row=1,
                 max_row=1,
                 min_col=2,
                 max_col=13)
chart.set_categories(cats)
Add this piece of code before saving the workbook, and you should see the month names appearing instead of numbers:
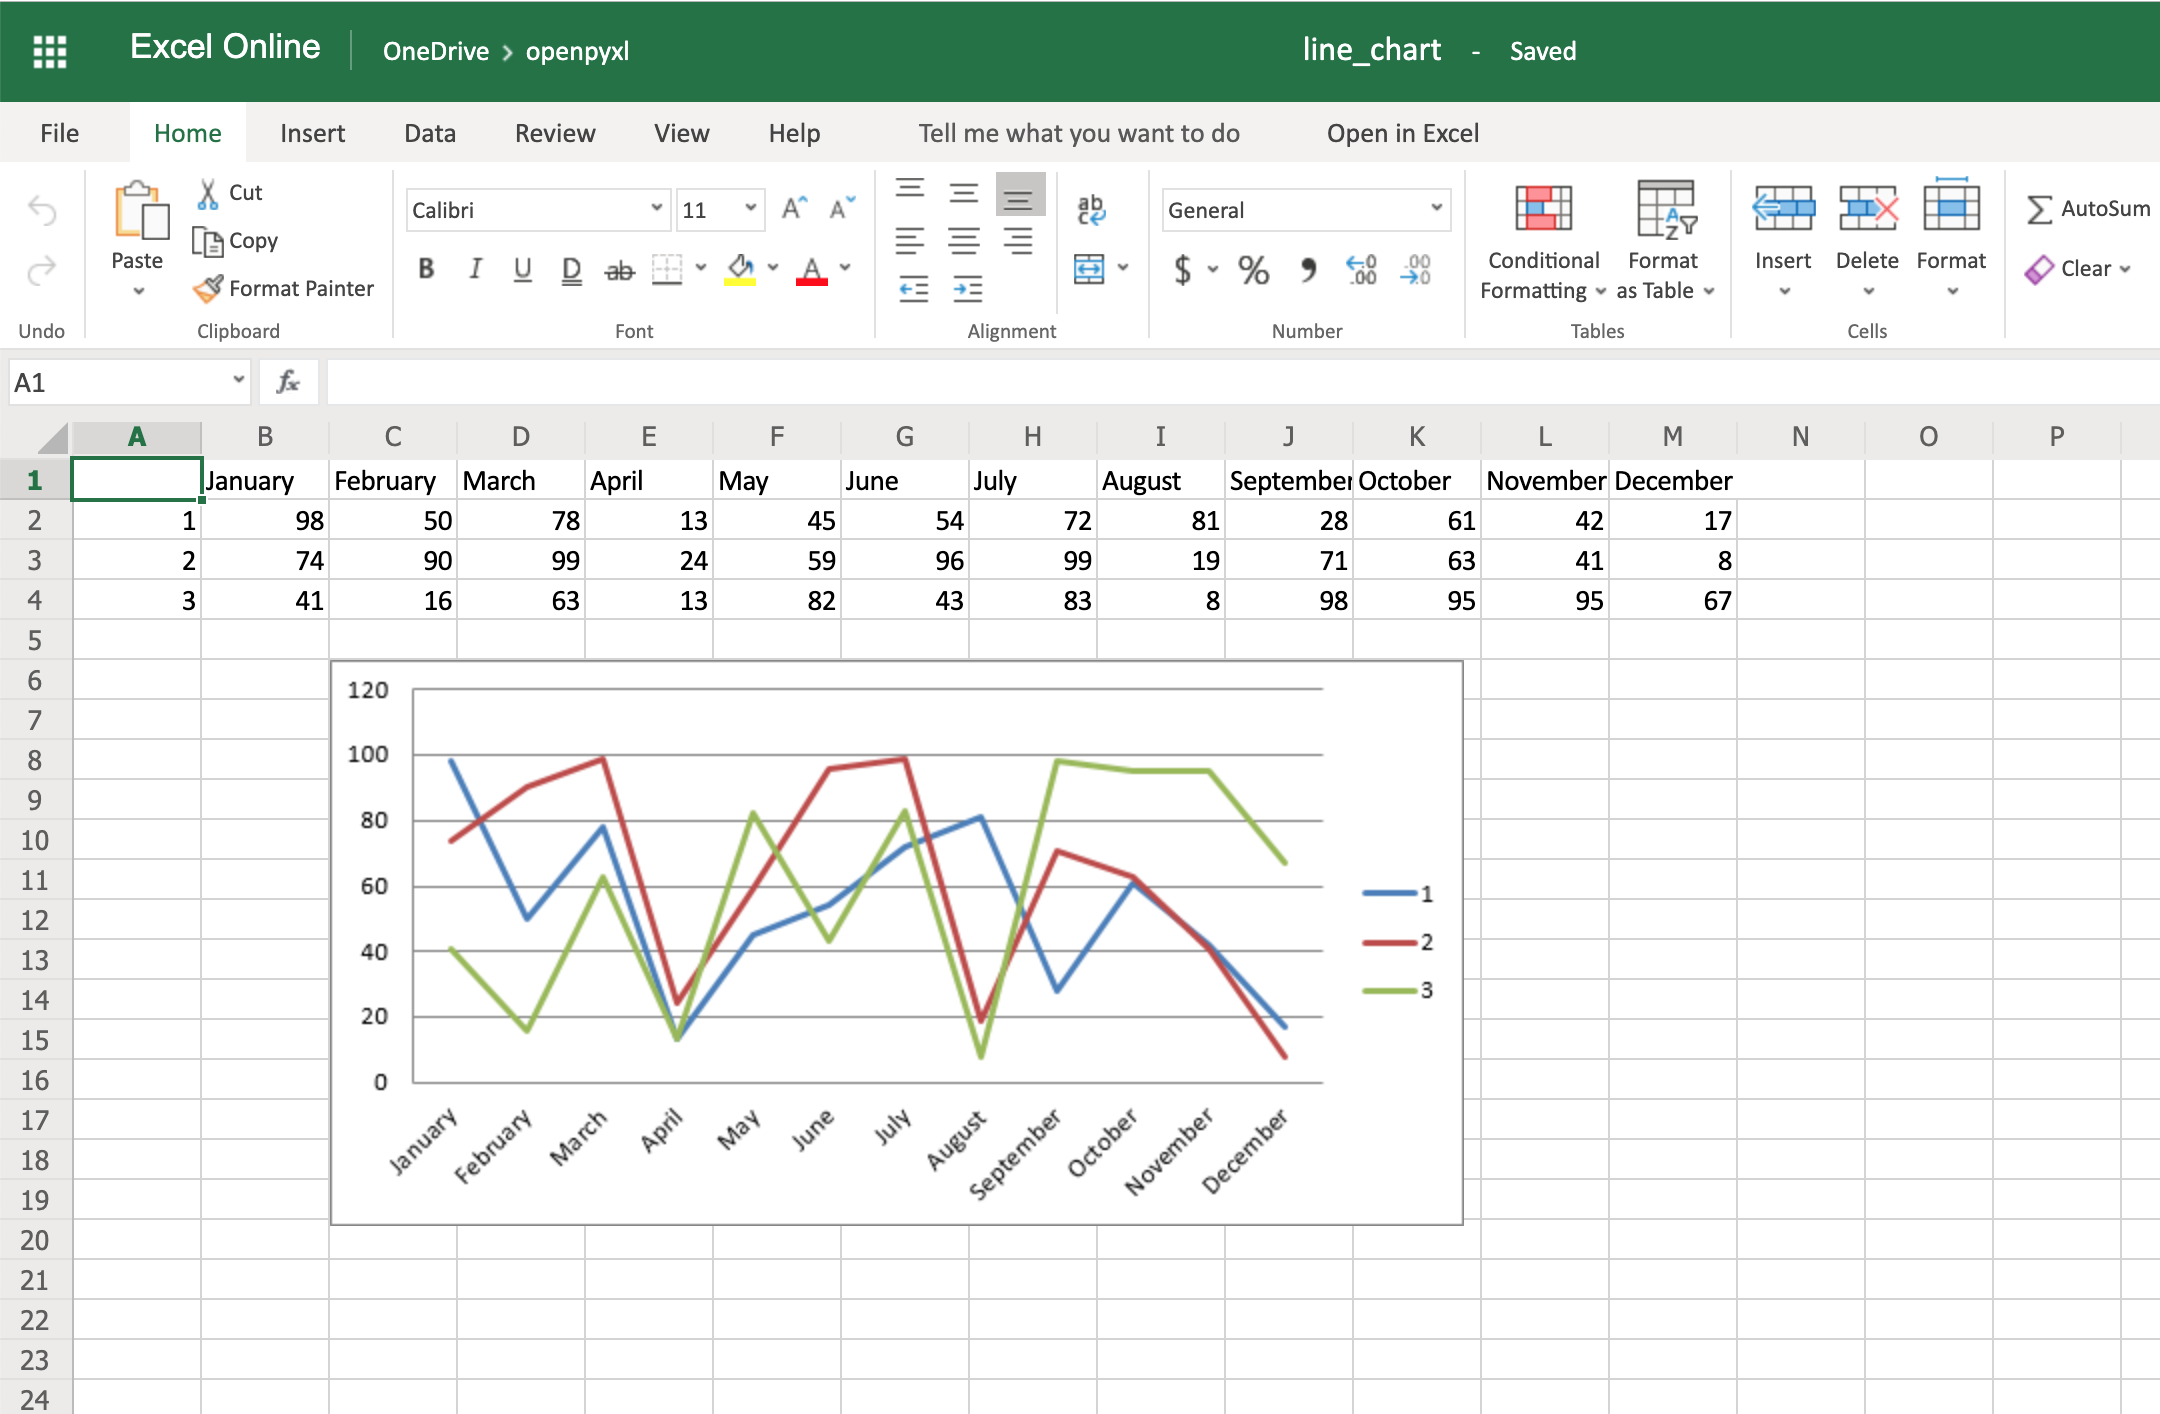
Code-wise, this is a minimal change. But in terms of the readability of the spreadsheet, this makes it much easier for someone to open the spreadsheet and understand the chart straight away.
Another thing you can do to improve the chart readability is to add an axis. You can do it using the attributes x_axis and y_axis:
chart.x_axis.title = "Months"
chart.y_axis.title = "Sales (per unit)"
This will generate a spreadsheet like the below one:
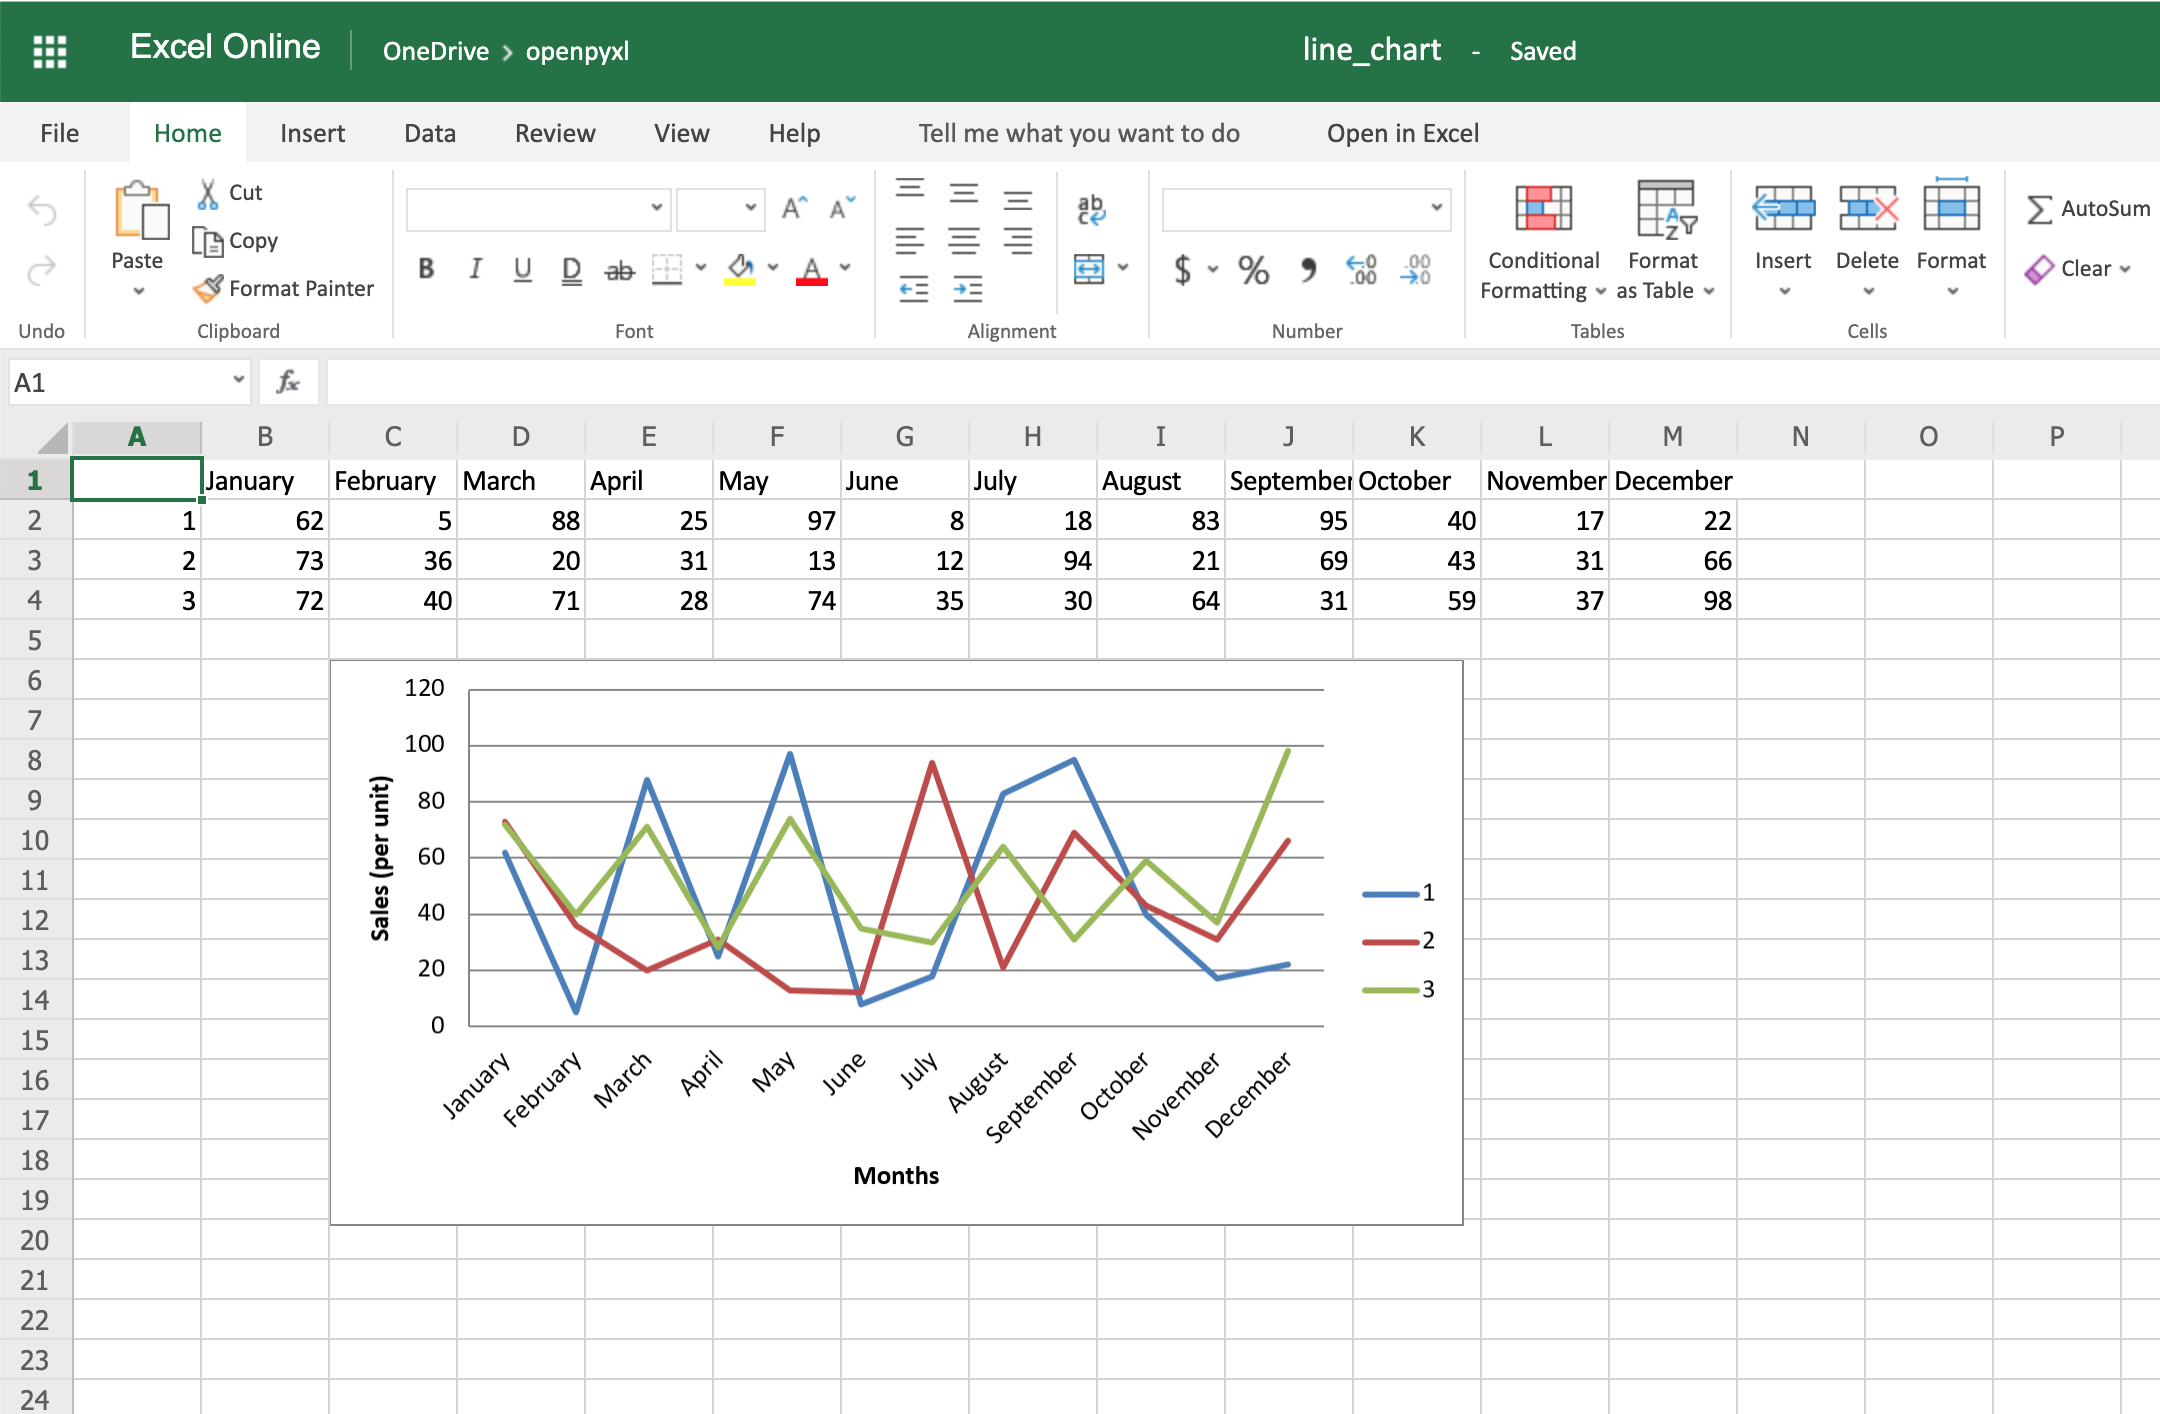
As you can see, small changes like the above make reading your chart a much easier and quicker task.
There is also a way to style your chart by using Excel’s default ChartStyle property. In this case, you have to choose a number between 1 and 48. Depending on your choice, the colors of your chart change as well:
# You can play with this by choosing any number between 1 and 48
chart.style = 24
With the style selected above, all lines have some shade of orange:

There is no clear documentation on what each style number looks like, but this spreadsheet has a few examples of the styles available.
Here’s the full code used to generate the line chart with categories, axis titles, and style:
import random
from openpyxl import Workbook
from openpyxl.chart import LineChart, Reference

workbook = Workbook()
sheet = workbook.active

# Let's create some sample sales data
rows = [
    ["", "January", "February", "March", "April",
    "May", "June", "July", "August", "September",
     "October", "November", "December"],
    [1, ],
    [2, ],
    [3, ],
]

for row in rows:
    sheet.append(row)

for row in sheet.iter_rows(min_row=2,
                           max_row=4,
                           min_col=2,
                           max_col=13):
    for cell in row:
        cell.value = random.randrange(5, 100)

# Create a LineChart and add the main data
chart = LineChart()
data = Reference(worksheet=sheet,
                           min_row=2,
                           max_row=4,
                           min_col=1,
                           max_col=13)
chart.add_data(data, titles_from_data=True, from_rows=True)

# Add categories to the chart
cats = Reference(worksheet=sheet,
                 min_row=1,
                 max_row=1,
                 min_col=2,
                 max_col=13)
chart.set_categories(cats)

# Rename the X and Y Axis
chart.x_axis.title = "Months"
chart.y_axis.title = "Sales (per unit)"

# Apply a specific Style
chart.style = 24

# Save!
sheet.add_chart(chart, "C6")
workbook.save("line_chart.xlsx")
There are a lot more chart types and customization you can apply, so be sure to check out the package documentation on this if you need some specific formatting.
Convert Python Classes to Excel Spreadsheet
You already saw how to convert an Excel spreadsheet’s data into Python classes, but now let’s do the opposite.
Let’s imagine you have a database and are using some Object-Relational Mapping (ORM) to map DB objects into Python classes. Now, you want to export those same objects into a spreadsheet.
Let’s assume the following data classes to represent the data coming from your database regarding product sales:
from dataclasses import dataclass
from typing import List

@dataclass
class Sale:
    quantity: int

@dataclass
class Product:
    id: str
    name: str
    sales: List[Sale]
Now, let’s generate some random data, assuming the above classes are stored in a db_classes.py file:
 1import random
 2
 3# Ignore these for now. You'll use them in a sec ;)
 4from openpyxl import Workbook
 5from openpyxl.chart import LineChart, Reference
 6
 7from db_classes import Product, Sale
 8
 9products = []
10
11# Let's create 5 products
12for idx in range(1, 6):
13    sales = []
14
15    # Create 5 months of sales
16    for _ in range(5):
17        sale = Sale(quantity=random.randrange(5, 100))
18        sales.append(sale)
19
20    product = Product(id=str(idx),
21                      name="Product %s" % idx,
22                      sales=sales)
23    products.append(product)
By running this piece of code, you should get 5 products with 5 months of sales with a random quantity of sales for each month.
Now, to convert this into a spreadsheet, you need to iterate over the data and append it to the spreadsheet:
25workbook = Workbook()
26sheet = workbook.active
27
28# Append column names first
29sheet.append(["Product ID", "Product Name", "Month 1",
30              "Month 2", "Month 3", "Month 4", "Month 5"])
31
32# Append the data
33for product in products:
34    data = [product.id, product.name]
35    for sale in product.sales:
36        data.append(sale.quantity)
37    sheet.append(data)
That’s it. That should allow you to create a spreadsheet with some data coming from your database.
However, why not use some of that cool knowledge you gained recently to add a chart as well to display that data more visually?
All right, then you could probably do something like this:
38chart = LineChart()
39data = Reference(worksheet=sheet,
40                 min_row=2,
41                 max_row=6,
42                 min_col=2,
43                 max_col=7)
44
45chart.add_data(data, titles_from_data=True, from_rows=True)
46sheet.add_chart(chart, "B8")
47
48cats = Reference(worksheet=sheet,
49                 min_row=1,
50                 max_row=1,
51                 min_col=3,
52                 max_col=7)
53chart.set_categories(cats)
54
55chart.x_axis.title = "Months"
56chart.y_axis.title = "Sales (per unit)"
57
58workbook.save(filename="oop_sample.xlsx")
Now we’re talking! Here’s a spreadsheet generated from database objects and with a chart and everything:

That’s a great way for you to wrap up your new knowledge of charts!
Bonus: Working With Pandas
Even though you can use Pandas to handle Excel files, there are few things that you either can’t accomplish with Pandas or that you’d be better off just using openpyxl directly.
For example, some of the advantages of using openpyxl are the ability to easily customize your spreadsheet with styles, conditional formatting, and such.
But guess what, you don’t have to worry about picking. In fact, openpyxl has support for both converting data from a Pandas DataFrame into a workbook or the opposite, converting an openpyxl workbook into a Pandas DataFrame.
First things first, remember to install the pandas package:
Then, let’s create a sample DataFrame:
 1import pandas as pd
 2
 3data = {
 4    "Product Name": ["Product 1", "Product 2"],
 5    "Sales Month 1": [10, 20],
 6    "Sales Month 2": [5, 35],
 7}
 8df = pd.DataFrame(data)
Now that you have some data, you can use .dataframe_to_rows() to convert it from a DataFrame into a worksheet:
10from openpyxl import Workbook
11from openpyxl.utils.dataframe import dataframe_to_rows
12
13workbook = Workbook()
14sheet = workbook.active
15
16for row in dataframe_to_rows(df, index=False, header=True):
17    sheet.append(row)
18
19workbook.save("pandas.xlsx")
You should see a spreadsheet that looks like this:
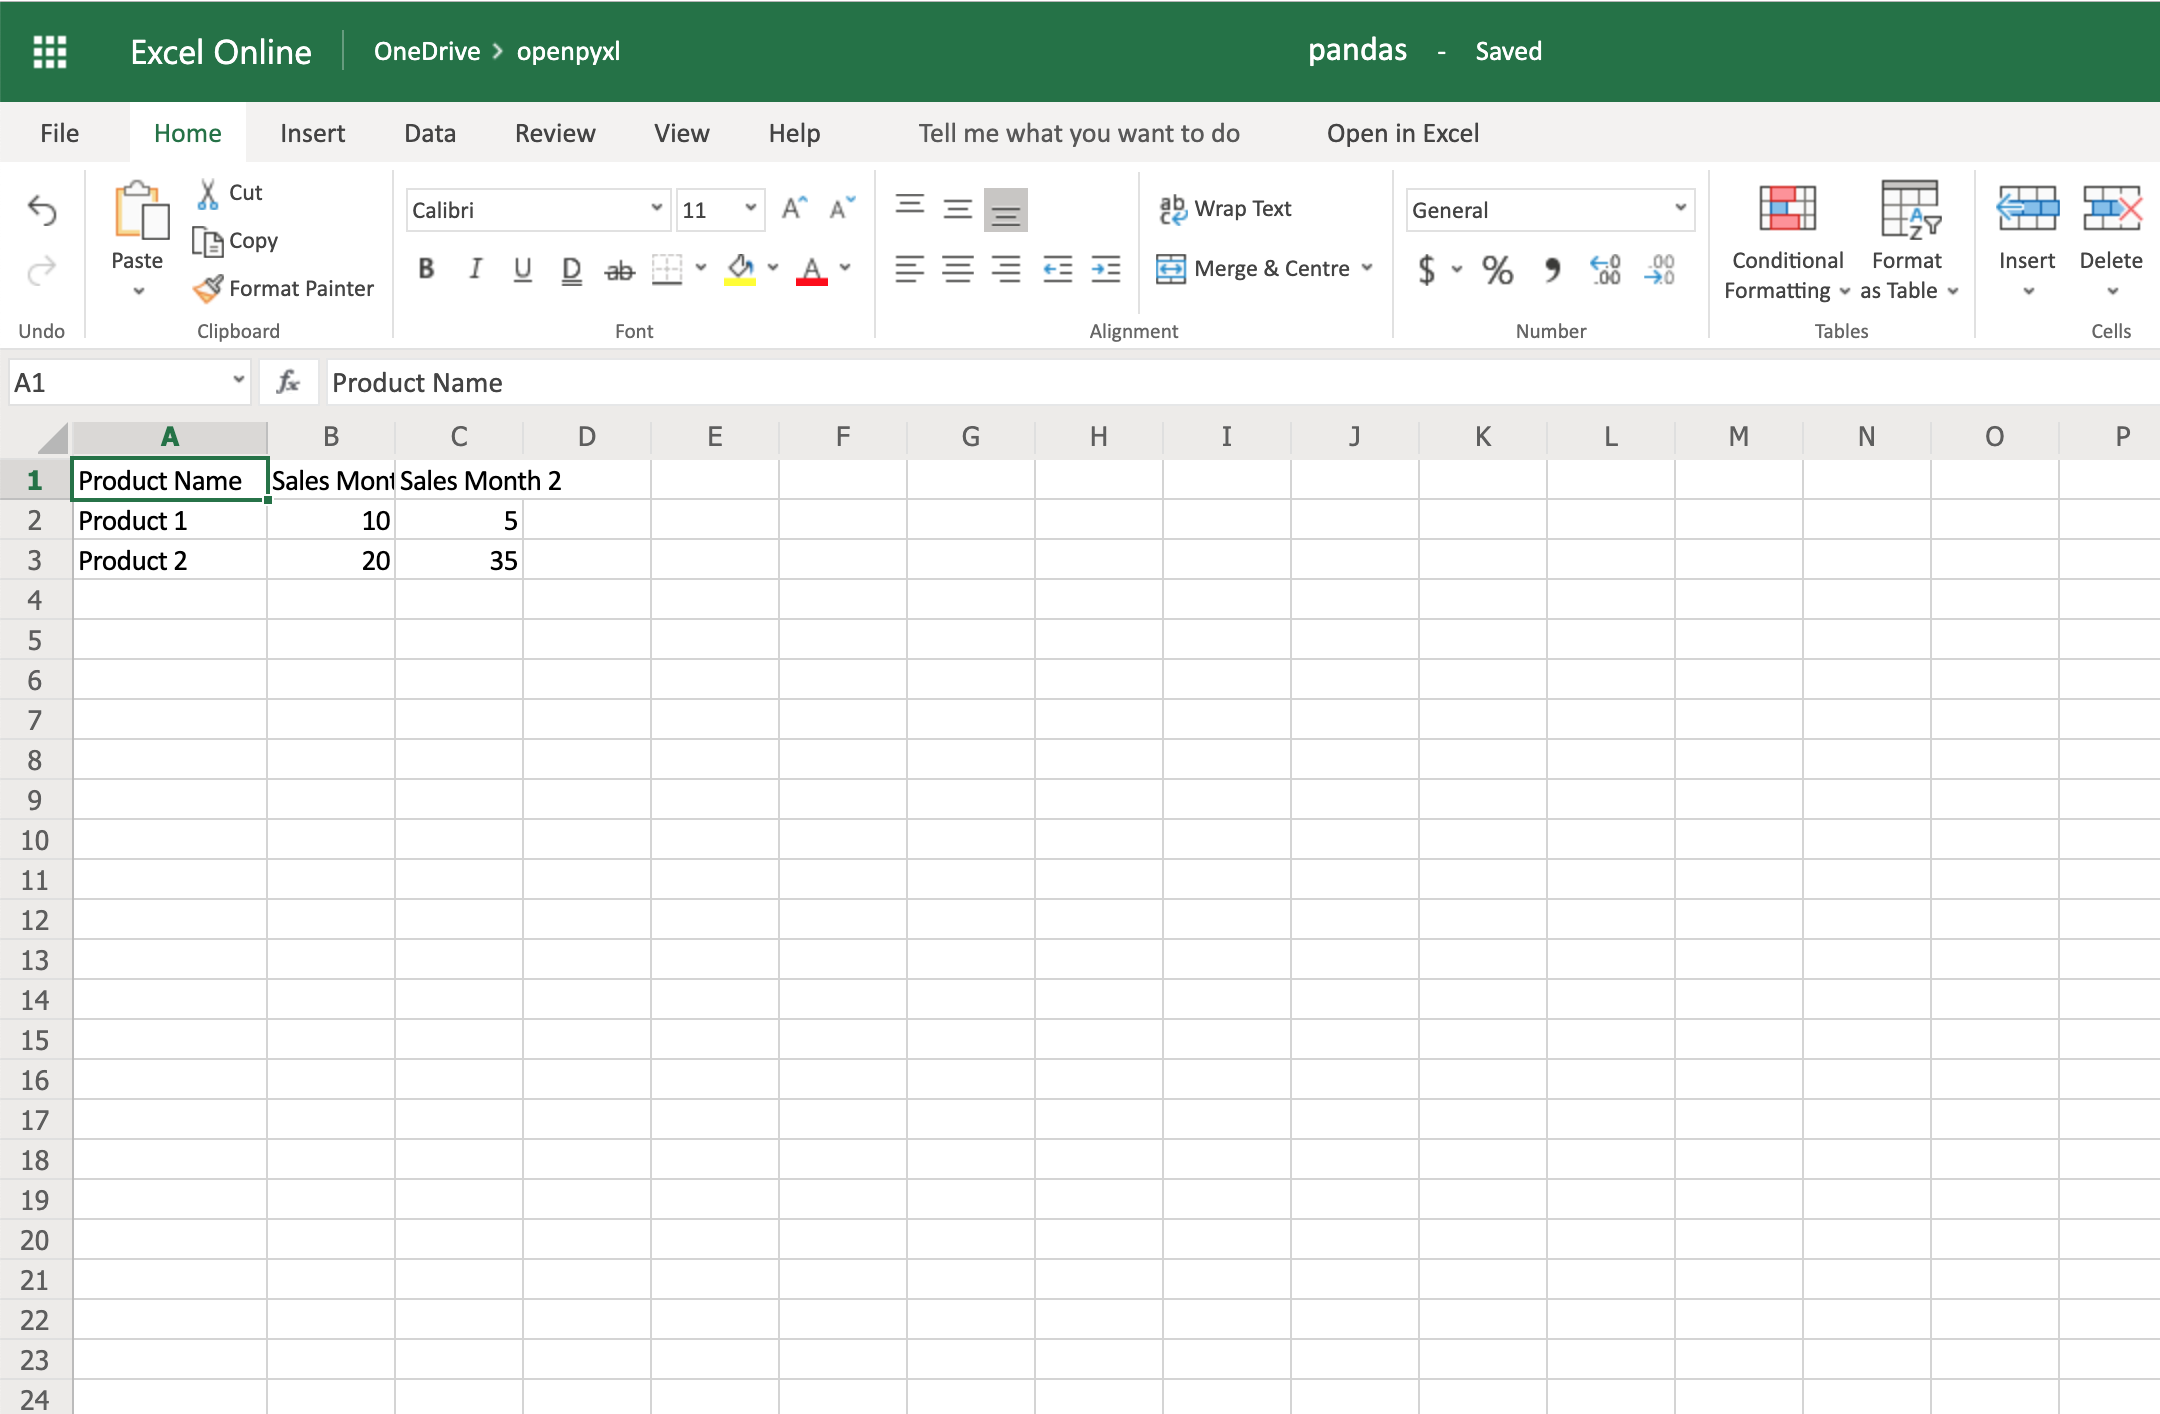
If you want to add the DataFrame’s index, you can change index=True, and it adds each row’s index into your spreadsheet.
On the other hand, if you want to convert a spreadsheet into a DataFrame, you can also do it in a very straightforward way like so:
import pandas as pd
from openpyxl import load_workbook

workbook = load_workbook(filename="sample.xlsx")
sheet = workbook.active

values = sheet.values
df = pd.DataFrame(values)
Alternatively, if you want to add the correct headers and use the review ID as the index, for example, then you can also do it like this instead:
import pandas as pd
from openpyxl import load_workbook
from mapping import REVIEW_ID

workbook = load_workbook(filename="sample.xlsx")
sheet = workbook.active

data = sheet.values

# Set the first row as the columns for the DataFrame
cols = next(data)
data = list(data)

# Set the field "review_id" as the indexes for each row
idx = [row[REVIEW_ID] for row in data]

df = pd.DataFrame(data, index=idx, columns=cols)
Using indexes and columns allows you to access data from your DataFrame easily:
>>>
>>> df.columns
Index(['marketplace', 'customer_id', 'review_id', 'product_id',
       'product_parent', 'product_title', 'product_category', 'star_rating',
       'helpful_votes', 'total_votes', 'vine', 'verified_purchase',
       'review_headline', 'review_body', 'review_date'],
      dtype='object')

>>> # Get first 10 reviews' star rating
>>> df["star_rating"][:10]
R3O9SGZBVQBV76    5
RKH8BNC3L5DLF     5
R2HLE8WKZSU3NL    2
R31U3UH5AZ42LL    5
R2SV659OUJ945Y    4
RA51CP8TR5A2L     5
RB2Q7DLDN6TH6     5
R2RHFJV0UYBK3Y    1
R2Z6JOQ94LFHEP    5
RX27XIIWY5JPB     4
Name: star_rating, dtype: int64

>>> # Grab review with id "R2EQL1V1L6E0C9", using the index
>>> df.loc["R2EQL1V1L6E0C9"]
marketplace               US
customer_id         15305006
review_id     R2EQL1V1L6E0C9
product_id        B004LURNO6
product_parent     892860326
review_headline   Five Stars
review_body          Love it
review_date       2015-08-31
Name: R2EQL1V1L6E0C9, dtype: object
There you go, whether you want to use openpyxl to prettify your Pandas dataset or use Pandas to do some hardcore algebra, you now know how to switch between both packages.
Conclusion
Phew, after that long read, you now know how to work with spreadsheets in Python! You can rely on openpyxl, your trustworthy companion, to:
- Extract valuable information from spreadsheets in a Pythonic manner
- Create your own spreadsheets, no matter the complexity level
- Add cool features such as conditional formatting or charts to your spreadsheets
There are a few other things you can do with openpyxl that might not have been covered in this tutorial, but you can always check the package’s official documentation website to learn more about it. You can even venture into checking its source code and improving the package further.
Feel free to leave any comments below if you have any questions, or if there’s any section you’d love to hear more about.
Watch Now This tutorial has a related video course created by the Real Python team. Watch it together with the written tutorial to deepen your understanding: Editing Excel Spreadsheets in Python With openpyxl
Сегодня мы разберем как можно запускать скрипты Python напрямую из Excel, минуя какие либо промежуточные интерфейсы. Для этой задачи нам понадобится пакет Хlwings. Он входит в состав Anaconda, поэтому если Вы ее установили, то никаких дополнительных действий не требуется.

Обращаю внимание, что инструкция относится для версии xlwings 0.16.0 и выше. Если у вас установлена версия ниже — обновите пожалуйста пакет.
1. Установка Excel аддона
Первое, что надо сделать — это установить специальный аддон в Excel. Для этого запустите командную строку Anaconda и введите команду:
xlwings addin install
После того, как команда отработала, то запустите Excel и вы должны увидеть новую ленту xlwings:

Далее запустите VBA редактор (Alt + F11), там в меню Tools выберите References…, в открывшемся меню активируйте xlwings:

2. Настройка ленты xlwings в Excel
Далее необходимо прописать в ленте xlwings путь до Python, а также расположение директории, куда была установлена Anaconda и как называется используемое Виртуальное окружение (environment).
Итак в поле Interpreter указываем путь до файла python.exe, включая название файла. К примеру у меня адрес следующий: D:PythonAnaconda3envsworkpython.exe
В поле Conda Base указываем адрес, куда установлена Anaconda. К примеру у меня это D:PythonAnaconda3.
Далее в поле Conda Env указываем название виртуального окружения. У меня к примеру это work. Если Вы не знаете название вашего виртуального окружения, то запустите Anaconda Navigator, далее перейдите в пункт Environments и там увидите необходимое название.
3. Запуск Python скрипта из Excel
Для запуска скриптов есть два варианта:
3.1 Без использования VBA
Создайте Excel файл, сохраните его с любым названием, далее в этой же папке создайте python скрипт с таким же названием, как и Excel файл, в нем создайте функцию с названием main(). Эту функцию вы сможете вызвать из ленты xlwings нажав на кнопку «Run main». К примеру внесите в скрипт следующий код:
import xlwings as xw
def main():
wb = xw.Book.caller()
wb.sheets[0].range(‘A1’).value = ‘Hello World!’
Сохраните скрипт и запустите его, нажав на кнопку «Run main» в ленте xlwings. Если вы все сделали корректно, то в ячейке A1 Excel файла должен появиться текст «Hello World!».
3.2 С использованием VBA
Создайте Excel файл, сохраните его с любым названием
в формате с поддержкой макросов
, далее в этой же
папке создайте python скрипт с таким же названием, как и Excel файл. В скрипте создайте функцию с любым названием, к примеру:
import xlwings as xw
def hello():
wb = xw.Book.caller()
wb.sheets[0].range(‘A1’).value = ‘Привет мир!!!’
Далее запустите редактор VBA и в нем пропишите следующий код:
Sub HelloWorld()
RunPython («import Excel_Xlwings; Excel_Xlwings.hello()»)
End Sub
Первая часть параметров функции (import Excel_Xlwings) указывает на название скрипта Python (Excel_Xlwings), а вторая Excel_Xlwings.hello() — на название функции в этом скрипте. Теперь выполните этот макрос, как и любой другой макрос VBA. Если сделали все правильно — то в результате в ячейке A1 Excel файла должен появиться текст «Привет мир!!!».
4. Создание пользовательских функций (UDF) в Excel при помощи Python
Как и в пункте 3.2 необходимо создать и сохранить Excel файл с поддержкой макросов, далее в той же папке, где расположен сохраненный эксель файл, создать скрипт Python и внести туда код пользовательской функции, к примеру:
import xlwings as xw
@xw.func
def double_sum(x, y):
«»»Возвращает сумму двух агрументов умноженную на 2″»»
return 2 * (x + y)
Сохраняем скрипт, далее в ленте xlwings нажимаем кнопку Import Functions для загрузки созданной функции из Python в Excel. Теперь вы можете применять эту функцию, как и другие функции Excel:

Отлично. На сегодня все. Есть вопросы — задавайте в комментариях ниже.
You all must have worked with Excel at some time in your life and must have felt the need for automating some repetitive or tedious task. Don’t worry in this tutorial we are going to learn about how to work with Excel using Python, or automating Excel using Python. We will be covering this with the help of the Openpyxl module.
Getting Started
Openpyxl is a Python library that provides various methods to interact with Excel Files using Python. It allows operations like reading, writing, arithmetic operations, plotting graphs, etc.
This module does not come in-built with Python. To install this type the below command in the terminal.
pip install openpyxl
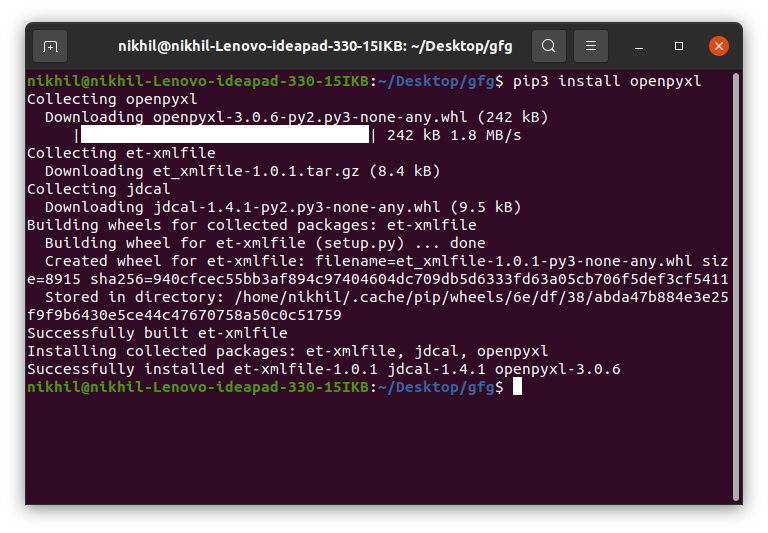
Reading from Spreadsheets
To read an Excel file you have to open the spreadsheet using the load_workbook() method. After that, you can use the active to select the first sheet available and the cell attribute to select the cell by passing the row and column parameter. The value attribute prints the value of the particular cell. See the below example to get a better understanding.
Note: The first row or column integer is 1, not 0.
Dataset Used: It can be downloaded from here.
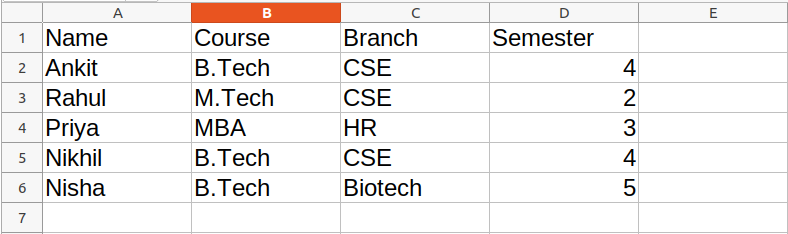
Example:
Python3
import openpyxl
path = "gfg.xlsx"
wb_obj = openpyxl.load_workbook(path)
sheet_obj = wb_obj.active
cell_obj = sheet_obj.cell(row = 1, column = 1)
print(cell_obj.value)
Output:
Name
Reading from Multiple Cells
There can be two ways of reading from multiple cells.
Method 1: We can get the count of the total rows and columns using the max_row and max_column respectively. We can use these values inside the for loop to get the value of the desired row or column or any cell depending upon the situation. Let’s see how to get the value of the first column and first row.
Example:
Python3
import openpyxl
path = "gfg.xlsx"
wb_obj = openpyxl.load_workbook(path)
sheet_obj = wb_obj.active
row = sheet_obj.max_row
column = sheet_obj.max_column
print("Total Rows:", row)
print("Total Columns:", column)
print("nValue of first column")
for i in range(1, row + 1):
cell_obj = sheet_obj.cell(row = i, column = 1)
print(cell_obj.value)
print("nValue of first row")
for i in range(1, column + 1):
cell_obj = sheet_obj.cell(row = 2, column = i)
print(cell_obj.value, end = " ")
Output:
Total Rows: 6
Total Columns: 4

Value of first column
Name
Ankit
Rahul
Priya
Nikhil
Nisha

Value of first row
Ankit  B.Tech CSE 4
Method 2: We can also read from multiple cells using the cell name. This can be seen as the list slicing of Python.
Python3
import openpyxl
path = "gfg.xlsx"
wb_obj = openpyxl.load_workbook(path)
sheet_obj = wb_obj.active
cell_obj = sheet_obj['A1': 'B6']
for cell1, cell2 in cell_obj:
print(cell1.value, cell2.value)
Output:
Name Course
Ankit  B.Tech
Rahul M.Tech
Priya MBA
Nikhil B.Tech
Nisha B.Tech
Refer to the below article to get detailed information about reading excel files using openpyxl.
- Reading an excel file using Python openpyxl module
Writing to Spreadsheets
First, let’s create a new spreadsheet, and then we will write some data to the newly created file. An empty spreadsheet can be created using the Workbook() method. Let’s see the below example.
Example:
Python3
from openpyxl import Workbook
workbook = Workbook()
workbook.save(filename="sample.xlsx")
Output:
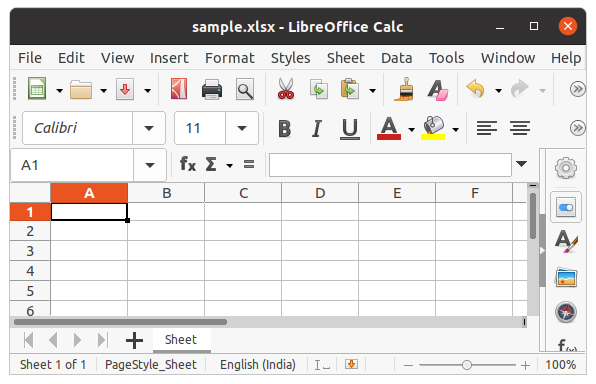
After creating an empty file, let’s see how to add some data to it using Python. To add data first we need to select the active sheet and then using the cell() method we can select any particular cell by passing the row and column number as its parameter. We can also write using cell names. See the below example for a better understanding.
Example:
Python3
import openpyxl
wb = openpyxl.Workbook()
sheet = wb.active
c1 = sheet.cell(row = 1, column = 1)
c1.value = "Hello"
c2 = sheet.cell(row= 1 , column = 2)
c2.value = "World"
c3 = sheet['A2']
c3.value = "Welcome"
c4 = sheet['B2']
c4.value = "Everyone"
wb.save("sample.xlsx")
Output:
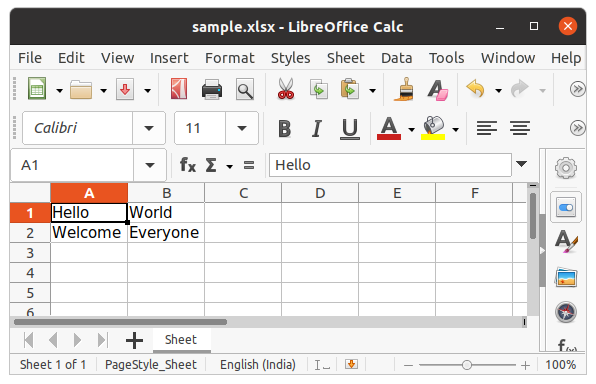
Refer to the below article to get detailed information about writing to excel.
- Writing to an excel file using openpyxl module
Appending to the Spreadsheet
In the above example, you will see that every time you try to write to a spreadsheet the existing data gets overwritten, and the file is saved as a new file. This happens because the Workbook() method always creates a new workbook file object. To write to an existing workbook you must open the file with the load_workbook() method. We will use the above-created workbook.
Example:
Python3
import openpyxl
wb = openpyxl.load_workbook("sample.xlsx")
sheet = wb.active
c = sheet['A3']
c.value = "New Data"
wb.save("sample.xlsx")
Output:
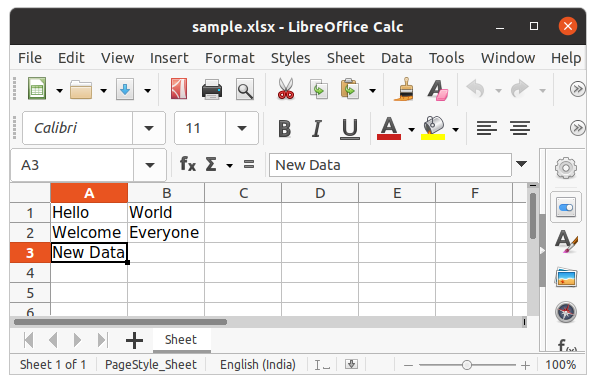
We can also use the append() method to append multiple data at the end of the sheet.
Example:
Python3
import openpyxl
wb = openpyxl.load_workbook("sample.xlsx")
sheet = wb.active
data = (
(1, 2, 3),
(4, 5, 6)
)
for row in data:
sheet.append(row)
wb.save('sample.xlsx')
Output:
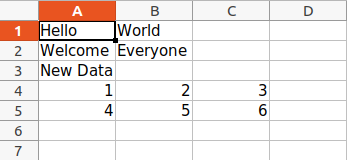
Arithmetic Operation on Spreadsheet
Arithmetic operations can be performed by typing the formula in a particular cell of the spreadsheet. For example, if we want to find the sum then =Sum() formula of the excel file is used.
Example:
Python3
import openpyxl
wb = openpyxl.Workbook()
sheet = wb.active
sheet['A1'] = 200
sheet['A2'] = 300
sheet['A3'] = 400
sheet['A4'] = 500
sheet['A5'] = 600
sheet['A7'] = '= SUM(A1:A5)'
wb.save("sum.xlsx")
Output:
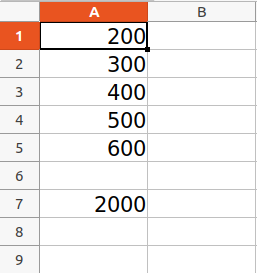
Refer to the below article to get detailed information about the Arithmetic operations on Spreadsheet.
- Arithmetic operations in excel file using openpyxl
Adjusting Rows and Column
Worksheet objects have row_dimensions and column_dimensions attributes that control row heights and column widths. A sheet’s row_dimensions and column_dimensions are dictionary-like values; row_dimensions contains RowDimension objects and column_dimensions contains ColumnDimension objects. In row_dimensions, one can access one of the objects using the number of the row (in this case, 1 or 2). In column_dimensions, one can access one of the objects using the letter of the column (in this case, A or B).
Example:
Python3
import openpyxl
wb = openpyxl.Workbook()
sheet = wb.active
sheet.cell(row = 1, column = 1).value = ' hello '
sheet.cell(row = 2, column = 2).value = ' everyone '
sheet.row_dimensions[1].height = 70
sheet.column_dimensions['B'].width = 20
wb.save('sample.xlsx')
Output:
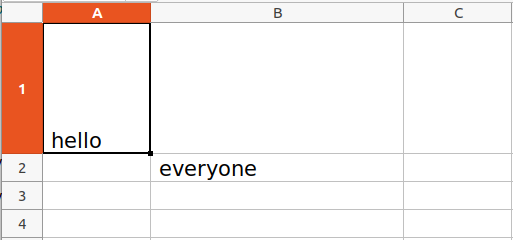
Merging Cells
A rectangular area of cells can be merged into a single cell with the merge_cells() sheet method. The argument to merge_cells() is a single string of the top-left and bottom-right cells of the rectangular area to be merged.
Example:
Python3
import openpyxl
wb = openpyxl.Workbook()
sheet = wb.active
sheet.merge_cells('A2:D4')
sheet.cell(row = 2, column = 1).value = 'Twelve cells join together.'
sheet.merge_cells('C6:D6')
sheet.cell(row = 6, column = 6).value = 'Two merge cells.'
wb.save('sample.xlsx')
Output:
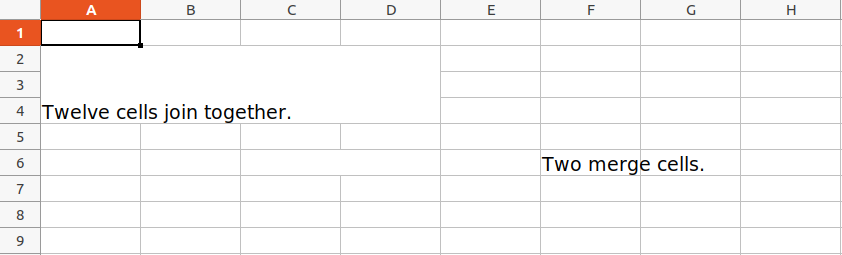
Unmerging Cells
To unmerge cells, call the unmerge_cells() sheet method.
Example:
Python3
import openpyxl
wb = openpyxl.load_workbook('sample.xlsx')
sheet = wb.active
sheet.unmerge_cells('A2:D4')
sheet.unmerge_cells('C6:D6')
wb.save('sample.xlsx')
Output:
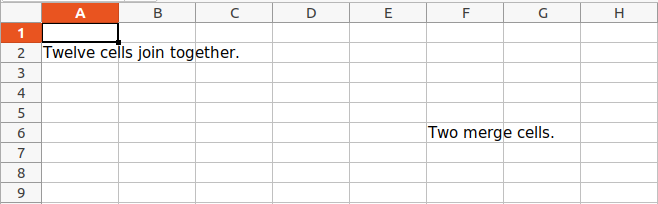
Setting Font Style
To customize font styles in cells, important, import the Font() function from the openpyxl.styles module.
Example:
Python3
import openpyxl
from openpyxl.styles import Font
wb = openpyxl.Workbook()
sheet = wb.active
sheet.cell(row = 1, column = 1).value = "GeeksforGeeks"
sheet.cell(row = 1, column = 1).font = Font(size = 24 )
sheet.cell(row = 2, column = 2).value = "GeeksforGeeks"
sheet.cell(row = 2, column = 2).font = Font(size = 24, italic = True)
sheet.cell(row = 3, column = 3).value = "GeeksforGeeks"
sheet.cell(row = 3, column = 3).font = Font(size = 24, bold = True)
sheet.cell(row = 4, column = 4).value = "GeeksforGeeks"
sheet.cell(row = 4, column = 4).font = Font(size = 24, name = 'Times New Roman')
wb.save('sample.xlsx')
Output:
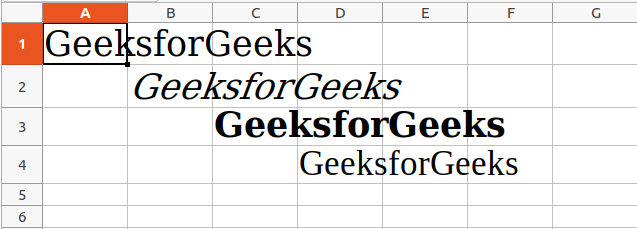
Refer to the below article to get detailed information about adjusting rows and columns.
- Adjusting rows and columns of an excel file using openpyxl module
Plotting Charts
Charts are composed of at least one series of one or more data points. Series themselves are comprised of references to cell ranges. For plotting the charts on an excel sheet, firstly, create chart objects of specific chart class( i.e BarChart, LineChart, etc.). After creating chart objects, insert data in it, and lastly, add that chart object in the sheet object.
Example 1:
Python3
import openpyxl
from openpyxl.chart import BarChart, Reference
wb = openpyxl.Workbook()
sheet = wb.active
for i in range(10):
sheet.append([i])
values = Reference(sheet, min_col=1, min_row=1,
max_col=1, max_row=10)
chart = BarChart()
chart.add_data(values)
chart.title = " BAR-CHART "
chart.x_axis.title = " X_AXIS "
chart.y_axis.title = " Y_AXIS "
sheet.add_chart(chart, "E2")
wb.save("sample.xlsx")
Output:

Example 2:
Python3
import openpyxl
from openpyxl.chart import LineChart, Reference
wb = openpyxl.Workbook()
sheet = wb.active
for i in range(10):
sheet.append([i])
values = Reference(sheet, min_col=1, min_row=1,
max_col=1, max_row=10)
chart = LineChart()
chart.add_data(values)
chart.title = " LINE-CHART "
chart.x_axis.title = " X-AXIS "
chart.y_axis.title = " Y-AXIS "
sheet.add_chart(chart, "E2")
wb.save("sample.xlsx")
Output:

Refer to the below articles to get detailed information about plotting in excel using Python.
- Plotting charts in excel sheet using openpyxl module | Set 1
- Plotting charts in excel sheet using openpyxl module | Set 2
- Plotting charts in excel sheet using openpyxl module | Set 3
Adding Images
For the purpose of importing images inside our worksheet, we would be using openpyxl.drawing.image.Image. The method is a wrapper over PIL.Image method found in PIL (pillow) library. Due to which it is necessary for the PIL (pillow) library to be installed in order to use this method.
Image Used:

Example:
Python3
import openpyxl
from openpyxl.drawing.image import Image
wb = openpyxl.Workbook()
sheet = wb.active
sheet.append([10, 2010, "Geeks", 4, "life"])
img = Image("geek.jpg")
sheet.add_image(img, 'A2')
wb.save('sample.xlsx')
Output:
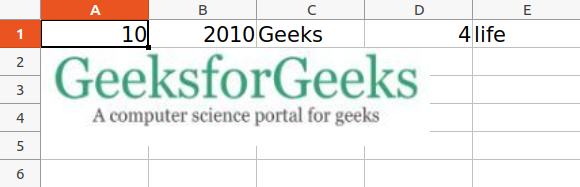
Refer to the below article to get detailed information about adding images.
- Openpyxl – Adding Image
Some More Functionality of Excel using Python
- How to delete one or more rows in excel using Openpyxl?
- Trigonometric operations in excel file using openpyxl
- How to copy data from one excel sheet to another
- How to Automate an Excel Sheet in Python?