
Data from SAP to MS Office Applications

Using the connection SAP with MS Office, users spreads data from SAP application to right within Microsoft Office desktop applications, including Excel, Outlook, Word and Power point.
With the SAP-MS Office connectivity, end-users can interact with SAP transactions directly within their Excel spreadsheet, their Outlook e-mail screen, and their Word documents and on their Power point presentations.
Here we have a simple application to connect SAP with MS-office tool’s Excel.
But before that……Why? How? And Use!
Why Data from SAP to MS Office Applications

In spite of large moneys in SAP, most business users continue to be unsatisfied with it because data from SAP is not easily accessible in their favorite desktop productivity tools — Microsoft Excel, Microsoft Outlook and Microsoft Word. Since Microsoft Office Applications are not connected to SAP, users are forced to
- Use error-prone cut-copy-paste to populate their Excel spreadsheets.
- Switch screens from Outlook to gather data and take decisions as they respond to e-mails.
- Manually update data from Excel Spreadsheets to enterprise applications.
Benefits of Data from SAP to Microsoft Office Applications
SAP-MS Office Connectivity extends data from SAP to Microsoft Excel, Microsoft Outlook and Microsoft Word using a SOA based Information Delivery Server and Microsoft Office Add-ins, and provides the following benefits
- Eliminates cut-and-paste based data collecting mechanism from SAP to Microsoft Excel.
- Enables users to get real-time data from SAP within Excel with a single-click Refresh.
- Enables users to query and update SAP transactions from within Outlook screens.
- Allows the users to update SAP from within Excel, Outlook and Word.
- Avoids any data-integrity issues with copying and reduces compliance issues.
Who Benefits
- Production and Logistics Managers who want to create Excel reports from latest SAP data.
- Managers who want to track projects and status automatically as they receive status e-mails.
- Analysts who want to combine data from SAP and other enterprise data stores for budgeting purposes.
Example:

Here is the main part comes up. We shall take simple scenario for SAP with MS Excel connectivity. So let’s begin!!
Just before start, I would like to give little overview on what we are actually going to do. So, here are the scenarios!!
Excel File Scenarios
- Create a MS excel file for user input.
- Create user interface in excel sheet to input data for the customer master and output cells.
- Apply VB code to make connection with SAP.
- Read the input data for customer master from the excel file sheet.
- Fetch data from SAP using connection code from SAP.
- Display output within excel sheet itself.
SAP Scenarios
- Create a function module in ABAP that is “Remote Enabled”.
- Create IMPORT, EXPORT and TABLES parameters as per requirement from MS excel.
- Write logic to display customer master details based on input from Excel file.
- Activate the function module.
Well……………“A picture says thousand words”. So, let’s begin!
MS Excel – User Interface
First of all, lets create MS excel file with customer master input. We shall create simple selection screen for user input.

Well……filling cell values are simple here but how to add buttons (Get Address and Reset Output) here? This was also new in my case since new version of MS office.
Just follow following steps for this:
Click MS office button and select “Excel Options” button from the menu.

You will see here a new tab named “Developer”

Click on “Insert” and then select “Button” from the form control. Later on you can double click on the button and set its properties (Caption, Color, etc.)
Congratulations! Our input screen is finished here. Let’s design our output screen now.

I have created my output screen just after the input screen. You can create anywhere in the excel file. Here terms ‘anywhere’ descries to other worksheet also.
The output screen is simple as you see. Nothing much to do here. I just simple colored the cells for better look.
Great! Looks like we finished user interface here. (Did we miss something…’Naah’ for now!)
SAP – Select Data
Since we are taking simple example to fetch detail from customer master, let’s create a function module for it.
Create a function module.

Enter function group and Short text.

Make sure your function module is “Remote Enabled”.

Now let’s create “Tables” parameters:

Here we have two “Tables” parameters
- ET_KUNNR (Input) : Customer numbers pass in to the function module
- ET_CUST_LIST (Output): Data will be fetched in function module and display on the excel sheet.
- Note: We have created a Z structure (ZNM_CUST_LIST) for the output list. Here are the fields for the structure:

We are all set with input and output structures.
Now, let’s fetch the data. Here is the only coding part came up in SAP. Look at below screen.

Here, we are selecting all the customer details from the KNA1 (customer master) table from the input table (ET_KUNNR) from excel file and return to the table (ET_CUST_LIST).
Now we have all the records in the table ET_CUST_LIST.
So, again congratulation friends! You have completed most of the things. The remaining step now is to display the list in the excel file.
Let’s now connect the SAP and MS Excel.
Go to the ‘Developer’ tab and click on “Visual Basic” icon.

The VB editor will be opened and we are going to write the code for connection of excel and SAP with sending and receiving data.
Here is the variable declaration list. These are the global variables. Let’s understand each of them.

|
Variable |
Description |
|
objBAPIControl |
For creating object to access SAP functions. |
|
objgetaddress |
To make BAPI function call via objBAPIControl. |
|
vLastRow |
Last row of output list |
|
vRows |
Total number of records returned from the SAP |
|
vcount_add |
Variable for increment records |
|
Index_add |
Variable for next record (Index) |
|
objaddress |
Object for SAP table (for customer master output) |
|
objkunnr |
Object for SAP table (for customer master input) |
|
Variable |
Description |
|
LogonControl |
Logon control is to make login in SAP. |
|
R3Connection |
Ro make connection to SAP R/3 using logon control. |
|
retcd |
Return Code |
|
SilentLogon |
If ‘True’ no popup will ask to enter SAP login details |
Here are the properties for the “Get Address” button.

Let’s code when “Get Address” button is clicked.
Setup the local variables
Private Sub GetAddress_Click()
Now let’s setup the connection with SAP R/3 using following code.

Let’s do SAP Login here.

Perfect!! We have made the connection with SAP R/3. Now we are able to send and receive the data from MS Excel to SAP R/3 and vice versa.
But how to send my customer details and receive? Hmmm…..we need to use internal tables those are created in SAP function module. (Do you remember?….NO?… checkout Tables parameters in function ZNM_GET_CUSTOMER_DETAILS). So, let’s do this.

Here, ZNM_GET_CUSTOMER_DETAILS is our function module created in SAP.
ET_KUNNR: Customer details input details
ET_CUST_LIST: Customer output details.

We are reading here each cell from excel worksheet for input.

Here we have called the FM and passed the input details to process.
Result:

vcount_add returns total number of records from the SAP. And we have already set the loop to display records in the cells.
Here, R3Connection.Logoff is to sign off from your SAP account.
Here is the output screen:

Wow!! We have output result. Good job!! But what is the use of another button “Reset Output” here? Yes…good question.
The “Reset Output” button will clear all the data and messages from the screen. Look at below code:
———————————————————————————————————————–
Now we have completed the entire example here. N’ joy.
Here is the entire code:
SHEET1:
Option Explicit
Private LogonControl As SAPLogonCtrl.SAPLogonControl
Private R3Connection As SAPLogonCtrl.Connection
Private TableFactory As SAPTableFactory
Public Functions As SAPFunctionsOCX.SAPFunctions
Dim objBAPIControl, objgetaddress As Object
Dim vLastRow, vRows As Integer
Dim vcount_add, index_add As Integer
Dim rng As Range
Public objaddress, objkunnr As SAPTableFactoryCtrl.Table
MODULE:
Sub GetAddress_click()
Dim retcd As Boolean
Dim SilentLogon As Boolean
‘ Set Connection
Set LogonControl = CreateObject(“SAP.LogonControl.1”)
Set objBAPIControl = CreateObject(“SAP.Functions”)
Set R3Connection = LogonControl.NewConnection
R3Connection.Client = “700”
R3Connection.ApplicationServer = “”
R3Connection.Language = “EN”
R3Connection.User = “”
R3Connection.Password = “”
R3Connection.System = “”
R3Connection.SystemNumber = “”
R3Connection.UseSAPLogonIni = False
SilentLogon = False
retcd = R3Connection.Logon(0, SilentLogon)
If retcd <> True Then MsgBox “Logon failed”: Exit Sub
objBAPIControl.Connection = R3Connection
Set objgetaddress = objBAPIControl.Add(“ZNM_GET_EMPLOYEE_DETAILS”)
Set objkunnr = objgetaddress.Tables(“ET_KUNNR”)
Set objaddress = objgetaddress.Tables(“ET_CUST_LIST”)
Dim sht As Worksheet
Set sht = ThisWorkbook.ActiveSheet
‘ Changes for the Loop
‘Dim int1 As Integer
‘Do While sht.Cells(int1, 2).Value <> ” “
‘ Changes for the Loop End
If sht.Cells(6, 2).Value <> ” ” Then
‘If ThisWorkbook.ActiveSheet.Cells(6, “B”).Value <> ” ” Then
‘objkunnr.Rows.Add objkunnr.Value(1, “SIGN”) = ThisWorkbook.ActiveSheet.Cells(6, 2).Value
objkunnr.Rows.Add
objkunnr.Value(1, “SIGN”) = sht.Cells(6, 2).Value
‘objkunnr.Value(1, “OPTION”) = ThisWorkbook.ActiveSheet.Cells(6, 3).Value
objkunnr.Value(1, “OPTION”) = sht.Cells(6, 3).Value
‘objkunnr.Value(1, “LOW”) = ThisWorkbook.ActiveSheet.Cells(6, 4).Value
objkunnr.Value(1, “LOW”) = sht.Cells(6, 4).Value
‘objkunnr.Value(1, “HIGH”) = ThisWorkbook.ActiveSheet.Cells(6, 5).Value
objkunnr.Value(1, “HIGH”) = sht.Cells(6, 5).Value
‘End If
End If
returnfunc = objgetaddress.call
If returnfunc = True Then
vcount_add = objaddress.Rows.Count
For index_add = 1 To vcount_add
vRows = 11 + index_add
sht.Cells(vRows, 2) = objaddress.Value(index_add, “KUNNR”)
sht.Cells(vRows, 3) = objaddress.Value(index_add, “LAND1”)
sht.Cells(vRows, 4) = objaddress.Value(index_add, “NAME1”)
sht.Cells(vRows, 5) = objaddress.Value(index_add, “ORT01”)
sht.Cells(vRows, 6) = objaddress.Value(index_add, “PSTLZ”)
sht.Cells(vRows, 7) = objaddress.Value(index_add, “REGIO”)
sht.Cells(vRows,  = objaddress.Value(index_add, “KTOKD”)
sht.Cells(vRows, 9) = objaddress.Value(index_add, “TELF1”)
sht.Cells(vRows, 10) = objaddress.Value(index_add, “TELFX”)
Next index_add
End If
‘ If address not exist then Show error
If vcount_add = “” Then
sht.Cells(10, 11) = “Invalid Input”
Else
‘ ActiveSheet.Cells(10, 12) = “BAPI Call is Successfull”
‘ ActiveSheet.Cells(11, 12) = vcount_add & “rows are entered”
sht.Cells(10, 12) = “BAPI Call is Successfull”
sht.Cells(11, 12) = vcount_add & ” rows are entered”
End If
R3Connection.Logoff
End Sub
COMMON ERROR: User defined Type not defined

So…let’s try to remove the one. As our friends have posted solutions, here are the steps to avoid the error.
1. Go to your VBA Project and Select Tool –> References.

2. “References” window will be opened as below.

3. Select “Browse…” and select .OCX files for Active X control from below path. (SAP GUI 7.3 already installed on my machine)

4. Select wdtaocxU.ocx, wdtfuncU.ocx, wdtlogU.ocx files from the
location.Add wdobapiU.ocx if you are needed.

5. Make your references are selected. Press OK. And save.

6. That’s it.
Содержание
- SAP Analytics Cloud planning with Microsoft Excel
- Problem definition:
- Technical Solution:
- Outlook:
- Connect MS-Excel to SAP HANA Database/Analysis in excel with HANA data
- Access SAP Data Warehouse Cloud with SAP’s Microsoft Excel add-ins
- Access SAP Data Warehouse Cloud with SAP Analytics Cloud, add-in for Microsoft Office:
- Access SAP Data Warehouse Cloud with SAP Analysis for Microsoft Office 2.8 SP14:
SAP Analytics Cloud planning with Microsoft Excel
 In this article, I would like to describe the use of the SAP Analytics Cloud within Office 365. Even though the web browser is the central strategic user interface of SAP Analytics Cloud, Microsoft Excel can be used very well with the SAP Analytics Cloud Microsoft Excel Add-in for data analysis and planning.
Problem definition:
In the area of planning and forecasting, for example in sales planning or also in cost planning, the typical business user will often have the option of using Microsoft Excel for data analysis and planning data collection. Especially in controlling, Excel is often used as a user interface. The handling of Excel is often familiar to business users and offers a variety of possibilities to integrate additional site calculations into the plan data collection process.
Technical Solution:
SAP Analytics Cloud already provides a Microsoft Excel Add-in for Office 365 which can be used within on-premises Excel as well- as in online web-based Excel. Data entry and planning can be done directly in Excel with an online connection to the used SAP Analytics Cloud tenant as well as offline planning. With the SAP Analytics Cloud product update in Q1/2022 a new SAP Analytics Cloud Excel formula SAP.GETDIMENSIONFILTER was implemented. This formula enriches the existing functionality and allows the display and setting of a table filter directly from the Microsoft Excel worksheet for any dimension or property. Now it is possible to use cell-based formulas to retrieve or set dedicated filters on a dimension’s members from an SAP Analytics Cloud grid in Microsoft Excel. The result is a simple and quick report change with dedicated filters for the members of a dimension that can be retrieved and set directly in the grid using a native Microsoft Excel formula.

SAP Analytics Cloud Microsoft Excel Add-in for Office365
By using the Excel Add-In a new toolbar is available which allows the user to sign in at a SAC tenant. In addition, it is possible to add tables into the excel sheet, as well as write back values to the SAC data source. Furthermore, the “Designer Panel” can be used to control, steer, and filter the dimensions which are displayed within the grid.

Sign in and Add Table dialog in SAP Analytics Cloud Excel
The used excel sheets can be modified with all Excel capabilities like inserting picture, logos, and pictograms etc.

Data Source table selection dialog
To add a new table into the sheet the “Add Table” dialog can be used. Now the data models inside the connected SAP Analytics cloud tenant can be selected and inserted into the excel sheet.

SAP Analytics Cloud table on a excel sheet
During the insert process the position of a table can be selected at any cell on the sheet. Within the “Designer Panel”, the dimension of the data model can be added to the rows and columns. Additional it is possible to filter on elements, on hierarchies, display and property option can be used as well. With clicks direct on the elements in the table it is possible to expand or to collapse the dimension and to filter it in the designer panel.
To have more flexibility and user-friendly selection possibilities inside the used dimension it is possible to use SAP Analytics Cloud Excel formula like: SAP.GETDIMENSIONFILTER, SAP.GETDIMENSIONS and SAP.GETTABLENAME. In the following it will be described how to use these SAP Analytics Cloud Excel formulas. An overview about the new formulas can be found here:

The first step after inserting a data table is to add the SAP Analytics Cloud Excel formula SAP.GETTABLENAME. For this purpose, a cell can be selected and with insert function SAP.GETTABLENAME a dialog opens to select a cell inside the used SAP Analytics Cloud table. The input parameter for the SAP.GETTABLENAME formula is a Cell, enter a cell that is part of the table.

As a result, the formula returns the name of the selected table which can be used as an input parameter for the formula SAP. GETDIMENSIONS.

This function returns all dimensions which are used in the SAP Analytics Cloud model which is used as the data source for the selected table. The input parameter for the SAP.GETDIMENSIONS formula is a Table: Enter the table name (result of formula SAP.GETTABLENAME), Display: specify how the dimensions are displayed in the sheet. You have the following options: 0 for ID, 1 for description, 2 for ID and description (default), 3 for description and ID, 4 for full ID. Orientation: Specify the orientation of the list, 0 for vertical (default), 1 for horizontal, if both, ID and description, are displayed, the results are displayed accordingly in 2 rows or 2 columns. Sort_order: Specify the sorting order of the dimensions, 0 for no sorting (default), 1 for ascending sorting, 2 for descending sorting.

SAP.GETDIMENSIONS dialog result
The result will be a list of all used dimensions in the related data model like shown in the picture above. The name of the dimension and the name of the table can be used for the formula SAP.GETDIMENSIONFILTER.
This formula can be used as a filter for the related dimension to steer the content of the table. Best practice is to select a cell in which the formular should be used on top of the table. Doing it like this it is very easy for the business user to filter directly by clicking the cell which includes the formula SAP.GETDIMENSIONFILTER.

The input parameters for the formular are the following: Table, Enter the table name. Dimension, Enter the dimension name. Member_display, specify how the members of the dimension are displayed in the sheet. You have the following options: 0 for ID, 1 for description, 2 for ID and description (default), 3 for description and ID, 4 for full ID. Selection_display, Specify the selection display: 0 for ID, 1 for description, 2 for ID and description, 3 for description and ID, 4 for display nothing (default). Orientation, Specify the orientation of the list: 0 for vertical (default), 1 for horizontal, if both, ID and description, are displayed, the results are displayed accordingly in 2 rows or 2 columns. Separator, Enter the separator you want to use between ID and description.

Now the function SAP.GETDIMENSIONFILTER returns the filter for a dimension and an icon to open the filter dialog from the sheet. The cell with the formula contains a pencil symbol as well as displayed in front of the dimensions name. When the clicks on the symbol, the “Member Selector” menu will open. The user can set filters within the “Member Sector” menu.

Member Selector dialog
Now it is possible to do the member selection for every dimension which is used for the data in the table with the SAP.GETDIMENSIONFILTER and the “Member Selector” menu. The selection is possible for dimensions that are displayed in the rows and columns as well as for those that are included in the model but are only used as filters for the table.

SAP Analytics Cloud with multiple Member Selector
If all the needed “Member Selector” formulas are included, the not needed rows and columns can be hidden to brighten up the excel sheet to provide a better user experience.

SAP Analytics Cloud excel data entry sheet
With this SAP Analytics Cloud excel sheet it is now possible to easily analyze data and is also possible to do business planning by entering data. This can be done on aggregated and granular level directly into the planning data model inside SAP Analytics Cloud. The member selection can be done within the member selection dialog based on the cells with the SAP.GETDIMENSIONFILTER formula as well with the Designer panel by entering the values directly into the table, it is possible to write back directly into the SAP analytics Cloud model. Additional it is possible to use secondary or side calculations to link the results into any cell of the table. By this approach it is possible to write back calculated values, what is often wished by business user in the controlling department.
Outlook:
The write back function is always possible if there exists an online connection to the SAC Analytics Cloud tenant. By using that method, it is also possible to realize an offline planning process by linking data entry values to the SAP Analytics Cloud excel table. By this way it is possible to change values which are linked to the table and write back to the SAP Analytics Cloud tenant when the online connection is re-established. A perfect approach to stay productive when traveling and to write back if internet access is available again.
Источник
Connect MS-Excel to SAP HANA Database/Analysis in excel with HANA data
SAP HANA is a high-performance in-memory database that accelerates data-driven, real-time decision-making and actions and supports all workloads with the broadest advanced analytics on multi-model data, on premise and in the cloud. We all know that the HANA is a database technology which provides data to the users very fast.
On the other hand, MS Excel is one of the most widely used data representation, analysis and reporting software of all time and still it is one of the most important software used throughout the world.
We can extend the capabilities of Excel’s by connecting it to SAP HANA which provides real-time data access. Here in this post we are going to discuss how we can utilize the capabilities of MS Excel with HANA.
We will be using MDX Provider to bridge the connection between HANA Database and Excel.
Step 1: Download and install the MDX Provider from SAP Support Portal.
Before downloading confirm your version of the Excel 32 bit/64 bit.
Link: https://launchpad.support.sap.com/#/softwarecenter/support/index


Step 2: Select the connection type in MS-Excel.
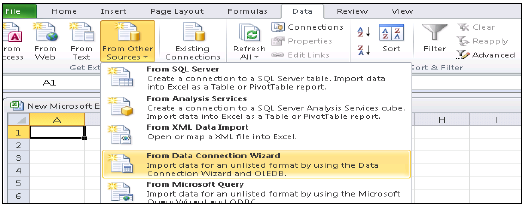
Open the MS Excel . Go to the Data tab. Then select From Other Sources option. From the drop-down list, select From Data Connection Wizard.

Step 3: Select the data provider type
Select Other/Advanced option from the Data Connection Wizard dialog and click Next.

Step 4: Select the data provider
Select the data provider as SAP HANA MDX Provider from the given list. Then, click on Next>>.
Step 5: Enter connection properties
Enter connection parameters specific to SAP HANA user account like Host name, Instance number, User name, Password, and Preferred language. You can instantly test a connection from this dialog by clicking on the Test Connection option.
A message will prompt confirming a successful connection that says, “Test Connection Succeeded”. Click on OK to continue.
Note: Make sure the checkbox multi database and user database is ticked.

Step 6: Select view and create chart

Once the connection established you will be able to see the package and there views built through the HANA Studio.
Choose the object which is required for your analysis and use chart or any other excel features to represent your data.
Note: Slow internet connection may throw connection error.
There is no doubt SAP has provided us lots of resources and features to make our business easy and simplified.
I will be here to answer all your questions in case you find any issue.
Источник
Access SAP Data Warehouse Cloud with SAP’s Microsoft Excel add-ins
With SAP Analysis for Microsoft Office and SAP Analytics Cloud, add-in for Microsoft Office, SAP is providing two solutions to plan and analyze data in a familiar Excel interface.
SAP Analytics Cloud, add-in for Microsoft Office with its smooth deployment and cross-platform support has already access to SAP Data Warehouse Cloud datasets since Q4 2021. This helps to combine planning models in SAP Analytics Cloud with any actuals from SAP Data Warehouse Cloud. With the latest release this April there is also prompt support.
To support customers with their transition to the cloud, SAP Analysis for Microsoft Excel workbooks can be enriched with SAP Data Warehouse Cloud data from version 2.8 SP14.
Access SAP Data Warehouse Cloud with SAP Analytics Cloud, add-in for Microsoft Office:
Just connect to your SAP Analytics Cloud tenant and choose the SAP Data Warehouse Cloud Live connection as described here. With the April 2022 release you will get the new prompt dialog automatically:

Access SAP Data Warehouse Cloud with SAP Analysis for Microsoft Office 2.8 SP14:
Both editions (see differences for each license on PAM page 6) of SAP Analysis for Microsoft Office support direct access to SAP Data Warehouse Cloud.
Insert a new data source for analysis. In the connection dialog tree view, there is a new connection type SAP Data Warehouse Cloud. Via right-click create a new connection and maintain description and URL of the tenant.

After the successful logon with the SAP Data Warehouse Cloud user, the search for analytical datasets opens:
- The user is able to search for description or technical name of the dataset. Also, the direct search can be used to search for all datasets in a certain space
- The area tab lists all assigned spaces with its analytical datasets
Select the dataset, maintain possible prompts, and start analyzing as usual:

- The preferred platform must be selectable to see the new SAP Data Warehouse Cloud connection type
- Going forward we are switching the embedded Internet Explorer based logon to the default browser of the machine. This setting UseExternalBrowserForDwcLogon is already available, but by default deactivated until the changes are released on all SAP BTP landscapes. With SP17 this setting will become default (added on Feb 3, 2023)
- Analysis for Office only supports Analytical Datasets. Analytic Models are not supported. See Note 3297935(added on Feb 3, 2023)
- Further info and limitations are listed on the SAP Help page
Источник
SAP BusinessObjects Analysis for Microsoft Office, версия 2.3 не только унаследовала большинство функций BEx Analyzer, но и значительно расширила область их применения, упрощая работу конечных пользователей. В этой статье рассматриваются библиотека формул и библиотека интерфейсов прикладного программирования (Application Programming Interface; API) SAP — два инструмента, которые расширяют функциональность макросов языка программирования Microsoft Excel Visual Basic for Applications (VBA) и позволяют эффективнее использовать данные.
Ключевые понятия
SAP BusinessObjects Analysis for Microsoft Office, версия 2.3 содержит библиотеку формул SAP и библиотеку API [интерфейсов прикладного программирования] SAP, с помощью которых аналитики могут проводить более подробный анализ данных и метаданных и получать более значимые результаты. Библиотека API существует уже несколько десятилетий.
Профессиональные пользователи Excel, например, аналитики, зачастую имеют богатый опыт работы с библиотекой формул Microsoft Excel. Библиотека формул SAP расширяет возможности пользователей. Зачем она нужна? Ответ прост: формулы Microsoft Excel выполняют общие функции, тогда как формулы SAP BusinessObjects Analysis for Microsoft Office используются для получения максимума информации из функций, данных и метаданных SAP. Кроме того, комбинируя формулы SAP с исходными формулами Microsoft Excel, вы можете усилить возможности SAP BusinessObjects Analysis for Microsoft Office.
Примечание.
Полный список формул, API и макросов содержится в руководстве пользователя SAP BusinessObjects Analysis for Microsoft Office: http://help.sap.com/businessobject/product_guides/AMicrosoft23/en/23SP2_analysisplugin_user_en.pdf.
Интегрируйте формулы и API в ракурс анализа и преобразовывайте запросы в самостоятельные приложения, настраиваемые в соответствии с информационными, аналитическими потребностями и требованиями к формату. Мы рассмотрим сценарии использования библиотек формул и API SAP BusinessObjects Analysis for Microsoft Office. После этого вы сможете полностью раскрыть потенциал библиотек.
Введение
Запустите приложение SAP BusinessObjects Analysis for Microsoft Office и в знакомом интерфейсе электронных таблиц Excel перейдите на вкладку «Формулы» (Formulas) (рисунок 1). Поместите курсор в пустую ячейку электронной таблицы и нажмите кнопку «Вставить функцию» (Insert Function).
Рис. 1. Кнопка «Вставить функцию» (Insert Function)
Откроется окно с полным списком функций (рис. 2).
Рис. 2. Выбор функции для вставки на лист
Возникает вопрос: как узнать, какие функции относятся к SAP? В раскрывающемся списке «Категория» (Or select a category) выберите вариант « Analysis « (рис. 3). В поле «Выберите функцию» (Select a function) ниже откроется список всех функций SAP BusinessObjects Analysis for Microsoft Office.
Рис. 3. Список формул SAP
Выберите нужную формулу и нажмите кнопку «OK».
Примечание. Руководство по использованию конкретных формул см. в справке: выберите нужную формулу и нажмите ссылку «Справка по этой функции» (Help on this function) в правой нижней части окна (рис. 3). Ссылка открывает справку по параметрам ввода и ожидаемым результатам. Обычно приводится пример. Если вы впервые используете формулы или SAP BusinessObjects Analysis for Microsoft Office в целом, справка по функциям поможет изучить их.
Расширение запросов с помощью SAP BusinessObjects Analysis for Microsoft Office
Рассмотрим, как использовать некоторые из функций для расширения запросов.
Примечание.
Пример запроса для данной статьи создан на основе стандартного инфокуба SAP BW Business Content 0FIAR_C05. Он находится в инфообласти бухгалтерии дебиторов (Accounts Receivable) модуля Финансов и содержит историю платежей модуля Финансов.
Формула SAPGetInfoSource
В формулу необходимо ввести два параметра: псевдоним/имя источника данных и свойство, значение которого необходимо узнать. В результате вы получите значение свойства. Однако можно получить лишь одно значение за один вызов формулы. В примере сценария в таблице создана пользовательская область, названная «Общие данные запроса» (Query General Information) (рис. 4). Также приводится описание каждого из четырех свойств или полей, значения которых нужно определить с помощью этой формулы.
Рис. 4. Таблица SAP BusinessObjects Analysis for Microsoſt Offi ce с областью общих данных запроса
Следующий шаг: заполните ячейку рядом с ячейкой «Источник запроса» (Query Source), используя формулу SAPGetInfoSource. Поместите курсор в ячейку рядом с полем «Источник запроса» (Query Source). (рис. 4). Вернитесь к списку функций SAP, показанному на рис. 3, и выберите функцию для ячейки. В этом примере мы выбираем SAPGetInfoSource. После выбора функции откроется окно с запросом на ввод входных данных (рис. 5). Введите значение источника данных (по умолчанию, «DS_1») и имя свойства, затем нажмите кнопку «OK». Отобразится значение технического имени инфопровайдера (рис. 6).
Рис. 5. Ввод значений «Источник данных» (Data Source) и «Имя свойства» (Property Name) с помощью формулы
Оформите подписку sappro и получите полный доступ к материалам SAPPRO
Оформить подписку
У вас уже есть подписка?
Войти
Microsoft Excel считается наиболее распространенным инструментом отчетности и анализа BI во многих организациях. Бизнес-менеджеры и аналитики могут подключить его к базе данных HANA для построения сводных таблиц и диаграмм для анализа.
Подключение MS Excel к HANA
Откройте Excel и перейдите на вкладку «Данные» → из других источников → нажмите «Мастер подключения к данным» → «Другое / Дополнительно» и нажмите «Далее» → Откроется окно свойств ссылки на данные.
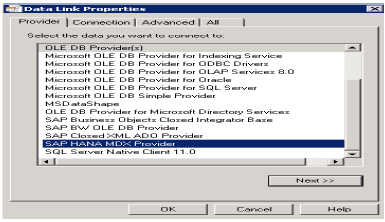
Выберите провайдера SAP HANA MDX из этого списка, чтобы подключиться к любому источнику данных MDX → Введите сведения о системе HANA (имя сервера, экземпляр, имя пользователя и пароль) → нажмите «Проверить соединение» → «Соединение установлено» → «ОК».
Это даст вам список всех пакетов в выпадающем списке, которые доступны в системе HANA. Вы можете выбрать информационное представление → нажмите Далее → Выбрать сводную таблицу / другие → OK.
Все атрибуты из информационного представления будут добавлены в MS Excel. Вы можете выбрать различные атрибуты и показатели для отчета, как показано, и вы можете выбрать различные диаграммы, такие как круговые диаграммы и гистограммы, из варианта дизайна вверху.
Unfortunately, at the end of every IT project there is little budget left for training. After a new tool has been introduced, the users are left alone to figure out how to work with it.
These 18 helpful SAP Analysis for Microsoft Office tricks will make your work easier:
- Free characteristics
- Filtering
- Unhide columns
- Repeat members
- Display keys
- Hide or show totals
- Sort
- Change prompt values
- Use value help
- Add line in prompt
- Add lines using filter by member
- Explicit selection
- Copy prompt selections from Excel
- Show master data in the value help
- Save variant
- To previous saved state
- To previous consistent client state
- Disable reset
Some are basic, others more sophisticated—but they all are meant to kickstart your SAP Analysis for Microsoft Office usage. With them, you can make the most of your reports and get the insights required to succeed in your job.
1 Free Characteristics
To this day, I am surprised most users are not taught this basic feature. Free characteristics enable you to enhance your analysis, go into more detail, and get new insights from your data.
Let’s consider the following example. The initial drilldown of the report displays company codes and product categories.
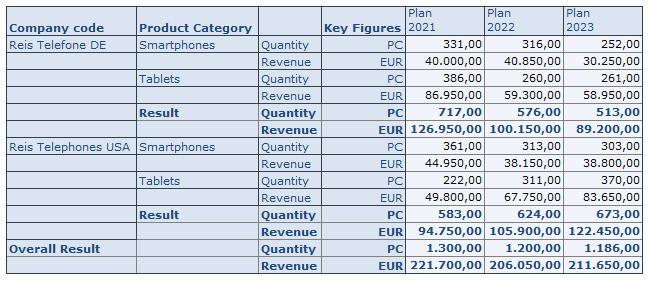
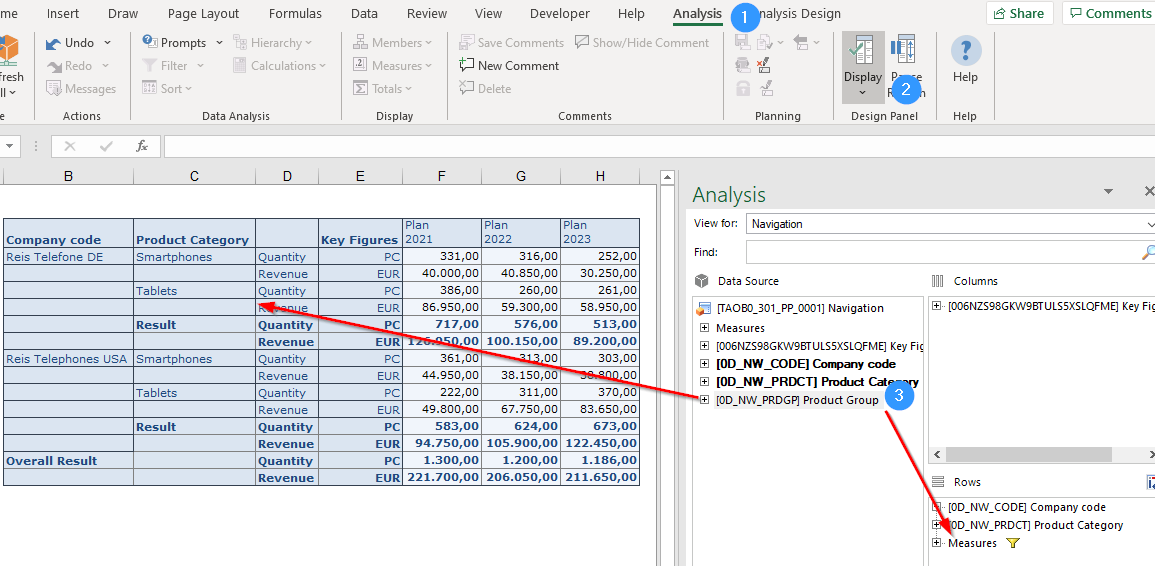
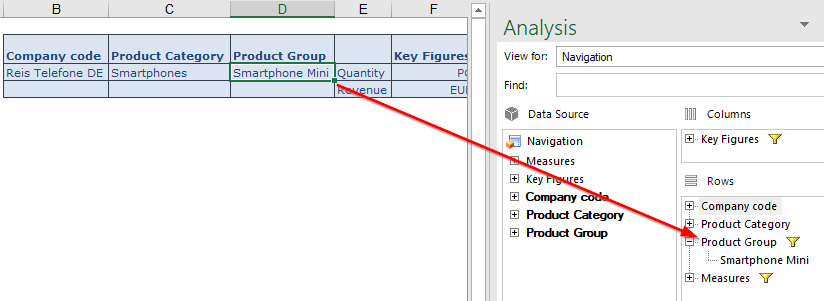
In order to see the values on a more granular level (for example, product group), you can use free characteristics. Go to the Analysis ribbon (1 on the figure below), select Display (2), and the Design Panel will appear. Now you can choose the required characteristic and drag and drop it into rows or columns. Another option is to drag them straight into the crosstab (3).
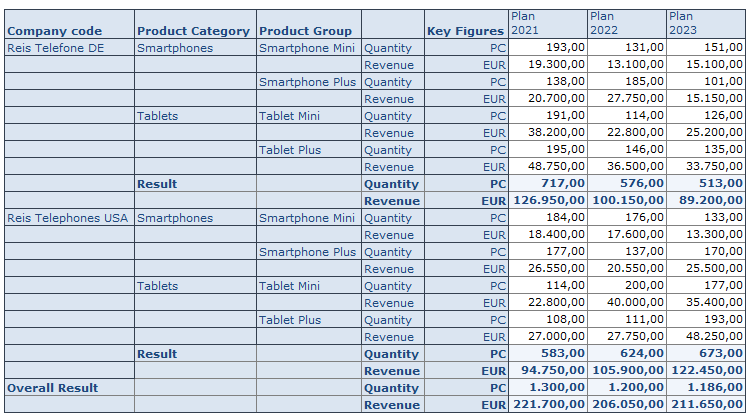
The report will also show data on the product group level and you can analyze the individual product groups. For example, revenue on Smartphone Mini vs. Smartphone Plus.
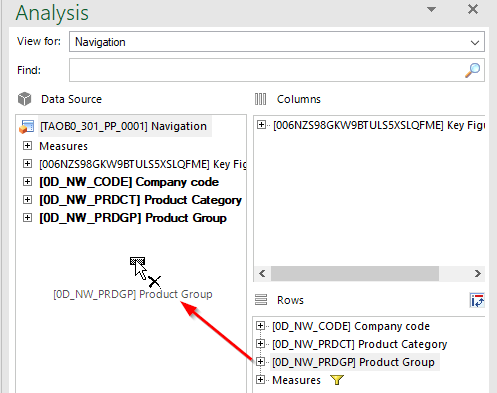
You can also remove characteristics from the drilldown in order to show the data on a more aggregated level. To do so, just drag and drop the characteristic from rows or columns to the list of free characteristics.
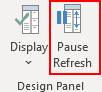
One more tip: if you want to add several characteristics to the drilldown, one after the other, or remove some characteristics from the drilldown at the same time, it is recommended to pause the refresh. This is because every time you change the drilldown of your crosstab, the display is updated and the values are recalculated. This can take some time if there are a lot of values.
The Pause Refresh option allows you to disable the automatic update and create a new view of your data without interruptions. You can insert new characteristics in rows or columns, adjust key figures, or set up background filters. If you select the Pause Refresh option again, the update will be reactivated. All previously defined navigation steps are executed at once.
2 Filtering
There are multiple ways to filter on desired values. In the Design Panel, you can right-click on the characteristic to be filtered and select Add to Filter (By Member).
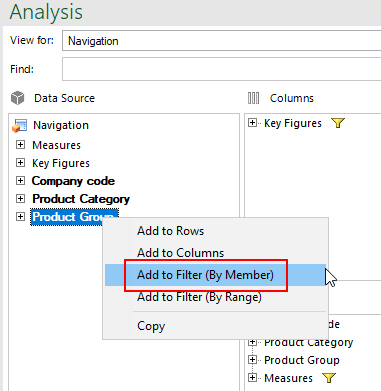
Afterwards, the values to be filtered can be selected.
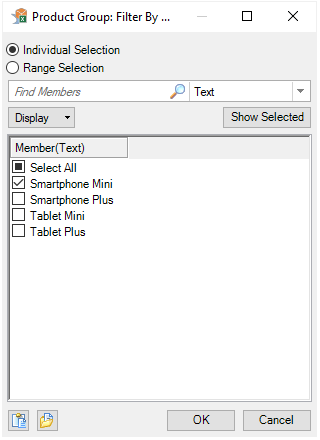
You can also achieve the same result by right clicking on the characteristic in the report and selecting Filter by Member from the context menu.
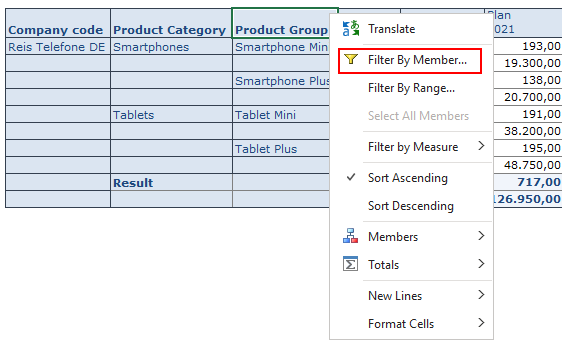
However, the fastest and the easiest way is to double-click on the specific value. This way, the filter will be automatically set to this value.
3 Unhide Columns
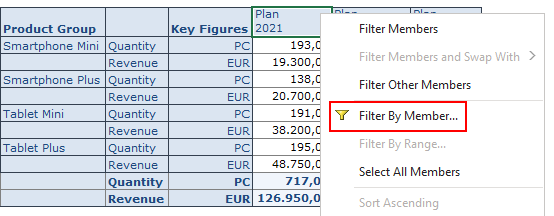
Reports may contain additional information, like growth between periods in absolute values and percentage. These columns might be initially hidden so the report is not overloaded. In order to display this information, right-click on any column and select Filter by Member from the context menu.
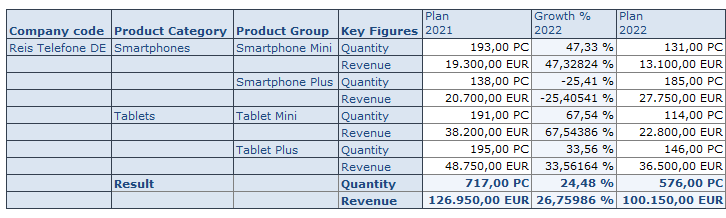
Afterwards, you can select the columns to be displayed. For example, Growth % 2022.
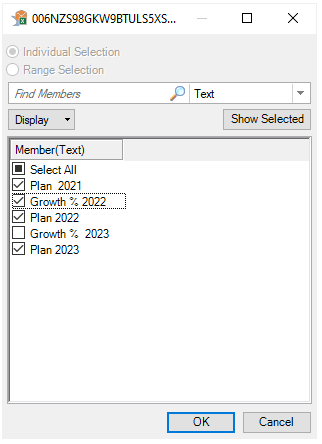
After you click on OK, the additional column is shown in the report.
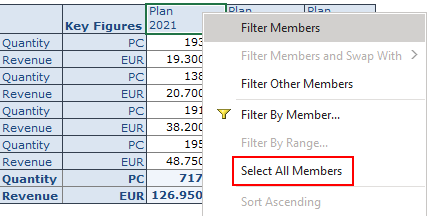
In order to display all available columns, click on Select All Members in the context menu.
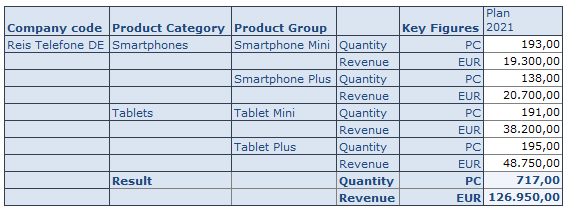
4 Repeat Members
By default, the description of characteristics is shown only in the first line. For instance, the description of the company code is displayed in the first line, followed by blank cells.
If you want to display the description in every cell, go to the Analysis Design tab. Open the Crosstab menu in the Format group and select the Repeat Members setting.
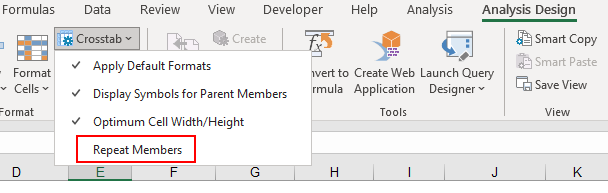
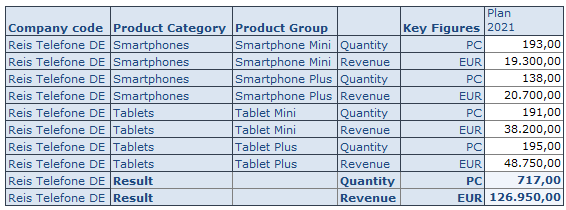
After that, the descriptions are shown in every cell.
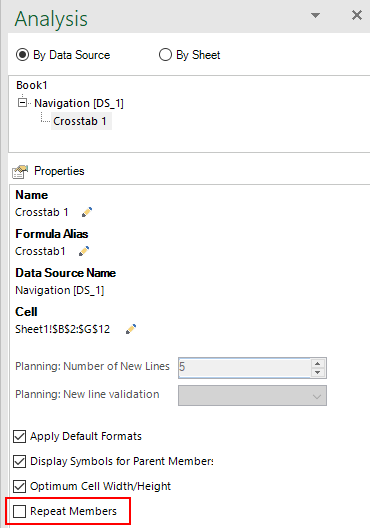
If you want to save this setting with the workbook, you have to display the Design Panel and select the Components tab. Select your query (Data Source), unfold, and select the correct crosstab. Under properties, tick the box Repeat Members.
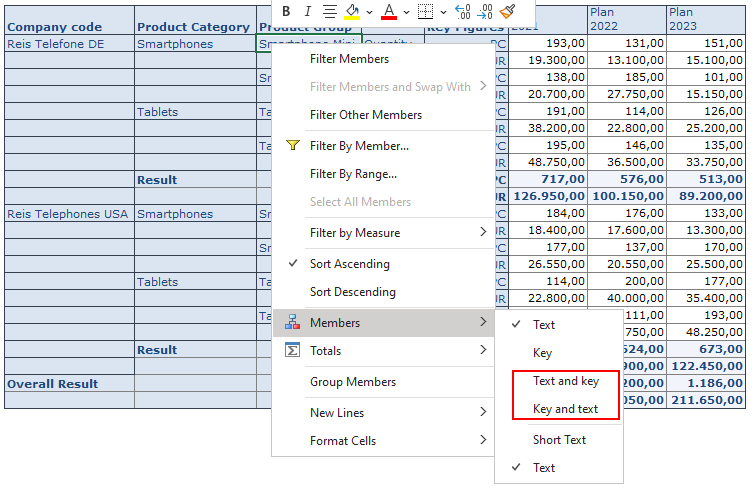
5 Display Keys
Some reports may show members as text only per default. There might be two entries with the same description, which is misleading, whereas the technical keys are always unique. In order to display the technical key, you can right click on a characteristic and change the display by going to Members and choosing Key and text or Text and key setting.
6 Hide or Show Totals
You can hide or show totals by right-clicking on a characteristic and choosing the Totals menu entry.
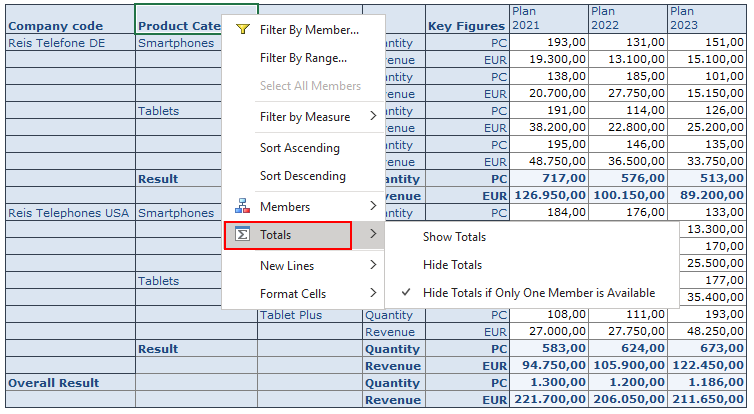
You can hide the totals row completely (Hide Totals) or always display it (Show Totals). You can also display totals only if there is more than one value to be calculated (Hide Totals if Only One Member is Available). Results that consist of only one element are then hidden.
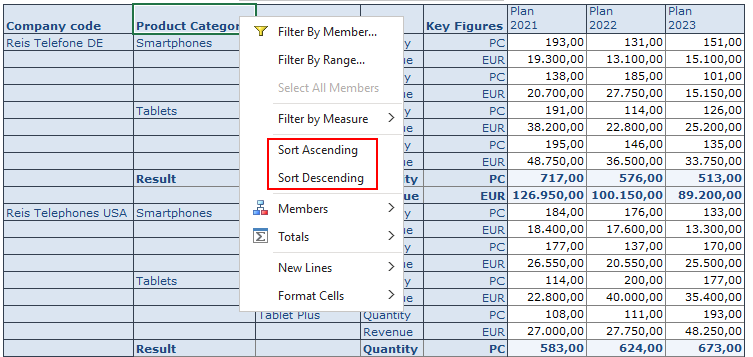
7 Sort
You can easily change the sort order in the query. To do so, right click on the characteristic and select Sort Ascending or Sort Descending from the context menu.
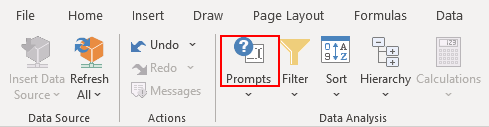
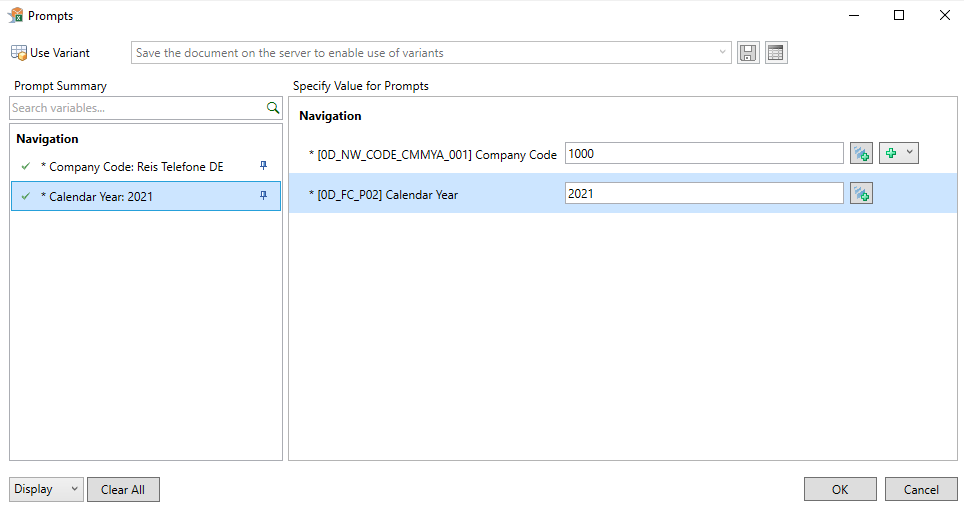
8 Change Prompt Values
Sometimes the report you use may come with predefined values and won’t show prompts by default. By clicking on Prompts you can change your variable selection.
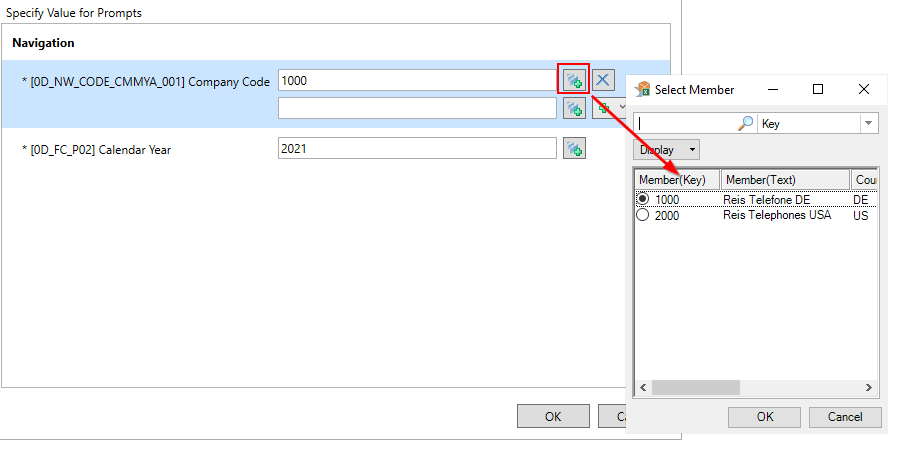
9 Use Value Help
You have to enter the key of the characteristic’s value in the prompt. If you don’t know the key for your selection, you can use the value help to find out.
10 Add Line in Prompt
It is possible to select multiple values in the prompts. In order to add a new line, click on the green plus icon. You can add as many lines as necessary.
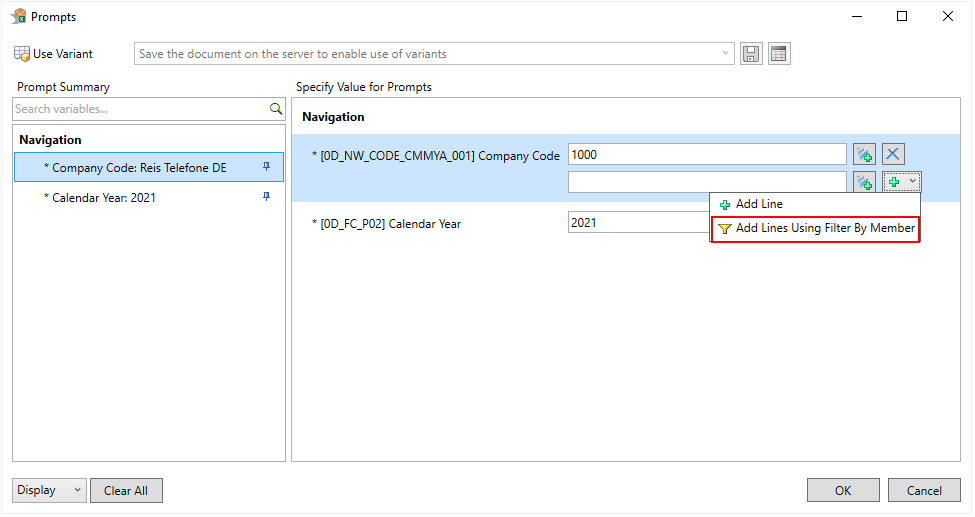
11 Add Lines Using Filter By Member
Another, easier, way to select multiple values is to use the filter feature in the prompts. Click on the drop down menu next to the green plus icon. Afterwards, select Add Lines Using Filter by Member entry. Select the desired members and confirm your selection by pressing OK.
12 Explicit Selection
If you select all values in the filter or use the Select All checkbox, nothing will happen at first because this dialog box functions like a filter. If the selection is restricted to all values, no restriction exists for any of the values. If you want to select all values at once, you can use the Explicit Selection setting.
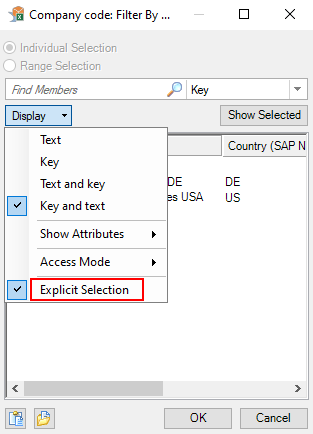
When the Explicit Selection setting is active, values are selected individually. If you click on Select All, the two company codes are selected one by one. You can now click the OK button to add them to the prompt.
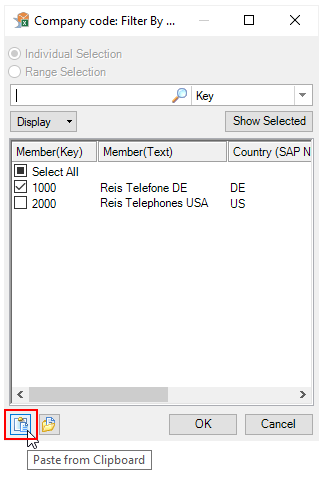
13 Copy Prompt Selections from Excel
Another easy way to select prompt values is to copy them from clipboard. You can copy your selections from Excel, select the drop down menu in the prompt, and click on Add Lines Using Filter by Member. Then, click on the Paste From Clipboard icon at the bottom.
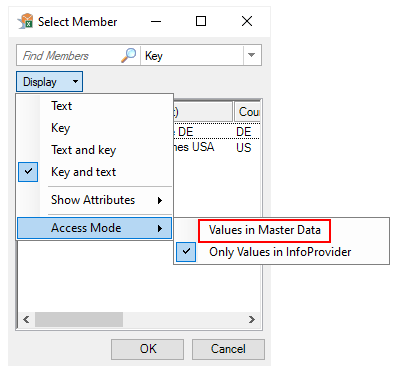
14 Show Master Data in the Value Help
In planning scenarios, you might need to select values for which no transactional data is available yet. To do so, go to value help and select Display. Afterwards, select Values in Master Data as an Access Mode.
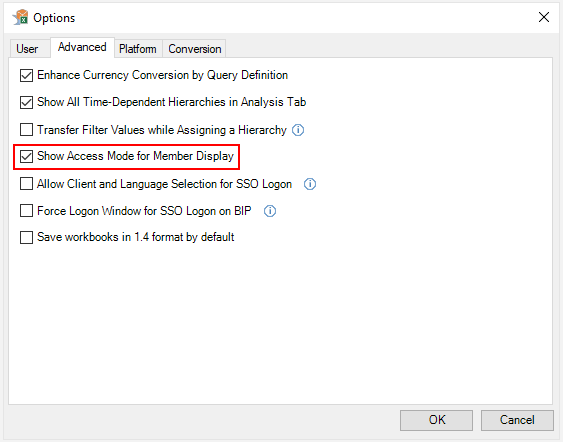
The Access Mode option is only available if you activate the Show Access Mode for Member Display setting in the Advanced options. It is deactivated by default.
15 Save Variant
You can save your selections as a variant to save time in the future. After you have entered your selections, enter a name for the variant. Then save the variant.
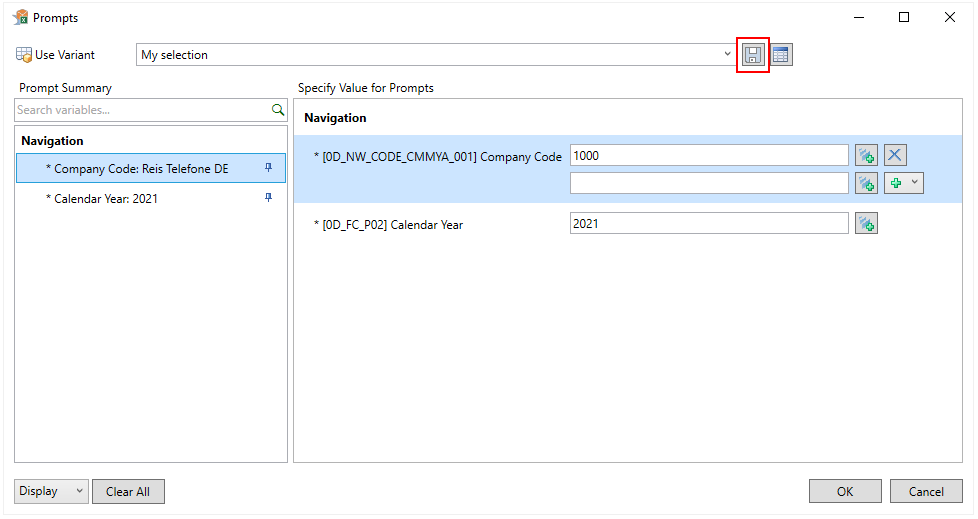
Next time you open the workbook the variant can be selected from the dropdown menu.
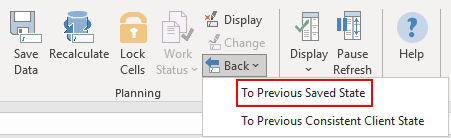
16 To Previous Saved State
When using SAP Analysis for Microsoft Office in a planning context, you might want to reset your changes. Go to Analysis tab and select Back > To Previous Saved State. Changed values will return to the previous saved state.
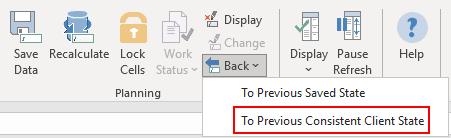
17 To Previous Consistent Client State
There is also the possibility to return to the previous consistent client state by selecting To Previous Consistent Client State option. This option reverses all changes to your data since the last successful recalculation. This feature is useful to return to an original plan when you entered values on an empty cell and disaggregation is not possible.
18 Disable Reset
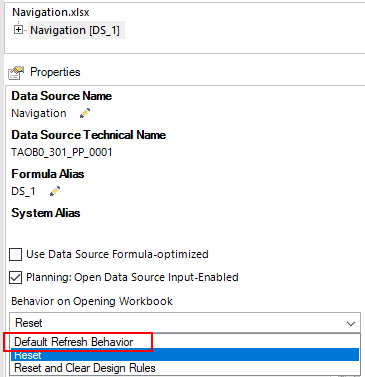
SAP Analysis for Microsoft Office workbooks are usually set up to reset to query settings on opening. This way, your IT department can guarantee you see the latest version of the query. The downside of this approach is that you cannot save your navigation state with the workbook.
If you want to save your favorite drilldown locally, display the Design Panel and choose the Components tab. Select the query (Data Source) and change the Behavior on Opening Workbook setting to Default Refresh Behavior.
Summary
I hope you enjoyed this little collection of useful hints and learned something new. You can learn more useful tips to facilitate your work with SAP Analysis for Microsoft Office in my book SAP Analysis for Microsoft Office — Practical Guide.