
Microsoft Excel Reporting Automation
Excel VBA makes a amazing tool to automate reporting. If you work in Accounting or Finance, then being able to create a macro to automate a reporting that usually takes half hour to merely just a minute, and you can re-use the the program over and over again, is going to be a huge time and energy saver.
Excel VBA is the programming language to automate Excel spreadsheet, and the beauty with VBA is that, it is actually pretty easy to pick it up. Excel application on the other hand, is the most widely used spreadsheet in the world today.t
In this tutorial I am going to teach you how to start learning automating a reporting process using Excel VBA. You don’t have to be an expert in Excel programming, but it is ideal that you have at least have a little bit experience writing macro (Excel VBA).tt
Download Excel File.
Содержание
- 10 steps to create automated Excel reports with VBA
- SAVE your time.
- 1 — Open your VBA code editor:
- 2 — Understand the structure of a VBA project:
- 3 — Play with the code:
- 4 — Play with the macro recorder:
- 5 — Add some variables and constants:
- 6 — Add some conditions:
- 7 — Create a template and make your life easier:
- 8 — Connect to a database:
- 9 — Others tips:
- 10 — Run and Debug:
- Create VBA Project Report
- Report content
- How it works
- Prerequisites
- Main module
- Function module
- Excel VBA
- Create an Excel Pivot Table report using VBA
10 steps to create automated Excel reports with VBA
SAVE your time.
D on’t do manually something you can automate with simples lines of code. All you need is your computer and one version of Microsoft Excel. You don’t need any programming skills, this easy guide will show you how to automate the creation of Microsoft Excel reports easily.
The first rule of any technology used in a business is that automation applied to an efficient operation will magnify the efficiency. The second is that automation applied to an inefficient operation will magnify the inefficiency. (Bill Gates)
1 — Open your VBA code editor:
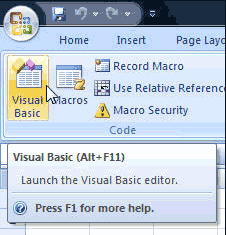
Once you open your Microsoft Excel windows, you should be able to see the tab “Developer” on your Excel ribbon. If you click on this one, you can easily open the Visual Basic editor with the first button (Or you can also use the shortcut ALT+F11).
Once your editor is opened, you will see a bunch of options and stuff. Don’t get scared, it’s simple. Each worksheet in Excel comes with a VBA project. Double-click on “This workbook” to display the content.
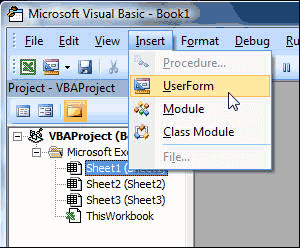
The content is of course empty, so we will write our code in this file. Note that you can also add as many files as you want by using “insert -> Module”, but let’s skip this for now.
2 — Understand the structure of a VBA project:
Easy and simple, a VBA file can be filled with programs and functions. Your computer needs to understand where a program begins and where it ends. For this, VBA uses simple words like “Sub” and “End Sub”.
Very important, you need to understand that programming languages are sensible. In this case you need to use small and capital letters as indicated.
In order to have a detailed and well-explained code, you need to use comments. This means you can write any text you want and the computer will not run theses lines. In VBA, a comment always begins with an apostrophe. Try to write the following line in your VBA editor, and you will see that the color of the line will change to green:
This is all you need to know for now. Let’s try to write some code for now!
3 — Play with the code:
Let’s write some code now! Try to write the following in your VBA file and after press the Run button or F5 to run the code.
If you write everything correctly, the following window will appear on your Microsoft Excel screen:
Simple, right? There are many things you can use to make your life easier with Microsoft Excel. You can basically manage and modify everything.
4 — Play with the macro recorder:
The cool thing with Microsoft Excel is if you don’t know the code and you’re looking for something, you can actually do it manually and record it.
Once recorded, you can go back to the Visual Basic editor, and you will see the code generated by the assistant!
5 — Add some variables and constants:
Let’s try something else. We will ask your computer to remember some values entered by the user now. Write the following code in your VBA editor now and try to run it.
Dim myName As String
myName = InputBox(“What’s your name ?”)
MsgBox (“Hello “ & myName & “!”)
After running the code, the following window will appear, asking you to enter your name. Please enter your name and click on ok.
After pressing ok, the code will be able to save the entered value, and will display it in Excel!
Some explanations about the code. As you saw, you can easily use variables to stock any values. For this, you need to use the keyword “ Dim” in your code. But you will need to define the type of data you want to save. If it’s some text value, you can use “ as String”:
For numbers formats, VBA code distinguishes if the data is an integer value or a number with decimals. For this case, you can write the code as follows:
Dim myNumber As Integer
Dim myDecimalNumber As Double
For other types of data, the best way to learn is to try by yourself and check on the internet when you encounter an issue.
6 — Add some conditions:
Of course you will want to add some conditions to your code. By verifying a condition, you can ask your code to do something or doing nothing in a special case. Let’s try to use the following:
Dim myAge As String
myAge = InputBox(“What’s your current age?”)
If myAge If <>Else <> End if structure, you can put a condition and guide your program to execute some actions or not. This is really helpful, and the structure is easy to understand too.
7 — Create a template and make your life easier:
Another way to create some beautiful reports is to create a new Excel Sheet with the basic visual you want to use and hide the sheet. After, with a simple code you can copy the sheet to a new one, and begin to fill it:
8 — Connect to a database:
For people who are working with databases, you can connect the VBA code to it and extract some data. In order to create reports, this is really useful. I will not go through the details of the code, but you can find and use some sample code below:
‘ Create connection
Set cn = CreateObject(“ADODB.Connection”)
Set rs = CreateObject(“ADODB.Recordset”)
‘ Open request
rs.Open request, cn, adOpenStatic
‘ Paste request to Excel sheet
ActiveSheet.range(“A11”).CopyFromRecordset rs
‘ Close the request
cn.Close
9 — Others tips:
Many things can be done with VBA. Here’s a list of what you can do. Feel free to use this to save your time!
Merge some cells:
Rename your Excel sheet:
Change the value of a cell:
Change the color of a font:
10 — Run and Debug:
The annoying thing when creating some programs is you will always face new issues. To correct it, you can use internet communities to quickly find an answer to your problems.
As well, instead of running the program with the run button, you can use the F8 touch, which will launch your program line by line, so you can easily go through the program and see how it goes.
Источник
Create VBA Project Report
Creating a nice report about your VBA project is always a good way to keep track of your records or at least give you a clue where you left off. Especially if you are working on multiple files at the same time and you are continuously being interrupted.
Recently I am working on a VBA standardization / cleanup project (reviewing legacy codes -> identify common tasks -> designing ‘apply for all’ procedures -> creating reusable codes etc.). Circumstances are far away from ideal (working alone, time pressure, no version control system). Since I had other responsibilities too I realized that sometimes I lose track where I was. If you have ever asked yourself:
- “Did I implemented that feature or not?”
- “I remember I have already done that in one of the files, which file was that?”
- “Why is it not listed in the code repository?”
then this add-in might be a help for you.
It simply takes the ActiveWorkbook VBA project, collects all the Modules, all the Procedures and compiles a report in a new workbook. Giving you a fighting chance to track you work by comparing the reports for different dates, number of procedures, number of lines. It is much easier to trace a specific function or sub (if you use talkative names).
Report content
- Component type: basically module type (standard, class, form, document)
- VBA component: module name
- Procedure name: it talks for itself
- Procedure type: sub or function
- Total lines: number of procedure lines
- Procedure declaration: the declaration line of the procedure
Example:

How it works
- It always process the ActiveWorkbook.
- The VBA Project has to be unlocked.
- It does not list empty components (modules).
- When you start the report there is a confirmation question showing you which workbook is going to be processed:

If you download and install the add-in it will be on an a new “Export VBA” tab on your ribbon.

If you go for the xlsm file:
- open the ‘VBAProjectReport.xlsm’
- open the file you would like to create a VBA Report
- press Alt+F8
- run ‘mainVBAProjectReport’ macro

Prerequisites
You have to enable the ‘Trust access to the VBA project object model’ feature in Excel’s Trust Center.

If you are copying the code to your projects do not forget to add the ‘Microsoft Visual Basic for Applications Extensibility’ library to your project.

Main module
The core procedure of the tool, note that code source is the simple xlsm file.
Function module
Good place to start if you are working with the VBE: Visual Basic add-in model reference
If you have an idea how to make this add-in better do not hesitate to comment or contact me.
Источник
Excel VBA
Create an Excel Pivot Table report using VBA
User Rating: 5 / 5

Create an Excel Pivot Table report using VBA
Related Links:
1. Create an Excel Pivot Table report using VBA
Refer complete Tutorial on using Pivot Tables in Excel Window (user interface):
Use Visual Basic for Applications (VBA) to Create and Customize PivotTable & PivotChart reports: A PivotTable report can be created, customized and manipulated entirely using VBA. Properties and Methods of the PivotTable object are used to create, customize and manipulate a PivotTable report.
It may be noted that there are differences between Pivot Tables created in Excel 2000, Excel 2002-03, Excel 2007 and Excel 2010. Hence it is important to determine in which version of Excel is vba being executed in, to ensure compatibility and similar default settings between the PivotTable with the corresponding Excel version.
You can create a PivotTable with a specific version in Excel 2007 by using the PivotCaches.Create Method.
In Excel 2007, you can have fully interactive PivotTables versions 0 to 3. In Excel versions prior to Excel 2007, you can have fully interactive PivotTable version numbers 0 to 2 (ie. Excel 2000 & Excel 2002-03 formats), but only a read-only PivotTable version number 3 (ie. Excel 2007 format) and you cannot create a PivotChart from this read-only PivotTable.
Working in Excel 2007 in compatibility mode (ie. when xls file is opened) will save an Excel 2000 or Excel 2002-03 format PivotTable (ie. PivotTable versions 0 to 2). When you save an Excel 2007 file in compatibility mode, all PivotTables of previous versions (0 to 2) will be marked for upgrade to version 3 (xlPivotTableVersion12) and the respective PivotTable will be upgraded when refreshed next. Once the PivotTable is upgraded and converted to version 3, it cannot be converted back to an earlier version.
All features of Excel 2007 can be used when you use a PivotTable version number 3 (ie. Excel 2007 format) in Excel 2007. Using PivotTable version numbers 0 to 2 (ie. Excel 2000 & Excel 2002-03 formats) in Excel 2007 will enable use of most but not all features (esp. some filtering options) of Excel 2007.
In the order of: PivotTable Version, PivotTable Version Number, Excel Version, Excel Version Number
xlPivotTableVersion2000, 0, Excel 2000, 9.0
xlPivotTableVersion10, 1, Excel 2002, 10.0
xlPivotTableVersion11, 2, Excel 2003, 11.0
xlPivotTableVersion12, 3, Excel 2007, 12.0
xlPivotTableVersion14, 4, Excel 2010, 14.0
Note: There is no difference in behavior between xlPivotTableVersion10 and xlPivotTableVersion11.
Application.Version Property — returns the Excel version number in which VBA is being executed viz. 10.0, 11.0, 12.0, etc.
PivotTable.Version Property — returns the PivotTable version number, 1, 2, 3, etc.
Example 1:
Use the PivotCaches.Create Method, to add a new PivotTable Cache (version excel 2007). Create a PivotTable report based on a Pivot Cache using the PivotCache.CreatePivotTable method. Add row, column, page (report filter) & data fields.

Sub createPivotTable1()
‘refer Image DataSource for source data. Note that the complete data table extends upto row number 49.
‘refer Image 1 for PivotTable report created after running below code
Dim PvtTbl As PivotTable
Dim wsData As Worksheet
Dim rngData As Range
Dim PvtTblCache As PivotCache
Dim wsPvtTbl As Worksheet
Dim pvtFld As PivotField
‘determine the worksheet which contains the source data
Set wsData = Worksheets(«CarSales»)
‘determine the worksheet where the new PivotTable will be created
Set wsPvtTbl = Worksheets(«Sheet1»)
‘delete all existing Pivot Tables in the worksheet
‘in the TableRange1 property, page fields are excluded; to select the entire PivotTable report, including the page fields, use the TableRange2 property.
For Each PvtTbl In wsPvtTbl.PivotTables
If MsgBox(«Delete existing PivotTable!», vbYesNo) = vbYes Then
‘A Pivot Cache represents the memory cache for a PivotTable report. Each Pivot Table report has one cache only. Create a new PivotTable cache, and then create a new PivotTable report based on the cache.
‘set source data range:
Set rngData = wsData.Range(«A1:G49»)
‘for creating a Pivot Cache (version excel 2007), use the PivotCaches.Create Method. When version is not specified, default version of the PivotTable will be xlPivotTableVersion12.
‘The PivotCache.CreatePivotTable method creates a PivotTable report based on a Pivot Cache. TableDestination is mandatory to specify in the method.
‘create Pivot Cache and PivotTable version excel 2007:
ActiveWorkbook.PivotCaches.Create(SourceType:=xlDatabase, SourceData:=rngData, Version:=xlPivotTableVersion12).createPivotTable TableDestination:=wsPvtTbl.Range («A1»), TableName:= «PivotTable1», DefaultVersion:=xlPivotTableVersion12
Set PvtTbl = wsPvtTbl.PivotTables («PivotTable1»)
‘Default value of ManualUpdate property is False wherein a PivotTable report is recalculated automatically on each change. Turn off automatic updation of Pivot Table during the process of its creation to speed up code.
PvtTbl.ManualUpdate = True
‘add row, column and page (report filter) fields:
Set pvtFld = PvtTbl.PivotFields(«Year»)
pvtFld.Orientation = xlPageField
Set pvtFld = PvtTbl.PivotFields(«Region»)
pvtFld.Orientation = xlRowField
Set pvtFld = PvtTbl.PivotFields(«Car Models»)
pvtFld.Orientation = xlRowField
pvtFld.Position = 1
Set pvtFld = PvtTbl.PivotFields(«Country»)
pvtFld.Orientation = xlColumnField
‘set data field — specifically change orientation to a data field and set its function property:
With PvtTbl.PivotFields(«Sales»)
‘turn on automatic update / calculation in the Pivot Table
PvtTbl.ManualUpdate = False
‘Application.Version Property — returns the Excel version number in which VBA is being executed viz. 9.0, 10.0, 11.0, 12.0, etc.
MsgBox Application.Version
‘PivotTable.Version Property — returns the PivotTable version number, 0, 1, 2, 3, etc.
MsgBox PvtTbl.Version
End Sub
Example 2:
Use the PivotCaches.Create Method, to add a new PivotTable Cache (version excel 2003). Create a PivotTable report, in a new worksheet, based on a Pivot Cache using the PivotCache.CreatePivotTable method. Add row, column and page (report filter) fields using the AddFields method. Add a data field using the AddDataField method.

Sub createPivotTable2()
‘refer Image DataSource for source data. Note that the complete data table extends upto row number 49.
‘refer Image 2 for PivotTable report created after running below code
Dim PvtTbl As PivotTable
Dim wsData As Worksheet
Dim rngData As Range
Dim PvtTblCache As PivotCache
Dim pvtFld As PivotField
‘determine the worksheet which contains the source data
Set wsData = Worksheets(«CarSales»)
‘A Pivot Cache represents the memory cache for a PivotTable report. Each Pivot Table report has one cache only. Create a new PivotTable cache, and then create a new PivotTable report based on the cache.
‘determine source data range (dynamic):
‘last row in column no. 1:
lastRow = wsData.Cells(Rows.Count, 1).End(xlUp).Row
‘last column in row no. 1:
lastColumn = wsData.Cells(1, Columns.Count).End(xlToLeft).Column
Set rngData = wsData.Cells(1, 1).Resize(lastRow, lastColumn)
‘for creating a Pivot Cache (version excel 2003), use the PivotCaches.Create Method. When version is not specified, default version of the PivotTable will be xlPivotTableVersion12:
Set PvtTblCache = ActiveWorkbook.PivotCaches.Create(SourceType:=xlDatabase, SourceData:=rngData, Version:=xlPivotTableVersion11)
‘create a PivotTable report based on a Pivot Cache, using the PivotCache.CreatePivotTable method. TableDestination is mandatory to specify in this method.
‘create PivotTable in a new worksheet:
ActiveWorkbook.Worksheets(«CarSales»).Activate
Set PvtTbl = PvtTblCache.createPivotTable(TableDestination:= «» , TableName:= «PivotTable1» , DefaultVersion:=xlPivotTableVersion11)
‘rename the new worksheet in which the PivotTable report is created:
ActiveSheet.Name = «PT_CarSales1»
‘change style of the new PivotTable:
PvtTbl.TableStyle2 = «PivotStyleMedium3»
‘to view the PivotTable in Classic Pivot Table Layout, set InGridDropZones property to True, else set to False:
PvtTbl.InGridDropZones = False
‘Default value of ManualUpdate property is False wherein a PivotTable report is recalculated automatically on each change. Turn off automatic updation of Pivot Table during the process of its creation to speed up code.
PvtTbl.ManualUpdate = True
‘Add row, column and page fields in a Pivot Table using the AddFields method:
‘add row, column and page (report filter) fields using the .AddFields method:-
PvtTbl.AddFields RowFields:=Array( «Car Models», «Region» ), ColumnFields:= «Country» , PageFields:= «Year»
‘using the AddDataField method to add a data field in a PivotTable report
‘This method includes 3 arguments of Field, Caption & Summary Function. While it is mandatory to specify the Field object, Caption & Summary Function arguments are optional, default being SUM.
PvtTbl.AddDataField PvtTbl.PivotFields(«Sales»)
Dim PvtDataFld As PivotField
Set PvtDataFld = PvtTbl.PivotFields(«Sum of Sales»)
‘turn on automatic update / calculation in the Pivot Table
PvtTbl.ManualUpdate = False
‘Application.Version Property — returns the Excel version number in which VBA is being executed viz. 9.0, 10.0, 11.0, 12.0, etc.
MsgBox Application.Version
‘PivotTable.Version Property — returns the PivotTable version number, 0, 1, 2, 3, etc.
MsgBox PvtTbl.Version
End Sub
Example 3:
Add a new PivotTable Cache, using the PivotCaches.Add Method. Create a PivotTable report (version excel 2003) based on a Pivot Cache using the PivotTables.Add Method. Add row, column, page (report filter) & data fields.

Sub createPivotTable3()
‘refer Image DataSource for source data. Note that the complete data table extends upto row number 49.
‘refer Image 3 for PivotTable report created after running below code
Dim PvtTbl As PivotTable
Dim wsData As Worksheet
Dim rngData As Range
Dim PvtTblCache As PivotCache
Dim wsPvtTbl As Worksheet
Dim pvtFld As PivotField
‘add new worksheet
Worksheets.Add
ActiveSheet.Name = «PT_CarSales2»
‘determine the worksheet which contains the source data
Set wsData = Worksheets(«CarSales»)
‘determine the worksheet where the new PivotTable will be created
Set wsPvtTbl = Worksheets(«PT_CarSales2»)
‘A Pivot Cache represents the memory cache for a PivotTable report. Each Pivot Table report has one cache only. Create a new PivotTable cache, and then create a new PivotTable report based on the cache.
‘set source data range:
Set rngData = wsData.Range(«A1:G49»)
‘for creating a Pivot Cache, use the PivotCaches.Add Method:
Set PvtTblCache = ActiveWorkbook.PivotCaches.Add(SourceType:=xlDatabase, SourceData:=rngData)
‘Create a PivotTable report (version excel 2003) based on a Pivot cache using the PivotTables.Add Method. This is alternate to the PivotCache.CreatePivotTable method mentioned earlier.
‘In the Add method, it is necessary to specify the arguments of PivotCache and TableDestination.
wsPvtTbl.PivotTables.Add PivotCache:=PvtTblCache, TableDestination:=wsPvtTbl.Cells(3, 1), TableName:= «PivotTable1» , DefaultVersion:=xlPivotTableVersion11
Set PvtTbl = wsPvtTbl.PivotTables( «PivotTable1» )
‘Default value of ManualUpdate property is False wherein a PivotTable report is recalculated automatically on each change. Turn off automatic updation of Pivot Table during the process of its creation to speed up code.
PvtTbl.ManualUpdate = True
‘add row, column and page (report filter) fields:
Set pvtFld = PvtTbl.PivotFields( «Year» )
pvtFld.Orientation = xlPageField
Set pvtFld = PvtTbl.PivotFields( «Region» )
pvtFld.Orientation = xlRowField
Set pvtFld = PvtTbl.PivotFields( «Car Models» )
pvtFld.Orientation = xlRowField
pvtFld.Position = 1
Set pvtFld = PvtTbl.PivotFields( «Country» )
pvtFld.Orientation = xlColumnField
‘set data field — specifically change orientation to a data field and set its function property:
With PvtTbl.PivotFields(«Budgeted Sales»)
‘turn on automatic update / calculation in the Pivot Table
PvtTbl.ManualUpdate = False
‘Application.Version Property — returns the Excel version number in which VBA is being executed viz. 9.0, 10.0, 11.0, 12.0, etc.
MsgBox Application.Version
‘PivotTable.Version Property — returns the PivotTable version number, 0, 1, 2, 3, etc.
MsgBox PvtTbl.Version
End Sub
The PivotTableWizard method: PivotTable creation in vba was significantly altered in Excel 2000 when the PivotCache object was introduced, which enables creating a PivotCache and then creating PivotTable reports from the PivotCache. Excel 97 used the PivotTableWizard method to create a PivotTable report in a single step. To create a PivotTable report with vba in Excel 97, the PivotTableWizard method is the only option.
All arguments are optional to specify in the PivotTableWizard method. Omitting SourceType will default to xlDatabase (ie. Excel List or Database); SourceData, though optional, should invariably be specified else Excel considers the source to be a named range «Database» and if this named range does not exist the method will fail if certain conditions are not met. If SourceData is specified then SourceType should also be specified. Omitting the TableDestination argument will place the report at the active cell, and if the active cell lies within the range of SourceData, the report gets placed either in a new worksheet or in the separate worksheet specified in the method by the WorksheetObjectVariable.
Example 4:
Create a PivotTable report using the PivotTableWizard Method. Add row, column and page (report filter) fields using the AddFields method. Add a data field using the AddDataField method.

Sub createPivotTable4()
‘refer Image DataSource for source data. Note that the complete data table extends upto row number 49.
‘refer Image 4 for PivotTable report created after running below code
Dim PvtTbl As PivotTable
Dim wsData As Worksheet
Dim rngData As Range
Dim PvtTblCache As PivotCache
Dim wsPvtTbl As Worksheet
Dim pvtFld As PivotField
‘determine the worksheet which contains the source data
Set wsData = Worksheets(«CarSales»)
‘determine the worksheet where the new PivotTable will be created
Set wsPvtTbl = Worksheets(«Sheet1»)
‘delete all existing Pivot Tables in worksheet
‘in the TableRange1 property, page fields are excluded; to select the entire PivotTable report, including the page fields, use the TableRange2 property
For Each PvtTbl In wsPvtTbl.PivotTables
If MsgBox(«Delete existing PivotTable!», vbYesNo) = vbYes Then
Источник
Supercharge your Excel reporting tasks!
Top 8 VBA Routines for Excel Reporting
The article below showcases eight VBA routines for Excel reporting, which you can start using immediately to supercharge your Excel reporting tasks. VBA’s been around for as long as most of us care to remember, and there are certain tasks where using VBA still rules.

The routines below cover a range of functionalities from custom shortcuts and formulas, formatting, and PDF creation. The powerful routines were written to give you a real sense of the types of tasks where Excel VBA remains the best tool to use.
VBA routines for creating reports:
- Unmerge selected cells and fill values down
- Improved fill down handle keyboard shortcut
- Custom formulas with VBA
VBA routines for publishing reports:
- Delete completely blank rows in the selection
- Sort selected sheets alphabetically
- Set selected sheets to “Very Hidden”
- Export each sheet into a separate PDF Report
- Export all charts to a PPT workbook
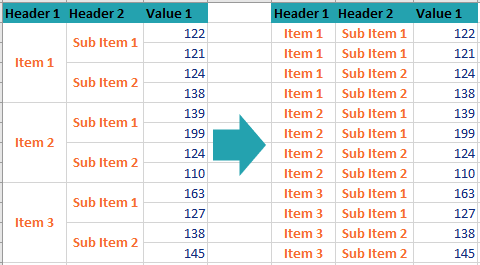
1. Unmerge selected cells and fill values down
Category: Report Creation, Formatting
VBA is particularly helpful in applying bespoke formatting to your reports, especially when it’s being applied to a set of selected cells that you can specify each time. You can even assign a shortcut to the macro if you perform the action often.
A particularly common example is where there is a set of grouped headers that need unmerging and then filling down. Sure, you can do it manually each time, but it becomes time-consuming if you got eight columns worth of grouped headers. Using the routine will save hours of work in the long term. It even works on more than one column at once.
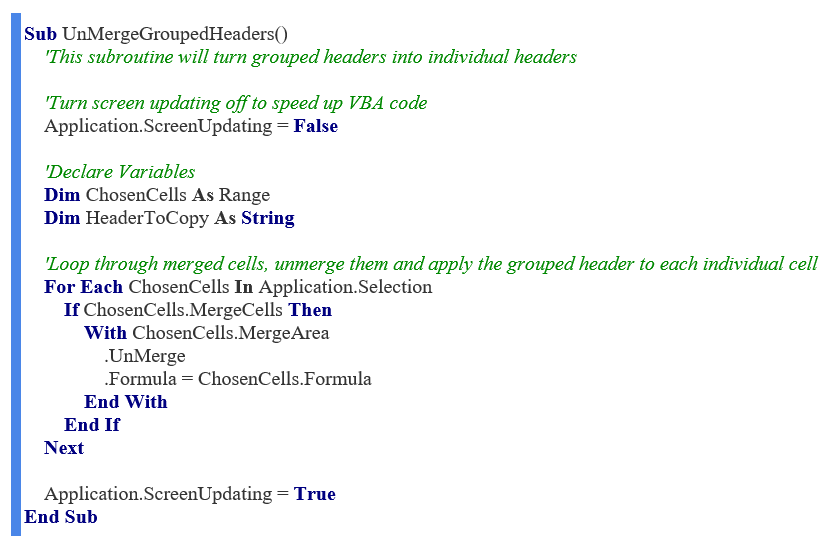
The Unmerge VBA routine modifies the cell and range properties of the selected area to apply the given formula or value to all the cells within the merged cell range.
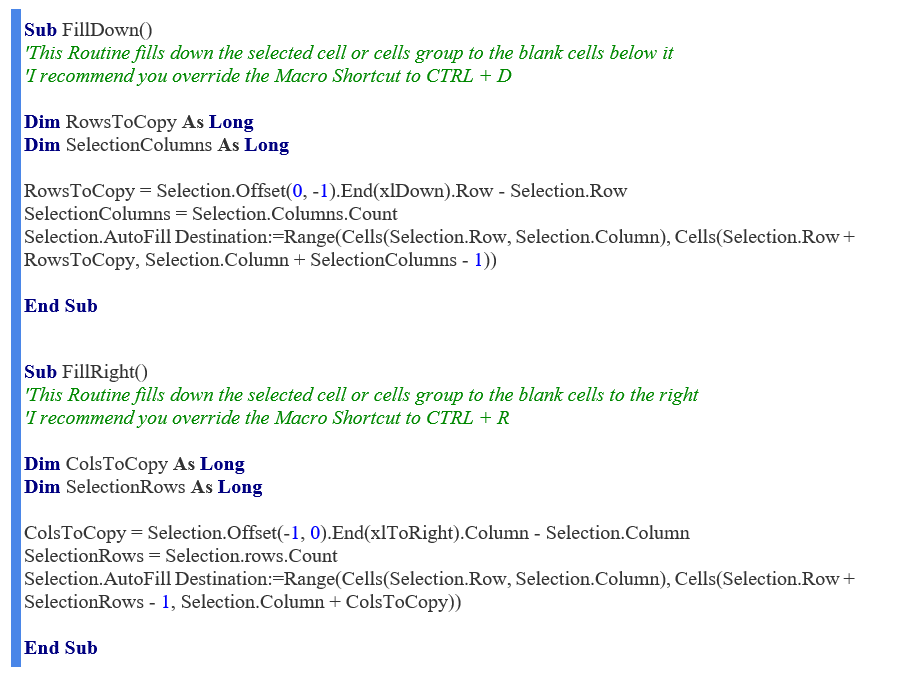
2. Improved fill down handle keyboard shortcut
Category: Report Creation, Formatting
So, you’ve just written a formula and need to copy it down through 2,000 rows. Now, we all know about the Fill button on the bottom right of the selection box, but wouldn’t it be nice if there were a keyboard shortcut that achieves the same result?
The Fill VBA routine uses range and cell selection to give you fill-down functionality with a single keyboard shortcut. I recommend you assign the Ctrl+D and Ctrl+R shortcuts to replace the default fill shortcuts.
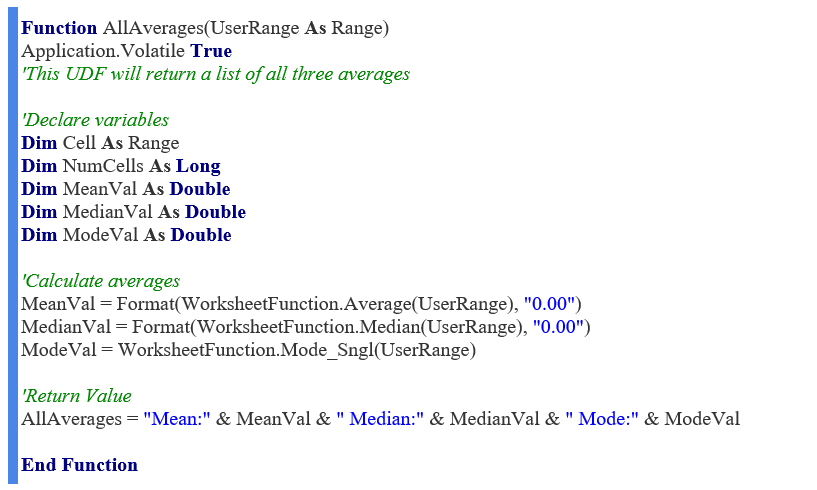
3. Custom Formulas with VBA
Category: Report Creation, Custom Formulas
If you ever wished Excel came with more formulas, then you’re in luck – you can create your own! User-Defined Functions (UDFs) allow you to create functions in VBA that you can then use in your own Excel worksheets. Functions are very similar to formulas; pass in a set of inputs and return an answer.
The VBA function acts like a worksheet formula and returns various properties of the selected data values as a text string. The example below gives our reader an indication of mean, median, and mode, which can be useful as dynamic text at the bottom of a graph.
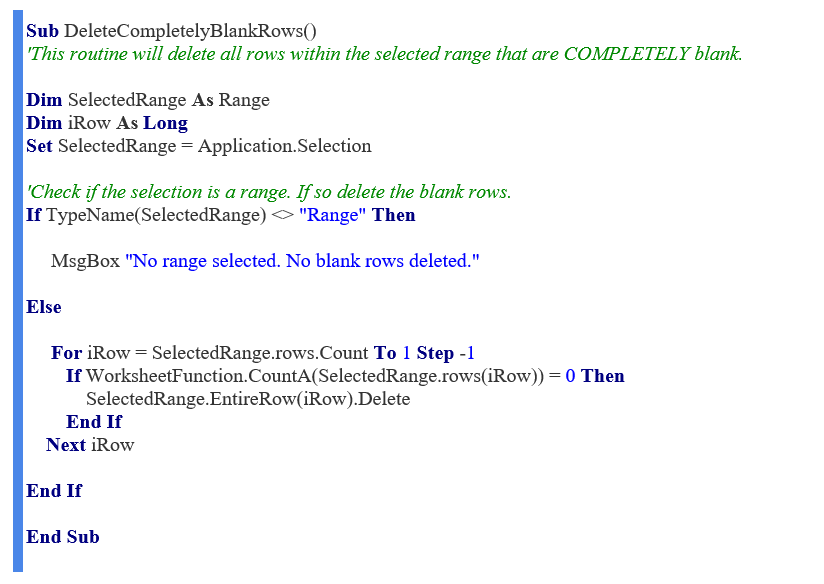
4. Delete Completely Blank Rows in the Selection
Category: Report Publishing, Formatting
You’ve spent a bit of time tidying up your data. You’ve got approximately 10,000 rows and 15 columns. Some values are legitimately blank. In other cases, you’ve got completely blank rows that you need to get rid of before publishing your data.
The VBA routine will look through the range that you’ve selected and uses the CountA worksheet function to find and delete any rows that are completely blank. The row must be totally blank, even outside of the selection. Rows above or below the selected range are not affected.
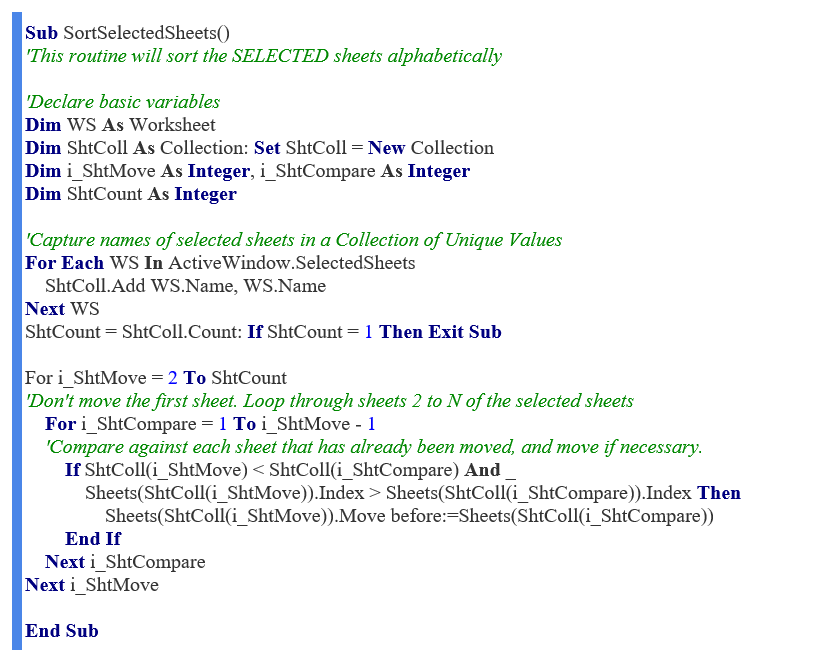
5. Sort Selected Sheets Alphabetically
Category: Report Publishing, Presentation
So you’ve created a report, which includes 5 tabs, one for each store in the business. You’ve been playing around with a few of them while you’ve been working on a few things. However, you need to ensure that they’re all in the correct order, for simplicity, before publishing the report.
The VBA routine will sort all of the SELECTED sheets alphabetically using the Move method of the worksheet object. By keeping it specific to SELECTED sheets, it allows you to keep a few title sheets at the front if you wish.
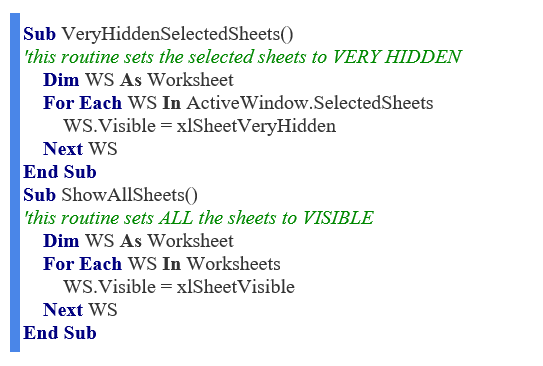
6. Set Selected Sheets to “Very Hidden”
Category: Report Publishing, Presentation
Sometimes you need to hide sheets in your workbook, but you know that certain colleagues will inevitably unhide them. What if you can really hide them!? It turns out there’s an option “Very Hidden” in VBA, which isn’t normally accessible as an option in the Excel menu.
The VBA routine allows you to easily set your sheets to “Very Hidden” using the visibility property of the worksheet object. The second routine I’ve included allows you to unhide all the sheets at once instead of doing them one by one. If you got a lot of hidden sheets, consider first whether you actually need them.
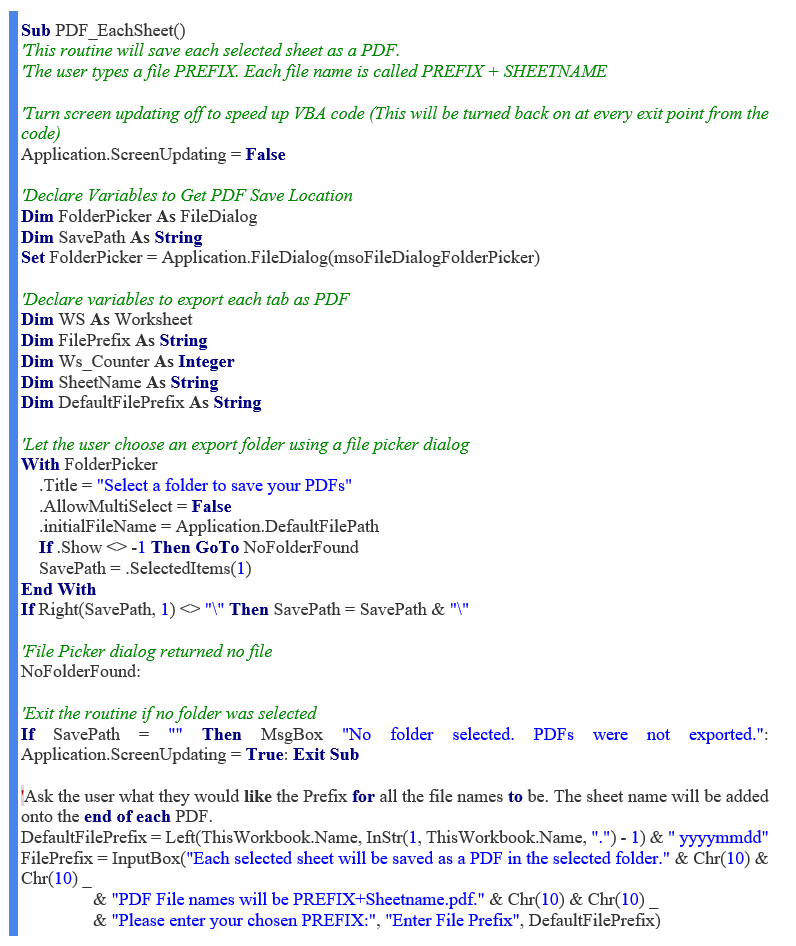
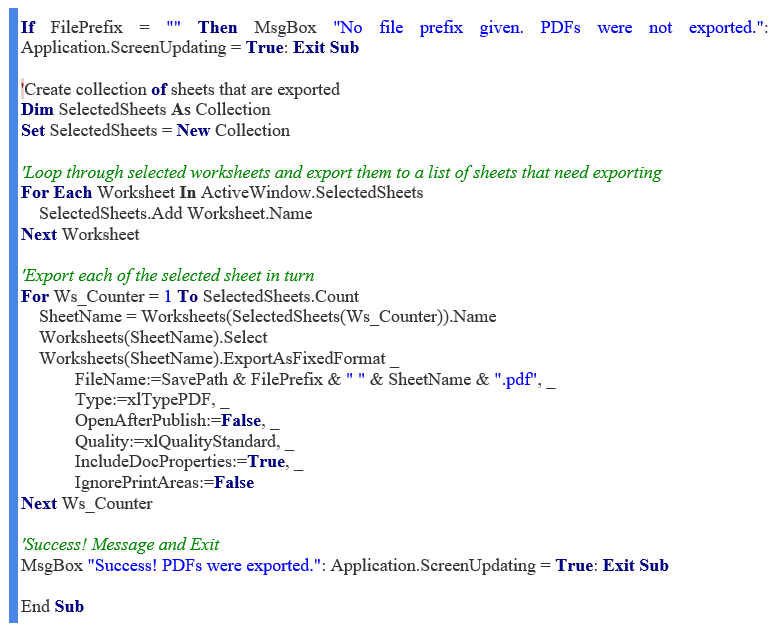
7. Export each Sheet into a Separate PDF Report
Category: Report Publishing, Exporting
You’ve probably worked on a project where each sheet represents a different entity, person, location, or region. All are essentially the same, but with different audiences. In such a case, you may want to export each sheet separately so that you can send each one to its respective audience.
The VBA routine will loop through the selected sheets using a For Next loop and export each one as a PDF using the Export method of the worksheet object. It also uses a folder picker to let the user decide where to save the PDFs. The routine can come in really handy when working with files and folders in VBA!
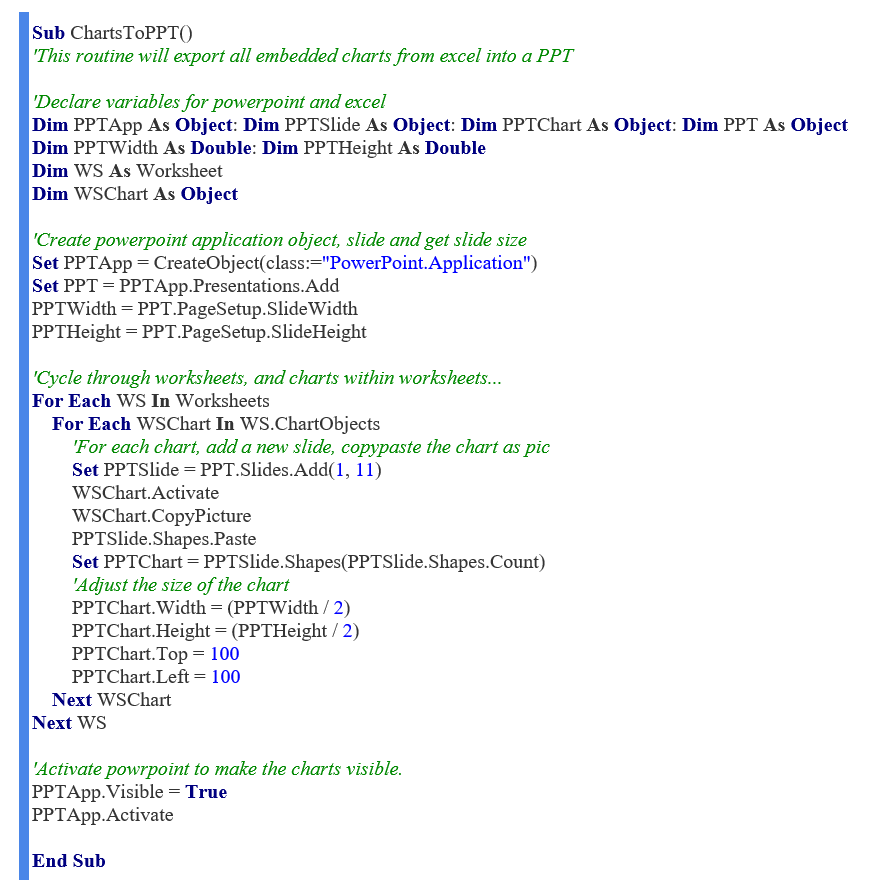
8. Export All Charts to a PPT Workbook
Category: Report Publishing, Exporting
Need all your financial charts in PowerPoint? Use the ChartsToPPT routine to help you export everything to PowerPoint in a single click. While the concept is simple, you can also modify the routine to output certain charts to a specific bookmark in your presentation.
The VBA routine uses an application object to create a new PowerPoint presentation in the PowerPoint application. A new slide is created used the “Add” method, and then each chart is added to its own slide using the CopyPaste methods.
Related Readings
Thank you for reading CFI’s guide to Top 8 VBA Routines for Excel Reporting. To keep learning and advancing your career, the following resources will be helpful:
- How to Debug Code (VBA)
- Tips for Writing VBA in Excel
- Types of Errors in VBA for Excel
- VBA Methods
- See all Excel resources
In this article, we will explain how you can automate the creation of reports. Feel free to use this code as you please. You can copy the code from the bottom of the article.
1. Excel VBA Report Automation – Setting the Scene
On this sheet, you find an overview of all sales in our store. You see the employee that made the sale, the product that was sold, the quantity, and the date of sale.

At each month’s end, we are interested to have an overview of sales per product. So, to obtain this we will automate this process of filtering on each product and extracting the corresponding data to a separate report.
2. Excel VBA — Developer
This can be done by making use of Excel VBA. To open VBA, you navigate to Developer and select Visual Basic.

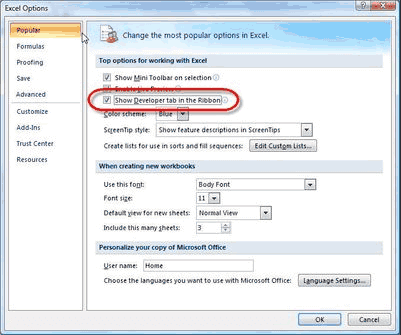
If the Developer tab isn’t part of the ribbon, we first have to include this. To do so, you can navigate to File – Options and Customize Ribbon or you just move your arrow to the ribbon, right-click and select Customize the Ribbon.

On the right side, you can check the box next to Developer to make this tab appear in the ribbon. So, we check the box and press OK. The Developer tab is part of the ribbon now.

So we select it and next click on Visual Basic. Now, the VBA code opens.
3. Excel VBA Report Automation Code
We have already prepared the code called createProductReports.
Remark that we have written this code into a module.

To open a new one, you navigate to Insert and select Module. A new module opens where you can start typing your code.

Now we go through the code to show what happens when we run this macro. At the start of your VBA code, it is always useful to type Option Explicit.
This forces you to declare all your variables and prevents you from making mistakes. Next, we define the output folder for our reports.
Now we are ready to go through the actual function. At the start, we initialize all variables that we use. First, we consider the sheet that contains our data. Then we have a variable that tracks the final row of our data. Next, we have a variable that tracks the final row for each list of the same products. Using uniqueProductList we consider all unique products in our data and we will use the variable product to loop through the list. Next, we use the variable book to create new Excel files in which we paste the data per product. Finally, the variable rowNumber is used to go through all rows in the data and extract all unique product names.

Now that all variables are initialized, we start with the creation of the reports. We first set “sheet” equal to Sheet containing all our data. Next, we indicate we will work with this sheet. We set finalRow equal to the last row that contains data by counting the number of rows in column A. If we only have one line of data, there is only one product type on the sheet, so we don’t have to create separate reports. In that case, we can just exit the function, because nothing has to happen.

In the next lines, we will create a list of all unique products. We first create a new collection and then loop through all products in column B and add all unique values. We have added “on error resume next” to make sure that we don’t get an error message when a product is identified that is already part of the collection. By using “on error resume next” we ignore this message and go on with adding the unique products.

In the next part of the code, we filter data on product type and copy-paste the data to a new Excel file. To do that, we loop through the unique product list. We select the entire range of data in columns A till D, filter on column B on each unique product, and copy this data. Next, we create a new workbook and paste the data in there.
When you have pasted this data, it’s also possible to add whatever you like in this new workbook. Here, we also add the total number of products per type. To do this we sum all quantities in column C and put this number at the end of this column.
Finally, we save the workbook and close it.

This concludes our tutorial on reporting automation using Excel VBA.
Option Explicit
Public Const Output_Folder_Path As String = “C:DesktopReport Automation”
Sub createProductReports()
‘Initializing the variables
Dim sheet As Worksheet
Dim finalRow As Long
Dim finalProductRow As Long
Dim uniqueProductList As Collection
Dim product As Long
Dim book As Workbook
Dim rowNumber As Long
Set sheet = ThisWorkbook.Worksheets(“Sheet1”)
With sheet
finalRow = .Cells(Rows.Count, “A”).End(xlUp).Row
If 2 > finalRow Then Exit Sub
‘Creating the unique product list
Set uniqueProductList = New Collection
With sheet
On Error Resume Next
For rowNumber = 2 To finalRow
uniqueProductList.Add .Cells(rowNumber, “B”).Value, CStr(.Cells(rowNumber, “B”).Value)
Next rowNumber
End With
‘Filtering data on product type and copy pasting the data to a new Excel file
For product = 1 To uniqueProductList.Count
.AutoFilterMode = False
.Range(“A1:D” & finalRow).AutoFilter .Range(“B1”).Column, uniqueProductList.Item(product)
.Range(“A1”).CurrentRegion.Copy
Set book = Workbooks.Add
book.Worksheets(1).Paste
finalProductRow = book.Worksheets(1).Cells(Rows.Count, “A”).End(xlUp).Row
book.Worksheets(1).Cells(finalProductRow + 1, 3).Value = Application.Sum(Worksheets(“Sheet1”).Range(“C2:C” & finalProductRow))
book.SaveAs Filename:=Output_Folder_Path & Replace(uniqueProductList.Item(product), ” “, “”) & “.xlsx”
book.Close False
Set book = Nothing
.AutoFilterMode = False
Next product
End With
Set uniqueProductList = Nothing
Set sheet = Nothing
End Sub
What is Visual Basic Applications ( VBA Macros)
VBA is a programming language which is developed by Microsoft to be used for the Microsoft office package such as Word, Access, Excel and others. It is used to customize the applications to meet the needs of the business. It is a powerful and convenient tool to perform an operation repeatedly and also helps in analyzing the data. VBA is used to access the functions of applications and controls them within some other applications. Financial reporting and analysis is done in an effective and efficient way using VBA Macros.
VBA in excel is used to generate, format and print reports using graphical representations like charts. The reports are generated with ease and it is simple with the help of VBA Macros. The reports are generated using various options as per the need of the management.
Using VBA Macros in Excel for Reporting
To use VBA in Excel you should make sure that the Developer tab is present in the Menu tab.
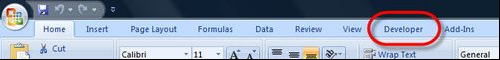
If the Developer Option is not available in the Menu tab then Go to Office Button à Excel Options à Click on the Show Developer tab Check box and click Ok.
After making this option available you can start using Visual Basic. Under the Developer tab click Visual Basic option
Click Insert Menu à User Form option
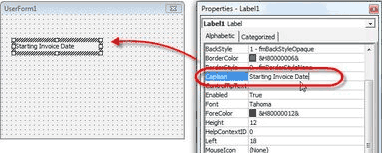
Select Label option from the Tool box
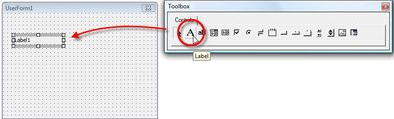
Right Click on the Label and you will get the Properties Dialog box where you can enter a Caption for the Label.
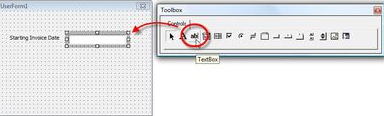
Now select the Text box icon from the Tool Box and keep it next to the Label box. And then right click on the Text Box and in the Properties Pop Up menu enter a Name for the Text Box in the Name Property.
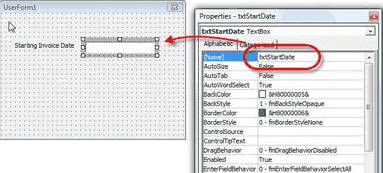
Repeat the steps to add as many labels and text box you want to enter in the User Form area.
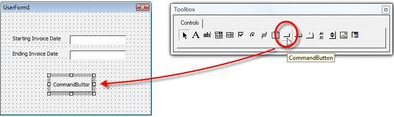
Now select the Command Button option from the Toolbox and place it in the form. Right click and from the properties pop up Enter the command which you want from the Captions Property.
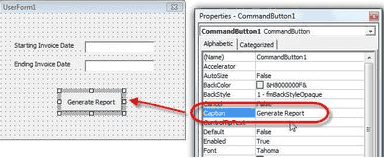
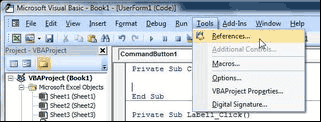
After all the user interface data is entered now you need to enter the Code to generate the report. To open the Code Window double click on the Command Button which is placed in the form.
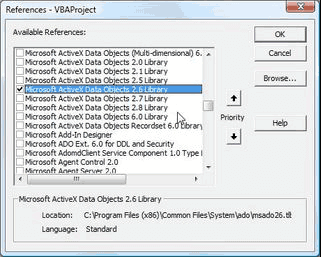
Before the code is inserted you need to set a reference which will help you to access the VB database. To select references Tools Menu à References
From the Dialog Box select the type of Library which you want to use. In this picture the Microsoft ActiveX Data Objects 2.6 Library check box is selected.
In the Code Window enter the code which is used to Run the command. The Code is Placed between “Private Sub CommandButton1_Click()” and End Sub.
You can also add functions in the Code Window which is used to generate the report.
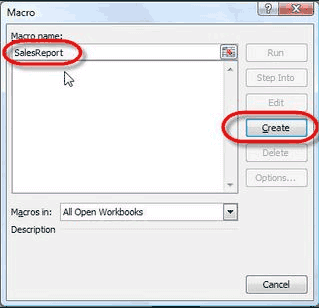
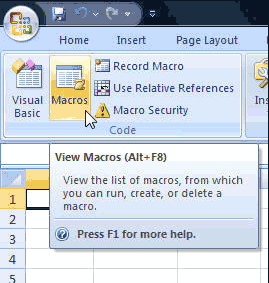
After the code is entered, you need to create Macros for the data. Go to Developer Tab à Macros to use the Macros Menu.

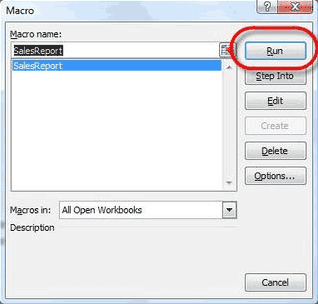
Enter a Macro Name for the report and click Create Button.
Enter a code for the form between Sub and End Sub option
After all these steps are done now you are all set to run the report.
To run the report follow the below steps:
Click on Macros Menu under the Developer tab
Select the Macro Name from the list and Click on the Run button
Enter the necessary details to generate the report.
Finally the report is generated as per your need.
Understanding Variables, Conditions and Loops in VBA
First let’s see what all the three terms mean in VBA
Variable – It is a small part of system’s memory which is used to store data
Condition – It is a logical check which the computer performs to test something
Loop – It is a set of instructions which is to be followed for particular number of times
Now we shall see how to use all these three in VBA
Creating Variables in VBA Macros
If you want to use a variable in VBA Macros you first need to create them. DIM is the statement which is used to create any variable.
Following are few examples of variables created
- Dim someNumber As Integer – This tells you that you are going to use some Number variable to store Integer values only. This is used in VBA as someNumber = 7, that means it stores 7 into the variable someNumber
- Dim myList(1 To 10) As String – This line means that you want to use a list of values which is in the form of String (Text). And the list size is limited to 10. This is used as myList(5) = 792, means it sets the value of 5th item in myList array to 792.
- Dim otherNumber As Double
- Dim anotherList() As Variant
- Dim someText As String
- Dim myCells As Range
- Dim myChart As Chart
- Dim aCondition As Boolean
Using Conditions in VBA Macros
Everything in computer involves decision making and testing conditions. There are a lot of statements to test conditions. Few are explained below for your understanding
If Then Statement
Using If statement is really easy in VBA Macros. Here is an example to test the purchase condition
If ourPurchase < 600 or ourPurchase > 6000 then
‘special instructions to handle too many or too little purchases
end if
Else Statement
Else statement is used when a If condition is failed.
If ourPurchase < 600 or ourPurchase > 6000 then
‘special instructions to handle too many or too little purchases
Else
‘Note down the purchases and move on
end if
Using Loops in VBA Macros
There are several ways to write loops in VBA. Here we have mentioned the easiest type of Loop for your easy understanding
For Loop
For Loop is used to repeat a set of instructions for a particular number of times
For storeNumber = 20 to 50
‘call the store
‘ask for sales figure
‘do something if needed
‘hang up
Next storeNumber
For Each Loop
This type of loop is used to run the same instructions for each of the items in a list.
For Each cell in Range(“B1:B10”)
cell.value = cell.value + 2
Next cell
Shortcuts
There are few important shortcuts you should know while using VBA in Excel
- ALT + F11 – To view VBA Editor also known as VBE
- ALT + F8 – To display all macros
- ALT+Q: To close VBA Editor and return to Excel
- F5: To run a Macro
- F2: Display Object Browser
- F7: Display code editor
- CTRL+G: Open immediate window
- F1: Display help
Analysis ToolPak
Analysis ToolPak is an add-in program which is a default built in program in Microsoft Excel. It is a data analysis tool and helps in financial, statistical and engineering data analysis. You can always save your time and energy by using Analysis ToolPak.
You just need to provide the data for the analysis and Analysis ToolPak uses the appropriate macro function and displays the result in the output table. They also produce charts sometimes along with the reports.
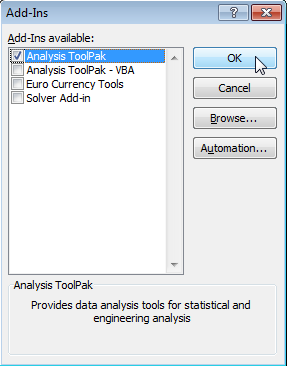
To load the Analysis ToolPak follow these simple steps
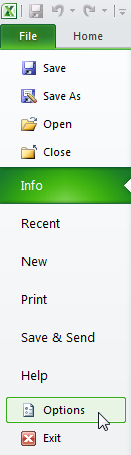
Go to the Green File Tab and click on Options
In the Manage drop down box select Excel Add-ins and then click Go
In the Add-ins dialog box select Analysis ToolPak check box and click Ok.
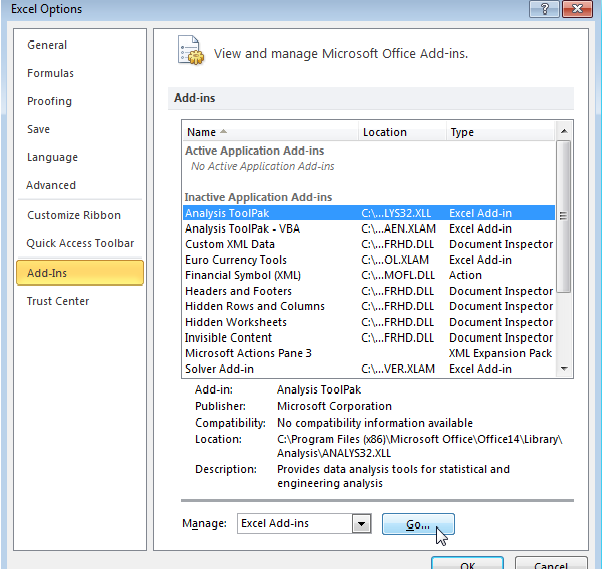
If the Analysis ToolPak option is not available then click Browse option. If it is available select the check box against the Analysis ToolPak option and click Ok.
Now in the Data tab you can click on Data Analysis
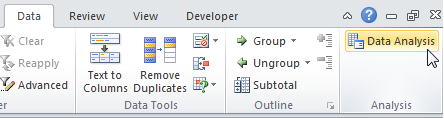
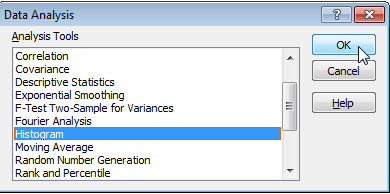
Finally you can select an option which you need to be done in the excel. In the below picture Histogram is selected to create a Histogram in Excel for the given data.
There are totally 19 data analysis options available in Analysis ToolPak. They are listed below
- Anova: Single Factor
- Anova: Two-Factor with Replication
- Anova: Two-Factor Without Replication
- Correlation
- Covariance
- Descriptive Statistics
- Exponential Smoothing
- F-Test Two Sample for Variance
- Fourier Analysis
- Histogram
- Moving Average
- Random Number Generation
- Rank and Percents
- Regression
- Sampling
- t-Test: Paired Two Sample for Means
- t-Test: Two-Sample Assuming Equal Variances
- t-Test: Two-Sample Assuming Unequal Variances
- Z-Test: Two-Samples for Mean
Few of these data analysis methods are explained in detail below with screenshots of the same
Descriptive Statistics
Once Analysis ToolPak is installed you will get the Data Analysis dialog box where you have a list of choices. Choose Descriptive Statistics. After choosing this option you will get a dialog box as shown in the picture below
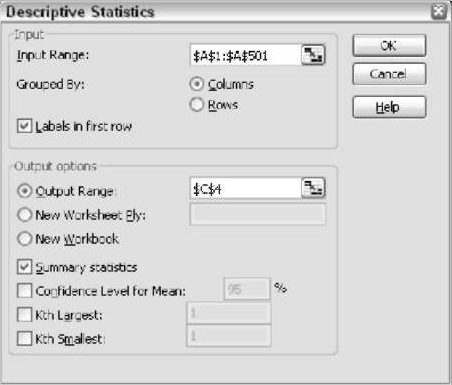
In the dialog box you can enter the details like the range of the source data, where the results have to be displayed and what results are to be displayed. Below is the output of descriptive statistics
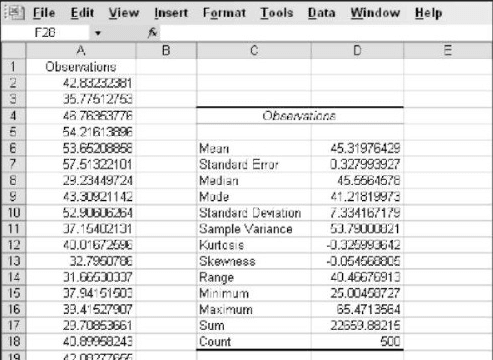
One major disadvantage of using Descriptive statistics option is that it displays the result as values and not in the term of formulas. So if there is any change made to the source data it will not be reflected in the output. You need to re do the entire method from beginning.
Creating Histogram
Histogram is a set of counts within particular ranges. The ranges are known as bins in Histogram. From the same Data Analysis dialog box select Histogram option. You will get a dialog box as represented in the picture below
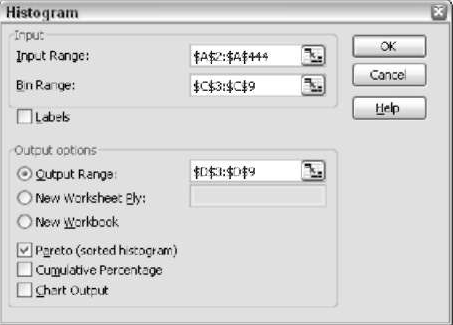
You need to enter the details like the range of the source data, range of the bin designations and where the result has to be displayed. The result will show you the distribution of data along with the parameters as shown in the picture below
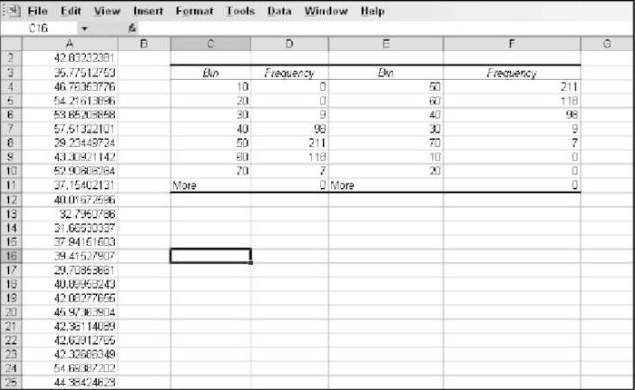
The histogram dialog box also gives you an option to produce a chart along with the output. This will give you easy understanding.
Moving Averages
This option will help you to identify trends in sequential data. The source data here is period based and the average is always calculated for a number of periods. Below given is the Moving Averages dialog box

In this dialog box you can select the range of the source data, the interval step and the output range. The interval step is the main factor of Moving Averages as the output is based on that. This also gives you an option to create a chart in the output as shown below
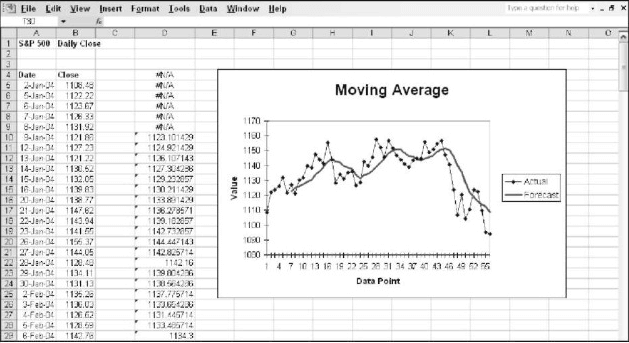
In this figure you can clearly see that the 6 cells starting from D4 do not return any value as we have entered the Interval step as 7.
Advanced Random Number Generation
This is one among the options in Data Analysis dialog box. Once it is selected you will get the below Random Number Generation dialog box.
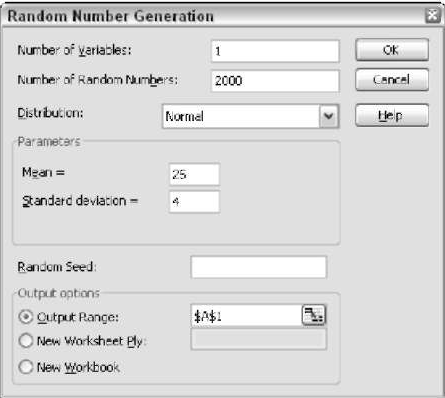
Even Excel has this option but Random Number Generation option in Analysis ToolPak is much more advanced than that of Excel. Here you can have more control about
- Number of Variables
- Number of Random Numbers
- Random Speed
In the dialog box you can see a drop down list box where you can select the distribution type and parameters for each distribution.
Creating Random sample
One of the options in Data analysis dialog box is Sampling. Clicking this option will show you another dialog box as shown in the picture below
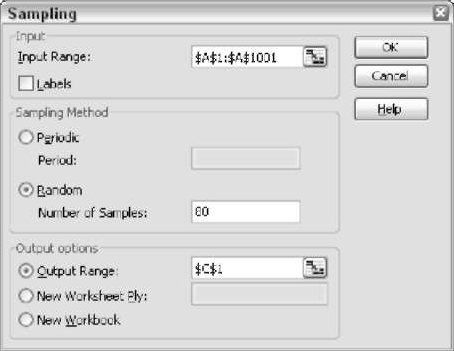
Statistical analysis is mostly done on a sample of the population and not on the entire population. This dialog box gives you an option to enter the source population data and where the data has to be placed. You can select the sampling method. If you select Periodic Method then you can follow the step pattern. If you select the Random method then you should provide the number of values which should be returned.
This method is very easy and can help you to generate a sample instantly.
Conclusion
Thus using VBA for reporting and analysing is a wise decision for accounting and financial professionals as it reduces their time and effort. It also provides accurate information in various forms efficiently and effectively.