
I’ve recently seen a wave of questions from clients and peers about difficulties exporting reports to Excel lately. Every few weeks I get a call or question about this. This topic has been a recurring theme for a very long time and one that I have encountered many times over the past – oh, eleven years or more – using SSRS. Business users like Excel because it’s what they know and they can reformat and manipulate data in a workbook. People like Reporting Services because all the hard work of connecting to data sources, writing queries, totaling, grouping and formatting the results gets done once and then all they need to do is run the report. Users want the best of both worlds and they expect that when they export a report to Excel that they should have their cake and eat it. In other words; they should be able to get a report, with all the goodness of headers, scrolling regions, pagination, interactive sorting – you name it – to work exactly the same way in Excel. Many improvements have been made to all of the report rendering extensions over the years and the Excel export story is better than ever but here’s the deal – bottom line – the more rich formatting and advanced functionality that gets designed into an SSRS report, the less likely it is to export all that functionality to Excel or any other rendering format.
I’ve come to realize that if users really want their data in Excel, rather then Reporting Services, they should be using Excel! Before you laugh or blow this off, please consider that there is a whole spectrum of opportunity to use Excel as a serious reporting and analytic tool with or without SSRS in the mix. If you know me, you know of my love for Reporting Services but I’ve learned to open my mind to other options and I hope to convince you to do the same. Six or seven years ago, the BI and reporting product teams at Microsoft came to the realization that Excel was much more than a spreadsheet application and people were using it for all kinds of serious business functions. A shift in thinking took place which resulted in add-in tools like Power Pivot, Power Query, rich native visual components and a slew of new Office Apps. If you understand Power Pivot you know that it’s not really an extension of Excel but rather an analytical technology that you can get to from Excel – and then Excel has all kinds of functionality to leverage “the Data Model”, or Power Pivot. Likewise, Power Query is essentially and ETL tool that can be enabled as an Excel add-in but isn’t really part of Excel. Of course user perception is that these are Excel features but they’re actually Excel extensions that can also be used externally in tools like the Power BI Dashboard Designer.
I digress… realistically, what other options do you have to get richly-formatted data into Excel – in native form – without all the baggage to comes with exporting from and SSRS report? I’ll enumerate some options and then explore them.
-
Connect to data sources directly from Excel and build reports using tables, Pivot Tables and Pivot Charts. I see this option dismissed frequently because some Excel users don’t realize the power and flexibility of Pivot Tables with filters and slicers. It doesn’t take a lot of work to flatten a Pivot Table so it looks and works just like a grouped table or matrix in SSRS. Conditional formatting, data bars, sparklines, KPI indicators, Excel filters and slicers rock when they’re used correctly.
-
Use Power Query and/or Power Pivot to import data and then build Excel reports. These tools are extremely powerful but the skill ramp-up can be significant for a novice Excel jockey without some special training and experience. They will also need Excel ProPlus and probably the 64-bit version of Windows and Office installed. Businesses are successfully creating a data analytic culture by arming their users with these tools but it’s not for everyone or every business.
-
Use an Atom Feed to stream live data from a Reporting Services report to an Excel workbook. This option has the advantage of being both simple and flexible but it can solve many problems with one fairly simple solution. The report datasets have already been written and the data is structured the way users need it. A preformatted Excel report is created with the connection. The user simply opens the Excel file and data is automatically refreshed in the right format. If they want to change parameter values, all they need to do is resave the Atom Feed file and the workbook magically sees filtered data based on the updated parameter selection. I’ll post a more detailed follow-up to demonstrate just how cool and flexible this capability is.
I’m most encouraged by option 3 as an extension to option 1. Excel truly is the undiscovered business reporting tool that is on every user’s desktop and learning to use it in concert with these add-ins and SSRS Atom Feeds can literally give you the best possible combination of options. With a little preparation and very little user training, business users truly can have it all. In many cases, they won’t even know the difference but they’ll be delighted when Excel behaves exactly like …Excel.
The following video walk-through shows this technique. Rather than exporting to Excel, using a data feed from a Reporting Services report lets users utilize native Excel features and formatting instead of creating a static copy of the report in a workbook. For true spreadsheet users, this means that they can are able to use Pivot Tables & charts, filters, slicers, subtotals, totals & formulas with report data just like they would with any other analytic data in Excel. When a workbook is opened or refreshed, data is consumed by the data sources and datasets using parameters in the report, and then fed to the workbook as a live data source. Security & complex queries are managed within the report and users get all the flexibility they want in Excel.
Virgilio
2008-09-26
Hello,
Is there any way that we can use an images as a data source.
This is the scenarion.
Daily I’m emailed a report that contains several charts.
I have a SSRS report deployed and I would like to create a lable that redirects to this image’s path \myservere$myfolderimage
So next day I can overrite the image(updating it with new report) in that path and the SSRS report will refresh the content.
Am I crazy????
Joe Webb
2008-09-29
Images are really just pictures and don’t have datasets from which to draw data. So, no, you cannot use images as a dataset.
On the otherhand, if you have access to the underlying datasat that made up the images, then sure.
HTH…
Joe
Joe Webb
2008-09-29
Images are binary representations of the data. But unfortunately, they don’t contain the data itself. So you cannot use an image as a datasource for your dataset.
If you have access to the original information, you can use.
HTH…
Joe
Theunis
2008-10-08
Can one extract an image from an Excel document that is set up as a data source? In other words can I display in my report an image that is contained in the excel document?
Thanks
Michael
2008-10-27
I’ve been given the task of automating some forms with SSRS 2005 with data from an excel document. I have the data populating just fine, i have my dataset working, everything seems to be good. My problem is that i cannot figure out how to get parameters to work. I need to be able to set a start date and end date when the forms are run. It keeps telling me that i have too few parameters which means i’m calling the data wrong. What is the syntax for setting up parameters in the TSQL?
Thanks
Joe Webb
2008-10-28
Why not use filters?
Michael
2008-10-28
The form will be posted to our reporting server and the people who will actually be using it want to be able to set date ranges for the print outs, that way they aren’t printing every record out.
Joe Webb
2008-10-28
Right, you can create a dataset based on the entire spreadsheet. Then use report parameters to prompt the user for what they’d like to see. And finally use a filter on the data region to limit the output based on their preferences. That would be more efficient.
Michael
2008-10-28
Ah right right, i was initially trying to filter from my dataset but i can definatly do it afterwards. Thanks!
Rajasekaran
2009-02-19
Hi I did the above mentioned steps to create datasource connect to excel. But its not happending
My test connection is BIDS level are success but i could able to get the data from the sheet as well.
Please provide some way to connect it down
Raj
2009-04-17
Hi all,
I am planning to use SQL reporting 2005 with MS excel 2007 as a datasource. Could you please let me know I should to use ODBC or OLE DB?. If anyone can give config details that will be a great help. Also once connected, can I use
SELECT *
FROM [Sheet1$]
command to get the data from excel ?. Please give me a reply. Thanks
Jane Woodhouse
2009-05-27
I want to filter data from spreadsheet with WHERE in Select Query. I can select * from [spreadsheetname$] but want to add WHERE ‘spreadsheet cell’ <> ‘blank’ or empty. Cannot get the syntax correct. Any help?
ram
2009-07-10
Hey,
u can use
SELECT *
FROM [Sheet1$] column1 <>»»
ram
2009-07-10
sorry i missed where clause
SELECT *
FROM [Sheet1$] where column1 <>»»
Navin
2010-02-12
Getting error on using the query
SELECT *
FROM [Sheet1$] where column1 <>@Column1
An error occurred while executing the query.
ERROR [07002] [Microsoft][ODBC Excel Driver] Too few parameters. Expected 1. (Microsoft Report Designer)
===================================
ERROR [07002] [Microsoft][ODBC Excel Driver] Too few parameters. Expected 1. (odbcjt32.dll)
Navin
2010-02-12
its called unnamed parameter use questionmark for paramter . I am not sure on multi value as its not owrking when i place it with in.
FROM [Sheet1$] where column1 <>?
Venkat
2010-02-23
Is it possible to JOIN on the data retrieved from the Excel Source with the data existing in the SQL Database and produce a report? Or is this feature not available?
Simon
2010-03-24
multi-parameter in a dataset is ok, but all parameter names become questionmark.
I would like to ask do you know how to
1) alias the parameter name
2) is seems IN clause can not work in this case, does anyone know how to use IN clause?
3) can we join several worksheets in a Excel, just like joining different table in database?
Chloe
2010-04-21
I have locking issues on the source excel sheet, and I need to be able to update the data and for the RS report to refresh. Is there any way of getting round this?
geld
2010-06-16
You can use graphic reporting instead of images but there is no way to put images with vba
dataman777
2010-10-21
This works fine from the BIDS console or on a single machine but not on a server running SSRS using shared datasources to connect to a backend database on another server. Any insite on creating a shared ODBC connection inside report manager data source folder on the SSRS server?
I can create a ODBC connection logged on the SSRS Windows 2008 64-bit server from adninistrative tools by changing the target to sysWOW64 as described above but from the Report Manager Datasource folder create new datasource I recieve this error:
ERROR [IM002] [Microsoft][ODBC Driver Manager] Data source name not found and no default driver specified
I also tried embedding the ODBC datasource inside the .rdl to no avail.
Emtucifor
2010-11-23
Folks,
You can do this without a DSN and ODBC. In fact, you don’t even need to create a Data Source.
Add a Data Flow Task to the package. In the Data Flow Task, add an Excel Data Source. Poof, you’re reading from Excel.
marimuthu
2010-12-20
HI,
I want to read the multiple sheet data in excel sheet, its posible.
But one thing , each sheet have diffrent database fields.
George
2011-01-06
Hi,
I am using Excel as an ODBC datasource for a SSRS report. However, when i add or edit data to the excel worksheet. the data is not updating in SSRS? Do i need to re-create the Datasource and ODBC every time i edit anything in the worksheet?
Thanks
George
2011-01-06
nvm…just took a while to update
Suresh
2011-02-05
Hi,
I created system DSN and called dat from BIDS.
But, in the query designer, I am getting the error.
Error in FROM clause: near ‘[‘.
Unable to parse query text.
SELECT *
FROM [ExcelDS]
is my query whereas ExcelDS is the my sheet name.
Do I need to give path name also? I already gave path at workbook path while creating DSN.
Reply at the earliest please…
Suresh
2011-02-05
Sorry, missed $ in my query
SELECT *
FROM [ExcelDS$]
is my query, please help
Prasad
2011-03-22
EError in FROM clause: near ‘[‘.
Unable to parse query text.
SELECT *
FROM [Sheet1$]
How to solve this problem
Abhi
2011-04-19
Need some help.
a. When using Excel 2007 as data base for SSRS report I am able to generate and run SSRS report properly on Microsoft Visual Studio (on my pc)
b. But when I deploy the report and data source on SSRS report server it asks for DSN name (here I get stuck)
i. If I give full dsn path it says DSN name too long (dsn also on server in same folder)
ii. Doesn’t recognize the file if no address is given (even though dsn and datasource file are in same folder on report server)
iii. If I remove DSN it says “Cant find datasource name and default driver not specified” (without DSN in connection string it is working fine on my PC)
Thanks in Advance!
Lakks
2011-06-21
Hi,
Can anyone help on converting a numeric values present on Column1 as string..
Robert
2011-10-14
Is there a way to use Excel to drive an SSRS 2008 R2 report. The idea is that the SSRS report takes a parameter. I would like to loop through an Excel Spreadsheet column, pick up the value and call the SSRS report passing the parameter. I also want to render the report as a PDF and place it in a specific folder on my local or shared drive. Is this possible and are there any examples of doing this?
Thanks, appreciater your blog.
John
2011-12-16
Make sure that you have unchecked Read-Only Option while configuring excel work book….
This article explores the report filtering using Excel Slicer and SQL Server Reporting Services.
At the heart of interactive reporting is the ability for end-users to filter report datasets according to their preference. Therefore, a great data visualization tool is the one that caters for report filtering. Some of the popular data visualization tools used by some of my clients to consume my Business Intelligence solutions usually include SQL Server Reporting Services (SSRS) and Microsoft Excel. Although these tools share a similar publisher, Microsoft, they have several differences on their report usage and configuration. One difference they seem to share is in the way they are configured to enable report filtering, which is the focus of this article.
Case study
Likewise, proper discussions surrounding topics relating to SQL Server are better explained through technical demonstrations. Consequently, the dataset that will be used to produce SSRS and Excel reports will be based on the dummy data that was imported as part of the demo in my article, Working with Ragged Right Formatted Files in SSIS. For the purposes of this article, I have further transformed this data and represented it in a form of a SQL Server View titled, FruitSales.
The definition of the view can be downloaded here.
Figure 1 shows the execution results of a SELECT T-SQL command against the FruitSales view.
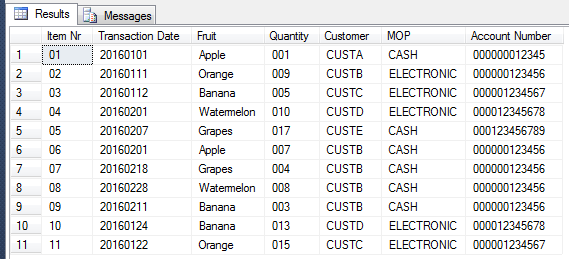
Figure 1: Data contained in the FruitSales view
A typical business case with such a dataset could be as follows:
- As a business user, I would like to see breakdown of customers by the total number of quantities of fruits they have purchased to date.
- I would also like to filter the report by fruit names.
Figures 2 and 3 respectively show an SSRS and Excel reports that have been developed to address the aforementioned business case. As it can be seen, from the perspective of an end-user, the reports are almost similar with SSRS implementing reporting filtering through a multi-select Fruits parameter and Excel Pivot making use of Fruit Slicer.
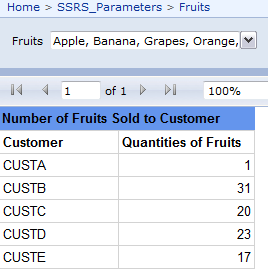
Figure 2: SSRS Representation of our business case
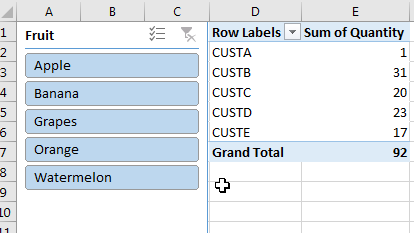
Figure 3: Excel Pivot Representation of our business case
However, one advantage that Excel Pivot report has over SSRS is the ease at which end-users can add and remove slicers (or filters). Whilst an SSRS report requires development IDE like SSDT, BIDS, or Report Builder to add and remove report filters, in Excel – as a developer, you leave it to users to configure their own filters by going through the following few steps:
Step 1: Insert Excel Slicer
Navigate to the INSERT menu and click on Slicer under the filters section of the tool bar as shown in Figure 4.
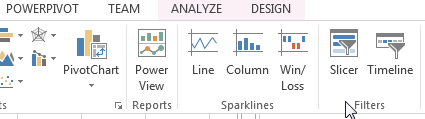
Figure 4: Excel Slicer Toolbar
Upon clicking the Excel Slicer button, an Insert Slicers dialog box comes up and allows you to choose you slicers from a list of all available fields from your dataset as shown in Figure 5.
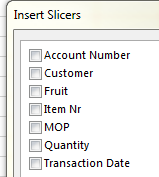
Figure 5: Available Excel Slicer Fields
Furthermore, adding multiple slicers in Excel is just a matter of checking boxes next to the fields you want to filter on.
SSRS Report filtering using parameters
As mentioned in the previous section, whilst introducing slicers in Excel is the matter of checking boxes next to the fields you want to filter on, SSRS requires that several datasets (in addition to the main dataset) be added in order to have the additional filters appear in the report. You have an option in SSRS to populate parameters based on the main dataset but unlike in Excel, the values are duplicated as shown in Figure 6.
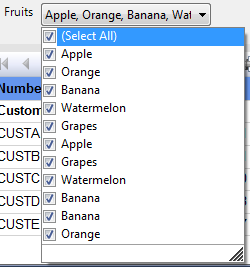
Figure 6: Duplicate SSRS Parameter values
Thus the best way to populate parameters is to set up a new dataset.
The following is a list of steps that are required to setup report parameter in SSRS:
Step 1: Setup Data Source in SSRS Report
This is where you configure your connection string to SQL Server. You have an option to skip this step provided you have already configured a shared data source in your report.
Step 2: Setup Dataset in SSRS Report
In the case of our Fruits report filter, a new dataset was setup with a text query type which ensured that we eliminate duplicates by retrieving a unique fruit names from our FruitSales view, as shown in Figure 7.
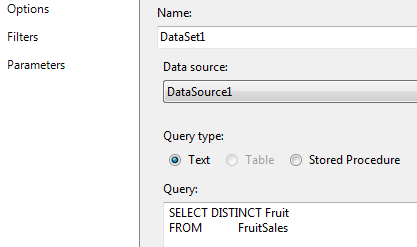
Figure 7: Report dataset to populate fruit parameter values
Step 3: Add New Parameter in SSRS Report
Once your dataset is setup, you have to navigate to the Parameters folder (which is found under the Report Data window) and click add new parameter button. When the SSRS Report Parameter Properties dialog comes up, configure Available Values and Default Values of the parameter to be populated by the new dataset, as shown in Figure 8.
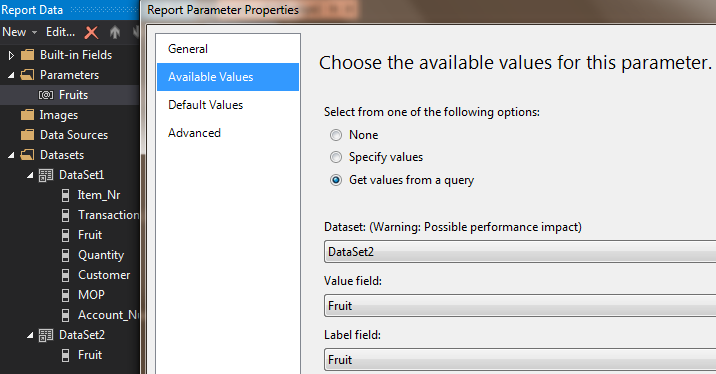
Figure 8: Report parameter properties
Now, should business users later realize the need to further filter the SSRS report by – for instance, Method of Payment (MOP) – you will, unfortunately, have to repeat all steps 1-3 again.
The performance cost
It’s not just the number of steps that you have to perform to set up additional filtering in SSRS Report, but there is a SQL Server performance angle to it too. Because every parameter has its own dataset, then whenever an SSRS report is executed, separate SQL Server database connection sessions are generated to retrieve and populate report parameter values.
To demonstrate this point, I set up a database trace prior to running both an SSRS report and Excel Pivot report. When we refresh the Excel Pivot report, only a single SQL:BatchCompleted event class is generated as shown in Figure 9. We can also see the T-SQL script that was executed as part of refreshing the report, which was the execution of the FruitSales view.
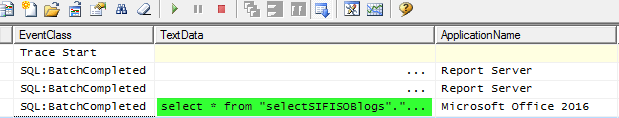
Figure 9: Trace Output for Excel Report
The trace results of an SSRS report refresh indicate that in addition to executing the FruitSales view, another T-SQL script was executed to retrieve unique fruit names as shown in Figure 10. It is important to note that only two scripts were executed because we only have one parameter if, later, business requires additional parameters, then more T-SQL scripts will come up in the trace.
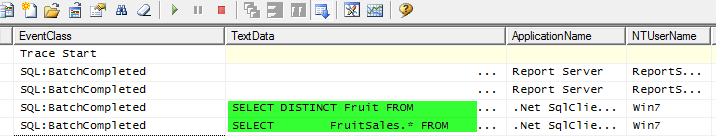
Figure 10: Trace Output for SSRS Report
Conclusion
The purpose of this discussion has not been to underestimate the value of SSRS Report instead to share a scenario (report filtering) whereby the use of Excel could be more convenient for report end-users and development team than SSRS. The convenience of filtering report using slicers in evident in the ability for users to select multi-slicers by checking boxes which reduces some dependencies on report developers.
Reference:
- SQL:BatchCompleted Event Class
- How to Use Excel Slicers
- SSRS Report Parameters
- Author
- Recent Posts

Sifiso is Data Architect and Technical Lead at SELECT SIFISO – a technology consulting firm focusing on cloud migrations, data ingestion, DevOps, reporting and analytics. Sifiso has over 15 years of across private and public business sectors, helping businesses implement Microsoft, AWS and open-source technology solutions. He is the member of the Johannesburg SQL User Group and also hold a Master’s Degree in MCom IT Management from the University of Johannesburg.
Sifiso’s LinkedIn profile
View all posts by Sifiso W. Ndlovu
| title | description | author | ms.author | ms.date | ms.service | ms.subservice | ms.topic | ms.custom |
|---|---|---|---|---|---|---|---|---|
|
Export a paginated report to Microsoft Excel (Report Builder) |
In Report Builder, the Excel rendering extension renders a paginated report to the Office Open XML format to use with Microsoft Excel. |
maggiesMSFT |
maggies |
03/24/2023 |
reporting-services |
report-builder |
conceptual |
updatefrequency5 |
Export a paginated report to Microsoft Excel (Report Builder)
[!INCLUDEssrs-appliesto] [!INCLUDE ssrs-appliesto-ssrs-rb] [!INCLUDE ssrs-appliesto-pbi-rb] [!INCLUDE ssrb-applies-to-ssdt-yes]
The Excel rendering extension renders a paginated report to the [!INCLUDEofprexcel] format (.xlsx). With the Excel rendering extension, the width of columns in Excel more accurately reflects the width of columns in reports.
The format is Office Open XML. The content type of files generated by this renderer is application/vnd.openxmlformats-officedocument.spreadsheetml.sheet and the file extension is .xlsx.
You can change some default settings for this renderer by changing the device information settings. For more information, see Excel Device Information Settings.
See Export Reports (Report Builder and SSRS) for details on how to export to Excel.
[!IMPORTANT]
When you define a parameter of type String, the user is presented with a text box that can take any value. If a report parameter is not tied to a query parameter and the parameter values are included in the report, it is possible for a report user to type expression syntax, script, or a URL into the parameter value, and render the report to Excel. If another user then views the report and clicks the rendered parameter contents, the user may inadvertently execute the malicious script or link.To mitigate the risk of inadvertently running malicious scripts, open rendered reports only from trusted sources. For more information about securing reports, see Secure Reports and Resources.
Excel Limitations
[!INCLUDEofprexcel] places limitations on exported reports due to the capabilities of Excel and its file formats. The most significant are the following:
-
The maximum column width is limited to 255 characters or 1726.5 points. The renderer does not verify that the column width is less than the limit.
-
The maximum number of characters in a cell is limited to 32,767. If this is exceeded, the renderer displays an error message.
-
The maximum row height is 409 points. If the contents of the row cause the row height to increase beyond 409 points, the Excel cell shows a partial amount of text up to 409 points. The rest of the cell contents is still within the cell (up to Excel’s max number of characters of 32,767).
-
Because the maximum row height is 409 points, if the defined height of the cell in the report is something larger than 409 points, Excel splits the cell contents into multiple rows.
-
The maximum number of worksheets is not defined in Excel, but external factors, such as memory and disk space, might cause limitations to be applied.
-
In outlines, Excel permits up to seven nested levels only.
-
If the report item that controls whether another item is toggled is not in the previous or next row or column of the item being toggled, the outline is disabled also.
For more details about Excel limitations, see Excel specifications and limits.
Sizes of Excel 2003 (.xls) Files
[!IMPORTANT]
The [!INCLUDEofprexcel] 2003 rendering extension is deprecated. For more information, see Deprecated Features in SQL Server Reporting Services in SQL Server 2016.
When reports are first exported and saved to Excel 2003, they do not benefit from the file optimization that Excel automatically applies to its *.xls workbook files. The larger file size can cause problems for e-mail subscriptions and attachments. To reduce the size of the *.xls files for exported reports, open the *.xls files and then resave the workbooks. Resaving the workbooks typically reduces their file sizes by 40 to 50 percent.
[!NOTE]
In Excel 2003, approximately 1000 characters are displayed in an Excel cell on the worksheet but up to the maximum number of characters can be edited in the formula bar. This limitation does not apply to current (.xlsx) Excel files.
Text Boxes and Text
The following limitations apply to text boxes and text:
-
Text box values that are expressions are not converted to Excel formulas. The value of each text box is evaluated during report processing. The evaluated expression is exported as the contents of each Excel cell.
-
Text boxes are rendered within one Excel cell. Font size, font face, decoration, and font style are the only formatting that is supported on individual text within an Excel cell.
-
The text effect «Overline» is not supported in Excel.
-
Excel adds a default padding of approximately 3.75 points to the left and right sides of cells. If a text box’s padding settings are less than 3.75 points and is just barely wide enough to accommodate the text, the text may wrap in Excel.
[!NOTE]
To work around this issue, increase the width of the text box in the report.
Images
The following limitations apply to images:
-
Background images for report items are ignored because Excel does not support background images for individual cells.
-
The Excel rendering extension only supports the background image of the report body. If a report body background image is displayed in the report, the image is rendered as a worksheet background image.
Rectangles
The following limitation applies to rectangles.
- Rectangles in report footers are not exported to Excel. However, rectangles in the report body, tablix cells, and so forth are rendered as a range of Excel cells.
Report Headers and Footers
The following limitations apply to report headers and footers:
-
Excel headers and footers support a maximum of 256 characters including markup. The rendering extension truncates the string at 256 characters.
-
[!INCLUDEssRSnoversion] does not support margins on report headers and footers. When exported to Excel, these margin values are set to zero and any header or footer that contains multiple rows of data might not print multiple rows, depending on the printer settings.
-
Text boxes in a header or footer maintain their formatting but not their alignment when exported to Excel. This occurs because leading and trailing spaces are trimmed when the report is rendered to Excel.
Merging Cells
The following limitation applies to merging cells:
- If cells are merged, word-wrap does not work correctly. If any merged cells exist on a row where a text box is rendered with the AutoSize property, autosize will not work.
The Excel renderer is primarily a layout renderer. Its goal is to replicate the layout of the rendered report as closely as possibly in an Excel worksheet and consequently cells might be merged in the worksheet to preserve the report layout. Merged cells can cause problems because the sort functionality in Excel requires cells to be merged in a very specific way for sort to work properly. For example, Excel requires that the ranges of merged cells have the same size in order to be sorted.
If it is important that reports exported to Excel worksheets can be sorted, then the following can help you reduce the number of merged cells in your Excel worksheets, which is the common cause for difficulties with Excel sort functionality.
-
Not aligning items left and right is the most common cause of merged cells. Make sure the left and right edges of all report items line up with one another. Making items align and the same width will solve the problem in the majority of cases.
-
Although you align all items precisely, you might find in some rare cases that some columns continue to be merged. This could be caused by internal unit conversion and rounding when the Excel worksheet is rendered. In the report definition language (RDL), you can specify position and size in different measurement units such as inches, pixels, centimeters, and points. Internally the Excel uses points. To minimize conversion and the potential inaccuracy of rounding when converting inches and centimeters to points, consider specifying all measurements in whole points for the most direct results. One inch is 72 points.
Report Row Groups and Column Groups
Reports that include row groups or column groups contain empty cells when exported to Excel. Imagine a report that groups rows on commute distance. Each commute distance can contain more than one customer. The following picture shows the report.

When the report is exported to Excel, the commute distance appears only in one cell of the Commute Distance column. Depending on the alignment of the text in the report (top, middle, or bottom) the value is in the first, middle, or last cell. The other cells are empty. The Name column that contains customer names has no empty cells. The following picture shows the report after it is exported to Excel. The red cell borders were added for emphasis. The gray boxes are the empty cells. (Neither the red lines nor the gray boxes are part of the exported report.)

Reports with row groups or column groups require modification after exporting to Excel and before you can display the exported data in a PivotTable. You must add the group value to cells in which they are missing. Thus, the worksheet becomes a flat table with values in all cells. The following picture shows the updated worksheet.

So if you create a report for the specific purpose of exporting it to Excel for further analysis of the report data, consider not grouping on rows or columns in your report.
Excel Renderer
Current (.xlsx) Excel File Renderer
In [!INCLUDEssNoVersion] [!INCLUDEssRSnoversion], the default Excel renderer is the version compatible with current (.xlsx) [!INCLUDEofprexcel] files. This is the Excel option on the Exporting menus in the [!INCLUDEssRSnoversion] web portal and SharePoint list.
When you use the default Excel renderer, instead of the earlier Excel 2003 (.xls) renderer, you can install the Microsoft Office Compatibility Pack for Word, Excel, and PowerPoint to allow earlier versions of Excel to open the files that are exported.
Excel 2003 (.xls) Renderer
[!IMPORTANT]
The [!INCLUDEofprexcel] 2003 rendering extension is deprecated. For more information, see Deprecated Features in SQL Server Reporting Services in SQL Server 2016.
The earlier version of the Excel renderer, compatible with Excel 2003, is now named Excel 2003 and is listed on menus using that name. The content type of files generated by this renderer is application/vnd.ms-excel and the file name extension of files is .xls.
By default, the Excel 2003 menu option is not visible. An administrator can make it visible under certain circumstances by updating the RSReportServer configuration file. To export reports from [!INCLUDEssBIDevStudioFull] using the Excel 2003 renderer, you update the RSReportDesigner configuration file.
The Excel 2003 menu option extension is never visible in the following scenarios:
-
Report Builder in disconnected mode and you preview a report in Report Builder. Because the RSReportServer configuration file resides on the report server, the tools or products from where you export reports must be connected to a report server to read the configuration file.
-
Report Viewer Web Part in local mode and the SharePoint farm is not integrated with a [!INCLUDEssRSnoversion] report server. For more information, see Local Mode vs. Connected Mode Reports in the Report Viewer (Reporting Services in SharePoint Mode)
If the Excel 2003 menu option renderer is configured to be visible, both the Excel and Excel 2003 options are available in the following scenarios:
-
[!INCLUDEssRSnoversion] web portal native mode.
-
SharePoint site when Reporting Services is installed in SharePoint integrated mode.
-
[!INCLUDEssBIDevStudioFull] and you preview reports.
-
Report Builder connected to a report server.
-
The Report Viewer Web Part in remote mode.
The following XML shows the elements for the two Excel rendering extensions in the RSReportServer and RSReportDesigner configuration files:
<Extension Name="EXCELOPENXML" Type="Microsoft.ReportingServices.Rendering.ExcelOpenXmlRenderer.ExcelOpenXmlRenderer,Microsoft.ReportingServices.ExcelRendering"/>
<Extension Name="EXCEL" Type="Microsoft.ReportingServices.Rendering.ExcelRenderer.ExcelRenderer,Microsoft.ReportingServices.ExcelRendering" Visible="false"/>
The EXCELOPENXML extension defines the Excel renderer for current (.xlsx) Excel files. The EXCEL extension defines the Excel 2003 version. Visible = "false" indicates the Excel 2003 renderer is hidden. For more information, see RsReportServer.config Configuration File and RSReportDesigner Configuration File.
Differences Between the current (.xlsx) Excel and Excel 2003 Renderers
Reports, rendered by using the current (.xlsx) Excel or the Excel 2003 renderers are typically identical and only under rare circumstances will you notice differences between the two formats. The following table compares the Excel and the Excel 2003 renderers.
| Property | Excel 2003 | Current Excel |
|---|---|---|
| Maximum columns per worksheet | 256 | 16,384 |
| Maximum rows per worksheet | 65,536 | 1,048,576 |
| Number of colors allowed in a worksheet | 56 (palette)
If more than 56 colors are used in the report, the rendering extension matches the required color to one of the 56 colors already available in the custom palette. |
Approximately 16 million (24-bit color) |
| ZIP compressed files | None | ZIP compression |
| Default font family | Arial | Calibri |
| Default font size | 10pt | 11pt |
| Default row height | 12.75 pt | 15 pt |
Because the report explicitly sets the row height, the default row height affects only rows that are sized automatically upon export to Excel.
Report Items in Excel
Rectangles, subreports, the report body, and data regions are rendered as a range of Excel cells. Text boxes, images, and charts, data bars, sparklines, maps, gauges, and indicators must be rendered within one Excel cell, which might be merged depending on the layout of the rest of the report.
Images, charts, sparklines, data bars, maps, gauges, indicators, and lines are positioned within one Excel cell but they sit on top of the cell grid. Lines are rendered as cell borders.
Charts, sparklines, data bars, maps, gauges, and indicators are exported as pictures. The data they depict, such as the value and member labels for a chart, is not exported with them and is not available in the Excel workbook unless it is included in a column or row in a data region within a report.
If you want to work with chart, sparkline, data bar, maps, gauge, and indicator data, export the report to a .csv file or generate Atom-compliant data feeds from the report. For more information, see Exporting to a CSV File (Report Builder and SSRS) and Generating Data Feeds from Reports (Report Builder and SSRS).
Page Sizing
The Excel rendering extension uses the page height and width settings to determine what paper setting to define in the Excel worksheet. Excel tries to match the PageHeight and PageWidth property settings to one of the most common paper sizes.
If no matches are found, Excel uses the default page size for the printer. Orientation is set to Portrait if the page width is less than the page height; otherwise, orientation is set to Landscape.
Worksheet Tab Names
When you export a report to Excel, the report pages that were created by page breaks are exported to different worksheets. If you provided an initial page name for the report, each worksheet of the Excel workbook will have this name by default. The name appears on the worksheet tab. However, since each worksheet in a workbook must have a unique name, an integer starting at 1 and incremented by 1 is appended to the initial page name for each additional worksheet. For example, if the initial page name is Sales Report by Fiscal Year, the second worksheet would be named Sales Report by Fiscal Year1, the third one Sales Report by Fiscal Year2, and so forth.
If all report pages created by page breaks provide new page names, each worksheet will have the associated page name. However, these page names might not be unique. If page names are not unique, the worksheets are named the same way as initial page names. For example, if the page name of two groups is Sales for NW, one worksheet tab will have the name Sales for NW, and the other Sales for NW1.
If the report provides neither an initial page name, nor page names related to page breaks, the worksheet tabs will have the default names Sheet1, Sheet2, and so forth.
Reporting Services provides properties to set on reports, data regions, groups, and rectangles to help you create reports that can be exported to Excel in a way that you want. For more information, see Pagination in Reporting Services (Report Builder and SSRS).
Document Properties
The Excel renderer writes the following metadata to the Excel file.
| Report Element properties | Description |
|---|---|
| Created | Date and time of report execution as an ISO date/time value. |
| Author | Report.Author |
| Description | Report.Description |
| LastSaved | Date and time of report execution as an ISO date/time value. |
Page Headers and Footers
Depending on the Device Information SimplePageHeaders setting, the page header can be rendered in two ways: the page header can be rendered at the top of each worksheet cell grid, or in the actual Excel worksheet header section. By default, the header is rendered to the cell grid on the Excel worksheet.
The page footer is always rendered to the actual Excel worksheet footer section, regardless of the value of the SimplePageHeaders setting.
Excel header and footer sections support a maximum of 256 characters, including markup. If this limit is exceeded, the Excel renderer removes markup characters starting at the end of the header and/or footer string to reduce the number of total characters. If all markup characters are removed and the length still exceeds the maximum, the string is truncated starting from the right.
SimplePageHeader Settings
By default, the Device Information SimplePageHeaders setting is set to False; therefore, the page headers are rendered as rows in the report on the Excel worksheet surface. The worksheet rows that contain the headers become locked rows. You can freeze or unfreeze the pane in Excel. If the Print Titles option is selected, these headers are automatically set to print on every worksheet page.
The page header repeats at the top of every worksheet in the workbook except the document map cover sheet if the Print Titles option is selected on the Page Layout tab in Excel. If the Print on first page or the Print on last page option is not selected in the Report Header Properties or Report Footer Properties dialog boxes, the header will not be added to the first or last page respectively.
Page footers are rendered in the Excel footer section.
Because of Excel limitations, text boxes are the only type of report item that can be rendered in the Excel header/footer section.
Interactivity
Some interactive elements are supported in Excel. The following is a description of specific behaviors.
Show and Hide
[!INCLUDEofprexcel] has limitations with how it manages hidden and displayed report items when they are exported. Groups, rows, and columns that contain report items that can be toggled are rendered as Excel outlines. Excel creates outlines that expand and collapse rows and columns across the entire row or column which can cause the collapse of report items that are not intended to be collapsed. In addition, Excel’s outlining symbols can become cluttered with overlapping outlines. To address these issues, the following outlining rules are applied when using the Excel rendering extension:
-
The report item in the top-left corner that can be toggled can continue to be toggled in Excel. Report items that can be toggled and share vertical or horizontal space with the report item that can be toggled in the top-left corner cannot be toggled in Excel.
-
To determine whether a data region will be collapsible by rows or columns, the position of the report item that controls the toggling and the position of the report item that is toggled are determined. If the item controlling the toggling appears before the item to be toggled, the item is collapsible by rows. Otherwise, the item is collapsible by columns. If the item controlling the toggling appears beside and above the area to be toggled equally, the item is rendered with row collapsible by rows.
-
To determine where the subtotals are placed in the rendered report, the rendering extension examines the first instance of a dynamic member. If a peer static member appears immediately above it, the dynamic member is assumed to be the subtotals. Outlines are set to indicate that this is summary data. If there are no static siblings of a dynamic member, the first instance of the instance is the subtotal.
-
Due to an Excel limitation, outlines can be nested up to 7 levels only.
Document Map
If any document map labels exist in the report, a document map is rendered. The document map is rendered as an Excel cover worksheet inserted at the first tab position in the workbook. The worksheet is named Document map.
The text displayed in the document map is determined by the report item’s or group’s DocumentMapLabel property. Document map labels are listed in the order that they appear in the report, starting at the first row, in the first column. Each document map label cell is indented the number of levels deep it appears in the report. Each level of indentation is represented by placing the label in a subsequent column. Excel supports up to 256 levels of outline nesting.
The document map outline is rendered as a collapsible Excel outline. The outline structure matches the nested structure of the document map. The expand and collapse state of the outline starts at the second level.
The root node of the map is the report name, the <reportname>.rdl, and it is not interactive. The document map links font is Arial, 10pt.
Drillthrough Links
Drillthrough links that appear in text boxes are rendered as Excel hyperlinks in the cell in which the text is rendered. Drillthrough links for images and charts are rendered as Excel hyperlinks on the image when rendered. When clicked, the drillthrough link opens the client’s default browser and navigates to the HTML view of the target.
Hyperlinks
Hyperlinks that appear in text boxes are rendered as Excel hyperlinks in the cell in which the text is rendered. Hyperlinks for images and charts are rendered as Excel hyperlinks on the image when rendered. When clicked, the hyperlink opens the client’s default browser and navigates to the target URL.
Interactive Sorting
Excel does not support interactive sort.
Bookmarks
Bookmark links in text boxes are rendered as Excel hyperlinks in the cell in which the text is rendered. Bookmark links for images and charts are rendered as Excel hyperlinks on the image when rendered. When clicked, the bookmark goes to the Excel cell in which the bookmarked report item is rendered.
Changing Reports at Run-Time
If a report must render to multiple formats and it is not possible to create a report layout that renders the way you want in all required formats, then you might consider using the value in the RenderFormat built-in global to conditionally change the report appearance at run time. This way you can hide or show report items depending on the renderer used to get the best results in each format. For more information, see Built-in Globals and Users References (Report Builder and SSRS).
Troubleshoot export to Excel
Export to Excel or Word fails when using Virtual Service Account and Execution Account
The workaround for this issue is to give Read permission to the Execution account for the described registry entry under the Virtual User Account branch, and restart the computer. For example, one possible registry entry is HKEY_USERSS-1-5-80-4050220999-2730734961-1537482082-519850261-379003301SoftwareMicrosoftAvalon.Graphics.
See Also
Pagination in Reporting Services (Report Builder and SSRS)
Rendering Behaviors (Report Builder and SSRS)
Interactive Functionality for Different Report Rendering Extensions (Report Builder and SSRS)
Rendering Report Items (Report Builder and SSRS)
Tables, Matrices, and Lists (Report Builder and SSRS)
Инструмент создания дизайна отчетов Aspose.Cells
Пользователи могут конструировать и выгружать отчеты в Microsoft Excel напрямую из Aspose.Cells.Report.Designer — это наш, доступный, простой в использовании инструмент для дизайна отчетов, который использует Microsoft Excel в качестве генератора отчетов. Таким образом, пользователи могут использовать для своей пользы всю мощь и функциональность Microsoft Excel, в том числе сводные таблицы, интерактивные графики, формулы и тд.
Эти аттрибуты не поддерживаются стандартным форматов Microsoft Excel, представленным в Reporting Services. Более того, Aspose.Cells.Report.Designer может создавать отчеты обоих форматов (RDL/RDLC), которые будут поддерживаться как в Microsoft SQL Server 2000, 2005 так и в Reporting Services версии 2008.
Гибкие опции отображения
Aspose.Cells for Reporting Services дает вам полный контроль над установками страницы и позволяет вам манипулировать широким кругом опций отображения, как то: предпросмотр разрыва страниц, установкой уровня приближения рабочего листа, контроль над отображением данных с использованием «заморозки» угла обзора, установкой ориентации страницы, масштабирования, размера страницы, верхнего и нижних колонтитулов и области печати.
Возможности защиты рабочих листов Excel
Aspose.Cells for Reporting Services предлагает большой выбор опций защиты, которые поддерживаются в шифровании и дешифровке файлов Microsoft Excel 2007 XLSX, защиту содержания рабочего листа, объектов и сценариев, а также скрытие и показ рабочего листа.
Манипулирование строками и столбцами
С Aspose.Cells for Reporting Services можно легко устанавливать высоту строк и ширину столбцов, если требуется. Вы также можете использовать функцию подгонки высоты и ширины ячейки в соответствии с контентом, вставлять или удалять, показывать или скрывать, группировать или разгруппировывать строки и столбцы.
Обработка данных
Aspose.Cells for Reporting Services поддерживает таблицы со сгруппированными строками и столбцами. Группирование строк и столбцов может быть установлено во время конструирования отчета, как и для остальные элементы. Aspose.Cells for Reporting Services также поддерживает параметры и глобальные переменные в качестве источников данных для отчета. Пользователи также могут использовать Microsoft Query для создания источников данных и запросов. Это широко используемый и хорошо известный пользователям инструмент.
В дополнение, Aspose.Cells for Reporting Services поддерживает оба типа спецификации источников данных и общедоступные источники данных, созданные на базе Report Server. Более того, пользователи могу использовать определенный в отчете источник данных во время конструирования и определять общедоступные источники данных в качестве источников данных для отчета в процессе публикации отчетов.
Расширенная поддержка форматирования рабочих листов Excel
Используя Aspose.Cells for Reporting Services — применяйте форматирование к рабочим листам, строкам, столбцам или ячейкам. Вы также можете добавлять содержимое в формате RTF в единичные ячейки и применять различные обрамления, задний фон и шрифты. К ячейкам также может применяться условное форматирование.
Создание графиков и преобразование в изображения
Aspose.Cells for Reporting Services поставляется с полноценной поддержкой работы с графикой и поддерживает все стандартные типы графиков. Вы с легкостью можете добавлять пользовательские графики с использованием API и динамически менять данные для графиков. Aspose.Cells for Reporting Services также предоставляет вам возможность конвертировать графики в изображения.
Преобразование рабочих листов в изображения и обратно
Aspose.Cells for Reporting Services предоставляет продвинутые возможности работы с графикой — позволяет вам легко преобразовывать рабочие листы в изображения, как и добавлять изображения на рабочие листы в режиме рабочего времени.
Автоматизация Microsoft Office больше не нужна!
Aspose.Cells for Reporting Services создан на базе управляемого кода, который не требует установливать Microsoft Office или Microsoft Excel на ваш компьютер, чтобы управлять документами Excel. Он является идеальной альтернативой автоматизации Microsoft Office в терминах поддерживаемых возможностей, безопасности, стабильности, масштабируемости, скорости и цены..