
Хотя многие Data Scientist’ы больше привыкли работать с CSV-файлами, на практике очень часто приходится сталкиваться с обычными Excel-таблицами. Поэтому сегодня мы расскажем, как читать Excel-файлы в Pandas, а также рассмотрим основные возможности Python-библиотеки OpenPyXL для чтения метаданных ячеек.
Дополнительные зависимости для возможности чтения Excel таблиц
Для чтения таблиц Excel в Pandas требуются дополнительные зависимости:
- xlrd поддерживает старые и новые форматы MS Excel [1];
- OpenPyXL поддерживает новые форматы MS Excel (.xlsx) [2];
- ODFpy поддерживает свободные форматы OpenDocument (.odf, .ods и .odt) [3];
- pyxlsb поддерживает бинарные MS Excel файлы (формат .xlsb) [4].
Мы рекомендуем установить только OpenPyXL, поскольку он нам пригодится в дальнейшем. Для этого в командной строке прописывается следующая операция:
pip install openpyxl
Затем в Pandas нужно указать путь к Excel-файлу и одну из установленных зависимостей. Python-код выглядит следующим образом:
import pandas as pd
pd.read_excel(io='temp1.xlsx', engine='openpyxl')
#
     Name  Age  Weight
0    Alex   35      87
1   Lesha   57      72
2  Nastya   21      64
Читаем несколько листов
Excel-файл может содержать несколько листов. В Pandas, чтобы прочитать конкретный лист, в аргументе нужно указать sheet_name. Можно указать список названий листов, тогда Pandas вернет словарь (dict) с объектами DataFrame:
dfs = pd.read_excel(io='temp1.xlsx',
                    engine='openpyxl',
                    sheet_name=['Sheet1', 'Sheet2'])
dfs
#
{'Sheet1':      Name  Age  Weight
 0    Alex   35      87
 1   Lesha   57      72
 2  Nastya   21      64,
 'Sheet2':     Name  Age  Weight
 0  Gosha   43      95
 1   Anna   24      65
 2   Lena   22      78}
Если таблицы в словаре имеют одинаковые атрибуты, то их можно объединить в один DataFrame. В Python это выглядит так:
pd.concat(dfs).reset_index(drop=True)
     Name  Age  Weight
0    Alex   35      87
1   Lesha   57      72
2  Nastya   21      64
3   Gosha   43      95
4    Anna   24      65
5    Lena   22      78
Указание диапазонов
Таблицы могут размещаться не в самом начале, а как, например, на рисунке ниже. Как видим, таблица располагается в диапазоне A:F.
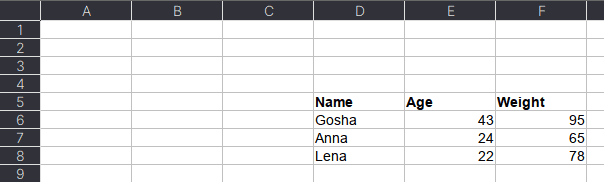
Чтобы прочитать такую таблицу, нужно указать диапазон в аргументе usecols. Также дополнительно можно добавить header — номер заголовка таблицы, а также nrows — количество строк, которые нужно прочитать. В аргументе header всегда передается номер строки на единицу меньше, чем в Excel-файле, поскольку в Python индексация начинается с 0 (на рисунке это номер 5, тогда указываем 4):
pd.read_excel(io='temp1.xlsx',
              engine='openpyxl',
              usecols='D:F',
              header=4, # в excel это №5
              nrows=3)
#
    Name  Age  Weight
0  Gosha   43      95
1   Anna   24      65
2   Lena   22      78
Читаем таблицы в OpenPyXL
Pandas прочитывает только содержимое таблицы, но игнорирует метаданные: цвет заливки ячеек, примечания, стили таблицы и т.д. В таком случае пригодится библиотека OpenPyXL. Загрузка файлов осуществляется через функцию load_workbook, а к листам обращаться можно через квадратные скобки:
from openpyxl import load_workbook
wb = load_workbook('temp2.xlsx')
ws = wb['Лист1']
type(ws)
# openpyxl.worksheet.worksheet.Worksheet
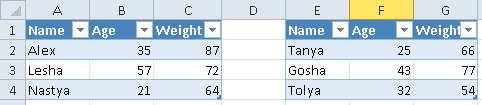
Допустим, имеется Excel-файл с несколькими таблицами на листе (см. рисунок выше). Если бы мы использовали Pandas, то он бы выдал следующий результат:
pd.read_excel(io='temp2.xlsx',
              engine='openpyxl')
#
     Name  Age  Weight  Unnamed: 3 Name.1  Age.1  Weight.1
0    Alex   35      87         NaN  Tanya     25        66
1   Lesha   57      72         NaN  Gosha     43        77
2  Nastya   21      64         NaN  Tolya     32        54
Можно, конечно, заняться обработкой и привести таблицы в нормальный вид, а можно воспользоваться OpenPyXL, который хранит таблицу и его диапазон в словаре. Чтобы посмотреть этот словарь, нужно вызвать ws.tables.items. Вот так выглядит Python-код:
ws.tables.items()
wb = load_workbook('temp2.xlsx')
ws = wb['Лист1']
ws.tables.items()
#
[('Таблица1', 'A1:C4'), ('Таблица13', 'E1:G4')]
Обращаясь к каждому диапазону, можно проходить по каждой строке или столбцу, а внутри них – по каждой ячейке. Например, следующий код на Python таблицы объединяет строки в список, где первая строка уходит на заголовок, а затем преобразует их в DataFrame:
dfs = []
for table_name, value in ws.tables.items():
    table = ws[value]
    header, *body = [[cell.value for cell in row]
                      for row in table]
    df = pd.DataFrame(body, columns=header)
    dfs.append(df)
Если таблицы имеют одинаковые атрибуты, то их можно соединить в одну:
pd.concat(dfs)
#
     Name  Age  Weight
0    Alex   35      87
1   Lesha   57      72
2  Nastya   21      64
0   Tanya   25      66
1   Gosha   43      77
2   Tolya   32      54
Сохраняем метаданные таблицы
Как указано в коде выше, у ячейки OpenPyXL есть атрибут value, который хранит ее значение. Помимо value, можно получить тип ячейки (data_type), цвет заливки (fill), примечание (comment) и др.
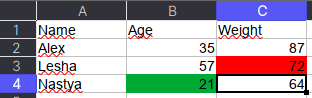
Например, требуется сохранить данные о цвете ячеек. Для этого мы каждую ячейку с числами перезапишем в виде <значение,RGB>, где RGB — значение цвета в формате RGB (red, green, blue). Python-код выглядит следующим образом:
# _TYPES = {int:'n', float:'n', str:'s', bool:'b'}
data = []
for row in ws.rows:
    row_cells = []
    for cell in row:
        cell_value = cell.value
        if cell.data_type == 'n':
            cell_value = f"{cell_value},{cell.fill.fgColor.rgb}"
        row_cells.append(cell_value)
    data.append(row_cells)
Первым элементом списка является строка-заголовок, а все остальное уже значения таблицы:
pd.DataFrame(data[1:], columns=data[0])
#
     Name          Age       Weight
0    Alex  35,00000000  87,00000000
1   Lesha  57,00000000  72,FFFF0000
2  Nastya  21,FF00A933  64,00000000
Теперь представим атрибуты в виде индексов с помощью метода stack, а после разобьём все записи на значение и цвет методом str.split:
(pd.DataFrame(data[1:], columns=data[0])
 .set_index('Name')
 .stack()
 .str.split(',', expand=True)
)
#
                0         1
Name
Alex   Age     35  00000000
       Weight  87  00000000
Lesha  Age     57  00000000
       Weight  72  FFFF0000
Nastya Age     21  FF00A933
       Weight  64  0000000
Осталось только переименовать 0 и 1 на Value и Color, а также добавить атрибут Variable, который обозначит Вес и Возраст. Полный код на Python выглядит следующим образом:
(pd.DataFrame(data[1:], columns=data[0])
 .set_index('Name')
 .stack()
 .str.split(',', expand=True)
 .set_axis(['Value', 'Color'], axis=1)
 .rename_axis(index=['Name', 'Variable'])
 .reset_index()
)
#
     Name Variable Value     Color
0    Alex      Age    35  00000000
1    Alex   Weight    87  00000000
2   Lesha      Age    57  00000000
3   Lesha   Weight    72  FFFF0000
4  Nastya      Age    21  FF00A933
5  Nastya   Weight    64  00000000
Ещё больше подробностей о работе с таблицами в Pandas, а также их обработке на реальных примерах Data Science задач, вы узнаете на наших курсах по Python в лицензированном учебном центре обучения и повышения квалификации IT-специалистов в Москве.
Источники
- https://xlrd.readthedocs.io/en/latest/
- https://openpyxl.readthedocs.io/en/latest/
- https://github.com/eea/odfpy
- https://github.com/willtrnr/pyxlsb
Узнайте, как читать и импортировать файлы Excel в Python, как записывать данные в эти таблицы и какие библиотеки лучше всего подходят для этого.
Известный вам инструмент для организации, анализа и хранения ваших данных в таблицах — Excel — применяется и в data science. В какой-то момент вам придется иметь дело с этими таблицами, но работать именно с ними вы будете не всегда. Вот почему разработчики Python реализовали способы чтения, записи и управления не только этими файлами, но и многими другими типами файлов.
Из этого учебника узнаете, как можете работать с Excel и Python. Внутри найдете обзор библиотек, которые вы можете использовать для загрузки и записи этих таблиц в файлы с помощью Python. Вы узнаете, как работать с такими библиотеками, как pandas, openpyxl, xlrd, xlutils и pyexcel.
Данные как ваша отправная точка
Когда вы начинаете проект по data science, вам придется работать с данными, которые вы собрали по всему интернету, и с наборами данных, которые вы загрузили из других мест — Kaggle, Quandl и тд
Но чаще всего вы также найдете данные в Google или в репозиториях, которые используются другими пользователями. Эти данные могут быть в файле Excel или сохранены в файл с расширением .csv … Возможности могут иногда казаться бесконечными, но когда у вас есть данные, в первую очередь вы должны убедиться, что они качественные.
В случае с электронной таблицей вы можете не только проверить, могут ли эти данные ответить на вопрос исследования, который вы имеете в виду, но также и можете ли вы доверять данным, которые хранятся в электронной таблице.
Проверяем качество таблицы
- Представляет ли электронная таблица статические данные?
- Смешивает ли она данные, расчеты и отчетность?
- Являются ли данные в вашей электронной таблице полными и последовательными?
- Имеет ли ваша таблица систематизированную структуру рабочего листа?
- Проверяли ли вы действительные формулы в электронной таблице?
Этот список вопросов поможет убедиться, что ваша таблица не грешит против лучших практик, принятых в отрасли. Конечно, этот список не исчерпывающий, но позволит провести базовую проверку таблицы.
Лучшие практики для данных электронных таблиц
Прежде чем приступить к чтению вашей электронной таблицы на Python, вы также должны подумать о том, чтобы настроить свой файл в соответствии с некоторыми основными принципами, такими как:
- Первая строка таблицы обычно зарезервирована для заголовка, а первый столбец используется для идентификации единицы выборки;
- Избегайте имен, значений или полей с пробелами. В противном случае каждое слово будет интерпретироваться как отдельная переменная, что приведет к ошибкам, связанным с количеством элементов на строку в вашем наборе данных. По возможности, используйте:
- подчеркивания,
- тире,
- горбатый регистр, где первая буква каждого слова пишется с большой буквы
- объединяющие слова
- Короткие имена предпочтительнее длинных имен;
- старайтесь не использовать имена, которые содержат символы ?, $,%, ^, &, *, (,), -, #,? ,,, <,>, /, |, , [,], {, и };
- Удалите все комментарии, которые вы сделали в вашем файле, чтобы избежать добавления в ваш файл лишних столбцов или NA;
- Убедитесь, что все пропущенные значения в вашем наборе данных обозначены как NA.
Затем, после того, как вы внесли необходимые изменения или тщательно изучили свои данные, убедитесь, что вы сохранили внесенные изменения. Сделав это, вы можете вернуться к данным позже, чтобы отредактировать их, добавить дополнительные данные или изменить их, сохранив формулы, которые вы, возможно, использовали для расчета данных и т.д.
Если вы работаете с Microsoft Excel, вы можете сохранить файл в разных форматах: помимо расширения по умолчанию .xls или .xlsx, вы можете перейти на вкладку «Файл», нажать «Сохранить как» и выбрать одно из расширений, которые указаны в качестве параметров «Сохранить как тип». Наиболее часто используемые расширения для сохранения наборов данных в data science — это .csv и .txt (в виде текстового файла с разделителями табуляции). В зависимости от выбранного варианта сохранения поля вашего набора данных разделяются вкладками или запятыми, которые образуют символы-разделители полей вашего набора данных.
Теперь, когда вы проверили и сохранили ваши данные, вы можете начать с подготовки вашего рабочего окружения.
Готовим рабочее окружение
Как убедиться, что вы все делаете хорошо? Проверить рабочее окружение!
Когда вы работаете в терминале, вы можете сначала перейти в каталог, в котором находится ваш файл, а затем запустить Python. Убедитесь, что файл лежит именно в том каталоге, к которому вы обратились.
Возможно, вы уже начали сеанс Python и у вас нет подсказок о каталоге, в котором вы работаете. Тогда можно выполнить следующие команды:
# Import `os`
import os

# Retrieve current working directory (`cwd`)
cwd = os.getcwd()
cwd

# Change directory
os.chdir("/path/to/your/folder")

# List all files and directories in current directory
os.listdir('.')
Круто, да?
Вы увидите, что эти команды очень важны не только для загрузки ваших данных, но и для дальнейшего анализа. А пока давайте продолжим: вы прошли все проверки, вы сохранили свои данные и подготовили рабочее окружение.
Можете ли вы начать с чтения данных в Python?
Установите библиотеки для чтения и записи файлов Excel
Даже если вы еще не знаете, какие библиотеки вам понадобятся для импорта ваших данных, вы должны убедиться, что у вас есть все, что нужно для установки этих библиотек, когда придет время.
Подготовка к дополнительной рабочей области: pip
Вот почему вам нужно установить pip и setuptools. Если у вас установлен Python2 ⩾ 2.7.9 или Python3 ⩾ 3.4, то можно не беспокоиться — просто убедитесь, что вы обновились до последней версии.
Для этого выполните следующую команду в своем терминале:
# Для Linux/OS X
pip install -U pip setuptools

# Для Windows
python -m pip install -U pip setuptools
Если вы еще не установили pip, запустите скрипт python get-pip.py, который вы можете найти здесь. Следуйте инструкциям по установке.
Установка Anaconda
Другой вариант для работы в data science — установить дистрибутив Anaconda Python. Сделав это, вы получите простой и быстрый способ начать заниматься data science, потому что вам не нужно беспокоиться об установке отдельных библиотек, необходимых для работы.
Это особенно удобно, если вы новичок, но даже для более опытных разработчиков это способ быстро протестировать некоторые вещи без необходимости устанавливать каждую библиотеку отдельно.
Anaconda включает в себя 100 самых популярных библиотек Python, R и Scala для науки о данных и несколько сред разработки с открытым исходным кодом, таких как Jupyter и Spyder.
Установить Anaconda можно здесь. Следуйте инструкциям по установке, и вы готовы начать!
Загрузить файлы Excel в виде фреймов Pandas
Все, среда настроена, вы готовы начать импорт ваших файлов.
Один из способов, который вы часто используете для импорта ваших файлов для обработки данных, — с помощью библиотеки Pandas. Она основана на NumPy и предоставляет простые в использовании структуры данных и инструменты анализа данных Python.
Эта мощная и гибкая библиотека очень часто используется дата-инженерами для передачи своих данных в структуры данных, очень выразительных для их анализа.
Если у вас уже есть Pandas, доступные через Anaconda, вы можете просто загрузить свои файлы в Pandas DataFrames с помощью pd.Excelfile():
# импорт библиотеки pandas
import pandas as pd

# Загружаем ваш файл в переменную `file` / вместо 'example' укажите название свого файла из текущей директории
file = 'example.xlsx'

# Загружаем spreadsheet в объект pandas
xl = pd.ExcelFile(file)

# Печатаем название листов в данном файле
print(xl.sheet_names)

# Загрузить лист в DataFrame по его имени: df1
df1 = xl.parse('Sheet1')
Если вы не установили Anaconda, просто выполните pip install pandas, чтобы установить библиотеку Pandas в вашей среде, а затем выполните команды, которые включены в фрагмент кода выше.
Проще простого, да?
Для чтения в файлах .csv у вас есть аналогичная функция для загрузки данных в DataFrame: read_csv(). Вот пример того, как вы можете использовать эту функцию:
# Импорт библиотеки pandas
import pandas as pd

# Загрузить csv файл
df = pd.read_csv("example.csv")
Разделитель, который будет учитывать эта функция, по умолчанию является запятой, но вы можете указать альтернативный разделитель, если хотите. Перейдите к документации, чтобы узнать, какие другие аргументы вы можете указать для успешного импорта!
Обратите внимание, что есть также функции read_table() и read_fwf() для чтения файлов и таблиц с фиксированной шириной в формате DataFrames с общим разделителем. Для первой функции разделителем по умолчанию является вкладка, но вы можете снова переопределить это, а также указать альтернативный символ-разделитель. Более того, есть и другие функции, которые вы можете использовать для получения данных в DataFrames: вы можете найти их здесь.
Как записать Pandas DataFrames в файлы Excel
Допустим, что после анализа данных вы хотите записать данные обратно в новый файл. Есть также способ записать ваши Pandas DataFrames обратно в файлы с помощью функции to_excel().
Но, прежде чем использовать эту функцию, убедитесь, что у вас установлен XlsxWriter, если вы хотите записать свои данные в несколько листов в файле .xlsx:
# Установим `XlsxWriter`
pip install XlsxWriter

# Указать writer библиотеки
writer = pd.ExcelWriter('example.xlsx', engine='xlsxwriter')

# Записать ваш DataFrame в файл
yourData.to_excel(writer, 'Sheet1')

# Сохраним результат
writer.save()
Обратите внимание, что в приведенном выше фрагменте кода вы используете объект ExcelWriter для вывода DataFrame.
Иными словами, вы передаете переменную Writer в функцию to_excel() и также указываете имя листа. Таким образом, вы добавляете лист с данными в существующую рабочую книгу: вы можете использовать ExcelWriter для сохранения нескольких (немного) разных DataFrames в одной рабочей книге.
Все это означает, что если вы просто хотите сохранить один DataFrame в файл, вы также можете обойтись без установки пакета XlsxWriter. Затем вы просто не указываете аргумент движка, который вы передаете в функцию pd.ExcelWriter(). Остальные шаги остаются прежними.
Аналогично функциям, которые вы использовали для чтения в файлах .csv, у вас также есть функция to_csv() для записи результатов обратно в файл, разделенный запятыми. Он снова работает так же, как когда вы использовали его для чтения в файле:
# Запишите DataFrame в csv
df.to_csv("example.csv")
Если вы хотите иметь файл, разделенный табуляцией, вы также можете передать t аргументу sep. Обратите внимание, что есть другие функции, которые вы можете использовать для вывода ваших файлов. Вы можете найти их все здесь.
Пакеты для разбора файлов Excel и обратной записи с помощью Python
Помимо библиотеки Pandas, который вы будете использовать очень часто для загрузки своих данных, вы также можете использовать другие библиотеки для получения ваших данных в Python. Наш обзор основан на этой странице со списком доступных библиотек, которые вы можете использовать для работы с файлами Excel в Python.
Далее вы увидите, как использовать эти библиотеки с помощью некоторых реальных, но упрощенных примеров.
Использование виртуальных сред
Общий совет для установки — делать это в Python virtualenv без системных пакетов. Вы можете использовать virtualenv для создания изолированных сред Python: он создает папку, содержащую все необходимые исполняемые файлы для использования пакетов, которые потребуются проекту Python.
Чтобы начать работать с virtualenv, вам сначала нужно установить его. Затем перейдите в каталог, в который вы хотите поместить свой проект. Создайте virtualenv в этой папке и загрузите в определенную версию Python, если вам это нужно. Затем вы активируете виртуальную среду. После этого вы можете начать загрузку в другие библиотеки, начать работать с ними и т. д.
Совет: не забудьте деактивировать среду, когда закончите!
# Install virtualenv
$ pip install virtualenv

# Go to the folder of your project
$ cd my_folder

# Create a virtual environment `venv`
$ virtualenv venv

# Indicate the Python interpreter to use for `venv`
$ virtualenv -p /usr/bin/python2.7 venv

# Activate `venv`
$ source venv/bin/activate

# Deactivate `venv`
$ deactivate
Обратите внимание, что виртуальная среда может показаться немного проблемной на первый взгляд, когда вы только начинаете работать с данными с Python. И, особенно если у вас есть только один проект, вы можете не понять, зачем вам вообще нужна виртуальная среда.
С ней будет гораздо легче, когда у вас одновременно запущено несколько проектов, и вы не хотите, чтобы они использовали одну и ту же установку Python. Или когда ваши проекты имеют противоречащие друг другу требования, виртуальная среда пригодится!
Теперь вы можете, наконец, начать установку и импорт библиотек, о которых вы читали, и загрузить их в таблицу.
Как читать и записывать файлы Excel с openpyxl
Этот пакет обычно рекомендуется, если вы хотите читать и записывать файлы .xlsx, xlsm, xltx и xltm.
Установите openpyxl с помощью pip: вы видели, как это сделать в предыдущем разделе.
Общий совет для установки этой библиотеки — делать это в виртуальной среде Python без системных библиотек. Вы можете использовать виртуальную среду для создания изолированных сред Python: она создает папку, которая содержит все необходимые исполняемые файлы для использования библиотек, которые потребуются проекту Python.
Перейдите в каталог, в котором находится ваш проект, и повторно активируйте виртуальную среду venv. Затем продолжите установку openpyxl с pip, чтобы убедиться, что вы можете читать и записывать файлы с ним:
# Активируйте virtualenv
$ source activate venv

# Установим `openpyxl` в `venv`
$ pip install openpyxl
Теперь, когда вы установили openpyxl, вы можете загружать данные. Но что это за данные?
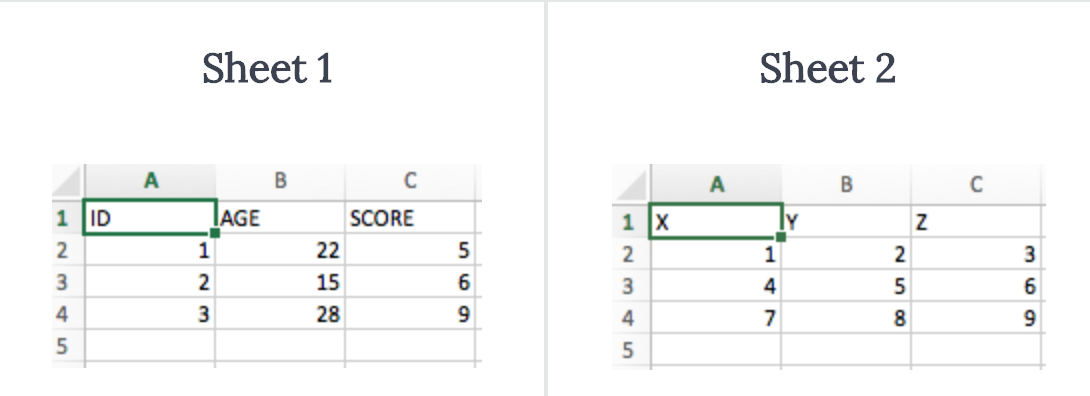
Доспутим Excel с данными, которые вы пытаетесь загрузить в Python, содержит следующие листы:
Функция load_workbook() принимает имя файла в качестве аргумента и возвращает объект рабочей книги, который представляет файл. Вы можете проверить это, запустив type (wb). Убедитесь, что вы находитесь в том каталоге, где находится ваша таблица, иначе вы получите error при импорте.
# Import `load_workbook` module from `openpyxl`
from openpyxl import load_workbook

# Load in the workbook
wb = load_workbook('./test.xlsx')

# Get sheet names
print(wb.get_sheet_names())
Помните, что вы можете изменить рабочий каталог с помощью os.chdir().
Вы видите, что фрагмент кода выше возвращает имена листов книги, загруженной в Python.Можете использовать эту информацию, чтобы также получить отдельные листы рабочей книги.
Вы также можете проверить, какой лист в настоящее время активен с wb.active. Как видно из кода ниже, вы можете использовать его для загрузки другого листа из вашей книги:
# Get a sheet by name
sheet = wb.get_sheet_by_name('Sheet3')

# Print the sheet title
sheet.title

# Get currently active sheet
anotherSheet = wb.active

# Check `anotherSheet`
anotherSheet
На первый взгляд, с этими объектами рабочего листа вы не сможете многое сделать.. Однако вы можете извлечь значения из определенных ячеек на листе вашей книги, используя квадратные скобки [], в которые вы передаете точную ячейку, из которой вы хотите получить значение.
Обратите внимание, что это похоже на выбор, получение и индексирование массивов NumPy и Pandas DataFrames, но это не все, что вам нужно сделать, чтобы получить значение. Вам нужно добавить атрибут value:
# Retrieve the value of a certain cell
sheet['A1'].value

# Select element 'B2' of your sheet
c = sheet['B2']

# Retrieve the row number of your element
c.row

# Retrieve the column letter of your element
c.column

# Retrieve the coordinates of the cell
c.coordinate
Как вы можете видеть, помимо значения, есть и другие атрибуты, которые вы можете использовать для проверки вашей ячейки, а именно: row, column и coordinate.
Атрибут row вернет 2;
Добавление атрибута column к c даст вам ‘B’
coordinate вернет ‘B2’.
Вы также можете получить значения ячеек с помощью функции cell(). Передайте row и column, добавьте к этим аргументам значения, соответствующие значениям ячейки, которую вы хотите получить, и, конечно же, не забудьте добавить атрибут value:
# Retrieve cell value
sheet.cell(row=1, column=2).value

# Print out values in column 2
for i in range(1, 4):
     print(i, sheet.cell(row=i, column=2).value)
Обратите внимание, что если вы не укажете атрибут value, вы получите <Cell Sheet3.B1>, который ничего не говорит о значении, которое содержится в этой конкретной ячейке.
Вы видите, что вы используете цикл for с помощью функции range(), чтобы помочь вам распечатать значения строк, имеющих значения в столбце 2. Если эти конкретные ячейки пусты, вы просто вернете None. Если вы хотите узнать больше о циклах for, пройдите наш курс Intermediate Python для Data Science.
Есть специальные функции, которые вы можете вызывать для получения некоторых других значений, например, get_column_letter() и column_index_from_string.
Две функции указывают примерно то, что вы можете получить, используя их, но лучше сделать их четче: хотя вы можете извлечь букву столбца с предшествующего, вы можете сделать обратное или получить адрес столбца, когда вы задаёте букву последнему. Вы можете увидеть, как это работает ниже:
# Импорт необходимых модулей из  `openpyxl.utils`
from openpyxl.utils import get_column_letter, column_index_from_string

# Вывод 'A'
get_column_letter(1)

# Return '1'
column_index_from_string('A')
Вы уже получили значения для строк, которые имеют значения в определенном столбце, но что вам нужно сделать, если вы хотите распечатать строки вашего файла, не сосредотачиваясь только на одном столбце? Использовать другой цикл, конечно!
Например, вы говорите, что хотите сфокусироваться на области между «А1» и «С3», где первая указывает на левый верхний угол, а вторая — на правый нижний угол области, на которой вы хотите сфокусироваться. ,
Эта область будет так называемым cellObj, который вы видите в первой строке кода ниже. Затем вы говорите, что для каждой ячейки, которая находится в этой области, вы печатаете координату и значение, которое содержится в этой ячейке. После конца каждой строки вы печатаете сообщение, которое указывает, что строка этой области cellObj напечатана.
# Напечатать строчку за строчкой
for cellObj in sheet['A1':'C3']:
      for cell in cellObj:
              print(cells.coordinate, cells.value)
      print('--- END ---')
Еще раз обратите внимание, что выбор области очень похож на выбор, получение и индексирование списка и элементов массива NumPy, где вы также используете [] и : для указания области, значения которой вы хотите получить. Кроме того, вышеприведенный цикл также хорошо использует атрибуты ячейки!
Чтобы сделать вышеприведенное объяснение и код наглядным, вы можете проверить результат, который вы получите после завершения цикла:
('A1', u'M')
('B1', u'N')
('C1', u'O')
--- END ---
('A2', 10L)
('B2', 11L)
('C2', 12L)
--- END ---
('A3', 14L)
('B3', 15L)
('C3', 16L)
--- END ---
Наконец, есть некоторые атрибуты, которые вы можете использовать для проверки результата вашего импорта, а именно max_row и max_column. Эти атрибуты, конечно, и так — общие способы проверки правильности загрузки данных, но они все равно полезны.
# Вывести максимальное количество строк
sheet.max_row

# Вывести максимальное количество колонок
sheet.max_column
Наверное, вы думаете, что такой способ работы с этими файлами сложноват, особенно если вы еще хотите манипулировать данными.
Должно быть что-то попроще, верно? Так и есть!
openpyxl поддерживает Pandas DataFrames! Вы можете использовать функцию DataFrame() из библиотеки Pandas, чтобы поместить значения листа в DataFrame:
# Import `pandas`
import pandas as pd

# конвертировать Лист в DataFrame
df = pd.DataFrame(sheet.values)
Если вы хотите указать заголовки и индексы, вам нужно добавить немного больше кода:
# Put the sheet values in `data`
data = sheet.values

# Indicate the columns in the sheet values
cols = next(data)[1:]

# Convert your data to a list
data = list(data)

# Read in the data at index 0 for the indices
idx = [r[0] for r in data]

# Slice the data at index 1
data = (islice(r, 1, None) for r in data)

# Make your DataFrame
df = pd.DataFrame(data, index=idx, columns=cols)
Затем вы можете начать манипулировать данными со всеми функциями, которые предлагает библиотека Pandas. Но помните, что вы находитесь в виртуальной среде, поэтому, если библиотека еще не представлена, вам нужно будет установить ее снова через pip.
Чтобы записать ваши Pandas DataFrames обратно в файл Excel, вы можете легко использовать функцию dataframe_to_rows() из модуля utils:
# Import `dataframe_to_rows`
from openpyxl.utils.dataframe import dataframe_to_rows

# Initialize a workbook
wb = Workbook()

# Get the worksheet in the active workbook
ws = wb.active

# Append the rows of the DataFrame to your worksheet
for r in dataframe_to_rows(df, index=True, header=True):
    ws.append(r)
Но это точно не все! Библиотека openpyxl предлагает вам высокую гибкость при записи ваших данных обратно в файлы Excel, изменении стилей ячеек или использовании режима write-only. Эту библиотеку обязательно нужно знать, когда вы часто работаете с электронными таблицами ,
Совет: читайте больше о том, как вы можете изменить стили ячеек, перейти в режим write-only или как библиотека работает с NumPy здесь.
Теперь давайте также рассмотрим некоторые другие библиотеки, которые вы можете использовать для получения данных вашей электронной таблицы в Python.
Прежде чем закрыть этот раздел, не забудьте отключить виртуальную среду, когда закончите!
Чтение и форматирование Excel-файлов: xlrd
Эта библиотека идеально подходит для чтения и форматирования данных из Excel с расширением xls или xlsx.
# Import `xlrd`
import xlrd

# Open a workbook
workbook = xlrd.open_workbook('example.xls')

# Loads only current sheets to memory
workbook = xlrd.open_workbook('example.xls', on_demand = True)
Когда вам не нужны данные из всей Excel-книги, вы можете использовать функции sheet_by_name() или sheet_by_index() для получения листов, которые вы хотите получить в своём анализе
# Load a specific sheet by name
worksheet = workbook.sheet_by_name('Sheet1')

# Load a specific sheet by index
worksheet = workbook.sheet_by_index(0)

# Retrieve the value from cell at indices (0,0)
sheet.cell(0, 0).value
Также можно получить значение в определённых ячейках с вашего листа.
Перейдите к xlwt и xlutils, чтобы узнать больше о том, как они относятся к библиотеке xlrd.
Запись данных в Excel-файлы с xlwt
Если вы хотите создать таблицу со своими данными, вы можете использовать не только библиотеку XlsWriter, но и xlwt. xlwt идеально подходит для записи данных и форматирования информации в файлах с расширением .xls
Когда вы вручную создаёте файл:
# Import `xlwt`
import xlwt

# Initialize a workbook
book = xlwt.Workbook(encoding="utf-8")

# Add a sheet to the workbook
sheet1 = book.add_sheet("Python Sheet 1")

# Write to the sheet of the workbook
sheet1.write(0, 0, "This is the First Cell of the First Sheet")

# Save the workbook
book.save("spreadsheet.xls")
Если вы хотите записать данные в файл, но не хотите делать все самостоятельно, вы всегда можете прибегнуть к циклу for, чтобы автоматизировать весь процесс. Составьте сценарий, в котором вы создаёте книгу и в которую добавляете лист. Укажите список со столбцами и один со значениями, которые будут заполнены на листе.
Далее у вас есть цикл for, который гарантирует, что все значения попадают в файл: вы говорите, что для каждого элемента в диапазоне от 0 до 4 (5 не включительно) вы собираетесь что-то делать. Вы будете заполнять значения построчно. Для этого вы указываете элемент строки, который появляется в каждом цикле. Далее у вас есть еще один цикл for, который будет проходить по столбцам вашего листа. Вы говорите, что для каждой строки на листе, вы будете смотреть на столбцы, которые идут с ним, и вы будете заполнять значение для каждого столбца в строке. Заполнив все столбцы строки значениями, вы перейдете к следующей строке, пока не останется строк.
# Initialize a workbook
book = xlwt.Workbook()
# Add a sheet to the workbook
sheet1 = book.add_sheet("Sheet1")
# The data
cols = ["A", "B", "C", "D", "E"]
txt = [0,1,2,3,4]
# Loop over the rows and columns and fill in the values
for num in range(5):
row = sheet1.row(num)
for index, col in enumerate(cols):
value = txt[index] + num
row.write(index, value)
# Save the result
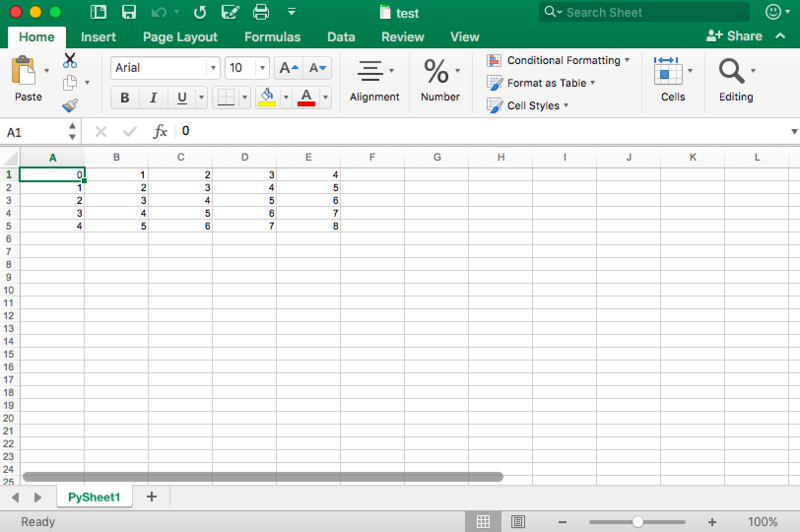
book.save("test.xls")На скриншоте ниже представлен результат выполнения этого кода:
Теперь, когда вы увидели, как xlrd и xlwt работают друг с другом, пришло время взглянуть на библиотеку, которая тесно связана с этими двумя: xlutils.
Сборник утилит: xlutils
Эта библиотека — сборник утилит, для которого требуются и xlrd и xlwt, и которая может копировать, изменять и фильтровать существующие данные. О том, как пользоваться этими командами рассказано в разделе по openpyxl.
Вернитесь в раздел openpyxl, чтобы получить больше информации о том, как использовать этот пакет для получения данных в Python.
Использование pyexcel для чтения .xls или .xlsx файлов
Еще одна библиотека, которую можно использовать для чтения данных электронных таблиц в Python — это pyexcel; Python Wrapper, который предоставляет один API для чтения, записи и работы с данными в файлах .csv, .ods, .xls, .xlsx и .xlsm. Конечно, для этого урока вы просто сосредоточитесь на файлах .xls и .xls.
Чтобы получить ваши данные в массиве, вы можете использовать функцию get_array(), которая содержится в пакете pyexcel:
# Import `pyexcel`
import pyexcel

# Get an array from the data
my_array = pyexcel.get_array(file_name="test.xls")
Вы также можете получить свои данные в упорядоченном словаре списков. Вы можете использовать функцию get_dict():
# Import `OrderedDict` module
from pyexcel._compact import OrderedDict

# Get your data in an ordered dictionary of lists
my_dict = pyexcel.get_dict(file_name="test.xls", name_columns_by_row=0)

# Get your data in a dictionary of 2D arrays
book_dict = pyexcel.get_book_dict(file_name="test.xls")
Здесь видно, что если вы хотите получить словарь двумерных массивов или получить все листы рабочей книги в одном словаре, вы можете прибегнуть к get_book_dict().
Помните, что эти две структуры данных, которые были упомянуты выше, массивы и словари вашей таблицы, позволяют вам создавать DataFrames ваших данных с помощью pd.DataFrame(). Это облегчит обработку данных.
Кроме того, вы можете просто получить записи из таблицы с помощью pyexcel благодаря функции get_records(). Просто передайте аргумент file_name в функцию, и вы получите список словарей:
# Retrieve the records of the file
records = pyexcel.get_records(file_name="test.xls")
Чтобы узнать, как управлять списками Python, ознакомьтесь с примерами из документации о списках Python.
Запись в файл с pyexcel
С помощью этой библиотеки можно не только загружать данные в массивы, вы также можете экспортировать свои массивы обратно в таблицу. Используйте функцию save_as() и передайте массив и имя файла назначения в аргумент dest_file_name:
# Get the data
data = [[1, 2, 3], [4, 5, 6], [7, 8, 9]]

# Save the array to a file
pyexcel.save_as(array=data, dest_file_name="array_data.xls")
Обратите внимание, что если вы хотите указать разделитель, вы можете добавить аргумент dest_delimiter и передать символ, который вы хотите использовать в качестве разделителя между «».
Однако если у вас есть словарь, вам нужно использовать функцию save_book_as(). Передайте двумерный словарь в bookdict и укажите имя файла:
# The data
2d_array_dictionary = {'Sheet 1': [
                                   ['ID', 'AGE', 'SCORE']
                                   [1, 22, 5],
                                   [2, 15, 6],
                                   [3, 28, 9]
                                  ],
                       'Sheet 2': [
                                    ['X', 'Y', 'Z'],
                                    [1, 2, 3],
                                    [4, 5, 6]
                                    [7, 8, 9]
                                  ],
                       'Sheet 3': [
                                    ['M', 'N', 'O', 'P'],
                                    [10, 11, 12, 13],
                                    [14, 15, 16, 17]
                                    [18, 19, 20, 21]
                                   ]}

# Save the data to a file
pyexcel.save_book_as(bookdict=2d_array_dictionary, dest_file_name="2d_array_data.xls")
При использовании кода, напечатанного в приведенном выше примере, важно помнить, что порядок ваших данных в словаре не будет сохранен. Если вы не хотите этого, вам нужно сделать небольшой обход. Вы можете прочитать все об этом здесь.
Чтение и запись .csv файлов
Если вы все еще ищете библиотеки, которые позволяют загружать и записывать данные в файлы .csv, кроме Pandas, лучше всего использовать пакет csv:
# import `csv`
import csv

# Read in csv file
for row in csv.reader(open('data.csv'), delimiter=','):
      print(row)

# Write csv file
data = [[1, 2, 3], [4, 5, 6], [7, 8, 9]]
outfile = open('data.csv', 'w')
writer = csv.writer(outfile, delimiter=';', quotechar='"')
writer.writerows(data)
outfile.close()
Обратите внимание, что в пакете NumPy есть функция genfromtxt(), которая позволяет загружать данные, содержащиеся в файлах .csv, в массивы, которые затем можно поместить в DataFrames.
Финальная проверка данных
Когда у вас есть данные, не забудьте последний шаг: проверить, правильно ли загружены данные. Если вы поместили свои данные в DataFrame, вы можете легко и быстро проверить, был ли импорт успешным, выполнив следующие команды:
# Check the first entries of the DataFrame
df1.head()

# Check the last entries of the DataFrame
df1.tail()
Если у вас есть данные в массиве, вы можете проверить их, используя следующие атрибуты массива: shape, ndim, dtype и т.д .:
# Inspect the shape
data.shape

# Inspect the number of dimensions
data.ndim

# Inspect the data type
data.dtype
Что дальше?
Поздравляем! Вы успешно прошли наш урок и научились читать файлы Excel на Python.
Если вы хотите продолжить работу над этой темой, попробуйте воспользоваться PyXll, который позволяет писать функции в Python и вызывать их в Excel.
Microsoft Excel is one of the most powerful spreadsheet software applications in the world, and it has become critical in all business processes. Companies across the world, both big and small, are using Microsoft Excel to store, organize, analyze, and visualize data.
As a data professional, when you combine Python with Excel, you create a unique data analysis bundle that unlocks the value of the enterprise data.
In this tutorial, we’re going to learn how to read and work with Excel files in Python.
After you finish this tutorial, you’ll understand the following:
- Loading Excel spreadsheets into pandas DataFrames
- Working with an Excel workbook with multiple spreadsheets
- Combining multiple spreadsheets
- Reading Excel files using the
xlrdpackage
In this tutorial, we assume you know the fundamentals of pandas DataFrames. If you aren’t familiar with the pandas library, you might like to try our Pandas and NumPy Fundamentals – Dataquest.
Let’s dive in.
Reading Spreadsheets with Pandas
Technically, multiple packages allow us to work with Excel files in Python. However, in this tutorial, we’ll use pandas and xlrd libraries to interact with Excel workbooks. Essentially, you can think of a pandas DataFrame as a spreadsheet with rows and columns stored in Series objects. Traversability of Series as iterable objects allows us to grab specific data easily. Once we load an Excel workbook into a pandas DataFrame, we can perform any kind of data analysis on the data.
Before we proceed to the next step, let’s first download the following spreadsheet:
Sales Data Excel Workbook — xlsx ver.
The Excel workbook consists of two sheets that contain stationery sales data for 2020 and 2021.
NOTE
Although Excel spreadsheets can contain formula and also support formatting, pandas only imports Excel spreadsheets as flat files, and it doesn’t support spreadsheet formatting.
To import the Excel spreadsheet into a pandas DataFrame, first, we need to import the pandas package and then use the read_excel() method:
import pandas as pd
df = pd.read_excel('sales_data.xlsx')

display(df)| OrderDate | Region | Rep | Item | Units | Unit Cost | Total | Shipped | |
|---|---|---|---|---|---|---|---|---|
| 0 | 2020-01-06 | East | Jones | Pencil | 95 | 1.99 | 189.05 | True |
| 1 | 2020-02-09 | Central | Jardine | Pencil | 36 | 4.99 | 179.64 | True |
| 2 | 2020-03-15 | West | Sorvino | Pencil | 56 | 2.99 | 167.44 | True |
| 3 | 2020-04-01 | East | Jones | Binder | 60 | 4.99 | 299.40 | False |
| 4 | 2020-05-05 | Central | Jardine | Pencil | 90 | 4.99 | 449.10 | True |
| 5 | 2020-06-08 | East | Jones | Binder | 60 | 8.99 | 539.40 | True |
| 6 | 2020-07-12 | East | Howard | Binder | 29 | 1.99 | 57.71 | False |
| 7 | 2020-08-15 | East | Jones | Pencil | 35 | 4.99 | 174.65 | True |
| 8 | 2020-09-01 | Central | Smith | Desk | 32 | 125.00 | 250.00 | True |
| 9 | 2020-10-05 | Central | Morgan | Binder | 28 | 8.99 | 251.72 | True |
| 10 | 2020-11-08 | East | Mike | Pen | 15 | 19.99 | 299.85 | False |
| 11 | 2020-12-12 | Central | Smith | Pencil | 67 | 1.29 | 86.43 | False |
If you want to load only a limited number of rows into the DataFrame, you can specify the number of rows using the nrows argument:
df = pd.read_excel('sales_data.xlsx', nrows=5)
display(df)| OrderDate | Region | Rep | Item | Units | Unit Cost | Total | Shipped | |
|---|---|---|---|---|---|---|---|---|
| 0 | 2020-01-06 | East | Jones | Pencil | 95 | 1.99 | 189.05 | True |
| 1 | 2020-02-09 | Central | Jardine | Pencil | 36 | 4.99 | 179.64 | True |
| 2 | 2020-03-15 | West | Sorvino | Pencil | 56 | 2.99 | 167.44 | True |
| 3 | 2020-04-01 | East | Jones | Binder | 60 | 4.99 | 299.40 | False |
| 4 | 2020-05-05 | Central | Jardine | Pencil | 90 | 4.99 | 449.10 | True |
Skipping a specific number of rows from the begining of a spreadsheet or skipping over a list of particular rows is available through the skiprows argument, as follows:
df = pd.read_excel('sales_data.xlsx', skiprows=range(5))
display(df)| 2020-05-05 00:00:00 | Central | Jardine | Pencil | 90 | 4.99 | 449.1 | True | |
|---|---|---|---|---|---|---|---|---|
| 0 | 2020-06-08 | East | Jones | Binder | 60 | 8.99 | 539.40 | True |
| 1 | 2020-07-12 | East | Howard | Binder | 29 | 1.99 | 57.71 | False |
| 2 | 2020-08-15 | East | Jones | Pencil | 35 | 4.99 | 174.65 | True |
| 3 | 2020-09-01 | Central | Smith | Desk | 32 | 125.00 | 250.00 | True |
| 4 | 2020-10-05 | Central | Morgan | Binder | 28 | 8.99 | 251.72 | True |
| 5 | 2020-11-08 | East | Mike | Pen | 15 | 19.99 | 299.85 | False |
| 6 | 2020-12-12 | Central | Smith | Pencil | 67 | 1.29 | 86.43 | False |
The code above skips the first five rows and returns the rest of the data. Instead, the following code returns all the rows except for those with the mentioned indices:
df = pd.read_excel('sales_data.xlsx', skiprows=[1, 4,7,10])
display(df)| OrderDate | Region | Rep | Item | Units | Unit Cost | Total | Shipped | |
|---|---|---|---|---|---|---|---|---|
| 0 | 2020-02-09 | Central | Jardine | Pencil | 36 | 4.99 | 179.64 | True |
| 1 | 2020-03-15 | West | Sorvino | Pencil | 56 | 2.99 | 167.44 | True |
| 2 | 2020-05-05 | Central | Jardine | Pencil | 90 | 4.99 | 449.10 | True |
| 3 | 2020-06-08 | East | Jones | Binder | 60 | 8.99 | 539.40 | True |
| 4 | 2020-08-15 | East | Jones | Pencil | 35 | 4.99 | 174.65 | True |
| 5 | 2020-09-01 | Central | Smith | Desk | 32 | 125.00 | 250.00 | True |
| 6 | 2020-11-08 | East | Mike | Pen | 15 | 19.99 | 299.85 | False |
| 7 | 2020-12-12 | Central | Smith | Pencil | 67 | 1.29 | 86.43 | False |
Another useful argument is usecols, which allows us to select spreadsheet columns with their letters, names, or positional numbers. Let’s see how it works:
df = pd.read_excel('sales_data.xlsx', usecols='A:C,G')
display(df)| OrderDate | Region | Rep | Total | |
|---|---|---|---|---|
| 0 | 2020-01-06 | East | Jones | 189.05 |
| 1 | 2020-02-09 | Central | Jardine | 179.64 |
| 2 | 2020-03-15 | West | Sorvino | 167.44 |
| 3 | 2020-04-01 | East | Jones | 299.40 |
| 4 | 2020-05-05 | Central | Jardine | 449.10 |
| 5 | 2020-06-08 | East | Jones | 539.40 |
| 6 | 2020-07-12 | East | Howard | 57.71 |
| 7 | 2020-08-15 | East | Jones | 174.65 |
| 8 | 2020-09-01 | Central | Smith | 250.00 |
| 9 | 2020-10-05 | Central | Morgan | 251.72 |
| 10 | 2020-11-08 | East | Mike | 299.85 |
| 11 | 2020-12-12 | Central | Smith | 86.43 |
In the code above, the string assigned to the usecols argument contains a range of columns with : plus column G separated by a comma. Also, we’re able to provide a list of column names and assign it to the usecols argument, as follows:
df = pd.read_excel('sales_data.xlsx', usecols=['OrderDate', 'Region', 'Rep', 'Total'])
display(df)| OrderDate | Region | Rep | Total | |
|---|---|---|---|---|
| 0 | 2020-01-06 | East | Jones | 189.05 |
| 1 | 2020-02-09 | Central | Jardine | 179.64 |
| 2 | 2020-03-15 | West | Sorvino | 167.44 |
| 3 | 2020-04-01 | East | Jones | 299.40 |
| 4 | 2020-05-05 | Central | Jardine | 449.10 |
| 5 | 2020-06-08 | East | Jones | 539.40 |
| 6 | 2020-07-12 | East | Howard | 57.71 |
| 7 | 2020-08-15 | East | Jones | 174.65 |
| 8 | 2020-09-01 | Central | Smith | 250.00 |
| 9 | 2020-10-05 | Central | Morgan | 251.72 |
| 10 | 2020-11-08 | East | Mike | 299.85 |
| 11 | 2020-12-12 | Central | Smith | 86.43 |
The usecols argument accepts a list of column numbers, too. The following code shows how we can pick up specific columns using their indices:
df = pd.read_excel('sales_data.xlsx', usecols=[0, 1, 2, 6])
display(df)| OrderDate | Region | Rep | Total | |
|---|---|---|---|---|
| 0 | 2020-01-06 | East | Jones | 189.05 |
| 1 | 2020-02-09 | Central | Jardine | 179.64 |
| 2 | 2020-03-15 | West | Sorvino | 167.44 |
| 3 | 2020-04-01 | East | Jones | 299.40 |
| 4 | 2020-05-05 | Central | Jardine | 449.10 |
| 5 | 2020-06-08 | East | Jones | 539.40 |
| 6 | 2020-07-12 | East | Howard | 57.71 |
| 7 | 2020-08-15 | East | Jones | 174.65 |
| 8 | 2020-09-01 | Central | Smith | 250.00 |
| 9 | 2020-10-05 | Central | Morgan | 251.72 |
| 10 | 2020-11-08 | East | Mike | 299.85 |
| 11 | 2020-12-12 | Central | Smith | 86.43 |
Working with Multiple Spreadsheets
Excel files or workbooks usually contain more than one spreadsheet. The pandas library allows us to load data from a specific sheet or combine multiple spreadsheets into a single DataFrame. In this section, we’ll explore how to use these valuable capabilities.
By default, the read_excel() method reads the first Excel sheet with the index 0. However, we can choose the other sheets by assigning a particular sheet name, sheet index, or even a list of sheet names or indices to the sheet_name argument. Let’s try it:
df = pd.read_excel('sales_data.xlsx', sheet_name='2021')
display(df)| OrderDate | Region | Rep | Item | Units | Unit Cost | Total | Shipped | |
|---|---|---|---|---|---|---|---|---|
| 0 | 2021-01-15 | Central | Gill | Binder | 46 | 8.99 | 413.54 | True |
| 1 | 2021-02-01 | Central | Smith | Binder | 87 | 15.00 | 1305.00 | True |
| 2 | 2021-03-07 | West | Sorvino | Binder | 27 | 19.99 | 139.93 | True |
| 3 | 2021-04-10 | Central | Andrews | Pencil | 66 | 1.99 | 131.34 | False |
| 4 | 2021-05-14 | Central | Gill | Pencil | 53 | 1.29 | 68.37 | False |
| 5 | 2021-06-17 | Central | Tom | Desk | 15 | 125.00 | 625.00 | True |
| 6 | 2021-07-04 | East | Jones | Pen Set | 62 | 4.99 | 309.38 | True |
| 7 | 2021-08-07 | Central | Tom | Pen Set | 42 | 23.95 | 1005.90 | True |
| 8 | 2021-09-10 | Central | Gill | Pencil | 47 | 1.29 | 9.03 | True |
| 9 | 2021-10-14 | West | Thompson | Binder | 57 | 19.99 | 1139.43 | False |
| 10 | 2021-11-17 | Central | Jardine | Binder | 11 | 4.99 | 54.89 | False |
| 11 | 2021-12-04 | Central | Jardine | Binder | 94 | 19.99 | 1879.06 | False |
The code above reads the second spreadsheet in the workbook, whose name is 2021. As mentioned before, we also can assign a sheet position number (zero-indexed) to the sheet_name argument. Let’s see how it works:
df = pd.read_excel('sales_data.xlsx', sheet_name=1)
display(df)| OrderDate | Region | Rep | Item | Units | Unit Cost | Total | Shipped | |
|---|---|---|---|---|---|---|---|---|
| 0 | 2021-01-15 | Central | Gill | Binder | 46 | 8.99 | 413.54 | True |
| 1 | 2021-02-01 | Central | Smith | Binder | 87 | 15.00 | 1305.00 | True |
| 2 | 2021-03-07 | West | Sorvino | Binder | 27 | 19.99 | 139.93 | True |
| 3 | 2021-04-10 | Central | Andrews | Pencil | 66 | 1.99 | 131.34 | False |
| 4 | 2021-05-14 | Central | Gill | Pencil | 53 | 1.29 | 68.37 | False |
| 5 | 2021-06-17 | Central | Tom | Desk | 15 | 125.00 | 625.00 | True |
| 6 | 2021-07-04 | East | Jones | Pen Set | 62 | 4.99 | 309.38 | True |
| 7 | 2021-08-07 | Central | Tom | Pen Set | 42 | 23.95 | 1005.90 | True |
| 8 | 2021-09-10 | Central | Gill | Pencil | 47 | 1.29 | 9.03 | True |
| 9 | 2021-10-14 | West | Thompson | Binder | 57 | 19.99 | 1139.43 | False |
| 10 | 2021-11-17 | Central | Jardine | Binder | 11 | 4.99 | 54.89 | False |
| 11 | 2021-12-04 | Central | Jardine | Binder | 94 | 19.99 | 1879.06 | False |
As you can see, both statements take in either the actual sheet name or sheet index to return the same result.
Sometimes, we want to import all the spreadsheets stored in an Excel file into pandas DataFrames simultaneously. The good news is that the read_excel() method provides this feature for us. In order to do this, we can assign a list of sheet names or their indices to the sheet_name argument. But there is a much easier way to do the same: to assign None to the sheet_name argument. Let’s try it:
all_sheets = pd.read_excel('sales_data.xlsx', sheet_name=None)Before exploring the data stored in the all_sheets variable, let’s check its data type:
type(all_sheets)dictAs you can see, the variable is a dictionary. Now, let’s reveal what is stored in this dictionary:
for key, value in all_sheets.items():
    print(key, type(value))
2020 <class 'pandas.core.frame.DataFrame'>
2021 <class 'pandas.core.frame.DataFrame'>The code above shows that the dictionary’s keys are the Excel workbook sheet names, and its values are pandas DataFrames for each spreadsheet. To print out the content of the dictionary, we can use the following code:
for key, value in all_sheets.items():
    print(key)
display(value)2020| OrderDate | Region | Rep | Item | Units | Unit Cost | Total | Shipped | |
|---|---|---|---|---|---|---|---|---|
| 0 | 2020-01-06 | East | Jones | Pencil | 95 | 1.99 | 189.05 | True |
| 1 | 2020-02-09 | Central | Jardine | Pencil | 36 | 4.99 | 179.64 | True |
| 2 | 2020-03-15 | West | Sorvino | Pencil | 56 | 2.99 | 167.44 | True |
| 3 | 2020-04-01 | East | Jones | Binder | 60 | 4.99 | 299.40 | False |
| 4 | 2020-05-05 | Central | Jardine | Pencil | 90 | 4.99 | 449.10 | True |
| 5 | 2020-06-08 | East | Jones | Binder | 60 | 8.99 | 539.40 | True |
| 6 | 2020-07-12 | East | Howard | Binder | 29 | 1.99 | 57.71 | False |
| 7 | 2020-08-15 | East | Jones | Pencil | 35 | 4.99 | 174.65 | True |
| 8 | 2020-09-01 | Central | Smith | Desk | 32 | 125.00 | 250.00 | True |
| 9 | 2020-10-05 | Central | Morgan | Binder | 28 | 8.99 | 251.72 | True |
| 10 | 2020-11-08 | East | Mike | Pen | 15 | 19.99 | 299.85 | False |
| 11 | 2020-12-12 | Central | Smith | Pencil | 67 | 1.29 | 86.43 | False |
2021| OrderDate | Region | Rep | Item | Units | Unit Cost | Total | Shipped | |
|---|---|---|---|---|---|---|---|---|
| 0 | 2021-01-15 | Central | Gill | Binder | 46 | 8.99 | 413.54 | True |
| 1 | 2021-02-01 | Central | Smith | Binder | 87 | 15.00 | 1305.00 | True |
| 2 | 2021-03-07 | West | Sorvino | Binder | 27 | 19.99 | 139.93 | True |
| 3 | 2021-04-10 | Central | Andrews | Pencil | 66 | 1.99 | 131.34 | False |
| 4 | 2021-05-14 | Central | Gill | Pencil | 53 | 1.29 | 68.37 | False |
| 5 | 2021-06-17 | Central | Tom | Desk | 15 | 125.00 | 625.00 | True |
| 6 | 2021-07-04 | East | Jones | Pen Set | 62 | 4.99 | 309.38 | True |
| 7 | 2021-08-07 | Central | Tom | Pen Set | 42 | 23.95 | 1005.90 | True |
| 8 | 2021-09-10 | Central | Gill | Pencil | 47 | 1.29 | 9.03 | True |
| 9 | 2021-10-14 | West | Thompson | Binder | 57 | 19.99 | 1139.43 | False |
| 10 | 2021-11-17 | Central | Jardine | Binder | 11 | 4.99 | 54.89 | False |
| 11 | 2021-12-04 | Central | Jardine | Binder | 94 | 19.99 | 1879.06 | False |
Combining Multiple Excel Spreadsheets into a Single Pandas DataFrame
Having one DataFrame per sheet allows us to have different columns or content in different sheets.
But what if we prefer to store all the spreadsheets’ data in a single DataFrame? In this tutorial, the workbook spreadsheets have the same columns, so we can combine them with the concat() method of pandas.
If you run the code below, you’ll see that the two DataFrames stored in the dictionary are concatenated:
combined_df = pd.concat(all_sheets.values(), ignore_index=True)
display(combined_df)| OrderDate | Region | Rep | Item | Units | Unit Cost | Total | Shipped | |
|---|---|---|---|---|---|---|---|---|
| 0 | 2020-01-06 | East | Jones | Pencil | 95 | 1.99 | 189.05 | True |
| 1 | 2020-02-09 | Central | Jardine | Pencil | 36 | 4.99 | 179.64 | True |
| 2 | 2020-03-15 | West | Sorvino | Pencil | 56 | 2.99 | 167.44 | True |
| 3 | 2020-04-01 | East | Jones | Binder | 60 | 4.99 | 299.40 | False |
| 4 | 2020-05-05 | Central | Jardine | Pencil | 90 | 4.99 | 449.10 | True |
| 5 | 2020-06-08 | East | Jones | Binder | 60 | 8.99 | 539.40 | True |
| 6 | 2020-07-12 | East | Howard | Binder | 29 | 1.99 | 57.71 | False |
| 7 | 2020-08-15 | East | Jones | Pencil | 35 | 4.99 | 174.65 | True |
| 8 | 2020-09-01 | Central | Smith | Desk | 32 | 125.00 | 250.00 | True |
| 9 | 2020-10-05 | Central | Morgan | Binder | 28 | 8.99 | 251.72 | True |
| 10 | 2020-11-08 | East | Mike | Pen | 15 | 19.99 | 299.85 | False |
| 11 | 2020-12-12 | Central | Smith | Pencil | 67 | 1.29 | 86.43 | False |
| 12 | 2021-01-15 | Central | Gill | Binder | 46 | 8.99 | 413.54 | True |
| 13 | 2021-02-01 | Central | Smith | Binder | 87 | 15.00 | 1305.00 | True |
| 14 | 2021-03-07 | West | Sorvino | Binder | 27 | 19.99 | 139.93 | True |
| 15 | 2021-04-10 | Central | Andrews | Pencil | 66 | 1.99 | 131.34 | False |
| 16 | 2021-05-14 | Central | Gill | Pencil | 53 | 1.29 | 68.37 | False |
| 17 | 2021-06-17 | Central | Tom | Desk | 15 | 125.00 | 625.00 | True |
| 18 | 2021-07-04 | East | Jones | Pen Set | 62 | 4.99 | 309.38 | True |
| 19 | 2021-08-07 | Central | Tom | Pen Set | 42 | 23.95 | 1005.90 | True |
| 20 | 2021-09-10 | Central | Gill | Pencil | 47 | 1.29 | 9.03 | True |
| 21 | 2021-10-14 | West | Thompson | Binder | 57 | 19.99 | 1139.43 | False |
| 22 | 2021-11-17 | Central | Jardine | Binder | 11 | 4.99 | 54.89 | False |
| 23 | 2021-12-04 | Central | Jardine | Binder | 94 | 19.99 | 1879.06 | False |
Now the data stored in the combined_df DataFrame is ready for further processing or visualization. In the following piece of code, we’re going to create a simple bar chart that shows the total sales amount made by each representative. Let’s run it and see the output plot:
total_sales_amount = combined_df.groupby('Rep').Total.sum()
total_sales_amount.plot.bar(figsize=(10, 6))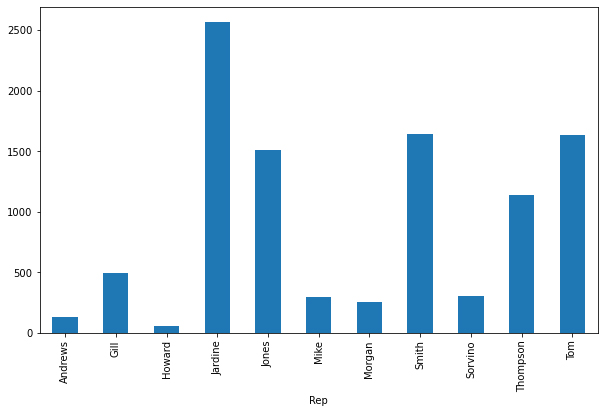
Reading Excel Files Using xlrd
Although importing data into a pandas DataFrame is much more common, another helpful package for reading Excel files in Python is xlrd. In this section, we’re going to scratch the surface of how to read Excel spreadsheets using this package.
NOTE
The xlrd package doesn’t support xlsx files due to a potential security vulnerability. So, we use the xls version of the sales data. You can download the xls version from the link below:
Sales Data Excel Workbook — xls ver.
Let’s see how it works:
import xlrd
excel_workbook = xlrd.open_workbook('sales_data.xls')
Above, the first line imports the xlrd package, then the open_workbook method reads the sales_data.xls file.
We can also open an individual sheet containing the actual data. There are two ways to do so: opening a sheet by index or by name. Let’s open the first sheet by index and the second one by name:
excel_worksheet_2020 = excel_workbook.sheet_by_index(0)
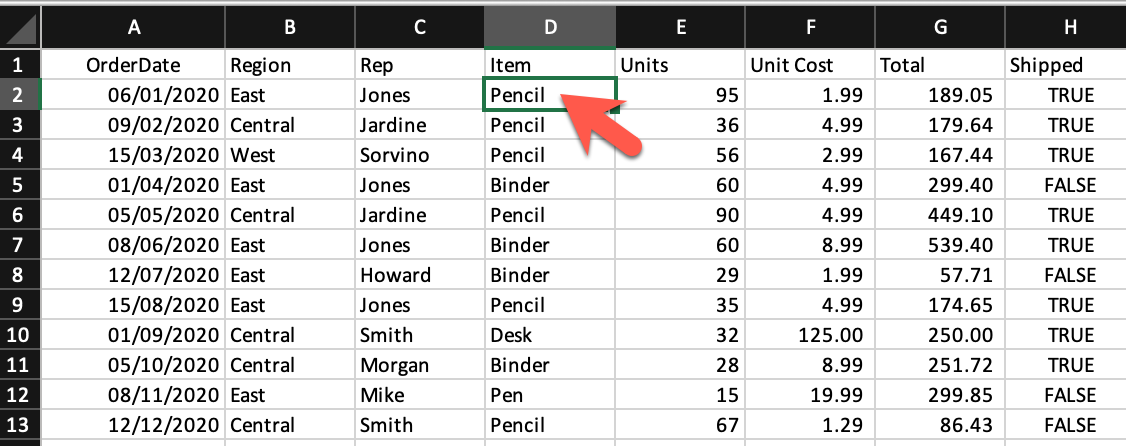
excel_worksheet_2021 = excel_workbook.sheet_by_name('2021')Now, let’s see how we can print a cell value. The xlrd package provides a method called cell_value() that takes in two arguments: the cell’s row index and column index. Let’s explore it:
print(excel_worksheet_2020.cell_value(1, 3))PencilWe can see that the cell_value function returned the value of the cell at row index 1 (the 2nd row) and column index 3 (the 4th column).
The xlrd package provides two helpful properties: nrows and ncols, returning the number of nonempty spreadsheet’s rows and columns respectively:
print('Columns#:', excel_worksheet_2020.ncols)
print('Rows#:', excel_worksheet_2020.nrows)
Columns#: 8
Rows#: 13Knowing the number of nonempty rows and columns in a spreadsheet helps us with iterating over the data using nested for loops. This makes all the Excel sheet data accessible via the cell_value() method.
Conclusion
This tutorial discussed how to load Excel spreadsheets into pandas DataFrames, work with multiple Excel sheets, and combine them into a single pandas DataFrame. We also explored the main aspects of the xlrd package as one of the simplest tools for accessing the Excel spreadsheets data.
Improve Article
Save Article
Like Article
Improve Article
Save Article
Like Article
One can retrieve information from a spreadsheet. Reading, writing, or modifying the data can be done in Python can be done in using different methods. Also, the user might have to go through various sheets and retrieve data based on some criteria or modify some rows and columns and do a lot of work. Here, we will see the different methods to read our excel file.
Required Module
pip install xlrd
Input File:

Method 1: Reading an excel file using Python using Pandas
In this method, We will first import the Pandas module then we will use Pandas to read our excel file. You can read more operations using the excel file using Pandas in this article. Click here
Python3
import pandas as pd
dataframe1 = pd.read_excel('book2.xlsx')
print(dataframe1)
Output:

Method 2: Reading an excel file using Python using openpyxl
The load_workbook() function opens the Books.xlsx file for reading. This file is passed as an argument to this function. The object of the dataframe.active has been created in the script to read the values of the max_row and the max_column properties. These values are used in the loops to read the content of the Books2.xlsx file. You can read other operations using openpyxl in this article.
Python3
import openpyxl
dataframe = openpyxl.load_workbook("Book2.xlsx")
dataframe1 = dataframe.active
for row in range(0, dataframe1.max_row):
for col in dataframe1.iter_cols(1, dataframe1.max_column):
print(col[row].value)
Output:

Method 3: Reading an excel file using Python using Xlwings
Xlwings can be used to insert data in an Excel file similarly as it reads from an Excel file. Data can be provided as a list or a single input to a certain cell or a selection of cells. You can read other operations using Xlwings in this article.
Python3
import xlwings as xw
ws = xw.Book("Book2.xlsx").sheets['Sheet1']
v1 = ws.range("A1:A7").value
print("Result:", v1, v2)
Output:
Result: ['Name  Age    Stream  Percentage',
'0      Ankit   18      Math          95',
'1      Rahul   19   Science          90',
'2    Shaurya   20  Commerce          85',
'3  Aishwarya   18      Math          80',
'4   Priyanka   19   Science          75',
None]
RECOMMENDED ARTICLE – How to Automate an Excel Sheet in Python?
Like Article
Save Article
Pandas можно использовать для чтения и записи файлов Excel с помощью Python. Это работает по аналогии с другими форматами. В этом материале рассмотрим, как это делается с помощью DataFrame.
Помимо чтения и записи рассмотрим, как записывать несколько DataFrame в Excel-файл, как считывать определенные строки и колонки из таблицы и как задавать имена для одной или нескольких таблиц в файле.
Установка Pandas
Для начала Pandas нужно установить. Проще всего это сделать с помощью pip.
Если у вас Windows, Linux или macOS:
pip install pandas # или pip3В процессе можно столкнуться с ошибками ModuleNotFoundError или ImportError при попытке запустить этот код. Например:
ModuleNotFoundError: No module named 'openpyxl'В таком случае нужно установить недостающие модули:
pip install openpyxl xlsxwriter xlrd # или pip3Будем хранить информацию, которую нужно записать в файл Excel, в DataFrame. А с помощью встроенной функции to_excel() ее можно будет записать в Excel.
Сначала импортируем модуль pandas. Потом используем словарь для заполнения DataFrame:
import pandas as pd

df = pd.DataFrame({'Name': ['Manchester City', 'Real Madrid', 'Liverpool',

                            'FC Bayern München', 'FC Barcelona', 'Juventus'],

                   'League': ['English Premier League (1)', 'Spain Primera Division (1)',

                              'English Premier League (1)', 'German 1. Bundesliga (1)',

                              'Spain Primera Division (1)', 'Italian Serie A (1)'],

                   'TransferBudget': [176000000, 188500000, 90000000,

                                      100000000, 180500000, 105000000]})
Ключи в словаре — это названия колонок. А значения станут строками с информацией.
Теперь можно использовать функцию to_excel() для записи содержимого в файл. Единственный аргумент — это путь к файлу:
df.to_excel('./teams.xlsx')
А вот и созданный файл Excel:

Стоит обратить внимание на то, что в этом примере не использовались параметры. Таким образом название листа в файле останется по умолчанию — «Sheet1». В файле может быть и дополнительная колонка с числами. Эти числа представляют собой индексы, которые взяты напрямую из DataFrame.
Поменять название листа можно, добавив параметр sheet_name в вызов to_excel():
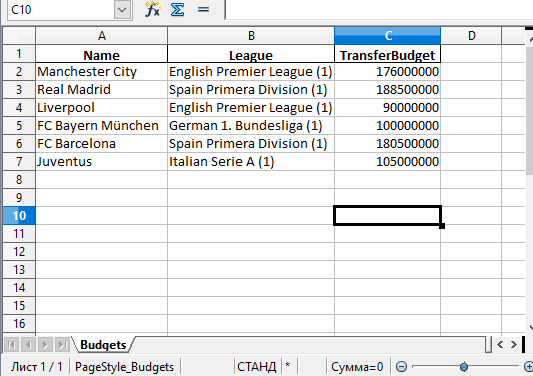
df.to_excel('./teams.xlsx', sheet_name='Budgets', index=False)
Также можно добавили параметр index со значением False, чтобы избавиться от колонки с индексами. Теперь файл Excel будет выглядеть следующим образом:
Запись нескольких DataFrame в файл Excel
Также есть возможность записать несколько DataFrame в файл Excel. Для этого можно указать отдельный лист для каждого объекта:
salaries1 = pd.DataFrame({'Name': ['L. Messi', 'Cristiano Ronaldo', 'J. Oblak'],
'Salary': [560000, 220000, 125000]})
salaries2 = pd.DataFrame({'Name': ['K. De Bruyne', 'Neymar Jr', 'R. Lewandowski'],
'Salary': [370000, 270000, 240000]})
salaries3 = pd.DataFrame({'Name': ['Alisson', 'M. ter Stegen', 'M. Salah'],
'Salary': [160000, 260000, 250000]})
salary_sheets = {'Group1': salaries1, 'Group2': salaries2, 'Group3': salaries3}
writer = pd.ExcelWriter('./salaries.xlsx', engine='xlsxwriter')
for sheet_name in salary_sheets.keys():
salary_sheets[sheet_name].to_excel(writer, sheet_name=sheet_name, index=False)
writer.save()
Здесь создаются 3 разных DataFrame с разными названиями, которые включают имена сотрудников, а также размер их зарплаты. Каждый объект заполняется соответствующим словарем.
Объединим все три в переменной salary_sheets, где каждый ключ будет названием листа, а значение — объектом DataFrame.
Дальше используем движок xlsxwriter для создания объекта writer. Он и передается функции to_excel().
Перед записью пройдемся по ключам salary_sheets и для каждого ключа запишем содержимое в лист с соответствующим именем. Вот сгенерированный файл:
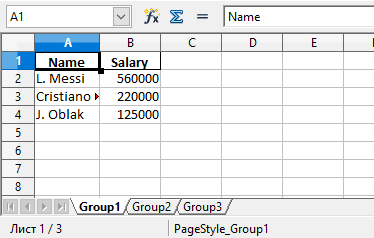
Можно увидеть, что в этом файле Excel есть три листа: Group1, Group2 и Group3. Каждый из этих листов содержит имена сотрудников и их зарплаты в соответствии с данными в трех DataFrame из кода.
Параметр движка в функции to_excel() используется для определения модуля, который задействуется библиотекой Pandas для создания файла Excel. В этом случае использовался xslswriter, который нужен для работы с классом ExcelWriter. Разные движка можно определять в соответствии с их функциями.
В зависимости от установленных в системе модулей Python другими параметрами для движка могут быть openpyxl (для xlsx или xlsm) и xlwt (для xls). Подробности о модуле xlswriter можно найти в официальной документации.
Наконец, в коде была строка writer.save(), которая нужна для сохранения файла на диске.
Чтение файлов Excel с python
По аналогии с записью объектов DataFrame в файл Excel, эти файлы можно и читать, сохраняя данные в объект DataFrame. Для этого достаточно воспользоваться функцией read_excel():
top_players = pd.read_excel('./top_players.xlsx')

top_players.head()
Содержимое финального объекта можно посмотреть с помощью функции head().
Примечание:
Этот способ самый простой, но он и способен прочесть лишь содержимое первого листа.
Посмотрим на вывод функции head():
| Name | Age | Overall | Potential | Positions | Club | |
|---|---|---|---|---|---|---|
| 0 | L. Messi | 33 | 93 | 93 | RW,ST,CF | FC Barcelona |
| 1 | Cristiano Ronaldo | 35 | 92 | 92 | ST,LW | Juventus |
| 2 | J. Oblak | 27 | 91 | 93 | GK | Atlético Madrid |
| 3 | K. De Bruyne | 29 | 91 | 91 | CAM,CM | Manchester City |
| 4 | Neymar Jr | 28 | 91 | 91 | LW,CAM | Paris Saint-Germain |
Pandas присваивает метку строки или числовой индекс объекту DataFrame по умолчанию при использовании функции read_excel().
Это поведение можно переписать, передав одну из колонок из файла в качестве параметра index_col:
top_players = pd.read_excel('./top_players.xlsx', index_col='Name')

top_players.head()
Результат будет следующим:
| Name | Age | Overall | Potential | Positions | Club |
|---|---|---|---|---|---|
| L. Messi | 33 | 93 | 93 | RW,ST,CF | FC Barcelona |
| Cristiano Ronaldo | 35 | 92 | 92 | ST,LW | Juventus |
| J. Oblak | 27 | 91 | 93 | GK | Atlético Madrid |
| K. De Bruyne | 29 | 91 | 91 | CAM,CM | Manchester City |
| Neymar Jr | 28 | 91 | 91 | LW,CAM | Paris Saint-Germain |
В этом примере индекс по умолчанию был заменен на колонку «Name» из файла. Однако этот способ стоит использовать только при наличии колонки со значениями, которые могут стать заменой для индексов.
Чтение определенных колонок из файла Excel
Иногда удобно прочитать содержимое файла целиком, но бывают случаи, когда требуется получить доступ к определенному элементу. Например, нужно считать значение элемента и присвоить его полю объекта.
Это делается с помощью функции read_excel() и параметра usecols. Например, можно ограничить функцию, чтобы она читала только определенные колонки. Добавим параметр, чтобы он читал колонки, которые соответствуют значениям «Name», «Overall» и «Potential».
Для этого укажем числовой индекс каждой колонки:
cols = [0, 2, 3]

top_players = pd.read_excel('./top_players.xlsx', usecols=cols)

top_players.head()
Вот что выдаст этот код:
| Name | Overall | Potential | |
|---|---|---|---|
| 0 | L. Messi | 93 | 93 |
| 1 | Cristiano Ronaldo | 92 | 92 |
| 2 | J. Oblak | 91 | 93 |
| 3 | K. De Bruyne | 91 | 91 |
| 4 | Neymar Jr | 91 | 91 |
Таким образом возвращаются лишь колонки из списка cols.
В DataFrame много встроенных возможностей. Легко изменять, добавлять и агрегировать данные. Даже можно строить сводные таблицы. И все это сохраняется в Excel одной строкой кода.
Рекомендую изучить DataFrame в моих уроках по Pandas.
Выводы
В этом материале были рассмотрены функции read_excel() и to_excel() из библиотеки Pandas. С их помощью можно считывать данные из файлов Excel и выполнять запись в них. С помощью различных параметров есть возможность менять поведение функций, создавая нужные файлы, не просто копируя содержимое из объекта DataFrame.
When you use Python to process data, you often need to handle data in Excel. Nowadays, you basically use Pandas to read data from Excel, but there are some Python packages other than Pandas that can satisfy the need to read Excel data.

Before we begin, learn the concepts involved in Excel.
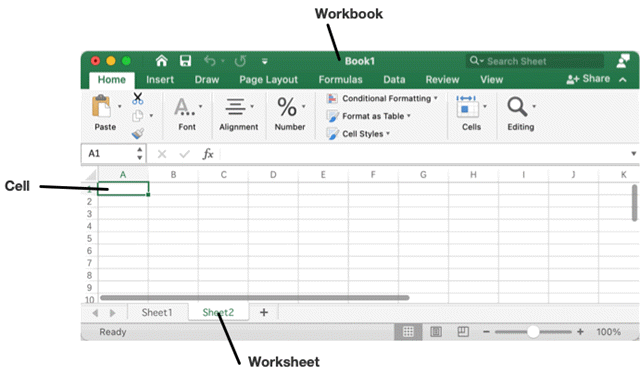
- workbook : In various libraries, a workbook is actually an excel file, which can be regarded as a database.
- sheet : In an excel file, there may be more than one sheet, a sheet can be regarded as a table in a database
- row : row is actually a row in a table, normally represented by the numbers 1, 2, 3, 4
- column : column is a column in a table, normally represented by the letters A, B, C, D
- cell : cell is a cell in a table, you can use the combination of row + column to represent, for example: A3
Differences between the file formats commonly used in Excel.
- XLS : The file format used before Excel version 2003, the binary way of saving files. xls files support a maximum of 65536 rows. xlsx supports a maximum of 1048576 rows. xls supports a maximum of 256 columns, xlsx is 16384 columns, this is the limit of the number of rows and columns is not from Excel version but the version of the file type.
- XLSX: XLSX is actually a ZIP file, that is, if you change the file name of XLSX to zip, and then you can use the unzip software to open the zip file directly, you open it to see the words, you will be able to see a lot of xml files inside.
Python Excel read/write package of xlrd, xlwt
xlrd, xlwt, xlutils is developed by Simplistix, the original website content is basically emptied, the project migrated to http://www.python-excel.org and open source in GitHub, see https://github.com/python-excel. On the website is also currently Very much not recommended for the above tools, the official currently also do not recommend the continued use of the main reasons.
- xlrd module: can read .xls, .xlsx tables
- xlwt module: can write .xls tables (can not write .xlsx files!!!)
- xlutils is not required, but additionally provides some tool functions to simplify the operation.
xlrd
Read file functionality is provided by the xlrd package. xlrd implements the xlrd.book.Book (hereafter referred to as Book), xlrd.sheet.Sheet (hereafter referred to as Sheet) and xlrd.sheet.Cell (hereafter referred to as Cell) types, which correspond to the workbook, sheet and cell concepts in Excel, where the cell is the minimum operational granularity.
xlrd load form files on a function open_workbook, commonly used parameters on two.
- filename, specify the path to open the Excel file
- on_demand, if it is True, then load the workbook on-demand form, if it is False, then directly load all forms, the default is False, in order to save resources is generally set to True, which is more obvious when the performance of large files.
After reading the Excel file to get the Workbook, the next step is to locate the Sheet. the Book class object has several important properties and methods for indexing Sheets.
- nsheets property, which indicates the number of Sheet objects contained
- sheet_names method, which returns the names of all sheets
- sheet_by_index, sheet_by_name methods, which index the sheets using the serial number and name, respectively
- sheets method, which returns a list of all Sheet objects
|
|
After getting the Sheet object, the next step is to index the rows/columns/cells and get the data of the rows/columns/cells. the Sheet class object has several important properties and methods to support the subsequent operations.
- the name property, which is the name of the form.
- nrows, ncols properties, indicating the maximum number of rows and columns read into the form. Since cells only support row number indexing, these two properties are necessary to check for out-of-bounds content.
- cell method, accepts 2 parameters, i.e. row and column serial numbers, returns Cell object, note that xlrd only supports indexing cells by row serial number, row serial number starts from 0.
- cell_value method, similar to the cell method, except that the value returned is the value in the cell, not the Cell object.
- cell_type method, returns the type of cell
- row, col method, returns a list of Cell objects composed of 1 whole row (column).
- row_types, col_types, return the type of cells in a number of columns (rows) within the specified row (column).
- row_values, col_values, returns the value of the cell in the specified row (column) of a number of columns (rows).
- row_slice, col_slice, return to the specified row (column) within a number of columns (rows) of cells, is a combination of types and values.
|
|
Note that xlrd reads excel workbooks with row and column indexes starting from 0.
- row = ws.row_values(i, ca, cb) # read the contents of the [ca, cb) column in row i, return list. note that the cb column is not included
- col = ws.col_values(i, ra, rb) # read the contents of the [ra, rb) row in column i, return to list. note that the rb row is not included
- cell= ws.cell_value(r, c) # read the contents of the cell in column j of row i
For predefined constants of data types
| predefined constants | numeric | strings |
|---|---|---|
| XL_CELL_EMPTY | 0 | empty |
| XL_CELL_TEXT | 1 | text |
| XL_CELL_NUMBER | 2 | number |
| XL_CELL_DATE | 3 | xldate |
| XL_CELL_BOOLEAN | 4 | boolean |
| XL_CELL_ERROR | 5 | error |
| XL_CELL_BLANK | 6 | blank |
The date data type is read as a floating point number and needs to be manually converted to time format, such as a cell date of 2020-2-5, xlrd module reads the value: 43866.0, there are two ways to convert a floating point number to the correct time format.
- xldate_as_tuple(xdate,datemode): returns a meta ancestor consisting of (year,month,day,hours,minutes,seconds), datemode parameter has 2 values, 0 means 1900 as the base timestamp (common), 1 means 1904 as the base timestamp. Dates before 1900-3-1 cannot be converted to tuples.
- xldate_as_datetime(xdate,datemode) (need to introduce datetime module first), return a datetime object directly, xlrd.xldate_as_datetime(xdate,datemode).strftime( ‘%Y-%m-%d %H:%M:%S’)
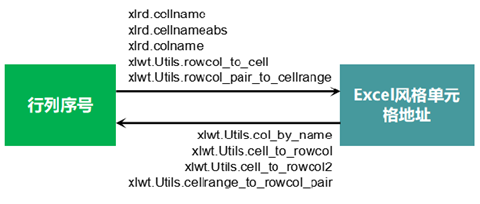
For indexing purposes, the cellname, cellnameabs, and colname functions of the xlrd package convert the row and column serial numbers to Excel-style cell addresses; the rowcol_to_cell and rowcol_pair_to_cellrange functions of the xlwt.Utils module can also convert the row and column serial numbers to Excel-style cell address; and col_by_name, cell_to_rowcol, cell_to_rowcol2, cellrange_to_rowcol_pair functions, the Excel-style cell address converted to row number.
|
|
The row number and cell address conversions are summarized in the following figure.
To iterate through all the cells in a sheet, usually by row and column order to get the cell by cell, and then read out the cell value to save for subsequent processing. You can also directly get a whole row (column), the whole row (column) to deal with the data.
|
|
xlwt
xlrd package can only read out the data in the form, can not do anything to rewrite the data, rewrite the data and save it to a file, by xlwt package. xlwt implements a set of xlwt.Workbook. Worksheet (hereinafter referred to as Worksheet) types, but unfortunately there is no inheritance relationship with the xlrd package, which results in the Book and Sheet objects read out of the xlrd package can not be used directly to create Workbook and Worksheet objects, but only to store the data temporarily for subsequent writing back, making the process very cumbersome.
The types, methods, functions and parameters exposed to the public by the xlwt package are also very concise and fit closely with the process of rewriting data and saving it to a file.
- Call the Workbook function of the Workbook module to create a Workbook object, the first parameter is encoding
- call the Workbook object’s add_sheet method to add Worksheet objects to Workbook, the first parameter sheetname specifies the name of the form, the second parameter cell_overwrite_ok determines whether to allow cell overwriting, it is recommended to set to True, to avoid the program may write data to the cell multiple times and throw an error.
- call the Worksheet object write method, to the Worksheet row / column / cell write data, the data used here in most cases from the xlrd package from the Excel file to read the results, the first two parameters for the row number, the third parameter is the value to be written, the fourth parameter is the cell style, such as no special needs default can be; * call the Workbook object write method, to write data to the Worksheet row / column / cell.
- Call the save method of the Workbook object to save the Workbook object to a file, with the parameters of the file name or file stream object.
Other properties, methods, functions are generally used less.
xlwt mainly involves three classes: Workbook corresponds to the workbook file, Worksheet corresponds to the worksheet, XFStyle object used to control the cell format (XF record).
|
|
Example.
|
|
There are two things to remember about saving.
- All Python libraries involving Excel operations do not support “edit and save in place”, and xlwt is no exception. “Save” is actually “Save As”, except that if you specify to save to the original file, the original file is overwritten.
- Even if you specify the extension .xlsx, the file format itself is still xls format.
Note that the date read from data.xls is essentially a numeric value, copied and written or numeric, you need to set the cell to date format in Excel to display as a date form.
xlwt also supports writing formulas, but more limited.
|
|
In addition, xlwr supports writing the contents of merged cells across rows or columns (rowx and colx starting from 0):
|
|
Setting excel cell styles
Set cell data formatting.
|
|
The style instance needs to be specified in ws.write() to take effect.
Example.
|
|
Or.
|
|
XFStyle is used to specify the cell content format, use the easyxf function to get an XFStyle object.
|
|
strg_to_parse is a string that defines the format, and can control the formatting properties including font (font), alignment (align), border form (border), color style (pattern) and cell protection (protection), etc. The specific formatting properties are listed in detail at the end of the article.
String strg_to_parse syntax format is as follows.
|
|
For example.
|
|
The parameter string num_format_str is used to specify the format of the number, e.g.
|
|
The following are some use cases for xlwt.Style.easyxf.
|
|
xlutils
xlutils depends on xlrd and xlwt and contains the following modules.
- copy: copy xlrd.Book object to xlwt.Workbook object
- display: to display information about xlrd related objects in a more friendly and secure way
- filter: a small framework for splitting and filtering existing Excel files to new Excel files
- margins: get how much useful information is contained in the Excel file
- Book object into an Excel file
- styles: a tool for formatting information in Excel files
- view: use the view information of the worksheet in workbook
Here we mainly introduce the use of two functions, the first xlutils.copy.copy(wb). From the above steps, if you are only generating a brand new Excel file, you can use the xlwt package. If you are “editing” some data in the Excel file, you must use xlrd to load the original file and make a copy of the original table, and then use xlwt to handle the cells that need to be edited, which is a cumbersome process. xlutils package copy is created to simplify this process, and can convert xlrd’s Book object to xlwt’s Workbook object.
|
|
The other is the function xlutils.filter.process(reader, *chain) in xlutils.filter.
The module xlutils.filter contains some built-in modules reader, writer and filter, and the function process() for stringing them together, with the main function of filtering and splitting Excel files.
- The reader is used to fetch data from the data source and convert it into a series of Book objects, which will then call the first filter-related method. There are some basic reader classes provided within the module.
- filterThe user gets the results needed for a specific task. Some specific methods have to be defined in the filter. The implementation of these methods can be filled with any functionality as needed, but will usually end with a call to the corresponding method of the next filter.
- writer handles the specific method in the last filter in the parameter chain. writer is usually used to copy information from the data source and write it to the output file. Since there is a lot of work involved in the writer and usually only writing binary data to the target location is slightly different, some basic writer classes are provided within the module.
- process(reader, *chain) can execute built-in or custom readers, writers and filters in tandem.
XFStyle format
format attributes
- font
- bold: boolean value, default is False
- charset: see next section for optional values, default is sys_default
- color (or color_index, color_index, color): see the next section for optional values, default is automatic
- escapement: optional value is none, superscript or subscript, default value is none
- family: a string containing the font family of the font, the default value is none
- height: the height value obtained by multiplying point size by 20, the default is 200, corresponding to 10pt
- italic: boolean value, default is False
- name: a string containing the name of the font, default is Arial
- outline: Boolean value, default is False
- shadow: Boolean value, default is False
- struck_out: Boolean value, default is False
- underline: boolean value or one of none, single, single_acc, double, double_acc. The default value is none
- alignment (or align)
- direction (or dire): one of the general, lr, rl, default general
- horizontal (or horiz, horz): one of the following: general, left, center|centre, right, filled, justified, center|centre_across_selection, distributed one of the following, the default value is general
- indent (or inde): indent value 0 to 15, default value 0
- rotation (or rota): integer value between -90 and +90 or stacked, one of none, default is none
- shrink_to_fit (or shri, shrink): boolean value, default is False
- vertical (or vert): one of top, center|centre, bottom, justified, distributed, default is bottom
- wrap: Boolean value, default is False
- borders (or borders)
- left: border style, see the next section for details
- right: border style, see next section
- top: border style, see next section
- bottom: border style, see next section
- diag: the border style, see the next section
- left_colour (or left_color): color value, see next section, default is automatic
- right_colour (or right_color): color value, see next section, default is automatic
- top_colour (or top_color): color value, see next section, default is automatic
- bottom_colour (or bottom_color): color value, see next section, default is automatic
- diag_colour (or diag_color): color value, see next section, default is automatic
- need_diag_1: Boolean value, default is False
- need_diag_2: Boolean value, default is False
- pattern
- back_colour (or back_color, pattern_back_colour, pattern_back_color): color value, see the next section, default is automatic
- fore_colour (or fore_color, pattern_fore_colour, pattern_fore_color): color value, see next section for details, default is automatic
- pattern: no_fill, none, solid, solid_fill, solid_pattern, fine_dots, alt_bars, sparse_dots, thick_horz_bands, thick_vert_bands, thick_ backward_diag, thick_forward_diag, big_spots, bricks, thin_horz_bands, thin_vert_bands, thin_backward_diag, thin_forward_diag, squares, and diamonds one of them, default is none
- protection
- cell_locked: Boolean value, default is True
- formula_hidden: Boolean value, default is False
Description of the values taken
Boolean
- True can be represented as 1, yes, true, or on.
- False can be 0, no, false, or off.
charset
The optional values for the character set are as follows.
|
|
color
The available values for color are as follows.
| aqua | dark_red_ega | light_blue | plum |
|---|---|---|---|
| black | dark_teal | light_green | purple_ega |
| blue | dark_yellow | light_orange | red |
| blue_gray | gold | light_turquoise | rose |
| bright_green | gray_ega | light_yellow | sea_green |
| brown | gray25 | lime | silver_ega |
| coral | gray40 | magenta_ega | sky_blue |
| cyan_ega | gray50 | ocean_blue | tan |
| dark_blue | gray80 | olive_ega | teal |
| dark_blue_ega | green | olive_green | teal_ega |
| dark_green | ice_blue | orange | turquoise |
| dark_green_ega | indigo | pale_blue | violet |
| dark_purple | ivory | periwinkle | white |
| dark_red | lavender | pink | yellow |
borderline
Can be an integer value from 0 to 13, or one of the following values.
|
|
Reference link.
- https://github.com/python-excel
- http://xlrd.readthedocs.io/en/latest/
- http://xlwt.readthedocs.io/en/latest/api.html
- http://xlutils.readthedocs.io/en/latest/
XlsxWriter is a Python module for writing documents in Excel 2007+ XLSX file format.
xlsxwriter can be used to write text, numbers, formulas and hyperlinks to multiple worksheets, supports formatting and more, and includes.
- 100% compatible with Excel XLSX files.
- Full formatting.
- Merge cells.
- Defined names.
- Charting.
- Automatic filtering.
- Data validation and drop-down lists.
- Conditional formatting.
- Worksheet png/jpeg/bmp/wmf/emf images.
- Rich multi-format strings.
- Cell annotation.
- Integration with Pandas.
- Text boxes.
- Support for adding macros.
- Memory-optimized mode for writing large files.
Pros.
- More powerful: Relatively speaking, this is the most powerful tool other than Excel itself. Font settings, foreground color background color, border settings, view zoom (zoom), cell merge, autofilter, freeze panes, formulas, data validation, cell comments, row height and column width settings, etc.
- Support for large file writes: If the amount of data is very large, you can enable constant memory mode, which is a sequential write mode that writes a row of data as soon as you get it, without keeping all the data in memory.
Disadvantages.
- No read and modify support: The author did not intend to make an XlsxReader to provide read operations. If you can’t read, you can’t modify. It can only be used to create new files. When you write data in a cell, there is still no way to read the information that has been written unless you have saved the relevant content yourself.
- XLS files are not supported: XLS is the format used in Office 2013 or earlier and is a binary format file. XLSX is a compressed package made up of a series of XML files (the final X stands for XML). If you have to create a lower version of XLS file, please go to xlwt.
- Pivot Table is not supported at this time.
xlsxwriter easy to use
|
|
We can also set the style to the excel table, set the style to the table using the add_format method.
|
|
The xlsxwriter package allows us to insert data by row and column, using the following methods.
|
|
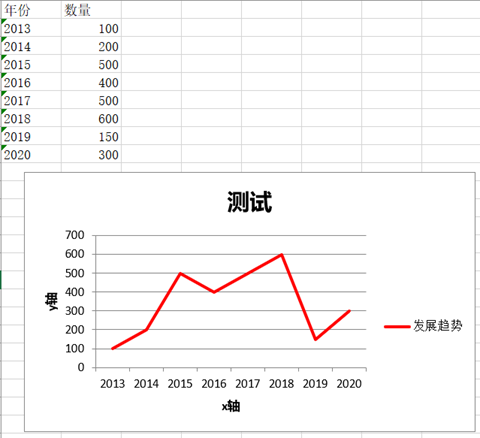
Common functions of xlsxwriter module
Set cell formatting
Set the formatting directly by means of a dictionary.
|
|
Set the cell format by means of the format object.
|
|
There are many more operations like this for some cell tables, so you can study them according to your needs.
|
|
Common chart types.
- area: Creates an Area (solid line) style sheet.
- bar: Creates a bar style (transposed histogram) chart.
- column: Creates a column style (histogram) chart.
- line: Creates a line chart.
- pie: Creates a pie-style chart.
- doughnut: Creates a doughnut style chart.
- scatter: Creates a scatter chart style chart.
- stock: Creates a stock style chart.
- radar: Creates a radar style sheet.
Sample Code Explanation
|
|
Types supported by XlsxWriter
Excel often treats different types of input data, such as strings and numbers, differently, though usually transparently to the user. the XlsxWriter view emulates this with the worksheet.write() method, by mapping Python data types to the types supported by Excel.
The write() method serves as a generic alias for several more specific methods.
- write_string()
- write_number()
- write_blank()
- write_formula()
- write_datetime()
- write_boolean()
- write_url()
In the code here, we use some of these methods to handle different types of data.
|
|
This is mainly to show that if you need more control over the data you write to the worksheet, you can use the appropriate methods. In this simple example, the write() method actually works out well.
Date handling is also new to the program.
Dates and times in Excel are floating-point numbers applied in a numeric format to make it easier to display them in the correct format. If the date and time are Python datetime objects, then XlsxWriter will automatically do the required numeric conversion. However, we also need to add numeric formatting to ensure that Excel displays them as dates.
|
|
Finally, set_column() is needed to adjust the width of column B so that the date can be displayed clearly.
|
|
Reference links.
- https://xlsxwriter.readthedocs.io/
Python Excel Reading and Writing with OpenPyXL
And you can make detailed settings for the cells in the Excel file, including cell styles and other content, and even support the insertion of charts, print settings and other content. openpyxl can read and write xltm, xltx, xlsm, xlsx and other types of files.
The general process of using openpyxl is: create/read excel file -> select sheet object -> operate on form/cell -> save excel
Create/read excel files
|
|
sheet form operations
|
|
Cell object
|
|
Format style setting
|
|
Other
|
|
Python Excel manipulation of xlwings
xlwings is a BSD-licensed Python based library. It makes it easy to call each other between Python and Excel:
- Scripting: Automate the processing of Excel data in Python or interact with Excel using VBA-like syntax.
- Macros: Replace VBA macros with powerful and clean Python code.
- UDFs (User Defined Functions): Write User Defined Functions (UDFs) in Python, for windows only.
- REST API: Open Excel workbooks to the outside through the REST API.
- Support for Windows and MacOS
xlwings open source free , can be very easy to read and write data in Excel files , and cell formatting changes . xlwings can also seamlessly connect with matplotlib, Numpy and Pandas , support for reading and writing Numpy, Pandas data types , matplotlib visual charts into excel. The most important thing is that xlwings can call the program written by VBA in Excel file, and also can let VBA call the program written in Python. It supports reading of .xls files and reading and writing of .xlsx files.
The main structure of xlwings.
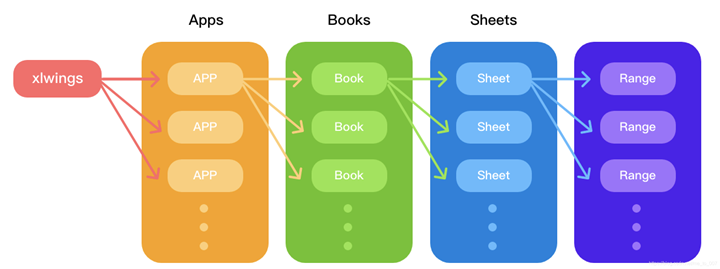
As you can see, the direct interface with xlwings is the apps, that is, the Excel application, then the workbook books and worksheet sheets, and finally the cell area range, which is quite different from openpyxl, and because of this, xlwings needs to still have the Excel application environment installed.
App common syntax
|
|
Book common syntax
|
|
Sheet common syntax
|
|
Range common syntax
|
|
Transformer
|
|
Reference link.
- https://github.com/xlwings/xlwings
- https://docs.xlwings.org/zh_CN/latest/index.html
PyExcelerate is claimed to be the best performing Python writing package for Excel xlsx files. It is also relatively easy to use.
|
|
PyExcel is an open source Excel manipulation library. It wraps a set of APIs for reading and writing file data , this set of APIs accept parameters including two keyword collections , one specifying the data source , the other specifying the destination file , each collection has many keyword parameters to control the read and write details . pyexcel package also implements a workbook , form types for accessing , manipulating and saving data , read and write operations are very fancy.
Read the file
pyexcel contains some get functions for reading files: get_array, get_dict, get_record, get_book, get_book_dict, get_sheet. These methods convert the file content to various types such as array, dict, sheet/book, etc., masking the file media to be csv/tsv text, xls/xlsx table files, dict/list types, sql database tables, and other details. There is also an equivalent set of iget series functions, the only difference being the return generator for efficiency.
- The get_sheet function takes the sheet_name parameter, which is used to specify the sheet to be read for Excel tables with multiple sheets, or the 1st sheet if default. get_sheet function also takes the name_columns_by_row/name_rows_by_column parameter for the specified row/column as the column/row name. The default value is 0, which represents the 1st row, and the sheet.Sheet class has a method with the same name for the same operation. Several other functions are more similar to get_sheet and accept the same parameters.
- The get_array function converts the file data into an array, i.e. a nested list, with each element of the list corresponding to one row of the table.
- The get_dict function converts the file data into an ordered dictionary, using the field in the first row as the key and subsequent rows of values forming a list as the value.
- get_record function converts the file data into a list formed by an ordered dictionary, each line of data corresponds to an ordered dictionary, and the dictionary uses the field of the first line of the file as the key and the line of data as the value.
- get_book function converts the file into a book.Book object. If read from a csv file, it contains only 1 sheet, the name is the file name; if read from an xls file, it contains all the sheets in the xls file.
- get_book_dict function converts the file data into an ordered dictionary of multiple sheets, with sheet name as key and sheet data in the form of a nested list as value, which is more useful in Excel tables containing multiple sheets; for csv files, as there is only 1 sheet, the returned ordered dictionary has only 1 item.
Data Access
Book and Sheet
Book and pyexcel.book.Sheet types are implemented in pyexcel, which correspond to the concept of book and sheet in Excel sheet files, and can be obtained as book/sheet objects by the above get series functions, or by pyexcel.Book()/ pyexcel.Sheet() function to create.
After getting the book object, the next step is to access the sheets in the book. pyexcel.book.Book class object can index the corresponding sheets by serial number, or you can call the sheet_by_index and sheet_by_name methods to get the specified sheet content, and call the sheet_names method to return Calling the sheet_names method returns the names of all the sheets contained in the book object.
The pyexcel.sheet.Sheet class object has a texttable property, which means that the text, in addition to the sheet name, and the dotted line character to draw the table border, directly print the variable sh and print sh.texttable effect is the same.
In addition, pyexcel.sheet.Sheet class has several very useful properties.
- content property, compared to displaying the sheet directly, there is less of the sheet name in the first row.
- csv property, the csv form of the sheet data, without the table box line.
- array property, the array form of the sheet data (nested list), the same as the get_array function returns.
- row/column property, very similar to nested list, supports accessing specified row/column by subscript, serial number starts from 0.
Rows and Columns
After getting pyexcel.sheet.Sheet object, besides using row/column property to get all the row/column objects collection for further iterative traversal, you can also index any row/column by serial number, which starts from 0. When the serial number exceeds the table row/column range, an IndexError error is thrown, and you can use the row_range/column_range methods of the sheet object to check the row/column range. row_at/column_at methods of pyexcel.sheet. The serial number index is equivalent.
Cells
The pyexcel.sheet.Sheet object supports binary serial number indexing of any cell, or replacing the serial number with a row/column name (please note the code comments below). It can also be indexed in its entirety as an Excel sheet cell address without any conversion.
Rewrite the file
Rewriting a file includes two steps: rewriting variable values and writing variable objects to the file, which is recommended to be done through pyexcel.book.Sheet or pyexcel.book.
For pyexcel.book.Sheet class object, row and column properties support add, delete and change operations like list, and both have save_as method for writing objects to file. In addition, pyexcel provides the save series wrapper functions: save_as, save_book_as to write to a file, and when specifying the destination file, the parameter names used are prefixed with “dest_” compared to the get series. For example, get series use file_name to specify the source of the data file, save series use dest_file_name to specify the destination file path; get series use delimiter parameter to specify the csv separator, save series use dest_delimiter to specify the separator used when writing to csv files. pyexcel. Sheet class object can be added, deleted or changed in whole rows/columns, and can also be positioned to assign values to specific cells, and the number of elements should be consistent with the number of columns/rows when using a list of whole rows/columns to assign values. For pyexcel.book.Book class object, you can either extend the whole book as a whole like an operation list, or index only some sheets and then stitch and assign values as a whole. pyexcel.book.Sheet also implements form transpose, region, cut, paste, and map application. paste, map application (map), row filtering (filter), formatting (format) and other fancy operations.
Book class object’s save_as method, which is simple and straightforward, and is recommended for operating Excel. You can also use the pyexcel package level save series wrapper functions, which are more suitable for file type conversion, and there is an equivalent set of isave series functions, the main difference is that the variables are only read in when writing, to improve efficiency. These save methods/functions above will automatically discern the format type based on the destination file extension. pyexcel.book.Sheet or pyexcel.book.Book classes also implement the save_to series of functions to write objects to database, ORM, memory, etc.
Summary
- The pyexcel package encapsulates the get series of functions for reading and converting data from files, all of which can flexibly support multiple ways of reading files. For manipulating Excel files, the get_sheet function is recommended to be preferred.
- pyexcel package support for different formats of files depends on different plug-in packages.
- pyexcel package internally implements the book.Sheet or pyexcel.book.Book type, which corresponds to the workbook and form concepts of Excel files, providing a variety of flexible methods for data access, deletion, and visualization.
- Book type has the save series of methods to write object variables to files, databases, memory, etc., which is recommended and preferred; also the pyexcel package level save_as series of wrapper functions are very convenient for converting file types; these methods/functions for writing to files automatically discriminate based on the destination file extensions The format type is automatically determined by the destination file extension.
- cookbook package encapsulates some utility functions, such as multi-type file merge, table split;
- book.Sheet and pyexcel.book.Book and other classes do not implement the full method, call some will throw an error, be aware of this big hole, this article in the ipython environment when writing examples of the error is not given, which is also the reason for the prompt number is not consecutive.
Reference links.
- http://docs.pyexcel.org
Other tools.
- Excel formula tool: https://github.com/vinci1it2000/formulas
In this tutorial, you’ll learn how to use Python and Pandas to read Excel files using the Pandas read_excel function. Excel files are everywhere – and while they may not be the ideal data type for many data scientists, knowing how to work with them is an essential skill.
By the end of this tutorial, you’ll have learned:
- How to use the Pandas read_excel function to read an Excel file
- How to read specify an Excel sheet name to read into Pandas
- How to read multiple Excel sheets or files
- How to certain columns from an Excel file in Pandas
- How to skip rows when reading Excel files in Pandas
- And more
Let’s get started!
The Quick Answer: Use Pandas read_excel to Read Excel Files
To read Excel files in Python’s Pandas, use the read_excel() function. You can specify the path to the file and a sheet name to read, as shown below:
# Reading an Excel File in Pandas
import pandas as pd

df = pd.read_excel('/Users/datagy/Desktop/Sales.xlsx')

# With a Sheet Name
df = pd.read_excel(
   io='/Users/datagy/Desktop/Sales.xlsx'
   sheet_name ='North'
)
In the following sections of this tutorial, you’ll learn more about the Pandas read_excel() function to better understand how to customize reading Excel files.
Understanding the Pandas read_excel Function
The Pandas read_excel() function has a ton of different parameters. In this tutorial, you’ll learn how to use the main parameters available to you that provide incredible flexibility in terms of how you read Excel files in Pandas.
| Parameter | Description | Available Option |
|---|---|---|
io= |
The string path to the workbook. | URL to file, path to file, etc. |
sheet_name= |
The name of the sheet to read. Will default to the first sheet in the workbook (position 0). | Can read either strings (for the sheet name), integers (for position), or lists (for multiple sheets) |
usecols= |
The columns to read, if not all columns are to be read | Can be strings of columns, Excel-style columns (“A:C”), or integers representing positions columns |
dtype= |
The datatypes to use for each column | Dictionary with columns as keys and data types as values |
skiprows= |
The number of rows to skip from the top | Integer value representing the number of rows to skip |
nrows= |
The number of rows to parse | Integer value representing the number of rows to read |
.read_excel() functionThe table above highlights some of the key parameters available in the Pandas .read_excel() function. The full list can be found in the official documentation. In the following sections, you’ll learn how to use the parameters shown above to read Excel files in different ways using Python and Pandas.
As shown above, the easiest way to read an Excel file using Pandas is by simply passing in the filepath to the Excel file. The io= parameter is the first parameter, so you can simply pass in the string to the file.
The parameter accepts both a path to a file, an HTTP path, an FTP path or more. Let’s see what happens when we read in an Excel file hosted on my Github page.
# Reading an Excel file in Pandas
import pandas as pd

df = pd.read_excel('https://github.com/datagy/mediumdata/raw/master/Sales.xlsx')
print(df.head())

# Returns:
#         Date Customer  Sales
# 0 2022-04-01        A    191
# 1 2022-04-02        B    727
# 2 2022-04-03        A    782
# 3 2022-04-04        B    561
# 4 2022-04-05        A    969
If you’ve downloaded the file and taken a look at it, you’ll notice that the file has three sheets? So, how does Pandas know which sheet to load? By default, Pandas will use the first sheet (positionally), unless otherwise specified.
In the following section, you’ll learn how to specify which sheet you want to load into a DataFrame.
How to Specify Excel Sheet Names in Pandas read_excel
As shown in the previous section, you learned that when no sheet is specified, Pandas will load the first sheet in an Excel workbook. In the workbook provided, there are three sheets in the following structure:
Sales.xlsx
|---East
|---West
|---North
Because of this, we know that the data from the sheet “East” was loaded. If we wanted to load the data from the sheet “West”, we can use the sheet_name= parameter to specify which sheet we want to load.
The parameter accepts both a string as well as an integer. If we were to pass in a string, we can specify the sheet name that we want to load.
Let’s take a look at how we can specify the sheet name for 'West':
# Specifying an Excel Sheet to Load by Name
import pandas as pd

df = pd.read_excel(
    io='https://github.com/datagy/mediumdata/raw/master/Sales.xlsx',
    sheet_name='West')
print(df.head())

# Returns:
#         Date Customer  Sales
# 0 2022-04-01        A    504
# 1 2022-04-02        B    361
# 2 2022-04-03        A    694
# 3 2022-04-04        B    702
# 4 2022-04-05        A    255
Similarly, we can load a sheet name by its position. By default, Pandas will use the position of 0, which will load the first sheet. Say we wanted to repeat our earlier example and load the data from the sheet named 'West', we would need to know where the sheet is located.
Because we know the sheet is the second sheet, we can pass in the 1st index:
# Specifying an Excel Sheet to Load by Position
import pandas as pd

df = pd.read_excel(
    io='https://github.com/datagy/mediumdata/raw/master/Sales.xlsx',
    sheet_name=1)
print(df.head())

# Returns:
#         Date Customer  Sales
# 0 2022-04-01        A    504
# 1 2022-04-02        B    361
# 2 2022-04-03        A    694
# 3 2022-04-04        B    702
# 4 2022-04-05        A    255
We can see that both of these methods returned the same sheet’s data. In the following section, you’ll learn how to specify which columns to load when using the Pandas read_excel function.
How to Specify Columns Names in Pandas read_excel
There may be many times when you don’t want to load every column in an Excel file. This may be because the file has too many columns or has different columns for different worksheets.
In order to do this, we can use the usecols= parameter. It’s a very flexible parameter that lets you specify:
- A list of column names,
- A string of Excel column ranges,
- A list of integers specifying the column indices to load
Most commonly, you’ll encounter people using a list of column names to read in. Each of these columns are comma separated strings, contained in a list.
Let’s load our DataFrame from the example above, only this time only loading the 'Customer' and 'Sales' columns:
# Specifying Columns to Load by Name
import pandas as pd

df = pd.read_excel(
    io='https://github.com/datagy/mediumdata/raw/master/Sales.xlsx',
    usecols=['Customer', 'Sales'])
print(df.head())

# Returns:
#   Customer  Sales
# 0        A    191
# 1        B    727
# 2        A    782
# 3        B    561
# 4        A    969
We can see that by passing in the list of strings representing the columns, we were able to parse those columns only.
If we wanted to use Excel changes, we could also specify columns 'B:C'. Let’s see what this looks like below:
# Specifying Columns to Load by Excel Range
import pandas as pd

df = pd.read_excel(
    io='https://github.com/datagy/mediumdata/raw/master/Sales.xlsx',
    usecols='B:C')
print(df.head())

# Returns:
#   Customer  Sales
# 0        A    191
# 1        B    727
# 2        A    782
# 3        B    561
# 4        A    969
Finally, we can also pass in a list of integers that represent the positions of the columns we wanted to load. Because the columns are the second and third columns, we would load a list of integers as shown below:
# Specifying Columns to Load by Their Position
import pandas as pd

df = pd.read_excel(
    io='https://github.com/datagy/mediumdata/raw/master/Sales.xlsx',
    usecols=[1,2])
print(df.head())

# Returns:
#   Customer  Sales
# 0        A    191
# 1        B    727
# 2        A    782
# 3        B    561
# 4        A    969
In the following section, you’ll learn how to specify data types when reading Excel files.
How to Specify Data Types in Pandas read_excel
Pandas makes it easy to specify the data type of different columns when reading an Excel file. This serves three main purposes:
- Preventing data from being read incorrectly
- Speeding up the read operation
- Saving memory
You can pass in a dictionary where the keys are the columns and the values are the data types. This ensures that data are ready correctly. Let’s see how we can specify the data types for our columns.
# Specifying Data Types for Columns When Reading Excel Files
import pandas as pd

df = pd.read_excel(
    io='https://github.com/datagy/mediumdata/raw/master/Sales.xlsx',
    dtype={'date':'datetime64', 'Customer': 'object', 'Sales':'int'})
print(df.head())

# Returns:
#   Customer  Sales
#         Date Customer  Sales
# 0 2022-04-01        A    191
# 1 2022-04-02        B    727
# 2 2022-04-03        A    782
# 3 2022-04-04        B    561
# 4 2022-04-05        A    969
It’s important to note that you don’t need to pass in all the columns for this to work. In the next section, you’ll learn how to skip rows when reading Excel files.
How to Skip Rows When Reading Excel Files in Pandas
In some cases, you’ll encounter files where there are formatted title rows in your Excel file, as shown below:
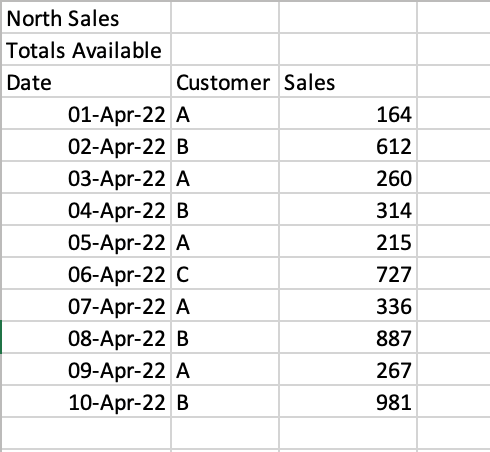
If we were to read the sheet 'North', we would get the following returned:
# Reading a poorly formatted Excel file
import pandas as pd

df = pd.read_excel(
    io='https://github.com/datagy/mediumdata/raw/master/Sales.xlsx',
    sheet_name='North')
print(df.head())

# Returns:
#            North Sales Unnamed: 1 Unnamed: 2
# 0     Totals Available        NaN        NaN
# 1                 Date   Customer      Sales
# 2  2022-04-01 00:00:00          A        164
# 3  2022-04-02 00:00:00          B        612
# 4  2022-04-03 00:00:00          A        260
Pandas makes it easy to skip a certain number of rows when reading an Excel file. This can be done using the skiprows= parameter. We can see that we need to skip two rows, so we can simply pass in the value 2, as shown below:
# Reading a Poorly Formatted File Correctly
import pandas as pd

df = pd.read_excel(
    io='https://github.com/datagy/mediumdata/raw/master/Sales.xlsx',
    sheet_name='North',
    skiprows=2)
print(df.head())

# Returns:
#         Date Customer  Sales
# 0 2022-04-01        A    164
# 1 2022-04-02        B    612
# 2 2022-04-03        A    260
# 3 2022-04-04        B    314
# 4 2022-04-05        A    215
This read the file much more accurately! It can be a lifesaver when working with poorly formatted files. In the next section, you’ll learn how to read multiple sheets in an Excel file in Pandas.
How to Read Multiple Sheets in an Excel File in Pandas
Pandas makes it very easy to read multiple sheets at the same time. This can be done using the sheet_name= parameter. In our earlier examples, we passed in only a single string to read a single sheet. However, you can also pass in a list of sheets to read multiple sheets at once.
Let’s see how we can read our first two sheets:
# Reading Multiple Excel Sheets at Once in Pandas
import pandas as pd

dfs = pd.read_excel(
    io='https://github.com/datagy/mediumdata/raw/master/Sales.xlsx',
    sheet_name=['East', 'West'])

print(type(dfs))

# Returns: <class 'dict'>
In the example above, we passed in a list of sheets to read. When we used the type() function to check the type of the returned value, we saw that a dictionary was returned.
Each of the sheets is a key of the dictionary with the DataFrame being the corresponding key’s value. Let’s see how we can access the 'West' DataFrame:
# Reading Multiple Excel Sheets in Pandas
import pandas as pd

dfs = pd.read_excel(
    io='https://github.com/datagy/mediumdata/raw/master/Sales.xlsx',
    sheet_name=['East', 'West'])

print(dfs.get('West').head())

# Returns:
#         Date Customer  Sales
# 0 2022-04-01        A    504
# 1 2022-04-02        B    361
# 2 2022-04-03        A    694
# 3 2022-04-04        B    702
# 4 2022-04-05        A    255
You can also read all of the sheets at once by specifying None for the value of sheet_name=. Similarly, this returns a dictionary of all sheets:
# Reading Multiple Excel Sheets in Pandas
import pandas as pd

dfs = pd.read_excel(
    io='https://github.com/datagy/mediumdata/raw/master/Sales.xlsx',
    sheet_name=None)
In the next section, you’ll learn how to read multiple Excel files in Pandas.
How to Read Only n Lines When Reading Excel Files in Pandas
When working with very large Excel files, it can be helpful to only sample a small subset of the data first. This allows you to quickly load the file to better be able to explore the different columns and data types.
This can be done using the nrows= parameter, which accepts an integer value of the number of rows you want to read into your DataFrame. Let’s see how we can read the first five rows of the Excel sheet:
# Reading n Number of Rows of an Excel Sheet
import pandas as pd

df = pd.read_excel(
    io='https://github.com/datagy/mediumdata/raw/master/Sales.xlsx',
    nrows=5)
print(df)

# Returns:
#         Date Customer  Sales
# 0 2022-04-01        A    191
# 1 2022-04-02        B    727
# 2 2022-04-03        A    782
# 3 2022-04-04        B    561
# 4 2022-04-05        A    969
Conclusion
In this tutorial, you learned how to use Python and Pandas to read Excel files into a DataFrame using the .read_excel() function. You learned how to use the function to read an Excel, specify sheet names, read only particular columns, and specify data types. You then learned how skip rows, read only a set number of rows, and read multiple sheets.
Additional Resources
To learn more about related topics, check out the tutorials below:
- Pandas Dataframe to CSV File – Export Using .to_csv()
- Combine Data in Pandas with merge, join, and concat
- Introduction to Pandas for Data Science
- Summarizing and Analyzing a Pandas DataFrame
В Python данные из файла Excel считываются в объект DataFrame. Для этого используется функция read_excel() модуля pandas.
Лист Excel — это двухмерная таблица. Объект DataFrame также представляет собой двухмерную табличную структуру данных.
- Пример использования Pandas read_excel()
- Список заголовков столбцов листа Excel
- Вывод данных столбца
- Пример использования Pandas to Excel: read_excel()
- Чтение файла Excel без строки заголовка
- Лист Excel в Dict, CSV и JSON
- Ресурсы

Предположим, что у нас есть документ Excel, состоящий из двух листов: «Employees» и «Cars». Верхняя строка содержит заголовок таблицы.

Ниже приведен код, который считывает данные листа «Employees» и выводит их.
import pandas

excel_data_df = pandas.read_excel('records.xlsx', sheet_name='Employees')

# print whole sheet data
print(excel_data_df)
Вывод:
   EmpID    EmpName EmpRole
0      1     Pankaj     CEO
1      2  David Lee  Editor
2      3   Lisa Ray  Author
Первый параметр, который принимает функция read_excel ()— это имя файла Excel. Второй параметр (sheet_name) определяет лист для считывания данных.
При выводе содержимого объекта DataFrame мы получаем двухмерные таблицы, схожие по своей структуре со структурой документа Excel.
Чтобы получить список заголовков столбцов таблицы, используется свойство columns объекта Dataframe. Пример реализации:
print(excel_data_df.columns.ravel())
Вывод:
['Pankaj', 'David Lee', 'Lisa Ray']
Мы можем получить данные из столбца и преобразовать их в список значений. Пример:
print(excel_data_df['EmpName'].tolist())
Вывод:
['Pankaj', 'David Lee', 'Lisa Ray']
Можно указать имена столбцов для чтения из файла Excel. Это потребуется, если нужно вывести данные из определенных столбцов таблицы.
import pandas

excel_data_df = pandas.read_excel('records.xlsx', sheet_name='Cars', usecols=['Car Name', 'Car Price'])
print(excel_data_df)
Вывод:
         Car Name      Car Price
0      Honda City     20,000 USD
1  Bugatti Chiron  3 Million USD
2     Ferrari 458   2,30,000 USD
Если в листе Excel нет строки заголовка, нужно передать его значение как None.
excel_data_df = pandas.read_excel('records.xlsx', sheet_name='Numbers', header=None)
Если вы передадите значение заголовка как целое число (например, 3), тогда третья строка станет им. При этом считывание данных начнется со следующей строки. Данные, расположенные перед строкой заголовка, будут отброшены.
Объект DataFrame предоставляет различные методы для преобразования табличных данных в формат Dict , CSV или JSON.
excel_data_df = pandas.read_excel('records.xlsx', sheet_name='Cars', usecols=['Car Name', 'Car Price'])

print('Excel Sheet to Dict:', excel_data_df.to_dict(orient='record'))
print('Excel Sheet to JSON:', excel_data_df.to_json(orient='records'))
print('Excel Sheet to CSV:n', excel_data_df.to_csv(index=False))
Вывод:
Excel Sheet to Dict: [{'Car Name': 'Honda City', 'Car Price': '20,000 USD'}, {'Car Name': 'Bugatti Chiron', 'Car Price': '3 Million USD'}, {'Car Name': 'Ferrari 458', 'Car Price': '2,30,000 USD'}]
Excel Sheet to JSON: [{"Car Name":"Honda City","Car Price":"20,000 USD"},{"Car Name":"Bugatti Chiron","Car Price":"3 Million USD"},{"Car Name":"Ferrari 458","Car Price":"2,30,000 USD"}]
Excel Sheet to CSV:
 Car Name,Car Price
Honda City,"20,000 USD"
Bugatti Chiron,3 Million USD
Ferrari 458,"2,30,000 USD"
- Документы API pandas read_excel()
Дайте знать, что вы думаете по этой теме материала в комментариях. Мы крайне благодарны вам за ваши комментарии, дизлайки, подписки, лайки, отклики!