
Comparing two excel spreadsheets and writing difference to a new excel was always a tedious task and Long Ago, I was doing the same thing and the objective there was to compare the row,column values for both the excel and write the comparison to a new excel files. In those days I have used xlrd module to read and write the comparison result of both the files in an excel file. I can still recall that we have written long lines of code to achieve that.
Recently at work, I encountered the same issue and retrieving my old xlrd script was not an option. So, i thought to give Pandas a try and amazingly I completed comparing the two excel files and writing the results to a new excel file in not more than 10 line of codes. I’m pretty sure that if I spend some more time then I can optimize the code further but this was a quick code that I wrote almost in no time for comparing over 100K records in both the excel file.
Let’s Start
I was comparing two excel files which contains the sales record of all the assets which the company sells to their customers in EU/EMEA/NA/APAC region. The two excel files I’m using is sample records from two Months i.e. Jan and Feb 2019 and contains the same no. of rows and columns
Import
First we need to import the two excel files in two separate dataframes
import pandas as pd

df1=pd.read_excel('Product_Category_Jan.xlsx')
df2=pd.read_excel('Product_Category_Feb.xlsx')
Next Step
Compare the No. of Columns and their types between the two excel files and whether number of rows are equal or not.
First,We will Check whether the two dataframes are equal or not using pandas.dataframe.equals , This function allows two Series or DataFrames to be compared against each other to see if they have the same shape and elements. NaNs in the same location are considered equal. The column headers do not need to have the same type, but the elements within the columns must be the same dtype
This function requires that the elements have the same dtype as their respective elements in the other Series or DataFrame
Basically, it checks for the following three things between two dataframe:
a) They have the same types and values for their elements and column labels
b) They have the same element types and values, but have different types for the column labels
c) They have different types for the same values for their elements
Compare Two Dataframe Values
In the above step we ensure that the shape and type of both the dataframes are equal and now we will compare the values of two dataframes
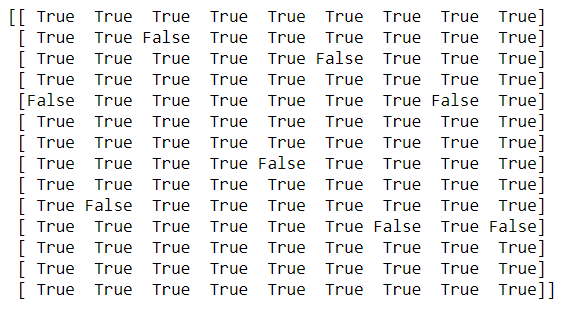
comparison_values = df1.values == df2.values
print (comparison_values)
In just one line we have compared the values of two dataframes and the comparison value for each row and column is shown as True and False values
Index of the Cell with False value
Get the Index of all the cells where the value is False, Which means the value of the cell differ between the two dataframes.
import numpy as np
rows,cols=np.where(comparison_values==False)
Next we will iterate over these cells and update the first dataframe(df1) value to display the changed value in second dataframe(df2)
for item in zip(rows,cols):
    df1.iloc[item[0], item[1]] = '{} --> {}'.format(df1.iloc[item[0], item[1]],df2.iloc[item[0], item[1]])
Export to Excel
Finally we have replaced the old value of dataframe(df1) and entered the new value in the following format:
dfl (Old Value) —-> df2(New Value)
Here is how the updated dataframe(df1) looks like:
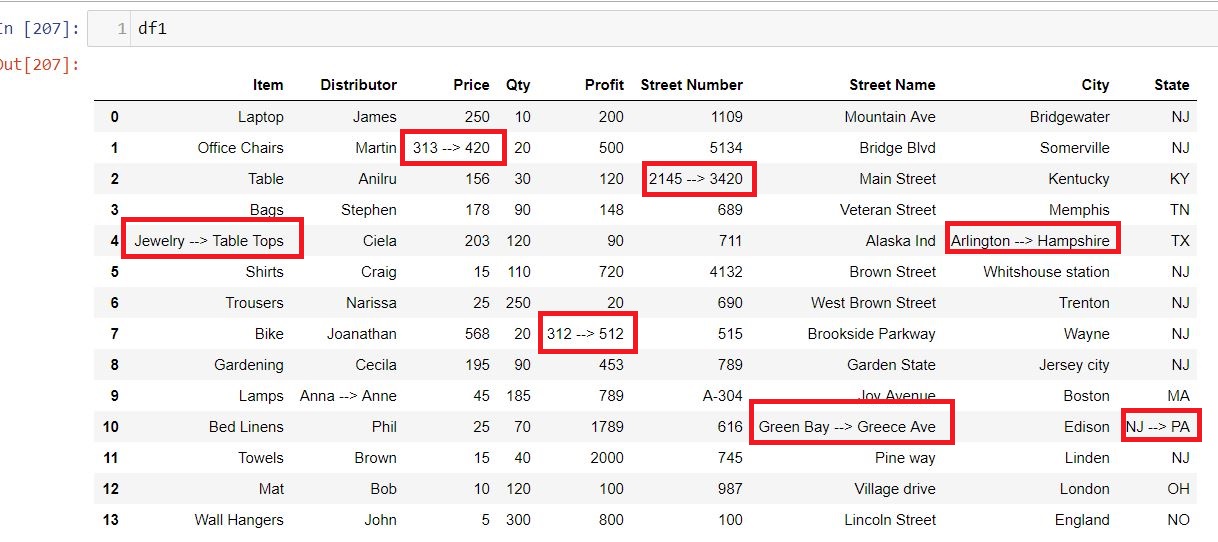
So wherever there was a false value in the Comparison_value ndarray in the above step that has been replaced with the old and new value. Now you can export this dataframe into an excel or csv file and name it as Excel_diff.
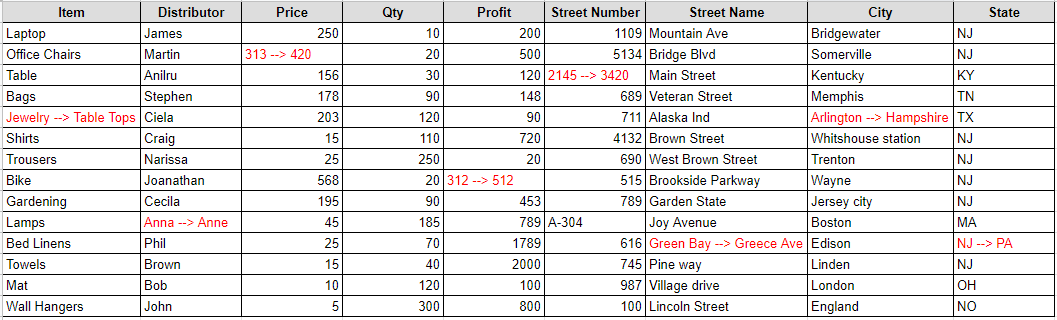
I have set the index parameter as false otherwise the index will also be exported in the xlsx file as the first column and I have set the headers as True so that by default the dataframe headers will be the header in excel file as well.
df1.to_excel('./Excel_diff.xlsx',index=False,header=True)
Conclusion
Now if I compare my yesteryear code with the new and fast Pandas code then it really amuse me that how fast we have progressed and with the advent of modules like Pandas the things have become much simpler. Even you can directly read the records from SQL tables and write to the tables after processing. This new world is progressing at a faster speed and we all are optimistic with every day goes by we are near to see more intelligent and breakthroughs in the Python world.
# Write Python3 code here
# importing Pandas
import pandas as pd
#Reading two Excel Sheets
sheet1 = pd.read_excel(r'Book1.xlsx')
sheet2 = pd.read_excel(r'Book2.xlsx')
# Iterating the Columns Names of both Sheets
for i,j in zip(sheet1,sheet2):
# Creating empty lists to append the columns values
a,b =[],[]
# Iterating the columns values
for m, n in zip(sheet1[i],sheet2[j]):
# Appending values in lists
a.append(m)
b.append(n)
# Sorting the lists
a.sort()
b.sort()
# Iterating the list's values and comparing them
for m, n in zip(range(len(a)), range(len(b))):
if a[m] != b[n]:
print('Column name : '{}' and Row Number : {}'.format(i,m))
Improve Article
Save Article
Like Article
Improve Article
Save Article
Like Article
Given Two Excel Files, We want to compare the values of each column row-wise after sorting the values and print the changed column name and row number and values change.
Input :
Two Excel files

Output :
Column name : 'location' and Row Number : 0
Column name : 'location' and Row Number : 3
Column name : 'date' and Row Number     : 1
Code : Python code for comparing two excel files
import pandas as pd
sheet1 = pd.read_excel(r'Book1.xlsx')
sheet2 = pd.read_excel(r'Book2.xlsx')
for i,j in zip(sheet1,sheet2):
a,b =[],[]
for m, n in zip(sheet1[i],sheet2[j]):
a.append(m)
b.append(n)
a.sort()
b.sort()
for m, n in zip(range(len(a)), range(len(b))):
if a[m] != b[n]:
print('Column name : '{}' and Row Number : {}'.format(i,m))
Like Article
Save Article
It’s handy to be able to quickly find the differences between two Excel files. Below is a quick example of doing so using Python and pandas.
Plenty of others have solved this problem. Here’s a good write-up by pbpython (and the updated version) and a version by yassineAlouini. Wanting a simple tool with a specific output, I opted to write up my own version.
1. Same Shape Files
For this first version, I assume that both files are the same shape (same number of rows and columns) and only data in individual cells may have changed: the goal is to flag changes between two versions of the same file. This is helpful to confirm that nothing unexpected has changed, particularly with a file provided to you by a third party.
Our output will highlight anything that has changed while graying out anything that stayed the same, letting us perform a quick visual inspection. The output will also include the two versions being compared in separate sheets for quick reference.
We’ll use pandas DataFrames for the comparison, so we first import pandas and read the files:
import pandas as pd
df_OLD = pd.read_excel(path_OLD).fillna(0)
df_NEW = pd.read_excel(path_NEW).fillna(0)
Next we create a new DataFrame for the diff and loop through the originals to identify changes:
dfDiff = df_OLD.copy()
for row in range(dfDiff.shape[0]):
    for col in range(dfDiff.shape[1]):
        value_OLD = df_OLD.iloc[row,col]
        try:
            value_NEW = df_NEW.iloc[row,col]
            if value_OLD==value_NEW:
                dfDiff.iloc[row,col] = df_NEW.iloc[row,col]
            else:
                dfDiff.iloc[row,col] = ('{}-->{}').format(value_OLD,value_NEW)
        except:
            dfDiff.iloc[row,col] = ('{}-->{}').format(value_OLD, 'NaN')
Looping through the rows and columns of the DataFrame and accessing values with df.iloc is not the fastest way to perform this operation (see this stackoverflow discussion for some alternatives, including df.apply() and df.iterrows()). It is, however, simple for me to understand and straightforward to implement.
For each cell (looping over rows and columns), we check to see if the values in the two files are the same. If the same, we keep the unchanged value. If different, we show the change from old value to new value using an arrow: →.
Next we want to format the output to highlight changed cells. Since pandas uses XlsxWriter to save files, we can access XlsxWriter’s formatting options.
To start the export, we specify that we are using XlsxWriter and assign the DataFrames to sheets.
writer = pd.ExcelWriter(fname, engine='xlsxwriter')

dfDiff.to_excel(writer, sheet_name='DIFF', index=False)
df_NEW.to_excel(writer, sheet_name=path_NEW.stem, index=False)
df_OLD.to_excel(writer, sheet_name=path_OLD.stem, index=False)
Then we’ll select the DIFF sheet to apply formatting to, and define a grey_fmt for non-changed values, and a highlight_fmt for changed values.
workbook  = writer.book
worksheet = writer.sheets['DIFF']
worksheet.hide_gridlines(2)

# define formats
grey_fmt = workbook.add_format({'font_color': '#E0E0E0'})
highlight_fmt = workbook.add_format({'font_color': '#FF0000', 'bg_color':'#B1B3B3'})
Using XlsxWriter conditional formatting, we can apply the appropriate format to changed and unchanged cells, using the arrow (→) defined previously in the diff.
## highlight changed cells
worksheet.conditional_format('A1:ZZ1000', {'type': 'text',
                                        'criteria': 'containing',
                                        'value':'→',
                                        'format': highlight_fmt})
## highlight unchanged cells
worksheet.conditional_format('A1:ZZ1000', {'type': 'text',
                                        'criteria': 'not containing',
                                        'value':'→',
                                        'format': grey_fmt})
# save
writer.save()
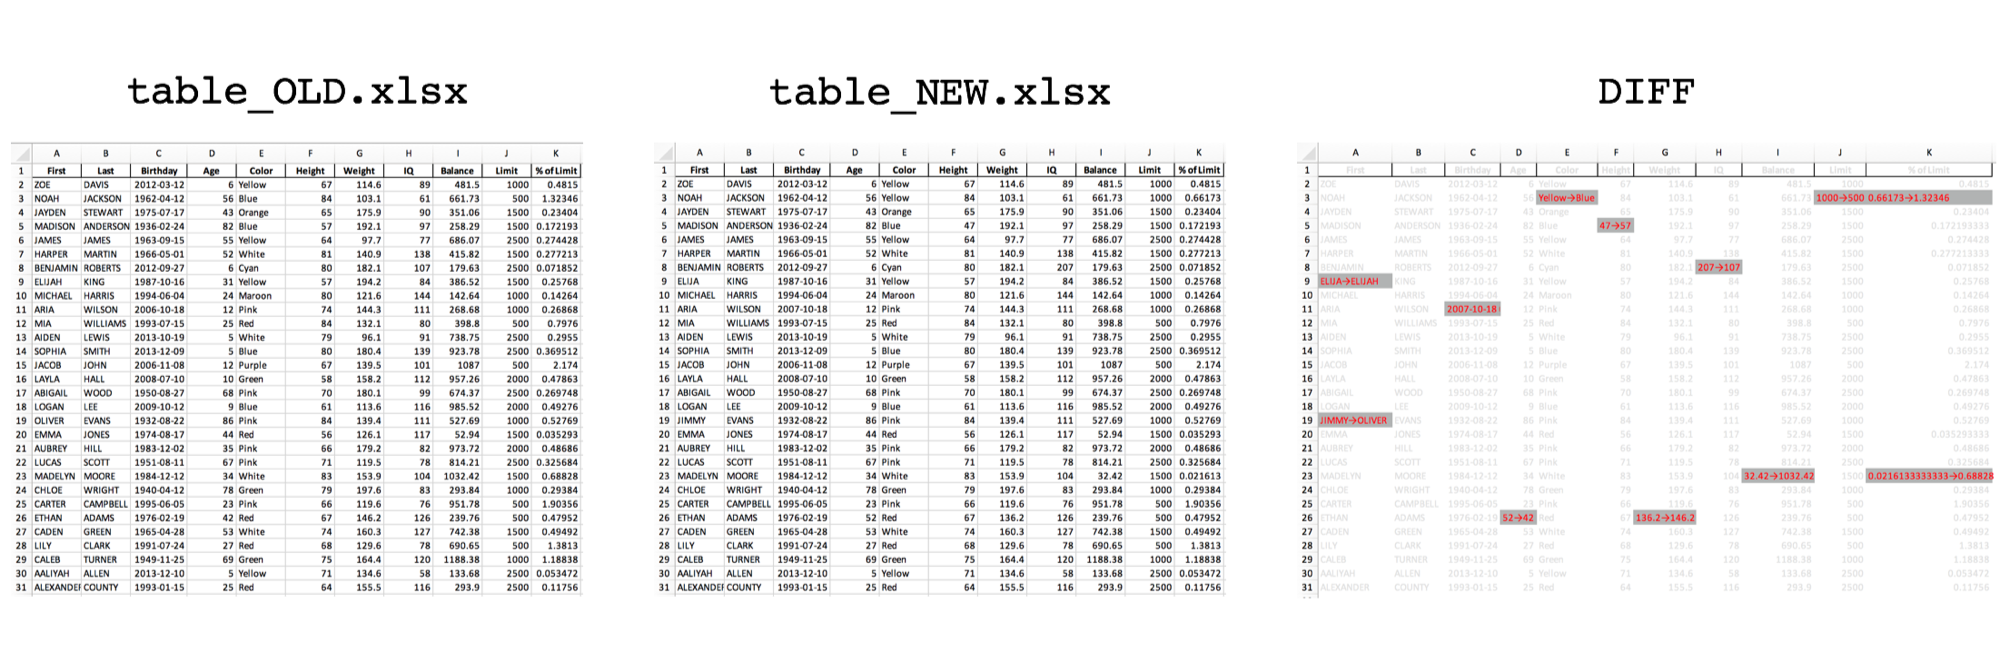
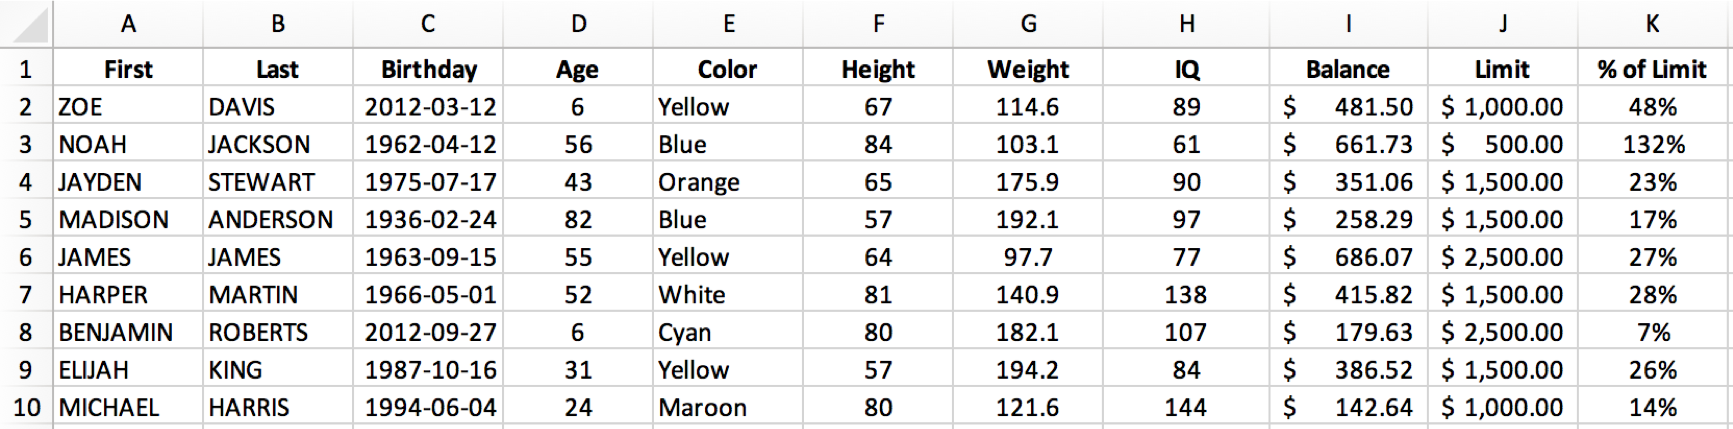
Our starting file, table_OLD.xlsx, includes some dummy data.
For the purposes of testing, we’ll change a few cells in table_NEW.xlsx. Perhaps you can spot them:
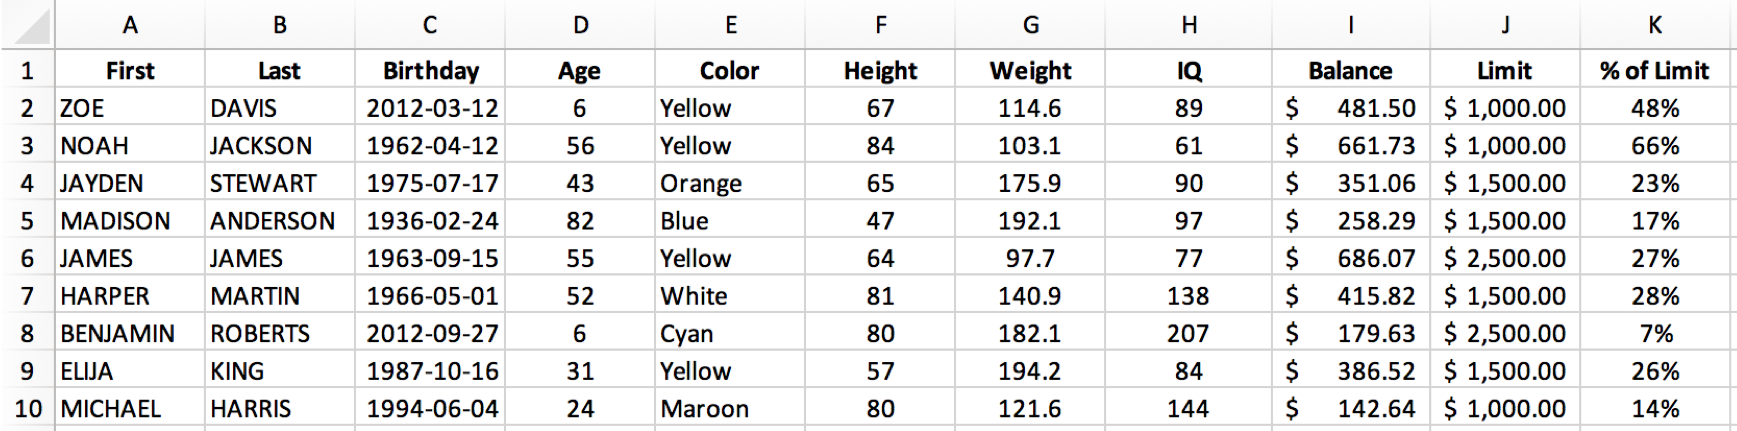
Do you see all 6 cells that changed? If not don’t worry, we’ll run our excel-diff.py script to highlight the changes.
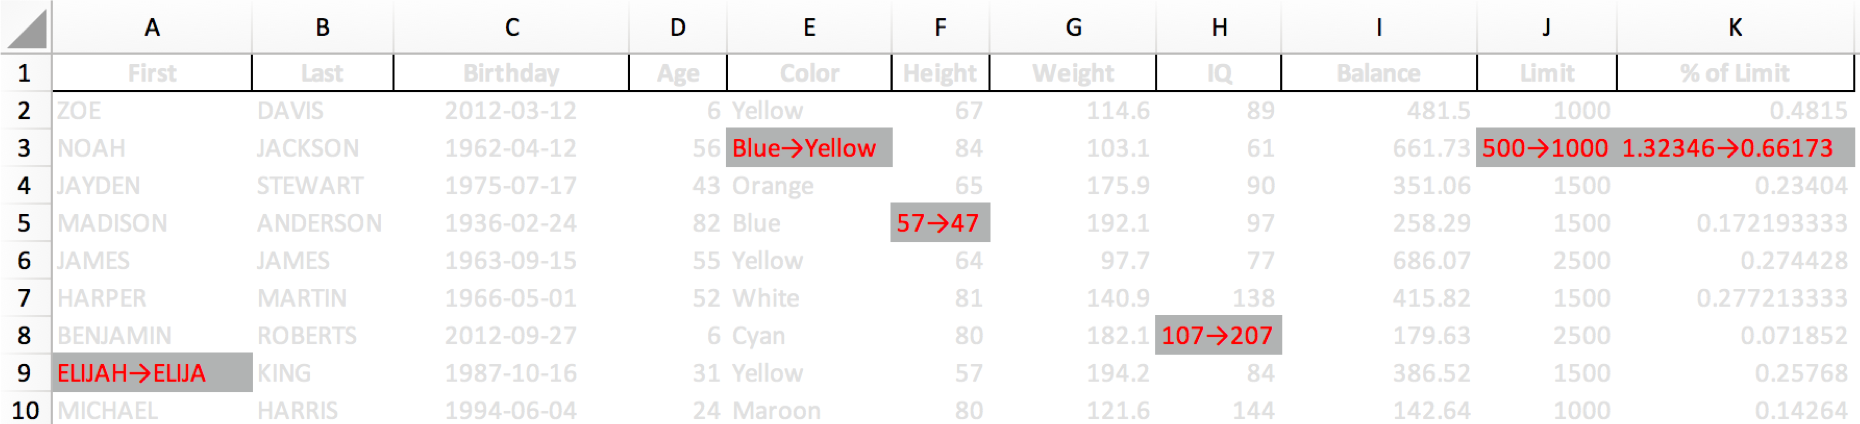
And here you go! Our diff report, table_OLD vs table_NEW.xlsx, quickly highlights what has changed.
Wrapped in some functions, here is the whole script:
Click to expand…
[`excel-diff.py`](https://github.com/mkudija/blog/blob/master/content/downloads/code/excel-diff/excel-diff.py)
import pandas as pd
from pathlib import Path


def excel_diff(path_OLD, path_NEW):

    df_OLD = pd.read_excel(path_OLD).fillna(0)
    df_NEW = pd.read_excel(path_NEW).fillna(0)

    # Perform Diff
    dfDiff = df_OLD.copy()
    for row in range(dfDiff.shape[0]):
        for col in range(dfDiff.shape[1]):
            value_OLD = df_OLD.iloc[row,col]
            try:
                value_NEW = df_NEW.iloc[row,col]
                if value_OLD==value_NEW:
                    dfDiff.iloc[row,col] = df_NEW.iloc[row,col]
                else:
                    dfDiff.iloc[row,col] = ('{}-->{}').format(value_OLD,value_NEW)
            except:
                dfDiff.iloc[row,col] = ('{}-->{}').format(value_OLD, 'NaN')

    # Save output and format
    fname = '{} vs {}.xlsx'.format(path_OLD.stem,path_NEW.stem)
    writer = pd.ExcelWriter(fname, engine='xlsxwriter')

    dfDiff.to_excel(writer, sheet_name='DIFF', index=False)
    df_NEW.to_excel(writer, sheet_name=path_NEW.stem, index=False)
    df_OLD.to_excel(writer, sheet_name=path_OLD.stem, index=False)

    # get xlsxwriter objects
    workbook  = writer.book
    worksheet = writer.sheets['DIFF']
    worksheet.hide_gridlines(2)

    # define formats
    date_fmt = workbook.add_format({'align': 'center', 'num_format': 'yyyy-mm-dd'})
    center_fmt = workbook.add_format({'align': 'center'})
    number_fmt = workbook.add_format({'align': 'center', 'num_format': '#,##0.00'})
    cur_fmt = workbook.add_format({'align': 'center', 'num_format': '$#,##0.00'})
    perc_fmt = workbook.add_format({'align': 'center', 'num_format': '0%'})
    grey_fmt = workbook.add_format({'font_color': '#E0E0E0'})
    highlight_fmt = workbook.add_format({'font_color': '#FF0000', 'bg_color':'#B1B3B3'})

    # set column width and format over columns
    # worksheet.set_column('J:AX', 5, number_fmt)

    # set format over range
    ## highlight changed cells
    worksheet.conditional_format('A1:ZZ1000', {'type': 'text',
                                            'criteria': 'containing',
                                            'value':'→',
                                            'format': highlight_fmt})
    ## highlight unchanged cells
    worksheet.conditional_format('A1:ZZ1000', {'type': 'text',
                                            'criteria': 'not containing',
                                            'value':'→',
                                            'format': grey_fmt})

    # save
    writer.save()
    print('Done.')


def main():
    path_OLD = Path('table_OLD.xlsx')
    path_NEW = Path('table_NEW.xlsx')

    excel_diff(path_OLD, path_NEW)


if __name__ == '__main__':
    main()
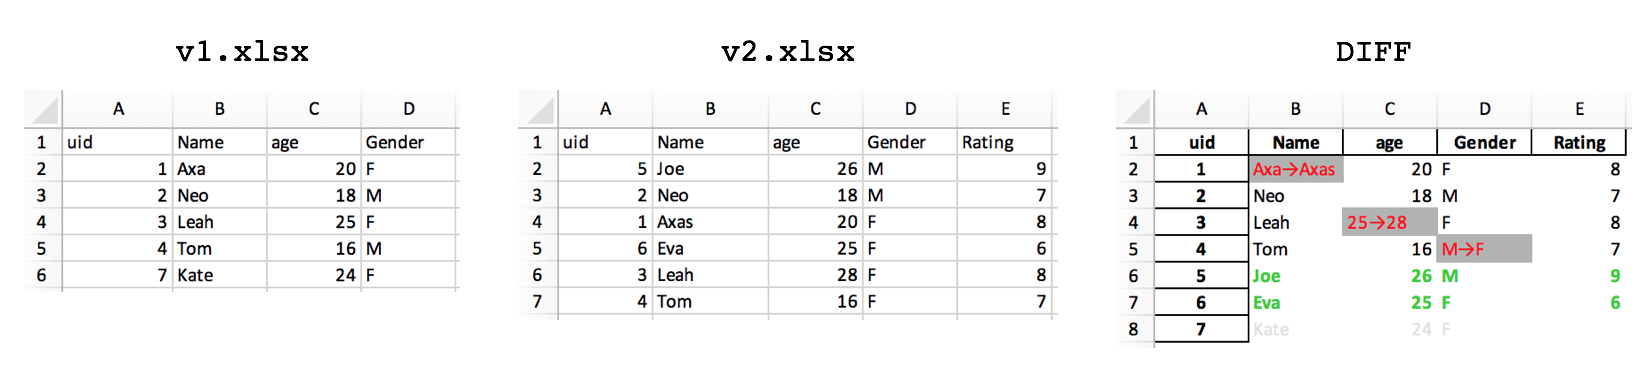
2. Updated Rows & Columns
Updated 2019-03-28
Suppose the rows may have been added or deleted in addition to single values changed. This updated excel-diff-2.py will highlight changes in red, new rows in green, and dropped rows in grey. Note that this chooses the first column in your data as the index_col for the purposes of determining row changes. Here’s the full script:
Click to expand…
[`excel-diff-2.py`](https://github.com/mkudija/blog/blob/master/content/downloads/code/excel-diff/excel-diff-2.py)
import pandas as pd
from pathlib import Path


def excel_diff(path_OLD, path_NEW, index_col):

    df_OLD = pd.read_excel(path_OLD, index_col=index_col).fillna(0)
    df_NEW = pd.read_excel(path_NEW, index_col=index_col).fillna(0)

    # Perform Diff
    dfDiff = df_NEW.copy()
    droppedRows = []
    newRows = []

    cols_OLD = df_OLD.columns
    cols_NEW = df_NEW.columns
    sharedCols = list(set(cols_OLD).intersection(cols_NEW))

    for row in dfDiff.index:
        if (row in df_OLD.index) and (row in df_NEW.index):
            for col in sharedCols:
                value_OLD = df_OLD.loc[row,col]
                value_NEW = df_NEW.loc[row,col]
                if value_OLD==value_NEW:
                    dfDiff.loc[row,col] = df_NEW.loc[row,col]
                else:
                    dfDiff.loc[row,col] = ('{}→{}').format(value_OLD,value_NEW)
        else:
            newRows.append(row)

    for row in df_OLD.index:
        if row not in df_NEW.index:
            droppedRows.append(row)
            dfDiff = dfDiff.append(df_OLD.loc[row,:])

    dfDiff = dfDiff.sort_index().fillna('')
    print(dfDiff)
    print('nNew Rows:     {}'.format(newRows))
    print('Dropped Rows: {}'.format(droppedRows))

    # Save output and format
    fname = '{} vs {}.xlsx'.format(path_OLD.stem,path_NEW.stem)
    writer = pd.ExcelWriter(fname, engine='xlsxwriter')

    dfDiff.to_excel(writer, sheet_name='DIFF', index=True)
    df_NEW.to_excel(writer, sheet_name=path_NEW.stem, index=True)
    df_OLD.to_excel(writer, sheet_name=path_OLD.stem, index=True)

    # get xlsxwriter objects
    workbook  = writer.book
    worksheet = writer.sheets['DIFF']
    worksheet.hide_gridlines(2)
    worksheet.set_default_row(15)

    # define formats
    date_fmt = workbook.add_format({'align': 'center', 'num_format': 'yyyy-mm-dd'})
    center_fmt = workbook.add_format({'align': 'center'})
    number_fmt = workbook.add_format({'align': 'center', 'num_format': '#,##0.00'})
    cur_fmt = workbook.add_format({'align': 'center', 'num_format': '$#,##0.00'})
    perc_fmt = workbook.add_format({'align': 'center', 'num_format': '0%'})
    grey_fmt = workbook.add_format({'font_color': '#E0E0E0'})
    highlight_fmt = workbook.add_format({'font_color': '#FF0000', 'bg_color':'#B1B3B3'})
    new_fmt = workbook.add_format({'font_color': '#32CD32','bold':True})

    # set format over range
    ## highlight changed cells
    worksheet.conditional_format('A1:ZZ1000', {'type': 'text',
                                            'criteria': 'containing',
                                            'value':'→',
                                            'format': highlight_fmt})

    # highlight new/changed rows
    for row in range(dfDiff.shape[0]):
        if row+1 in newRows:
            worksheet.set_row(row+1, 15, new_fmt)
        if row+1 in droppedRows:
            worksheet.set_row(row+1, 15, grey_fmt)

    # save
    writer.save()
    print('nDone.n')


def main():
    path_OLD = Path('v1.xlsx')
    path_NEW = Path('v2.xlsx')

    # get index col from data
    df = pd.read_excel(path_NEW)
    index_col = df.columns[0]
    print('nIndex column: {}n'.format(index_col))

    excel_diff(path_OLD, path_NEW, index_col)


if __name__ == '__main__':
    main()
Closing Thoughts
This is a simple way to view the difference between two Excel files, but easily modified to fit a particular dataset or use case. Since we’re using pandas DataFrames, the original data could be csv files or a database table or any other format pandas can read from. We could also reformat the output to show only changes, or present the data differently, or specify data types by column, for instance.
- All names in this dataset are fake. Any resemblance to real persons, living or dead, is purely coincidental.
- You can view the original code and files.
Library versions:
pandas      0.23.4
Python      3.6.3