
Решим достаточно тривиальную задачу с помощью языка python — сравним две таблицы excel и выведем результат в третью. Что может быть проще, и почему просто не использовать средства самой программы, входящей в пакет office? Попробуем разобраться.
Дано
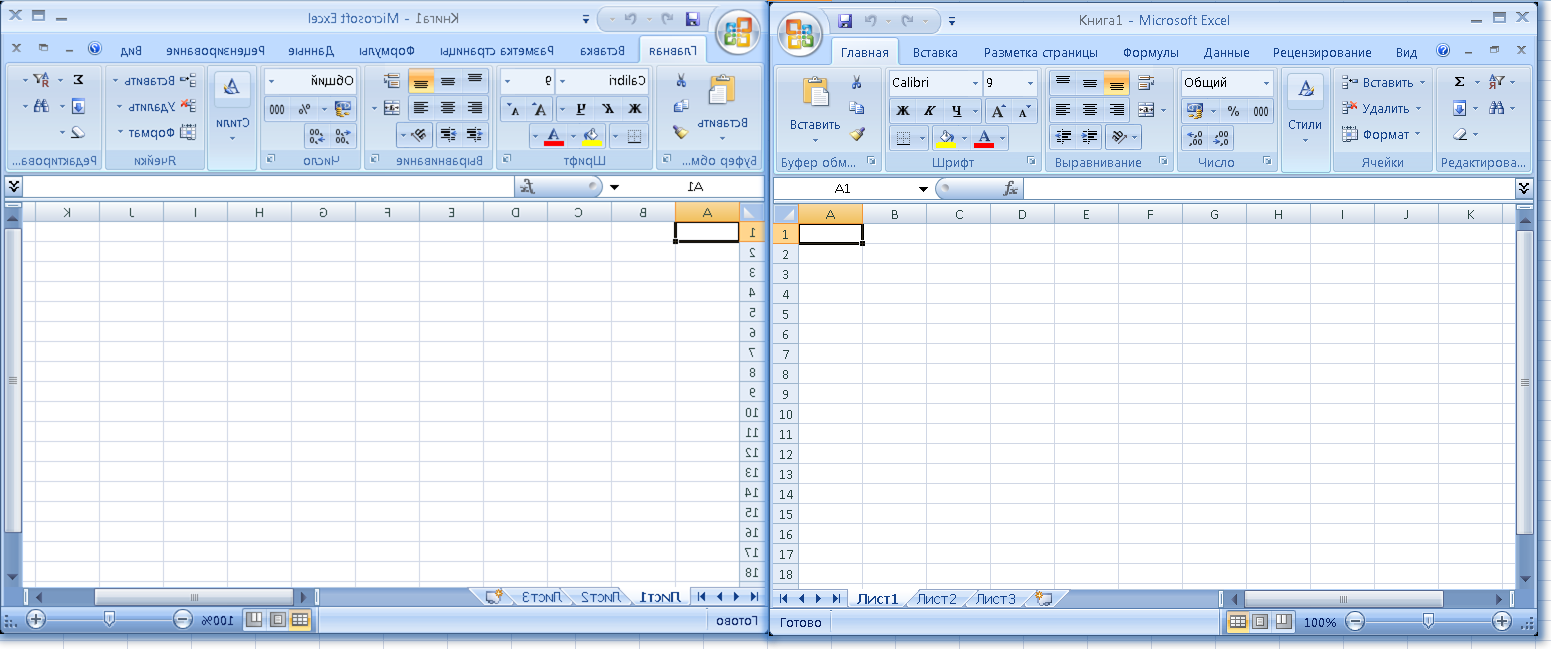
У нас есть две таблицы с условными названиями «Прайс1» и «Прайс2».


Обе имеют расширение .xlsx и открываются программой excel без каких-либо дополнительных действий. Но есть проблема — таблицы доступны в формате read-only дабы никто кроме владельца не мог изменить данные. Поэтому, для того, чтобы начать применять какие-либо формулы в самих таблицах необходимо таблицы продублировать, сохранив их дубликаты.
Вторая проблема — позиции товаров перемешаны, идут не в алфавитном порядке и вообще могут иметь разное количество позиций наименований.
И проблема третья — столбец с количеством товара не обязательно следует за столбцом с наименованиями товаров.
Как сравнить данные таблицы с наименьшими трудозатратами и сделать, так чтобы это сравнение легко адаптировалось под иные вводные?
Какие предложения от excel ?
Как правило, в задачах подобного рода применяется функция ВПР.
Например формула может выглядеть следующим образом:
=ЕСЛИОШИБКА(ВПР(F4;$B$3:$C$5;2;0);0)Логика следующая: берем позицию в Прайсе2 и ищем ее по Прайсу1, выводя значение.
Однако, этот вариант работает не для всех случаев: если в Прайсе2 нет позиции, которая была в Прайсе1, формула не работает — 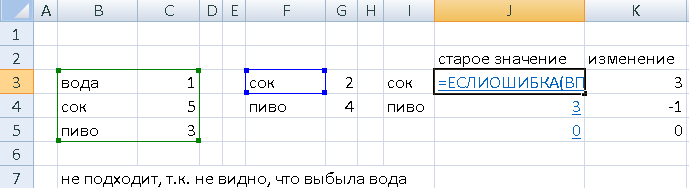
Формула посложней
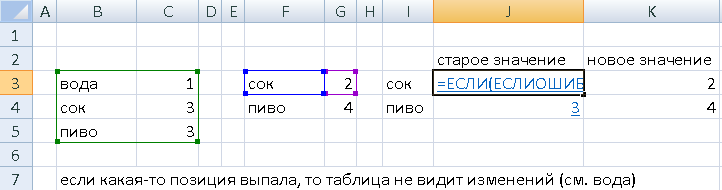
Она повторяет предыдущую, но уже учитывает значение (количество товара) при поиске.
=ЕСЛИ(ЕСЛИОШИБКА(ВПР(F3;$B$3:$C$5;2;0);0)=G3;"";ЕСЛИОШИБКА(ВПР(F3;$B$3:$C$5;2;0);0))Но она также бесполезна, если позиция выбыла в Прайсе2:
И третий вариант формулы
Для небольшого удобства прайсы разнесены по разным листам одной таблицы, а сама итоговая таблица на третьем листе.
Для ячеек в столбце с Прайсом1 формула примет вид:
=ЕСЛИ(ЕНД(ВПР(A2;'D:UsersalDesktop[Прайс1.xlsx]Лист1'!$B$3:$B$5;1;0));"Нет";ВПР(A2;'D:UsersalDesktop[Прайс1.xlsx]Лист1'!$B$3:$C$5;2;0))Для ячеек в столбце с Прайсом2:
=ЕСЛИ(ЕНД(ВПР(A2;'D:UsersalDesktop[Прайс2.xlsx]Лист1'!$B$3:$B$5;1;0));"Нет";ВПР(A2;'D:UsersalDesktop[Прайс2.xlsx]Лист1'!$B$3:$C$5;2;0))Выглядит это следующим образом:

Здесь видно, что формула учитывает моменты, если в Прайсах пропадают или появляются позиции. В таблице они обозначены словом «Нет».
Формула работает. Но, помимо ужасающих размеров, она имеет одно «но», точнее два «но».
Чтобы все работало корректно, необходимо:
- правильно указать диапазоны из Прайсов (выделить их в Прайсах Ctrl+Shift+Enter и перенести в формулу);
- позиции товаров в финальной таблице должны идти с учетом всех выбывших и/или прибывших позиций в обоих Прайсах. Сама формула не будет искать эти позиции в Прайсах и в вставлять в итоговую. Она просто берет наименование в итоговой таблице и ищет его в Прайсах, записывая количество товара и/или его отсутствие.
Неудобно.
Посмотрим, что предлагает python.
Python в деле
Решение №1
Можно пойти через использование библиотеки openpyxl и тогда решение будет выглядеть примерно так.
*Код написан не для прайсов, но для вычисления прямого и косвенного владения в компаниях, но логика та же.
текст программы
import openpyxl,pprint
from openpyxl.utils import get_column_letter,column_index_from_string
wb = openpyxl.load_workbook('Прайс1.xlsx')
sheet=wb.get_active_sheet()
wb2 = openpyxl.load_workbook('Прайс2.xlsx')
sheet2=wb2.get_active_sheet()
h = open('struct.txt','a')
test={}
test2={}
test3=[]
poisk=str(input('компания: '))
#test - словарь из "кто владеет:номер строки)
for row in sheet['A2':'A290']:
    for cellObj in row:
          i = cellObj.value
          b = cellObj.row
          test.setdefault(i,b)
#test2 - словарь из "кем владеют:номер столбца)
for row in sheet['B1':'HH']:
    for cellObj in row:
          i = cellObj.value
          b = cellObj.column
          c = column_index_from_string(b) #переводим названия столбцов excel в цифры
          test2.setdefault(i,c)
print('n'+'прямое владение')
# прямое владение
for row1 in sheet['B2':'HH290']:
    for cellObj in row1:
        if cellObj.value ==None: #пропускаем пустые значения в клетках
            continue
        i = float (cellObj.value)/100 #A в B
        s =sheet.cell(row=cellObj.row,column=1).value
        if s!=poisk:
            continue
        d=sheet.cell(row=1,column=column_index_from_string(cellObj.column)).value #B (кем владеют)
        for k,v in test.items():
                for u in range (2,217): # все значения- B2:F6
                    if sheet.cell(row=v, column=u).value ==None:
                        continue
                    b = sheet.cell(row=v, column=u).value  # % владения
                    q=float('{:.5f}'.format(i*100))
                    y=sheet.cell(row=1,column=u).value    #кем владеют
                    p=s+' владеет '+ d +' - '+str(q)+'%'
                    if p not in test3:
                       test3.append(p)
                       print(p)
                       h.write(p+'n')

print('n'+'1-е косвенное участие')
# 1-е косвенное участие
for row1 in sheet['B2':'HH290']:
    for cellObj in row1:
        if cellObj.value ==None: #пропускаем пустые значения в клетках
            continue
        i = float (cellObj.value)/100 #A в B
        s =sheet.cell(row=cellObj.row,column=1).value
        if s!=poisk:
            continue
        d=sheet.cell(row=1,column=column_index_from_string(cellObj.column)).value #B (кем владеют)
        for k,v in test.items():
            if d in k:      # если кем владеют, есть в кто владеет - то ищем по строке значение
                for u in range (2,217): # все значения
                    if sheet.cell(row=v, column=u).value ==None:
                        continue
                    b = sheet.cell(row=v, column=u).value  # % владения
                    q=float(i)*float(b) #процент косвенного владения A через B в С
                    q1=float('{:.5f}'.format(q)) #5 знаков после запятой и * 100
                    y=sheet.cell(row=1,column=u).value    #кем владеют
                    print (' через '+ d + ' в ' + y +' - '+str(q1)+'%')
                    h.write(s+' через '+ d + ' владеет ' + y +' - '+str(q1)+'%'+'n')
h.write('n')
Программа собирает все наименования и количество товара по ячейкам в обоих Прайсах, далее заполняет итоговую таблицу excel наименованиями и, найдя по координатам, количество товара — также и значениями количества товара.
Работает. Но громоздко и легко запутаться.
Решение №2
Воспользуемся возможностями библиотеки pandas, если она не установлена, то pip install pandas.
Импортируем библиотеку и считаем Прайсы в датафреймы(наборы данных):
import pandas as pd
df1 = pd.read_excel('Прайс1-.xlsx', sheet_name = 'Лист1')
df2 = pd.read_excel('Прайс2-.xlsx', sheet_name = 'Лист1')
Произведем слияние датафреймов, чтобы охватить случаи, когда товары исчезают/появляются как в первом Прайсе, так и во втором:
m = (df1.merge(df2, how='outer', on=['товар','Количество'],
              suffixes=['', '_new'], indicator=True))
m2 = (df2.merge(df1, how='outer', on=['товар','Количество'],
              suffixes=['', '_new'], indicator=True))
Создадим третий датафрейм из запросов к двум предыдущим и уберем оттуда дубликаты:
m3=pd.merge(m.query("_merge=='right_only'"), m2.query("_merge=='right_only'"), how ='outer').drop_duplicates(subset=['товар','Количество'])
Осталось сохранить новую таблицу:
m3.query("_merge=='right_only'").to_excel('out.xlsx')
На выходе мы получаем итоговую таблицу:
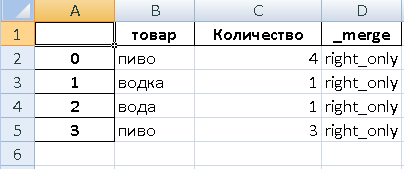
Как видно, в нее не попала позиция «сок», так как в этой позиции не произошло изменений.
Обозначены позиции «пиво» со старым и новым значениями, а также учтены позиции, которые «добавились» и «пропали» в Прайсах.
Какое из решений использовать — дело вкуса.
Однако данный вариант имеет преимущества:
- не требует перевода таблиц из «read-only»;
- нет необходимости вручную выправлять формулы по столбцам и сами таблицы.
Код и примеры таблиц можно скачать — здесь.
Надеюсь, решения, приведенные в статье, окажутся полезными.
Comparing two excel spreadsheets and writing difference to a new excel was always a tedious task and Long Ago, I was doing the same thing and the objective there was to compare the row,column values for both the excel and write the comparison to a new excel files. In those days I have used xlrd module to read and write the comparison result of both the files in an excel file. I can still recall that we have written long lines of code to achieve that.
Recently at work, I encountered the same issue and retrieving my old xlrd script was not an option. So, i thought to give Pandas a try and amazingly I completed comparing the two excel files and writing the results to a new excel file in not more than 10 line of codes. I’m pretty sure that if I spend some more time then I can optimize the code further but this was a quick code that I wrote almost in no time for comparing over 100K records in both the excel file.
Let’s Start
I was comparing two excel files which contains the sales record of all the assets which the company sells to their customers in EU/EMEA/NA/APAC region. The two excel files I’m using is sample records from two Months i.e. Jan and Feb 2019 and contains the same no. of rows and columns
Import
First we need to import the two excel files in two separate dataframes
import pandas as pd

df1=pd.read_excel('Product_Category_Jan.xlsx')
df2=pd.read_excel('Product_Category_Feb.xlsx')
Next Step
Compare the No. of Columns and their types between the two excel files and whether number of rows are equal or not.
First,We will Check whether the two dataframes are equal or not using pandas.dataframe.equals , This function allows two Series or DataFrames to be compared against each other to see if they have the same shape and elements. NaNs in the same location are considered equal. The column headers do not need to have the same type, but the elements within the columns must be the same dtype
This function requires that the elements have the same dtype as their respective elements in the other Series or DataFrame
Basically, it checks for the following three things between two dataframe:
a) They have the same types and values for their elements and column labels
b) They have the same element types and values, but have different types for the column labels
c) They have different types for the same values for their elements
Compare Two Dataframe Values
In the above step we ensure that the shape and type of both the dataframes are equal and now we will compare the values of two dataframes
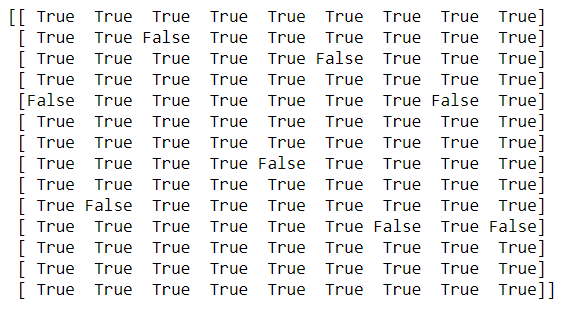
comparison_values = df1.values == df2.values
print (comparison_values)
In just one line we have compared the values of two dataframes and the comparison value for each row and column is shown as True and False values
Index of the Cell with False value
Get the Index of all the cells where the value is False, Which means the value of the cell differ between the two dataframes.
import numpy as np
rows,cols=np.where(comparison_values==False)
Next we will iterate over these cells and update the first dataframe(df1) value to display the changed value in second dataframe(df2)
for item in zip(rows,cols):
    df1.iloc[item[0], item[1]] = '{} --> {}'.format(df1.iloc[item[0], item[1]],df2.iloc[item[0], item[1]])
Export to Excel
Finally we have replaced the old value of dataframe(df1) and entered the new value in the following format:
dfl (Old Value) —-> df2(New Value)
Here is how the updated dataframe(df1) looks like:
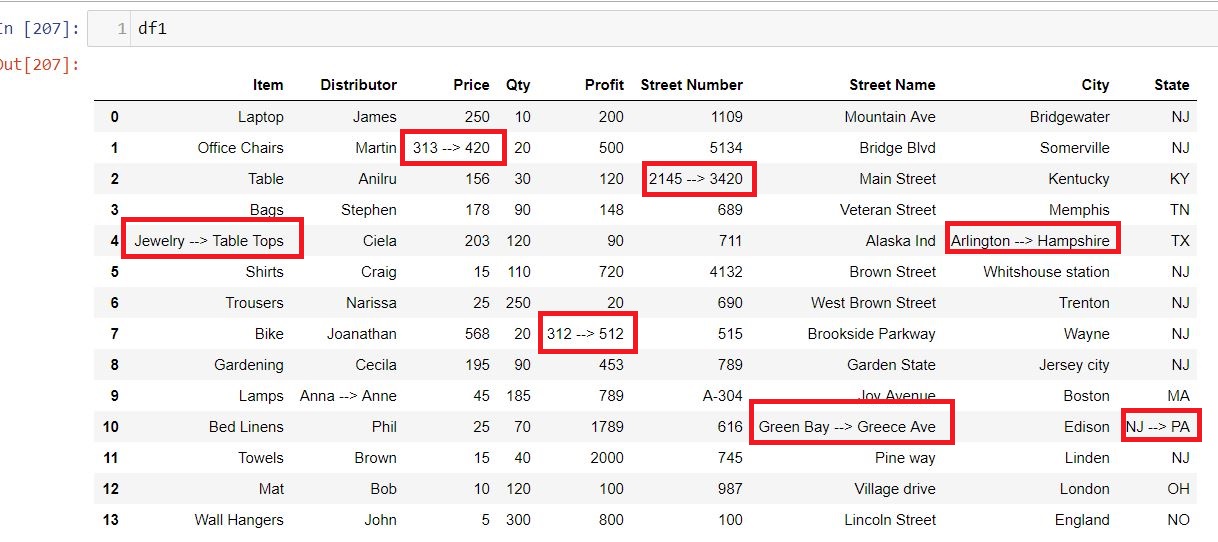
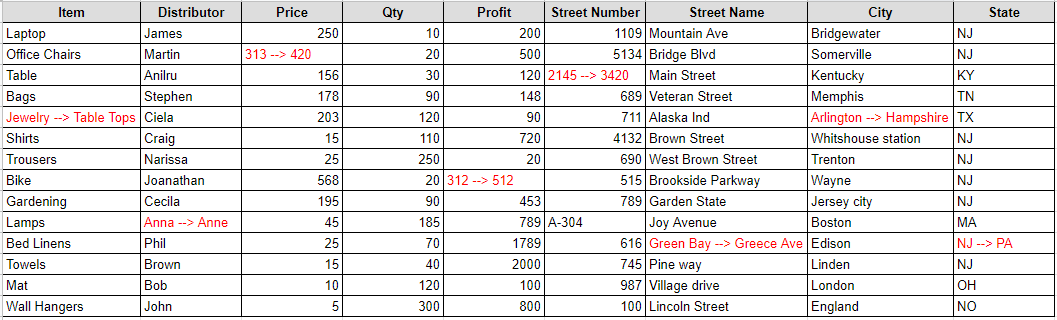
So wherever there was a false value in the Comparison_value ndarray in the above step that has been replaced with the old and new value. Now you can export this dataframe into an excel or csv file and name it as Excel_diff.
I have set the index parameter as false otherwise the index will also be exported in the xlsx file as the first column and I have set the headers as True so that by default the dataframe headers will be the header in excel file as well.
df1.to_excel('./Excel_diff.xlsx',index=False,header=True)
Conclusion
Now if I compare my yesteryear code with the new and fast Pandas code then it really amuse me that how fast we have progressed and with the advent of modules like Pandas the things have become much simpler. Even you can directly read the records from SQL tables and write to the tables after processing. This new world is progressing at a faster speed and we all are optimistic with every day goes by we are near to see more intelligent and breakthroughs in the Python world.
# Write Python3 code here
# importing Pandas
import pandas as pd
#Reading two Excel Sheets
sheet1 = pd.read_excel(r'Book1.xlsx')
sheet2 = pd.read_excel(r'Book2.xlsx')
# Iterating the Columns Names of both Sheets
for i,j in zip(sheet1,sheet2):
# Creating empty lists to append the columns values
a,b =[],[]
# Iterating the columns values
for m, n in zip(sheet1[i],sheet2[j]):
# Appending values in lists
a.append(m)
b.append(n)
# Sorting the lists
a.sort()
b.sort()
# Iterating the list's values and comparing them
for m, n in zip(range(len(a)), range(len(b))):
if a[m] != b[n]:
print('Column name : '{}' and Row Number : {}'.format(i,m))
Так как часто есть две таблицы, которые необходимо сравнивать во время работы, и перечислено различное содержимое, процедура сравнения выполняется следующим образом:
import pandas as pd

# Прочитать 2 таблицы для сравнения
df1 = pd.read_excel('Данные для сравнения.xlsx', sheet_name="Данные 1")
df2 = pd.read_excel('Данные для сравнения.xlsx', sheet_name="Данные 2")

# Получить все данные и удалить повторяющиеся значения, чтобы получить все идентификаторы
df = df1.append(df2)
cols_value = df.id.values  # Получить массив столбцов 'id'
cols_value = list(set(cols_value))
cols_value.remove(df1.iat[0, 0])  # Удалить заголовок

# Инициализируем res, добавляем заголовок первой строки таблицы 1 в res
row = list(df1.values[0])
columns = ['id', 'data1', 'data2', 'data3', 'data4', 'data5', 'data6', 'data7', 'data8', 'data9', 'data10']
res = pd.DataFrame([row], columns=columns)

# Сравните таблицу 1 и таблицу 2 и сохраните разные массивы в res
for i in cols_value:
    # print(i)
    row1 = df1[df1.id == i]
    row2 = df2[df2.id == i]
    if row1.empty:  # Определить, является ли он нулевым
        res = res.append({'table': 'Таблица 1', 'id': i}, ignore_index=True)
        row2['table'] = 'Таблица 2'
        res = res.append(row2)
    else:
        if row2.empty:  # Определить, равно ли оно нулю
            row1['table'] = 'Таблица 1'
            res = res.append(row1)
            # res.loc ['id' == i, 'table'] = 'table 1'
            res = res.append({'table': 'Таблица 2', 'id': i}, ignore_index=True)
        else:
            temp = row1.append(row2)
            temp.drop_duplicates(inplace=True)
            if temp.shape[0] == 1:
                pass
            else:
                row1['table'] = 'Таблица 1'
                res = res.append(row1)
                row2['table'] = 'Таблица 2'
                res = res.append(row2)
order = ['table', 'id', 'data1', 'data2', 'data3', 'data4', 'data5', 'data6', 'data7', 'data8', 'data9', 'data10']
res = res[order]
print(res)
res.to_excel('Comparison result.xlsx', sheet_name='Результат сравнения')
res.save()
print('done')
При использовании создать в каталоге того же уровняДанные для сравнения. Xlsx Файл, создать 2 таблицы, имя таблицыДанные 1 с Данные 2, И писать[id, data1, data2, data3, data4, data5, data6, data7, data8, data9, data10] Как показано ниже:

Примечание. Первый столбец должен заполнять главное здание, и порядок двух сравниваемых данных должен быть одинаковым.
После окончательного запуска кода сгенерируйте его в том же каталоге.Результат сравнения.xlsx Если вы откроете файл, вы увидите результат, как показано на рисунке ниже (в таблице 2 отсутствует строка с id = 8, поэтому результат показывает нулевое значение):

Несмотря на то, что работающий код может обрабатываться в обычном режиме, о некоторых ошибках все равно будет сообщаться. Пожалуйста, дайте мне предложения, спасибо.
Improve Article
Save Article
Like Article
Improve Article
Save Article
Like Article
Given Two Excel Files, We want to compare the values of each column row-wise after sorting the values and print the changed column name and row number and values change.
Input :
Two Excel files

Output :
Column name : 'location' and Row Number : 0
Column name : 'location' and Row Number : 3
Column name : 'date' and Row Number     : 1
Code : Python code for comparing two excel files
import pandas as pd
sheet1 = pd.read_excel(r'Book1.xlsx')
sheet2 = pd.read_excel(r'Book2.xlsx')
for i,j in zip(sheet1,sheet2):
a,b =[],[]
for m, n in zip(sheet1[i],sheet2[j]):
a.append(m)
b.append(n)
a.sort()
b.sort()
for m, n in zip(range(len(a)), range(len(b))):
if a[m] != b[n]:
print('Column name : '{}' and Row Number : {}'.format(i,m))
Like Article
Save Article