Pandas можно использовать для чтения и записи файлов Excel с помощью Python. Это работает по аналогии с другими форматами. В этом материале рассмотрим, как это делается с помощью DataFrame.
Помимо чтения и записи рассмотрим, как записывать несколько DataFrame в Excel-файл, как считывать определенные строки и колонки из таблицы и как задавать имена для одной или нескольких таблиц в файле.
Установка Pandas
Для начала Pandas нужно установить. Проще всего это сделать с помощью pip.
Если у вас Windows, Linux или macOS:
pip install pandas # или pip3В процессе можно столкнуться с ошибками ModuleNotFoundError или ImportError при попытке запустить этот код. Например:
ModuleNotFoundError: No module named 'openpyxl'В таком случае нужно установить недостающие модули:
pip install openpyxl xlsxwriter xlrd # или pip3Будем хранить информацию, которую нужно записать в файл Excel, в DataFrame. А с помощью встроенной функции to_excel() ее можно будет записать в Excel.
Сначала импортируем модуль pandas. Потом используем словарь для заполнения DataFrame:
import pandas as pd

df = pd.DataFrame({'Name': ['Manchester City', 'Real Madrid', 'Liverpool',

                            'FC Bayern München', 'FC Barcelona', 'Juventus'],

                   'League': ['English Premier League (1)', 'Spain Primera Division (1)',

                              'English Premier League (1)', 'German 1. Bundesliga (1)',

                              'Spain Primera Division (1)', 'Italian Serie A (1)'],

                   'TransferBudget': [176000000, 188500000, 90000000,

                                      100000000, 180500000, 105000000]})
Ключи в словаре — это названия колонок. А значения станут строками с информацией.
Теперь можно использовать функцию to_excel() для записи содержимого в файл. Единственный аргумент — это путь к файлу:
df.to_excel('./teams.xlsx')
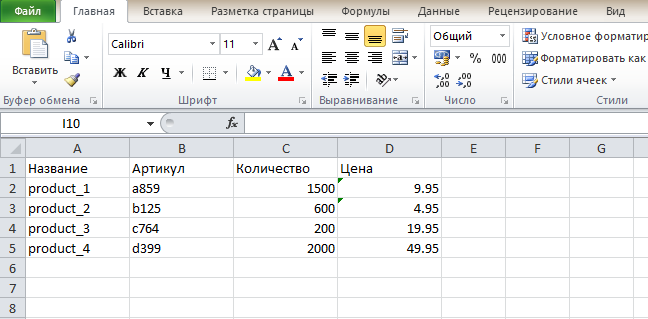
А вот и созданный файл Excel:

Стоит обратить внимание на то, что в этом примере не использовались параметры. Таким образом название листа в файле останется по умолчанию — «Sheet1». В файле может быть и дополнительная колонка с числами. Эти числа представляют собой индексы, которые взяты напрямую из DataFrame.
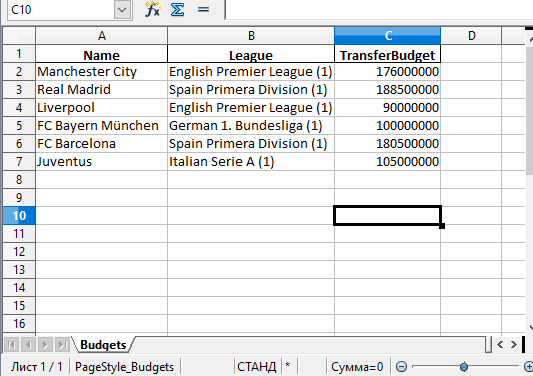
Поменять название листа можно, добавив параметр sheet_name в вызов to_excel():
df.to_excel('./teams.xlsx', sheet_name='Budgets', index=False)
Также можно добавили параметр index со значением False, чтобы избавиться от колонки с индексами. Теперь файл Excel будет выглядеть следующим образом:
Запись нескольких DataFrame в файл Excel
Также есть возможность записать несколько DataFrame в файл Excel. Для этого можно указать отдельный лист для каждого объекта:
salaries1 = pd.DataFrame({'Name': ['L. Messi', 'Cristiano Ronaldo', 'J. Oblak'],

                                        'Salary': [560000, 220000, 125000]})

salaries2 = pd.DataFrame({'Name': ['K. De Bruyne', 'Neymar Jr', 'R. Lewandowski'],

                                        'Salary': [370000, 270000, 240000]})

salaries3 = pd.DataFrame({'Name': ['Alisson', 'M. ter Stegen', 'M. Salah'],

                                        'Salary': [160000, 260000, 250000]})

salary_sheets = {'Group1': salaries1, 'Group2': salaries2, 'Group3': salaries3}

writer = pd.ExcelWriter('./salaries.xlsx', engine='xlsxwriter')

for sheet_name in salary_sheets.keys():

    salary_sheets[sheet_name].to_excel(writer, sheet_name=sheet_name, index=False)

writer.save()
Здесь создаются 3 разных DataFrame с разными названиями, которые включают имена сотрудников, а также размер их зарплаты. Каждый объект заполняется соответствующим словарем.
Объединим все три в переменной salary_sheets, где каждый ключ будет названием листа, а значение — объектом DataFrame.
Дальше используем движок xlsxwriter для создания объекта writer. Он и передается функции to_excel().
Перед записью пройдемся по ключам salary_sheets и для каждого ключа запишем содержимое в лист с соответствующим именем. Вот сгенерированный файл:
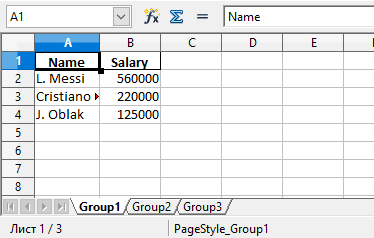
Можно увидеть, что в этом файле Excel есть три листа: Group1, Group2 и Group3. Каждый из этих листов содержит имена сотрудников и их зарплаты в соответствии с данными в трех DataFrame из кода.
Параметр движка в функции to_excel() используется для определения модуля, который задействуется библиотекой Pandas для создания файла Excel. В этом случае использовался xslswriter, который нужен для работы с классом ExcelWriter. Разные движка можно определять в соответствии с их функциями.
В зависимости от установленных в системе модулей Python другими параметрами для движка могут быть openpyxl (для xlsx или xlsm) и xlwt (для xls). Подробности о модуле xlswriter можно найти в официальной документации.
Наконец, в коде была строка writer.save(), которая нужна для сохранения файла на диске.
Чтение файлов Excel с python
По аналогии с записью объектов DataFrame в файл Excel, эти файлы можно и читать, сохраняя данные в объект DataFrame. Для этого достаточно воспользоваться функцией read_excel():
top_players = pd.read_excel('./top_players.xlsx')

top_players.head()
Содержимое финального объекта можно посмотреть с помощью функции head().
Примечание:
Этот способ самый простой, но он и способен прочесть лишь содержимое первого листа.
Посмотрим на вывод функции head():
| Name | Age | Overall | Potential | Positions | Club | |
|---|---|---|---|---|---|---|
| 0 | L. Messi | 33 | 93 | 93 | RW,ST,CF | FC Barcelona |
| 1 | Cristiano Ronaldo | 35 | 92 | 92 | ST,LW | Juventus |
| 2 | J. Oblak | 27 | 91 | 93 | GK | Atlético Madrid |
| 3 | K. De Bruyne | 29 | 91 | 91 | CAM,CM | Manchester City |
| 4 | Neymar Jr | 28 | 91 | 91 | LW,CAM | Paris Saint-Germain |
Pandas присваивает метку строки или числовой индекс объекту DataFrame по умолчанию при использовании функции read_excel().
Это поведение можно переписать, передав одну из колонок из файла в качестве параметра index_col:
top_players = pd.read_excel('./top_players.xlsx', index_col='Name')

top_players.head()
Результат будет следующим:
| Name | Age | Overall | Potential | Positions | Club |
|---|---|---|---|---|---|
| L. Messi | 33 | 93 | 93 | RW,ST,CF | FC Barcelona |
| Cristiano Ronaldo | 35 | 92 | 92 | ST,LW | Juventus |
| J. Oblak | 27 | 91 | 93 | GK | Atlético Madrid |
| K. De Bruyne | 29 | 91 | 91 | CAM,CM | Manchester City |
| Neymar Jr | 28 | 91 | 91 | LW,CAM | Paris Saint-Germain |
В этом примере индекс по умолчанию был заменен на колонку «Name» из файла. Однако этот способ стоит использовать только при наличии колонки со значениями, которые могут стать заменой для индексов.
Чтение определенных колонок из файла Excel
Иногда удобно прочитать содержимое файла целиком, но бывают случаи, когда требуется получить доступ к определенному элементу. Например, нужно считать значение элемента и присвоить его полю объекта.
Это делается с помощью функции read_excel() и параметра usecols. Например, можно ограничить функцию, чтобы она читала только определенные колонки. Добавим параметр, чтобы он читал колонки, которые соответствуют значениям «Name», «Overall» и «Potential».
Для этого укажем числовой индекс каждой колонки:
cols = [0, 2, 3]

top_players = pd.read_excel('./top_players.xlsx', usecols=cols)

top_players.head()
Вот что выдаст этот код:
| Name | Overall | Potential | |
|---|---|---|---|
| 0 | L. Messi | 93 | 93 |
| 1 | Cristiano Ronaldo | 92 | 92 |
| 2 | J. Oblak | 91 | 93 |
| 3 | K. De Bruyne | 91 | 91 |
| 4 | Neymar Jr | 91 | 91 |
Таким образом возвращаются лишь колонки из списка cols.
В DataFrame много встроенных возможностей. Легко изменять, добавлять и агрегировать данные. Даже можно строить сводные таблицы. И все это сохраняется в Excel одной строкой кода.
Рекомендую изучить DataFrame в моих уроках по Pandas.
Выводы
В этом материале были рассмотрены функции read_excel() и to_excel() из библиотеки Pandas. С их помощью можно считывать данные из файлов Excel и выполнять запись в них. С помощью различных параметров есть возможность менять поведение функций, создавая нужные файлы, не просто копируя содержимое из объекта DataFrame.
Example: Creating a simple spreadsheet and bar chart
In this example we’re going to create a sheet from scratch and add some data and then plot it.
We’ll also explore some limited cell style and formatting.
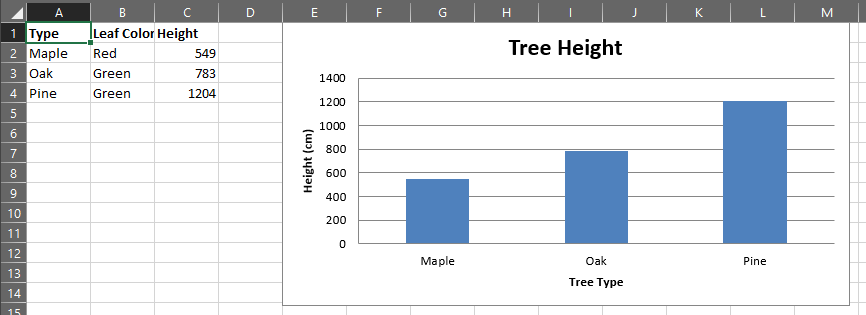
The data we’ll be entering on the sheet is below:
| Species | Leaf Color | Height (cm) |
|---|---|---|
| Maple | Red | 549 |
| Oak | Green | 783 |
| Pine | Green | 1204 |
To start, let’s load in openpyxl and create a new workbook. and get the active sheet.
We’ll also enter our tree data.
>>> from openpyxl import Workbook
>>> wb = Workbook()
>>> ws = wb.active
>>> treeData = [["Type", "Leaf Color", "Height"], ["Maple", "Red", 549], ["Oak", "Green", 783], ["Pine", "Green", 1204]]
Next we’ll enter this data onto the worksheet. As this is a list of lists, we can simply use the Worksheet.append() function.
>>> for row in treeData:
...     ws.append(row)
Now we should make our heading Bold to make it stand out a bit more, to do that we’ll need to create a styles.Font and apply it to all the cells in our header row.
>>> from openpyxl.styles import Font
>>> ft = Font(bold=True)
>>> for row in ws["A1:C1"]:
...     for cell in row:
...         cell.font = ft
It’s time to make some charts. First, we’ll start by importing the appropriate packages from openpyxl.chart then define some basic attributes
>>> from openpyxl.chart import BarChart, Series, Reference
>>> chart = BarChart()
>>> chart.type = "col"
>>> chart.title = "Tree Height"
>>> chart.y_axis.title = 'Height (cm)'
>>> chart.x_axis.title = 'Tree Type'
>>> chart.legend = None
That’s created the skeleton of what will be our bar chart. Now we need to add references to where the data is and pass that to the chart object
>>> data = Reference(ws, min_col=3, min_row=2, max_row=4, max_col=3)
>>> categories = Reference(ws, min_col=1, min_row=2, max_row=4, max_col=1)
>>> chart.add_data(data)
>>> chart.set_categories(categories)
Finally we can add it to the sheet.
>>> ws.add_chart(chart, "E1")
>>> wb.save("TreeData.xlsx")
And there you have it. If you open that doc now it should look something like this
Watch Now This tutorial has a related video course created by the Real Python team. Watch it together with the written tutorial to deepen your understanding: Editing Excel Spreadsheets in Python With openpyxl
Excel spreadsheets are one of those things you might have to deal with at some point. Either it’s because your boss loves them or because marketing needs them, you might have to learn how to work with spreadsheets, and that’s when knowing openpyxl comes in handy!
Spreadsheets are a very intuitive and user-friendly way to manipulate large datasets without any prior technical background. That’s why they’re still so commonly used today.
In this article, you’ll learn how to use openpyxl to:
- Manipulate Excel spreadsheets with confidence
- Extract information from spreadsheets
- Create simple or more complex spreadsheets, including adding styles, charts, and so on
This article is written for intermediate developers who have a pretty good knowledge of Python data structures, such as dicts and lists, but also feel comfortable around OOP and more intermediate level topics.
Before You Begin
If you ever get asked to extract some data from a database or log file into an Excel spreadsheet, or if you often have to convert an Excel spreadsheet into some more usable programmatic form, then this tutorial is perfect for you. Let’s jump into the openpyxl caravan!
Practical Use Cases
First things first, when would you need to use a package like openpyxl in a real-world scenario? You’ll see a few examples below, but really, there are hundreds of possible scenarios where this knowledge could come in handy.
Importing New Products Into a Database
You are responsible for tech in an online store company, and your boss doesn’t want to pay for a cool and expensive CMS system.
Every time they want to add new products to the online store, they come to you with an Excel spreadsheet with a few hundred rows and, for each of them, you have the product name, description, price, and so forth.
Now, to import the data, you’ll have to iterate over each spreadsheet row and add each product to the online store.
Exporting Database Data Into a Spreadsheet
Say you have a Database table where you record all your users’ information, including name, phone number, email address, and so forth.
Now, the Marketing team wants to contact all users to give them some discounted offer or promotion. However, they don’t have access to the Database, or they don’t know how to use SQL to extract that information easily.
What can you do to help? Well, you can make a quick script using openpyxl that iterates over every single User record and puts all the essential information into an Excel spreadsheet.
That’s gonna earn you an extra slice of cake at your company’s next birthday party!
Appending Information to an Existing Spreadsheet
You may also have to open a spreadsheet, read the information in it and, according to some business logic, append more data to it.
For example, using the online store scenario again, say you get an Excel spreadsheet with a list of users and you need to append to each row the total amount they’ve spent in your store.
This data is in the Database and, in order to do this, you have to read the spreadsheet, iterate through each row, fetch the total amount spent from the Database and then write back to the spreadsheet.
Not a problem for openpyxl!
Learning Some Basic Excel Terminology
Here’s a quick list of basic terms you’ll see when you’re working with Excel spreadsheets:
| Term | Explanation |
|---|---|
| Spreadsheet or Workbook | A Spreadsheet is the main file you are creating or working with. |
| Worksheet or Sheet | A Sheet is used to split different kinds of content within the same spreadsheet. A Spreadsheet can have one or more Sheets. |
| Column | A Column is a vertical line, and it’s represented by an uppercase letter: A. |
| Row | A Row is a horizontal line, and it’s represented by a number: 1. |
| Cell | A Cell is a combination of Column and Row, represented by both an uppercase letter and a number: A1. |
Getting Started With openpyxl
Now that you’re aware of the benefits of a tool like openpyxl, let’s get down to it and start by installing the package. For this tutorial, you should use Python 3.7 and openpyxl 2.6.2. To install the package, you can do the following:
After you install the package, you should be able to create a super simple spreadsheet with the following code:
from openpyxl import Workbook

workbook = Workbook()
sheet = workbook.active

sheet["A1"] = "hello"
sheet["B1"] = "world!"

workbook.save(filename="hello_world.xlsx")
The code above should create a file called hello_world.xlsx in the folder you are using to run the code. If you open that file with Excel you should see something like this:
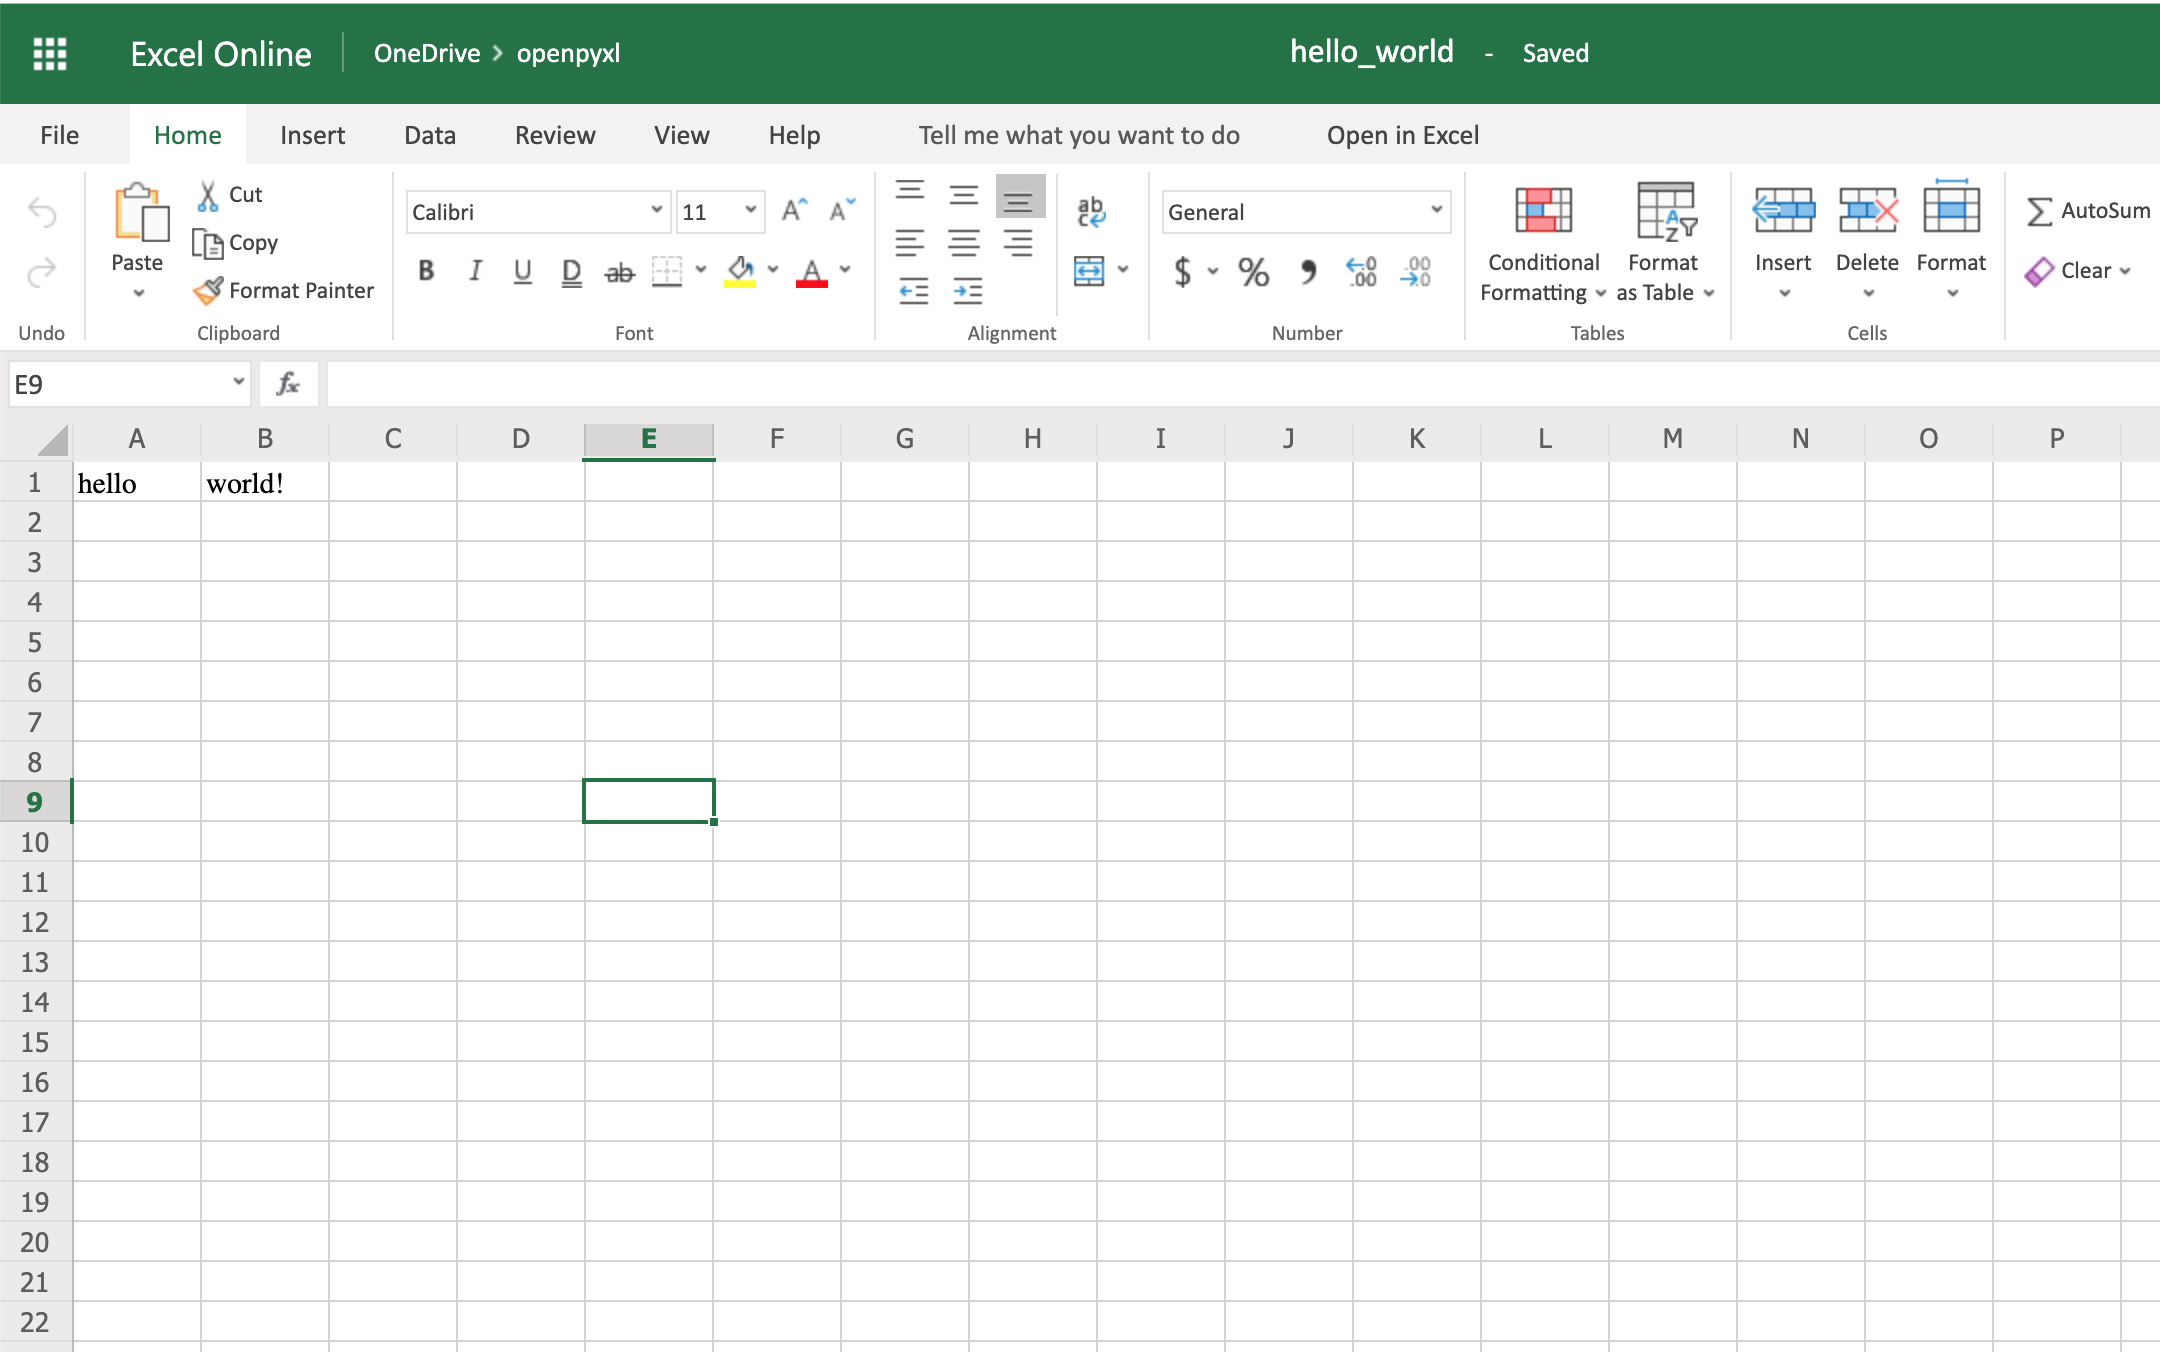
Woohoo, your first spreadsheet created!
Reading Excel Spreadsheets With openpyxl
Let’s start with the most essential thing one can do with a spreadsheet: read it.
You’ll go from a straightforward approach to reading a spreadsheet to more complex examples where you read the data and convert it into more useful Python structures.
Dataset for This Tutorial
Before you dive deep into some code examples, you should download this sample dataset and store it somewhere as sample.xlsx:
This is one of the datasets you’ll be using throughout this tutorial, and it’s a spreadsheet with a sample of real data from Amazon’s online product reviews. This dataset is only a tiny fraction of what Amazon provides, but for testing purposes, it’s more than enough.
A Simple Approach to Reading an Excel Spreadsheet
Finally, let’s start reading some spreadsheets! To begin with, open our sample spreadsheet:
>>>
>>> from openpyxl import load_workbook
>>> workbook = load_workbook(filename="sample.xlsx")
>>> workbook.sheetnames
['Sheet 1']

>>> sheet = workbook.active
>>> sheet
<Worksheet "Sheet 1">

>>> sheet.title
'Sheet 1'
In the code above, you first open the spreadsheet sample.xlsx using load_workbook(), and then you can use workbook.sheetnames to see all the sheets you have available to work with. After that, workbook.active selects the first available sheet and, in this case, you can see that it selects Sheet 1 automatically. Using these methods is the default way of opening a spreadsheet, and you’ll see it many times during this tutorial.
Now, after opening a spreadsheet, you can easily retrieve data from it like this:
>>>
>>> sheet["A1"]
<Cell 'Sheet 1'.A1>

>>> sheet["A1"].value
'marketplace'

>>> sheet["F10"].value
"G-Shock Men's Grey Sport Watch"
To return the actual value of a cell, you need to do .value. Otherwise, you’ll get the main Cell object. You can also use the method .cell() to retrieve a cell using index notation. Remember to add .value to get the actual value and not a Cell object:
>>>
>>> sheet.cell(row=10, column=6)
<Cell 'Sheet 1'.F10>

>>> sheet.cell(row=10, column=6).value
"G-Shock Men's Grey Sport Watch"
You can see that the results returned are the same, no matter which way you decide to go with. However, in this tutorial, you’ll be mostly using the first approach: ["A1"].
The above shows you the quickest way to open a spreadsheet. However, you can pass additional parameters to change the way a spreadsheet is loaded.
Additional Reading Options
There are a few arguments you can pass to load_workbook() that change the way a spreadsheet is loaded. The most important ones are the following two Booleans:
- read_only loads a spreadsheet in read-only mode allowing you to open very large Excel files.
- data_only ignores loading formulas and instead loads only the resulting values.
Importing Data From a Spreadsheet
Now that you’ve learned the basics about loading a spreadsheet, it’s about time you get to the fun part: the iteration and actual usage of the values within the spreadsheet.
This section is where you’ll learn all the different ways you can iterate through the data, but also how to convert that data into something usable and, more importantly, how to do it in a Pythonic way.
Iterating Through the Data
There are a few different ways you can iterate through the data depending on your needs.
You can slice the data with a combination of columns and rows:
>>>
>>> sheet["A1:C2"]
((<Cell 'Sheet 1'.A1>, <Cell 'Sheet 1'.B1>, <Cell 'Sheet 1'.C1>),
 (<Cell 'Sheet 1'.A2>, <Cell 'Sheet 1'.B2>, <Cell 'Sheet 1'.C2>))
You can get ranges of rows or columns:
>>>
>>> # Get all cells from column A
>>> sheet["A"]
(<Cell 'Sheet 1'.A1>,
 <Cell 'Sheet 1'.A2>,
 ...
 <Cell 'Sheet 1'.A99>,
 <Cell 'Sheet 1'.A100>)

>>> # Get all cells for a range of columns
>>> sheet["A:B"]
((<Cell 'Sheet 1'.A1>,
  <Cell 'Sheet 1'.A2>,
  ...
  <Cell 'Sheet 1'.A99>,
  <Cell 'Sheet 1'.A100>),
 (<Cell 'Sheet 1'.B1>,
  <Cell 'Sheet 1'.B2>,
  ...
  <Cell 'Sheet 1'.B99>,
  <Cell 'Sheet 1'.B100>))

>>> # Get all cells from row 5
>>> sheet[5]
(<Cell 'Sheet 1'.A5>,
 <Cell 'Sheet 1'.B5>,
 ...
 <Cell 'Sheet 1'.N5>,
 <Cell 'Sheet 1'.O5>)

>>> # Get all cells for a range of rows
>>> sheet[5:6]
((<Cell 'Sheet 1'.A5>,
  <Cell 'Sheet 1'.B5>,
  ...
  <Cell 'Sheet 1'.N5>,
  <Cell 'Sheet 1'.O5>),
 (<Cell 'Sheet 1'.A6>,
  <Cell 'Sheet 1'.B6>,
  ...
  <Cell 'Sheet 1'.N6>,
  <Cell 'Sheet 1'.O6>))
You’ll notice that all of the above examples return a tuple. If you want to refresh your memory on how to handle tuples in Python, check out the article on Lists and Tuples in Python.
There are also multiple ways of using normal Python generators to go through the data. The main methods you can use to achieve this are:
.iter_rows().iter_cols()
Both methods can receive the following arguments:
min_rowmax_rowmin_colmax_col
These arguments are used to set boundaries for the iteration:
>>>
>>> for row in sheet.iter_rows(min_row=1,
...                            max_row=2,
...                            min_col=1,
...                            max_col=3):
...     print(row)
(<Cell 'Sheet 1'.A1>, <Cell 'Sheet 1'.B1>, <Cell 'Sheet 1'.C1>)
(<Cell 'Sheet 1'.A2>, <Cell 'Sheet 1'.B2>, <Cell 'Sheet 1'.C2>)


>>> for column in sheet.iter_cols(min_row=1,
...                               max_row=2,
...                               min_col=1,
...                               max_col=3):
...     print(column)
(<Cell 'Sheet 1'.A1>, <Cell 'Sheet 1'.A2>)
(<Cell 'Sheet 1'.B1>, <Cell 'Sheet 1'.B2>)
(<Cell 'Sheet 1'.C1>, <Cell 'Sheet 1'.C2>)
You’ll notice that in the first example, when iterating through the rows using .iter_rows(), you get one tuple element per row selected. While when using .iter_cols() and iterating through columns, you’ll get one tuple per column instead.
One additional argument you can pass to both methods is the Boolean values_only. When it’s set to True, the values of the cell are returned, instead of the Cell object:
>>>
>>> for value in sheet.iter_rows(min_row=1,
...                              max_row=2,
...                              min_col=1,
...                              max_col=3,
...                              values_only=True):
...     print(value)
('marketplace', 'customer_id', 'review_id')
('US', 3653882, 'R3O9SGZBVQBV76')
If you want to iterate through the whole dataset, then you can also use the attributes .rows or .columns directly, which are shortcuts to using .iter_rows() and .iter_cols() without any arguments:
>>>
>>> for row in sheet.rows:
...     print(row)
(<Cell 'Sheet 1'.A1>, <Cell 'Sheet 1'.B1>, <Cell 'Sheet 1'.C1>
...
<Cell 'Sheet 1'.M100>, <Cell 'Sheet 1'.N100>, <Cell 'Sheet 1'.O100>)
These shortcuts are very useful when you’re iterating through the whole dataset.
Manipulate Data Using Python’s Default Data Structures
Now that you know the basics of iterating through the data in a workbook, let’s look at smart ways of converting that data into Python structures.
As you saw earlier, the result from all iterations comes in the form of tuples. However, since a tuple is nothing more than an immutable list, you can easily access its data and transform it into other structures.
For example, say you want to extract product information from the sample.xlsx spreadsheet and into a dictionary where each key is a product ID.
A straightforward way to do this is to iterate over all the rows, pick the columns you know are related to product information, and then store that in a dictionary. Let’s code this out!
First of all, have a look at the headers and see what information you care most about:
>>>
>>> for value in sheet.iter_rows(min_row=1,
...                              max_row=1,
...                              values_only=True):
...     print(value)
('marketplace', 'customer_id', 'review_id', 'product_id', ...)
This code returns a list of all the column names you have in the spreadsheet. To start, grab the columns with names:
product_idproduct_parentproduct_titleproduct_category
Lucky for you, the columns you need are all next to each other so you can use the min_column and max_column to easily get the data you want:
>>>
>>> for value in sheet.iter_rows(min_row=2,
...                              min_col=4,
...                              max_col=7,
...                              values_only=True):
...     print(value)
('B00FALQ1ZC', 937001370, 'Invicta Women's 15150 "Angel" 18k Yellow...)
('B00D3RGO20', 484010722, "Kenneth Cole New York Women's KC4944...)
...
Nice! Now that you know how to get all the important product information you need, let’s put that data into a dictionary:
import json
from openpyxl import load_workbook

workbook = load_workbook(filename="sample.xlsx")
sheet = workbook.active

products = {}

# Using the values_only because you want to return the cells' values
for row in sheet.iter_rows(min_row=2,
                           min_col=4,
                           max_col=7,
                           values_only=True):
    product_id = row[0]
    product = {
        "parent": row[1],
        "title": row[2],
        "category": row[3]
    }
    products[product_id] = product

# Using json here to be able to format the output for displaying later
print(json.dumps(products))
The code above returns a JSON similar to this:
{
  "B00FALQ1ZC": {
    "parent": 937001370,
    "title": "Invicta Women's 15150 ...",
    "category": "Watches"
  },
  "B00D3RGO20": {
    "parent": 484010722,
    "title": "Kenneth Cole New York ...",
    "category": "Watches"
  }
}
Here you can see that the output is trimmed to 2 products only, but if you run the script as it is, then you should get 98 products.
Convert Data Into Python Classes
To finalize the reading section of this tutorial, let’s dive into Python classes and see how you could improve on the example above and better structure the data.
For this, you’ll be using the new Python Data Classes that are available from Python 3.7. If you’re using an older version of Python, then you can use the default Classes instead.
So, first things first, let’s look at the data you have and decide what you want to store and how you want to store it.
As you saw right at the start, this data comes from Amazon, and it’s a list of product reviews. You can check the list of all the columns and their meaning on Amazon.
There are two significant elements you can extract from the data available:
- Products
- Reviews
A Product has:
- ID
- Title
- Parent
- Category
The Review has a few more fields:
- ID
- Customer ID
- Stars
- Headline
- Body
- Date
You can ignore a few of the review fields to make things a bit simpler.
So, a straightforward implementation of these two classes could be written in a separate file classes.py:
import datetime
from dataclasses import dataclass

@dataclass
class Product:
    id: str
    parent: str
    title: str
    category: str

@dataclass
class Review:
    id: str
    customer_id: str
    stars: int
    headline: str
    body: str
    date: datetime.datetime
After defining your data classes, you need to convert the data from the spreadsheet into these new structures.
Before doing the conversion, it’s worth looking at our header again and creating a mapping between columns and the fields you need:
>>>
>>> for value in sheet.iter_rows(min_row=1,
...                              max_row=1,
...                              values_only=True):
...     print(value)
('marketplace', 'customer_id', 'review_id', 'product_id', ...)

>>> # Or an alternative
>>> for cell in sheet[1]:
...     print(cell.value)
marketplace
customer_id
review_id
product_id
product_parent
...
Let’s create a file mapping.py where you have a list of all the field names and their column location (zero-indexed) on the spreadsheet:
# Product fields
PRODUCT_ID = 3
PRODUCT_PARENT = 4
PRODUCT_TITLE = 5
PRODUCT_CATEGORY = 6

# Review fields
REVIEW_ID = 2
REVIEW_CUSTOMER = 1
REVIEW_STARS = 7
REVIEW_HEADLINE = 12
REVIEW_BODY = 13
REVIEW_DATE = 14
You don’t necessarily have to do the mapping above. It’s more for readability when parsing the row data, so you don’t end up with a lot of magic numbers lying around.
Finally, let’s look at the code needed to parse the spreadsheet data into a list of product and review objects:
from datetime import datetime
from openpyxl import load_workbook
from classes import Product, Review
from mapping import PRODUCT_ID, PRODUCT_PARENT, PRODUCT_TITLE,
    PRODUCT_CATEGORY, REVIEW_DATE, REVIEW_ID, REVIEW_CUSTOMER,
    REVIEW_STARS, REVIEW_HEADLINE, REVIEW_BODY

# Using the read_only method since you're not gonna be editing the spreadsheet
workbook = load_workbook(filename="sample.xlsx", read_only=True)
sheet = workbook.active

products = []
reviews = []

# Using the values_only because you just want to return the cell value
for row in sheet.iter_rows(min_row=2, values_only=True):
    product = Product(id=row[PRODUCT_ID],
                      parent=row[PRODUCT_PARENT],
                      title=row[PRODUCT_TITLE],
                      category=row[PRODUCT_CATEGORY])
    products.append(product)

    # You need to parse the date from the spreadsheet into a datetime format
    spread_date = row[REVIEW_DATE]
    parsed_date = datetime.strptime(spread_date, "%Y-%m-%d")

    review = Review(id=row[REVIEW_ID],
                    customer_id=row[REVIEW_CUSTOMER],
                    stars=row[REVIEW_STARS],
                    headline=row[REVIEW_HEADLINE],
                    body=row[REVIEW_BODY],
                    date=parsed_date)
    reviews.append(review)

print(products[0])
print(reviews[0])
After you run the code above, you should get some output like this:
Product(id='B00FALQ1ZC', parent=937001370, ...)
Review(id='R3O9SGZBVQBV76', customer_id=3653882, ...)
That’s it! Now you should have the data in a very simple and digestible class format, and you can start thinking of storing this in a Database or any other type of data storage you like.
Using this kind of OOP strategy to parse spreadsheets makes handling the data much simpler later on.
Appending New Data
Before you start creating very complex spreadsheets, have a quick look at an example of how to append data to an existing spreadsheet.
Go back to the first example spreadsheet you created (hello_world.xlsx) and try opening it and appending some data to it, like this:
from openpyxl import load_workbook

# Start by opening the spreadsheet and selecting the main sheet
workbook = load_workbook(filename="hello_world.xlsx")
sheet = workbook.active

# Write what you want into a specific cell
sheet["C1"] = "writing ;)"

# Save the spreadsheet
workbook.save(filename="hello_world_append.xlsx")
Et voilà, if you open the new hello_world_append.xlsx spreadsheet, you’ll see the following change:
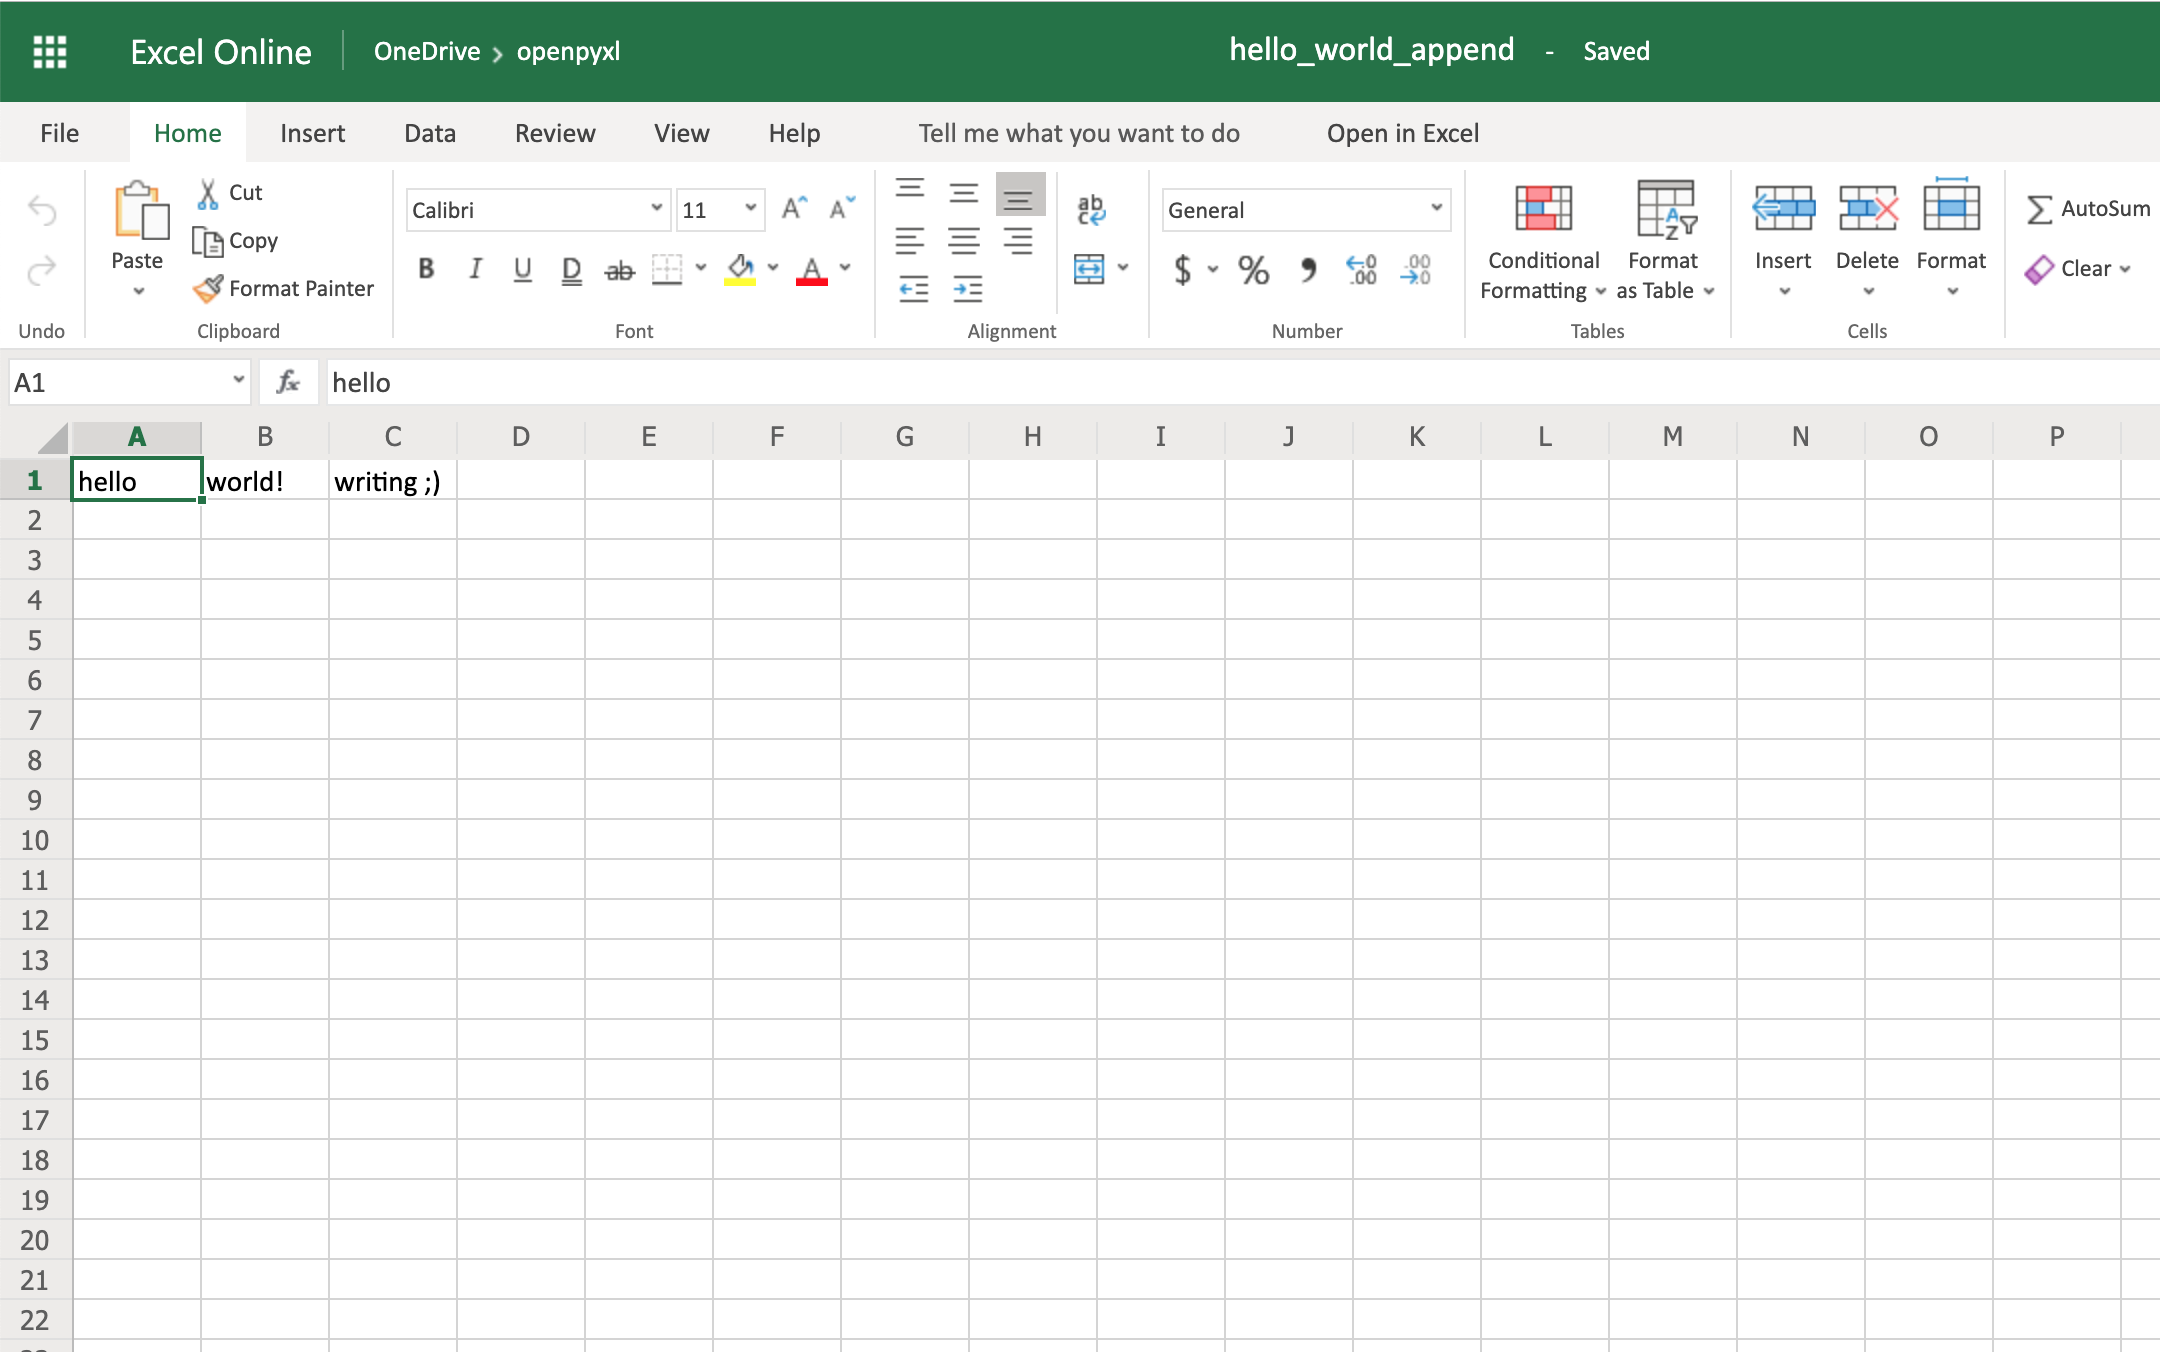
Notice the additional writing  on cell
 C1.
Writing Excel Spreadsheets With openpyxl
There are a lot of different things you can write to a spreadsheet, from simple text or number values to complex formulas, charts, or even images.
Let’s start creating some spreadsheets!
Creating a Simple Spreadsheet
Previously, you saw a very quick example of how to write “Hello world!” into a spreadsheet, so you can start with that:
 1from openpyxl import Workbook
 2
 3filename = "hello_world.xlsx"
 4
 5workbook = Workbook()
 6sheet = workbook.active
 7
 8sheet["A1"] = "hello"
 9sheet["B1"] = "world!"
10
11workbook.save(filename=filename)
The highlighted lines in the code above are the most important ones for writing. In the code, you can see that:
- Line 5 shows you how to create a new empty workbook.
- Lines 8 and 9 show you how to add data to specific cells.
- Line 11 shows you how to save the spreadsheet when you’re done.
Even though these lines above can be straightforward, it’s still good to know them well for when things get a bit more complicated.
One thing you can do to help with coming code examples is add the following method to your Python file or console:
>>>
>>> def print_rows():
...     for row in sheet.iter_rows(values_only=True):
...         print(row)
It makes it easier to print all of your spreadsheet values by just calling print_rows().
Basic Spreadsheet Operations
Before you get into the more advanced topics, it’s good for you to know how to manage the most simple elements of a spreadsheet.
Adding and Updating Cell Values
You already learned how to add values to a spreadsheet like this:
>>>
>>> sheet["A1"] = "value"
There’s another way you can do this, by first selecting a cell and then changing its value:
>>>
>>> cell = sheet["A1"]
>>> cell
<Cell 'Sheet'.A1>

>>> cell.value
'hello'

>>> cell.value = "hey"
>>> cell.value
'hey'
The new value is only stored into the spreadsheet once you call workbook.save().
The openpyxl creates a cell when adding a value, if that cell didn’t exist before:
>>>
>>> # Before, our spreadsheet has only 1 row
>>> print_rows()
('hello', 'world!')

>>> # Try adding a value to row 10
>>> sheet["B10"] = "test"
>>> print_rows()
('hello', 'world!')
(None, None)
(None, None)
(None, None)
(None, None)
(None, None)
(None, None)
(None, None)
(None, None)
(None, 'test')
As you can see, when trying to add a value to cell B10, you end up with a tuple with 10 rows, just so you can have that test value.
Managing Rows and Columns
One of the most common things you have to do when manipulating spreadsheets is adding or removing rows and columns. The openpyxl package allows you to do that in a very straightforward way by using the methods:
.insert_rows().delete_rows().insert_cols().delete_cols()
Every single one of those methods can receive two arguments:
idxamount
Using our basic hello_world.xlsx example again, let’s see how these methods work:
>>>
>>> print_rows()
('hello', 'world!')

>>> # Insert a column before the existing column 1 ("A")
>>> sheet.insert_cols(idx=1)
>>> print_rows()
(None, 'hello', 'world!')

>>> # Insert 5 columns between column 2 ("B") and 3 ("C")
>>> sheet.insert_cols(idx=3, amount=5)
>>> print_rows()
(None, 'hello', None, None, None, None, None, 'world!')

>>> # Delete the created columns
>>> sheet.delete_cols(idx=3, amount=5)
>>> sheet.delete_cols(idx=1)
>>> print_rows()
('hello', 'world!')

>>> # Insert a new row in the beginning
>>> sheet.insert_rows(idx=1)
>>> print_rows()
(None, None)
('hello', 'world!')

>>> # Insert 3 new rows in the beginning
>>> sheet.insert_rows(idx=1, amount=3)
>>> print_rows()
(None, None)
(None, None)
(None, None)
(None, None)
('hello', 'world!')

>>> # Delete the first 4 rows
>>> sheet.delete_rows(idx=1, amount=4)
>>> print_rows()
('hello', 'world!')
The only thing you need to remember is that when inserting new data (rows or columns), the insertion happens before the idx parameter.
So, if you do insert_rows(1), it inserts a new row before the existing first row.
It’s the same for columns: when you call insert_cols(2), it inserts a new column right before the already existing second column (B).
However, when deleting rows or columns, .delete_... deletes data starting from the index passed as an argument.
For example, when doing delete_rows(2) it deletes row 2, and when doing delete_cols(3) it deletes the third column (C).
Managing Sheets
Sheet management is also one of those things you might need to know, even though it might be something that you don’t use that often.
If you look back at the code examples from this tutorial, you’ll notice the following recurring piece of code:
This is the way to select the default sheet from a spreadsheet. However, if you’re opening a spreadsheet with multiple sheets, then you can always select a specific one like this:
>>>
>>> # Let's say you have two sheets: "Products" and "Company Sales"
>>> workbook.sheetnames
['Products', 'Company Sales']

>>> # You can select a sheet using its title
>>> products_sheet = workbook["Products"]
>>> sales_sheet = workbook["Company Sales"]
You can also change a sheet title very easily:
>>>
>>> workbook.sheetnames
['Products', 'Company Sales']

>>> products_sheet = workbook["Products"]
>>> products_sheet.title = "New Products"

>>> workbook.sheetnames
['New Products', 'Company Sales']
If you want to create or delete sheets, then you can also do that with .create_sheet() and .remove():
>>>
>>> workbook.sheetnames
['Products', 'Company Sales']

>>> operations_sheet = workbook.create_sheet("Operations")
>>> workbook.sheetnames
['Products', 'Company Sales', 'Operations']

>>> # You can also define the position to create the sheet at
>>> hr_sheet = workbook.create_sheet("HR", 0)
>>> workbook.sheetnames
['HR', 'Products', 'Company Sales', 'Operations']

>>> # To remove them, just pass the sheet as an argument to the .remove()
>>> workbook.remove(operations_sheet)
>>> workbook.sheetnames
['HR', 'Products', 'Company Sales']

>>> workbook.remove(hr_sheet)
>>> workbook.sheetnames
['Products', 'Company Sales']
One other thing you can do is make duplicates of a sheet using copy_worksheet():
>>>
>>> workbook.sheetnames
['Products', 'Company Sales']

>>> products_sheet = workbook["Products"]
>>> workbook.copy_worksheet(products_sheet)
<Worksheet "Products Copy">

>>> workbook.sheetnames
['Products', 'Company Sales', 'Products Copy']
If you open your spreadsheet after saving the above code, you’ll notice that the sheet Products Copy is a duplicate of the sheet Products.
Freezing Rows and Columns
Something that you might want to do when working with big spreadsheets is to freeze a few rows or columns, so they remain visible when you scroll right or down.
Freezing data allows you to keep an eye on important rows or columns, regardless of where you scroll in the spreadsheet.
Again, openpyxl also has a way to accomplish this by using the worksheet freeze_panes attribute. For this example, go back to our sample.xlsx spreadsheet and try doing the following:
>>>
>>> workbook = load_workbook(filename="sample.xlsx")
>>> sheet = workbook.active
>>> sheet.freeze_panes = "C2"
>>> workbook.save("sample_frozen.xlsx")
If you open the sample_frozen.xlsx spreadsheet in your favorite spreadsheet editor, you’ll notice that row 1 and columns A and B are frozen and are always visible no matter where you navigate within the spreadsheet.
This feature is handy, for example, to keep headers within sight, so you always know what each column represents.
Here’s how it looks in the editor:
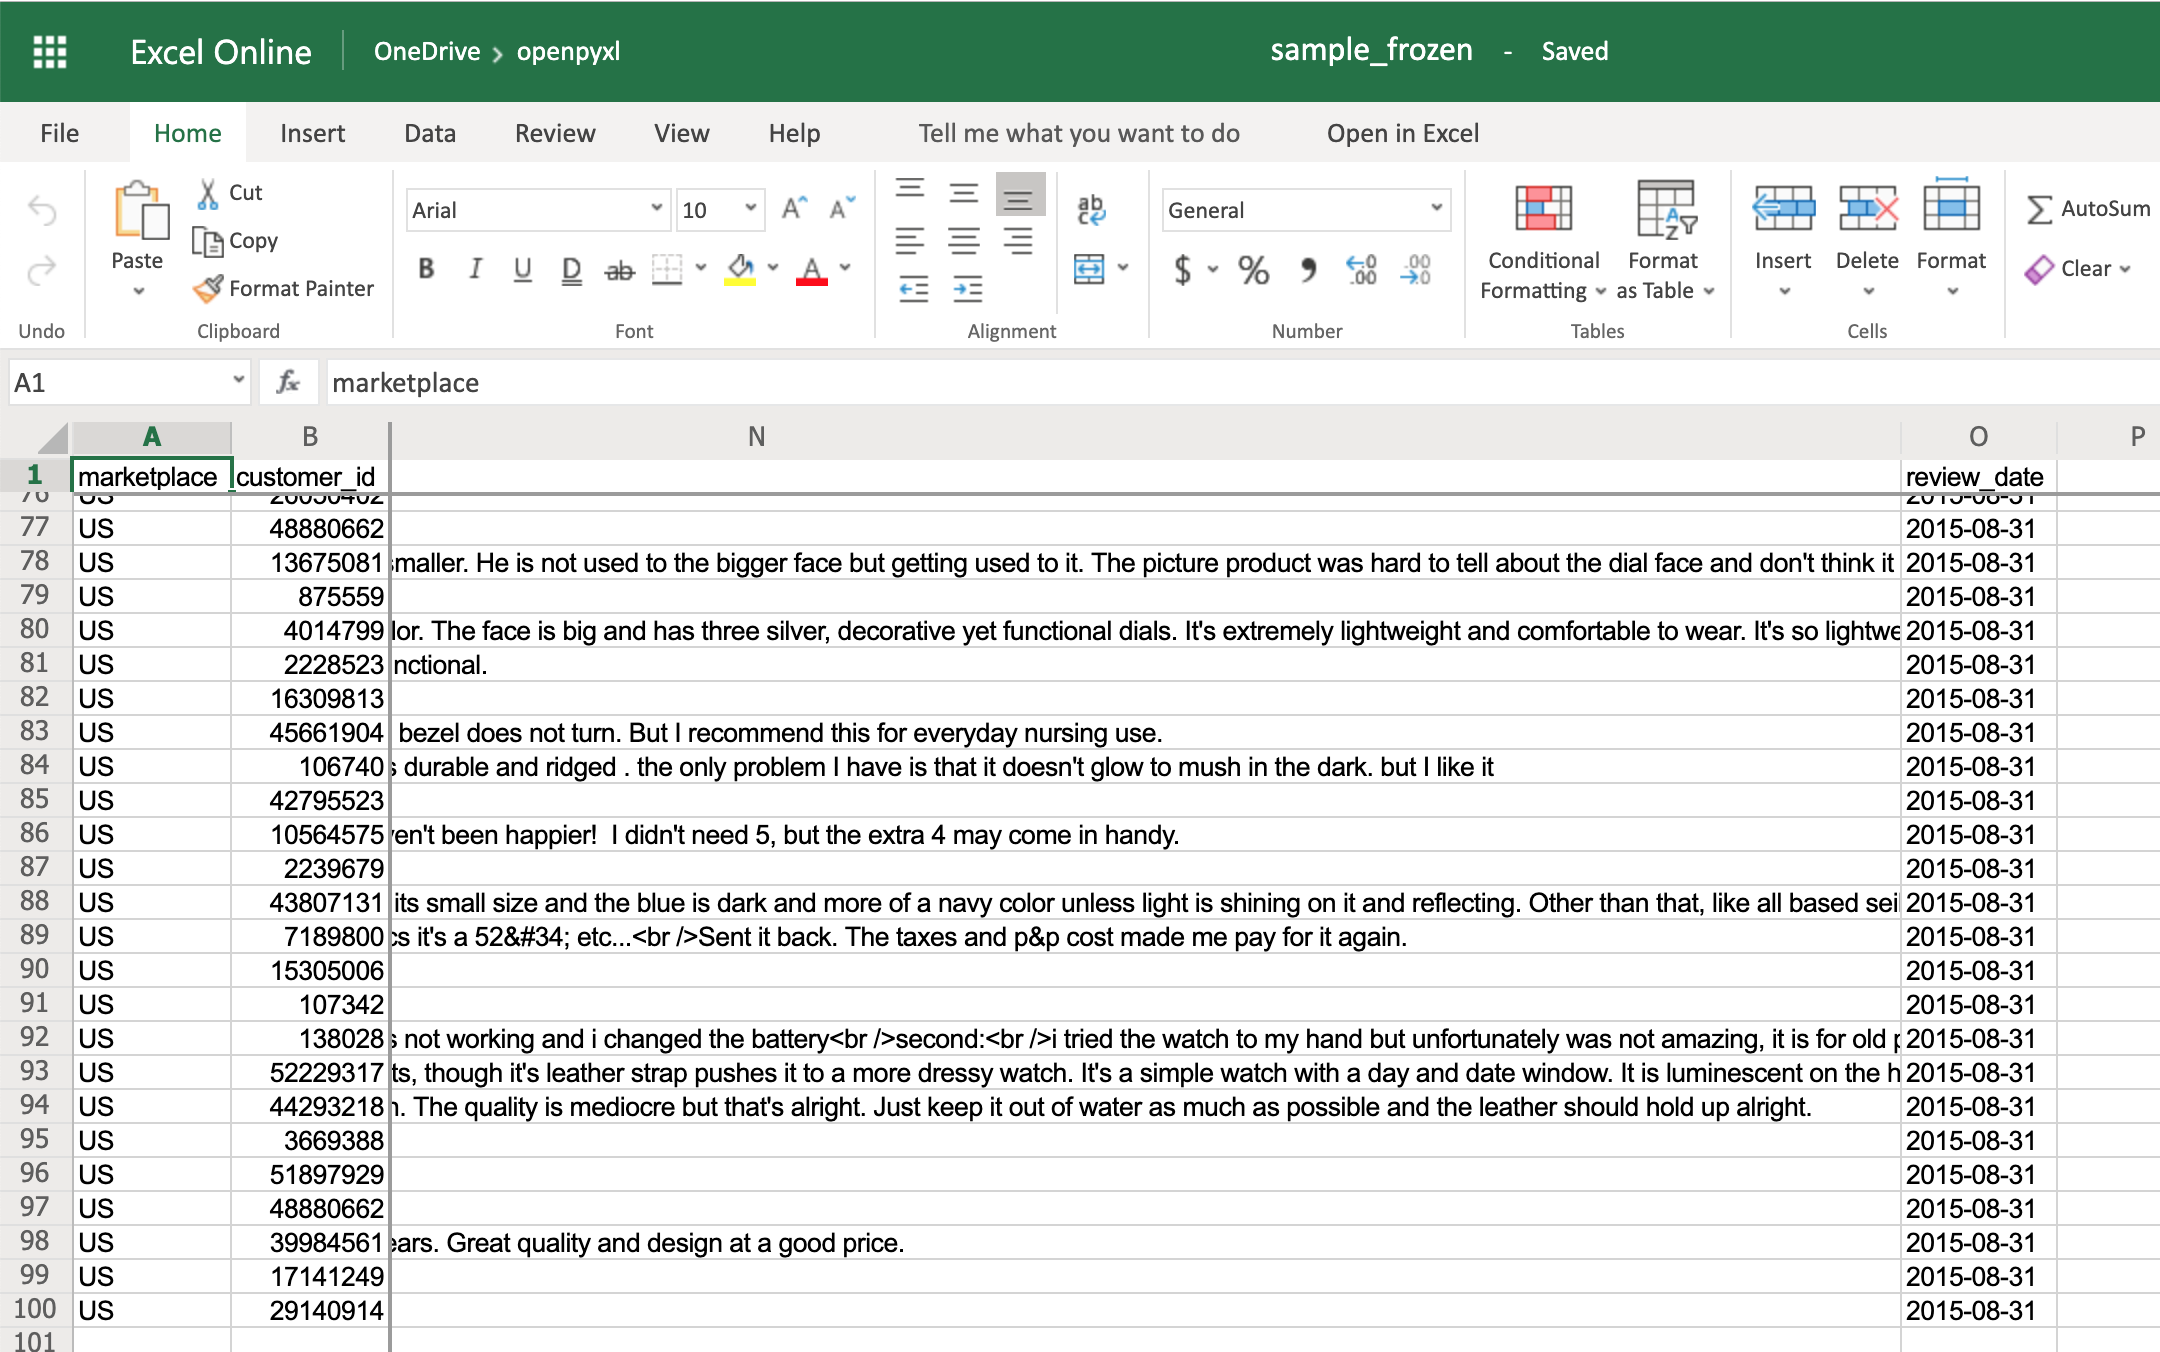
Notice how you’re at the end of the spreadsheet, and yet, you can see both row 1 and columns A and B.
Adding Filters
You can use openpyxl to add filters and sorts to your spreadsheet. However, when you open the spreadsheet, the data won’t be rearranged according to these sorts and filters.
At first, this might seem like a pretty useless feature, but when you’re programmatically creating a spreadsheet that is going to be sent and used by somebody else, it’s still nice to at least create the filters and allow people to use it afterward.
The code below is an example of how you would add some filters to our existing sample.xlsx spreadsheet:
>>>
>>> # Check the used spreadsheet space using the attribute "dimensions"
>>> sheet.dimensions
'A1:O100'

>>> sheet.auto_filter.ref = "A1:O100"
>>> workbook.save(filename="sample_with_filters.xlsx")
You should now see the filters created when opening the spreadsheet in your editor:
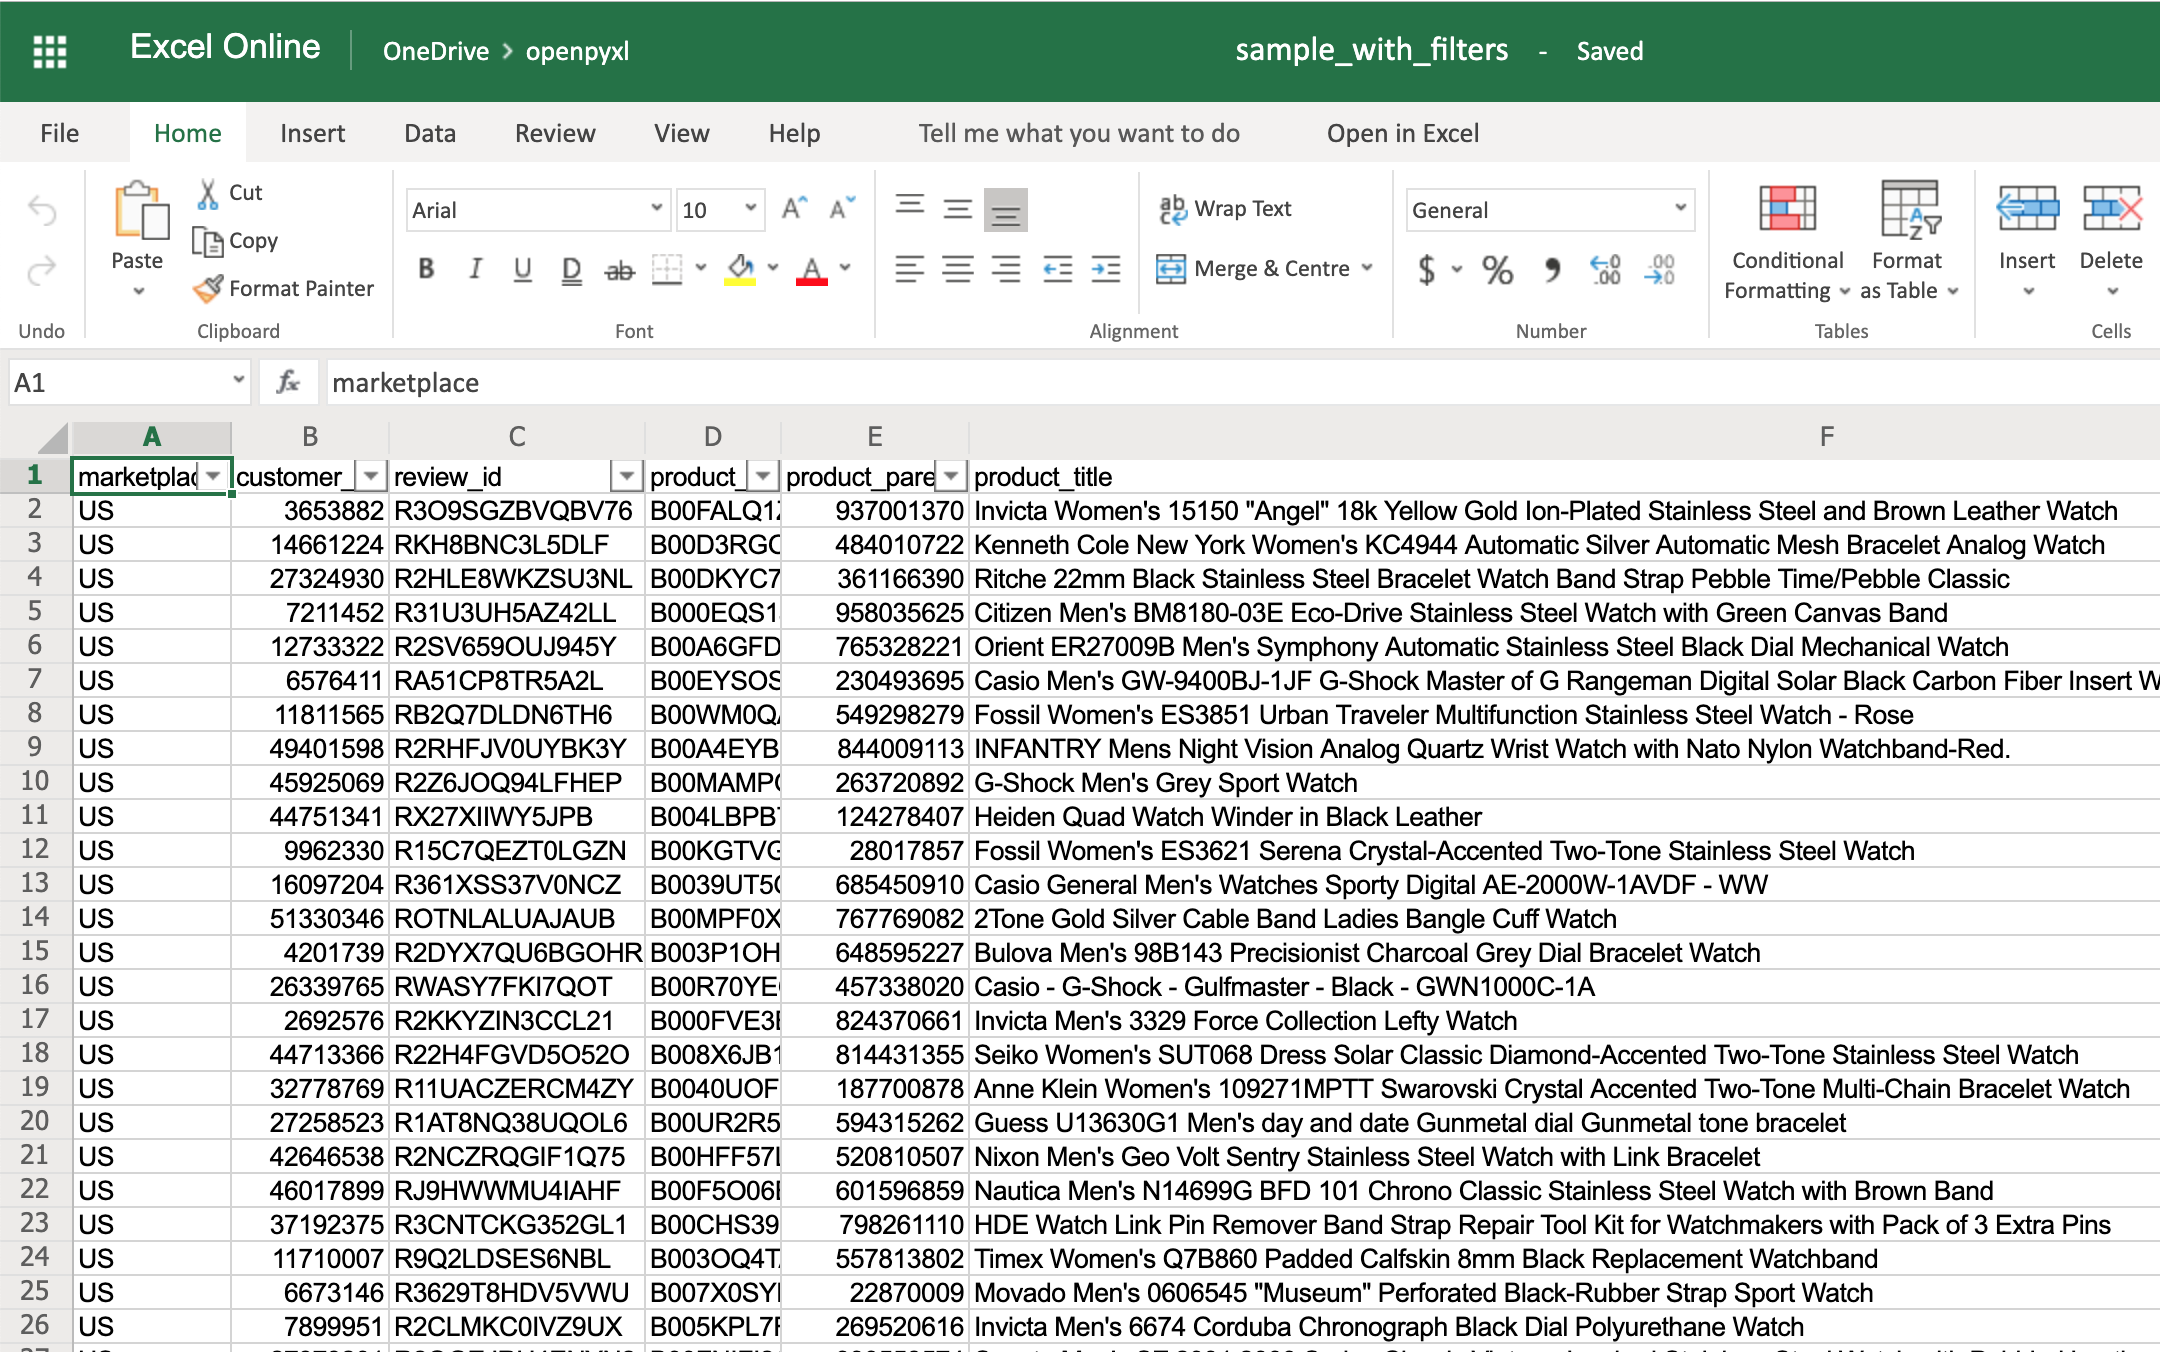
You don’t have to use sheet.dimensions if you know precisely which part of the spreadsheet you want to apply filters to.
Adding Formulas
Formulas (or formulae) are one of the most powerful features of spreadsheets.
They gives you the power to apply specific mathematical equations to a range of cells. Using formulas with openpyxl is as simple as editing the value of a cell.
You can see the list of formulas supported by openpyxl:
>>>
>>> from openpyxl.utils import FORMULAE
>>> FORMULAE
frozenset({'ABS',
           'ACCRINT',
           'ACCRINTM',
           'ACOS',
           'ACOSH',
           'AMORDEGRC',
           'AMORLINC',
           'AND',
           ...
           'YEARFRAC',
           'YIELD',
           'YIELDDISC',
           'YIELDMAT',
           'ZTEST'})
Let’s add some formulas to our sample.xlsx spreadsheet.
Starting with something easy, let’s check the average star rating for the 99 reviews within the spreadsheet:
>>>
>>> # Star rating is column "H"
>>> sheet["P2"] = "=AVERAGE(H2:H100)"
>>> workbook.save(filename="sample_formulas.xlsx")
If you open the spreadsheet now and go to cell P2, you should see that its value is: 4.18181818181818. Have a look in the editor:

You can use the same methodology to add any formulas to your spreadsheet. For example, let’s count the number of reviews that had helpful votes:
>>>
>>> # The helpful votes are counted on column "I"
>>> sheet["P3"] = '=COUNTIF(I2:I100, ">0")'
>>> workbook.save(filename="sample_formulas.xlsx")
You should get the number 21 on your P3 spreadsheet cell like so:
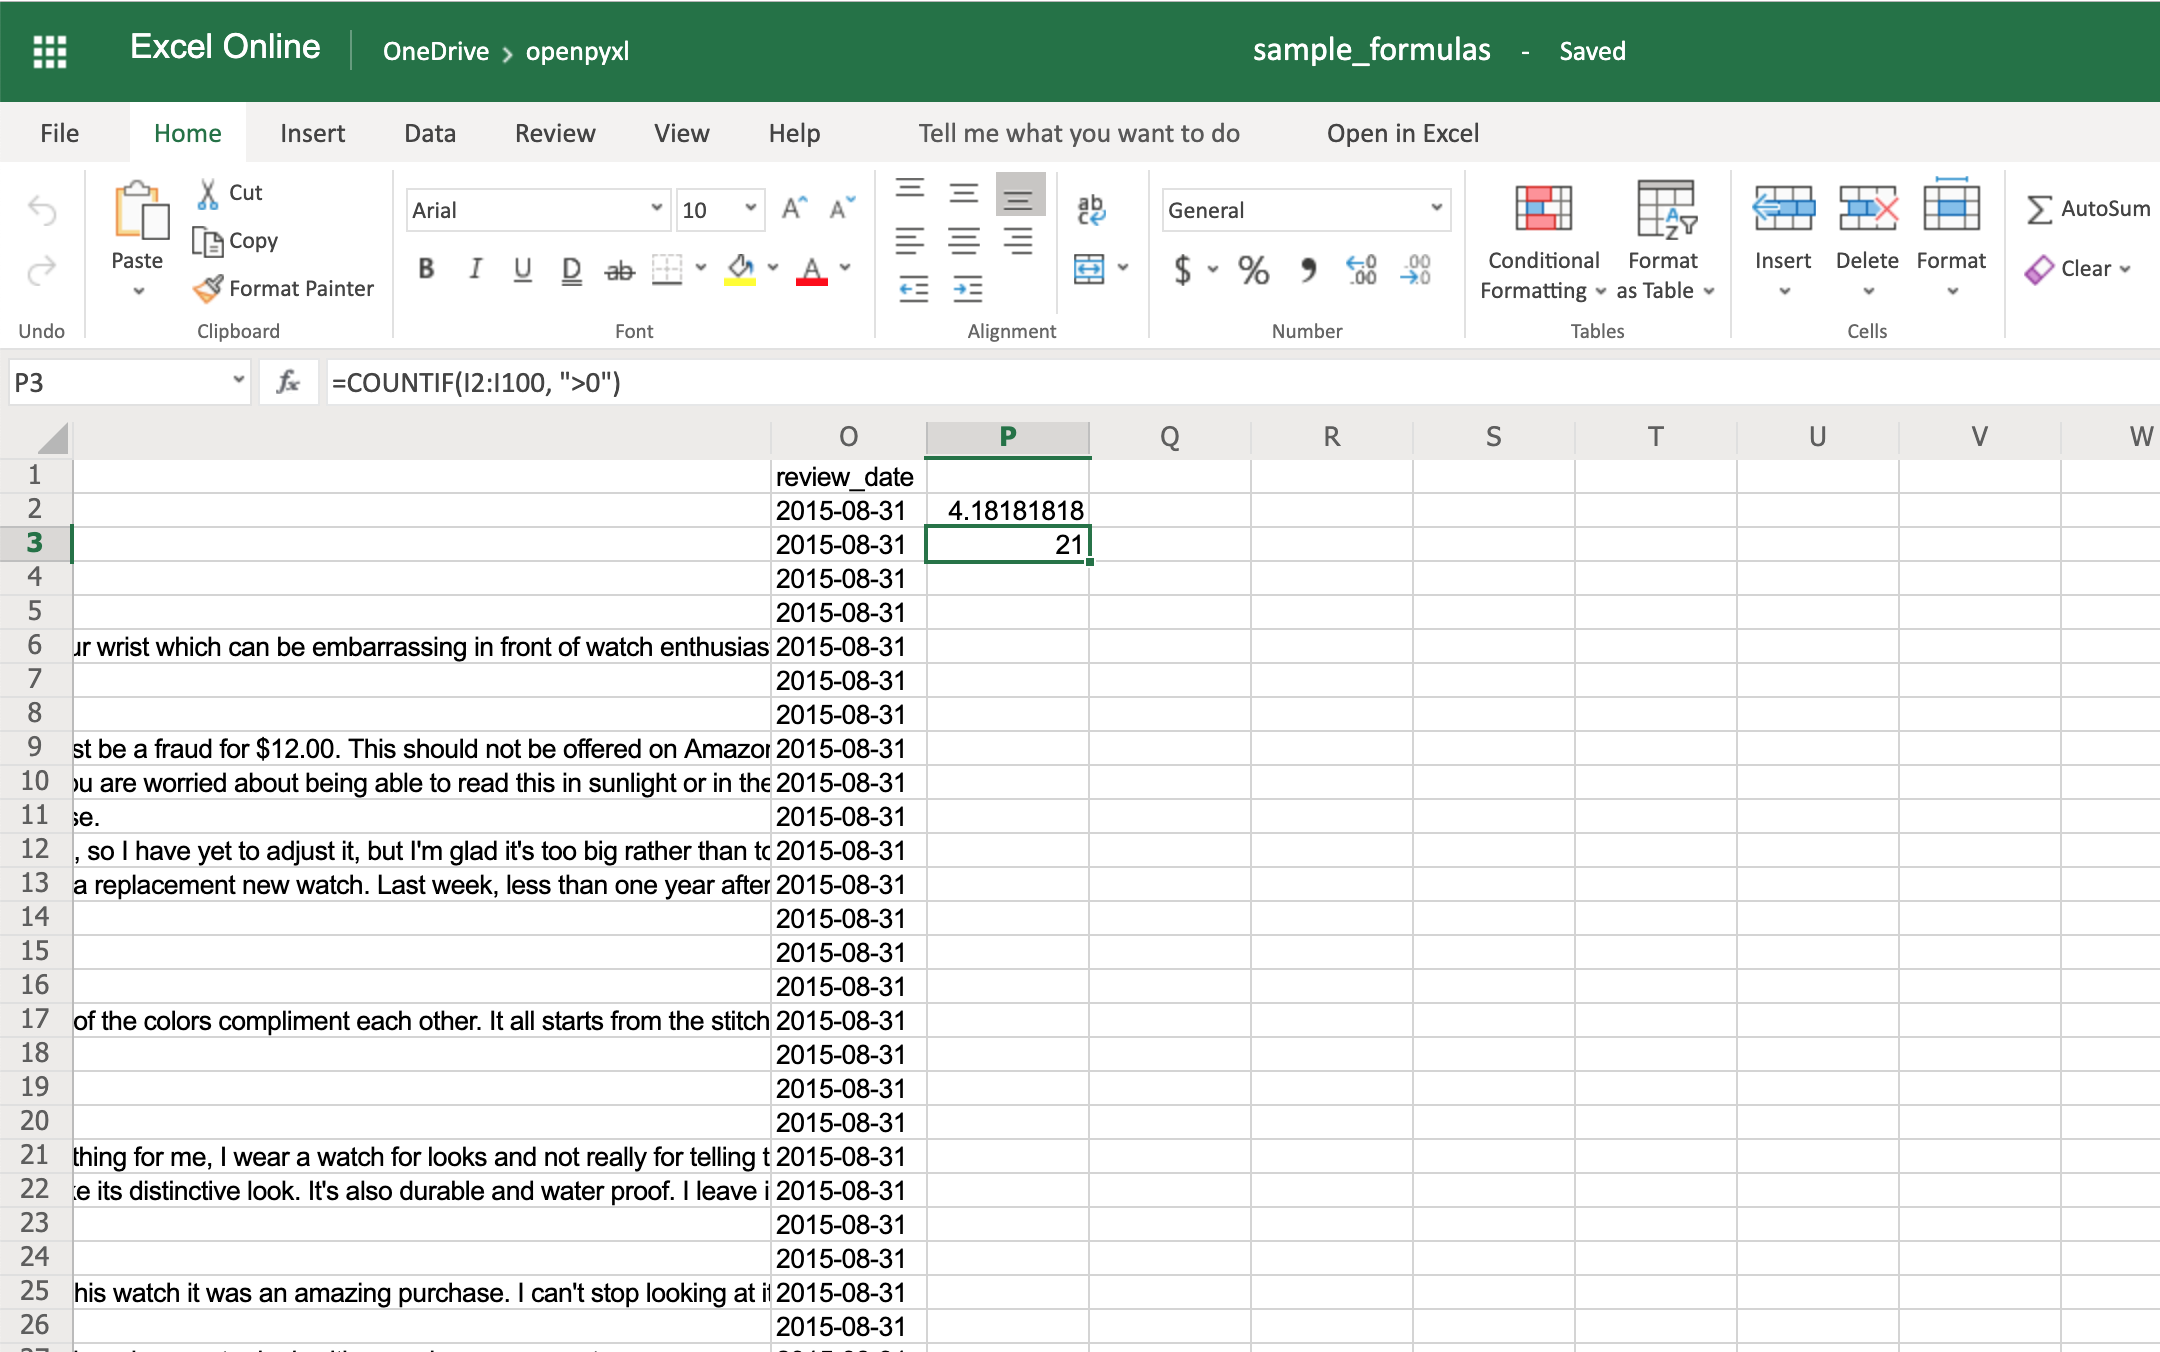
You’ll have to make sure that the strings within a formula are always in double quotes, so you either have to use single quotes around the formula like in the example above or you’ll have to escape the double quotes inside the formula: "=COUNTIF(I2:I100, ">0")".
There are a ton of other formulas you can add to your spreadsheet using the same procedure you tried above. Give it a go yourself!
Adding Styles
Even though styling a spreadsheet might not be something you would do every day, it’s still good to know how to do it.
Using openpyxl, you can apply multiple styling options to your spreadsheet, including fonts, borders, colors, and so on. Have a look at the openpyxl documentation to learn more.
You can also choose to either apply a style directly to a cell or create a template and reuse it to apply styles to multiple cells.
Let’s start by having a look at simple cell styling, using our sample.xlsx again as the base spreadsheet:
>>>
>>> # Import necessary style classes
>>> from openpyxl.styles import Font, Color, Alignment, Border, Side

>>> # Create a few styles
>>> bold_font = Font(bold=True)
>>> big_red_text = Font(color="00FF0000", size=20)
>>> center_aligned_text = Alignment(horizontal="center")
>>> double_border_side = Side(border_style="double")
>>> square_border = Border(top=double_border_side,
...                        right=double_border_side,
...                        bottom=double_border_side,
...                        left=double_border_side)

>>> # Style some cells!
>>> sheet["A2"].font = bold_font
>>> sheet["A3"].font = big_red_text
>>> sheet["A4"].alignment = center_aligned_text
>>> sheet["A5"].border = square_border
>>> workbook.save(filename="sample_styles.xlsx")
If you open your spreadsheet now, you should see quite a few different styles on the first 5 cells of column A:
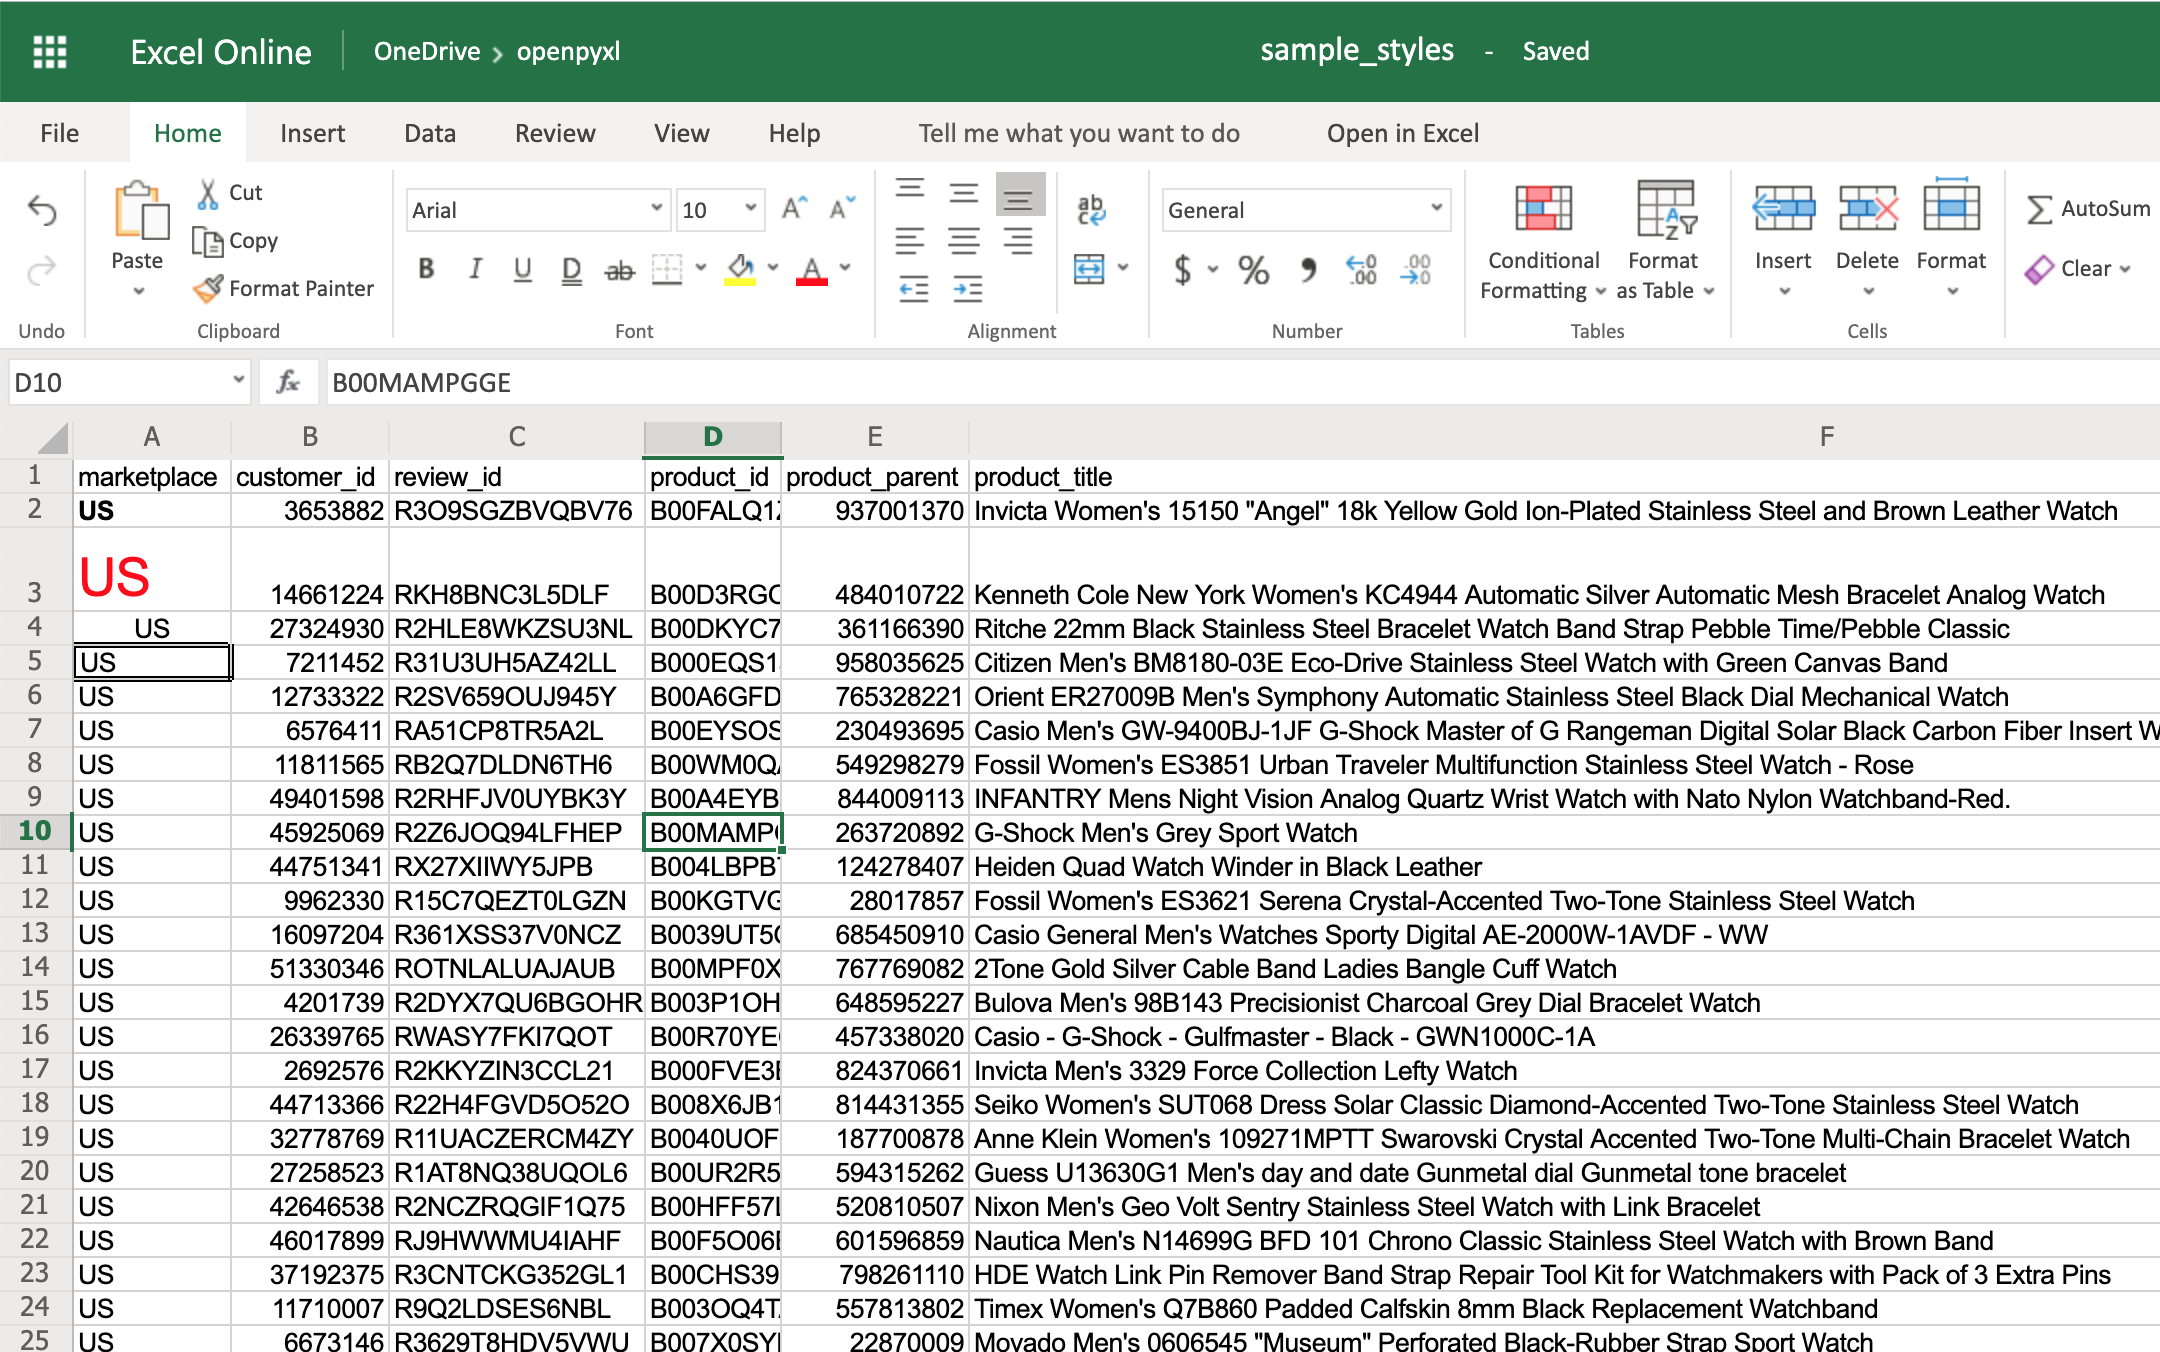
There you go. You got:
- A2 with the text in bold
- A3 with the text in red and bigger font size
- A4 with the text centered
- A5 with a square border around the text
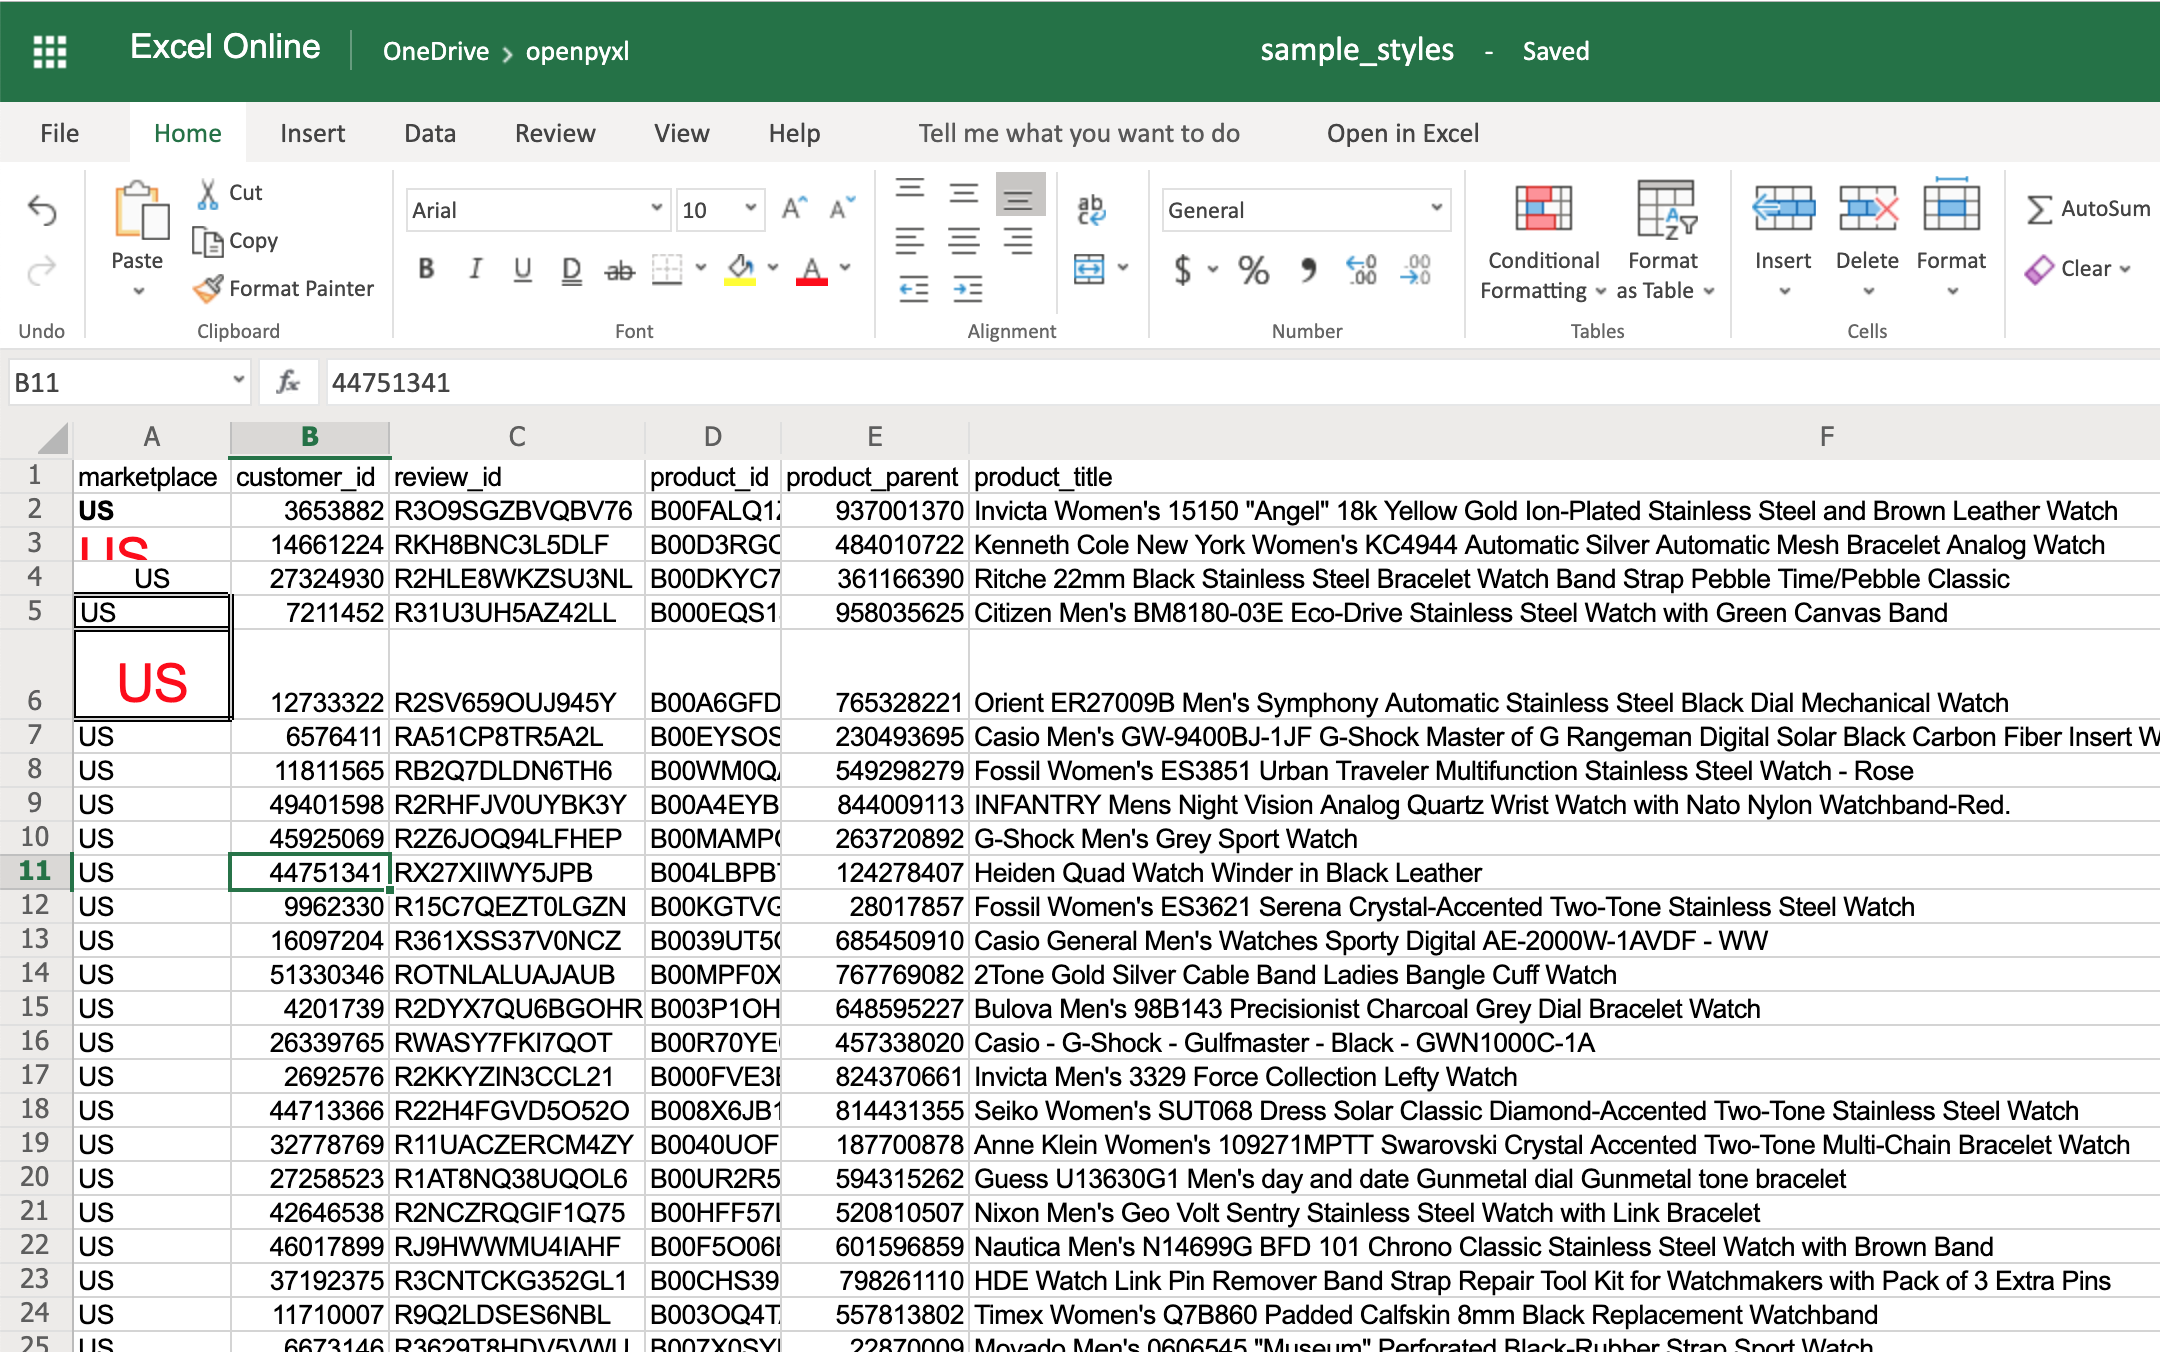
You can also combine styles by simply adding them to the cell at the same time:
>>>
>>> # Reusing the same styles from the example above
>>> sheet["A6"].alignment = center_aligned_text
>>> sheet["A6"].font = big_red_text
>>> sheet["A6"].border = square_border
>>> workbook.save(filename="sample_styles.xlsx")
Have a look at cell A6 here:
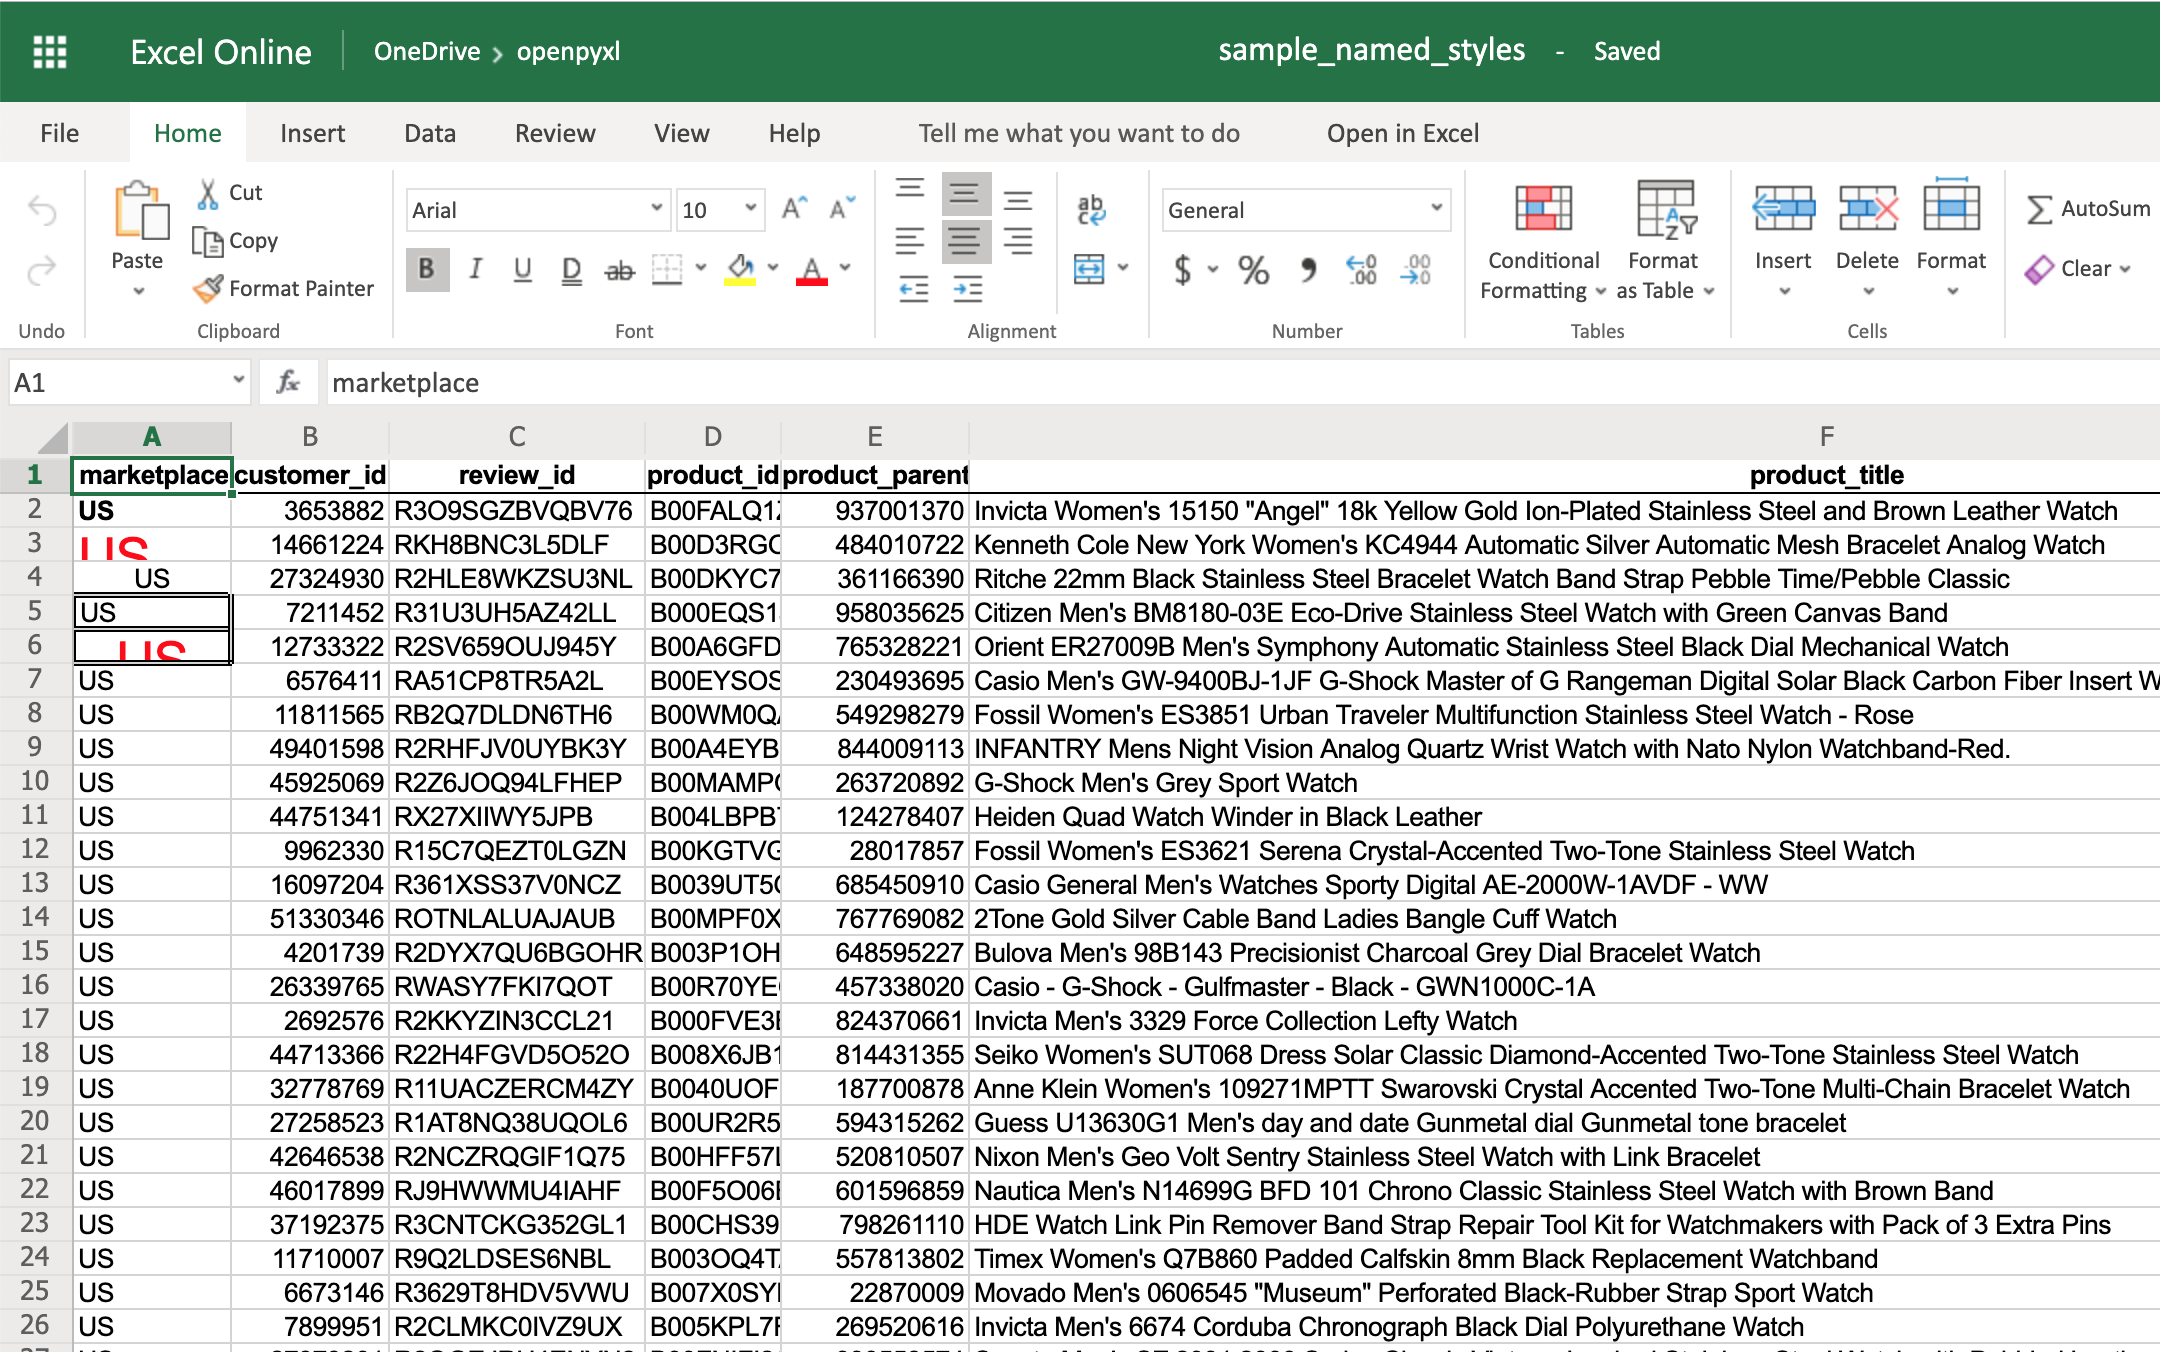
When you want to apply multiple styles to one or several cells, you can use a NamedStyle class instead, which is like a style template that you can use over and over again. Have a look at the example below:
>>>
>>> from openpyxl.styles import NamedStyle

>>> # Let's create a style template for the header row
>>> header = NamedStyle(name="header")
>>> header.font = Font(bold=True)
>>> header.border = Border(bottom=Side(border_style="thin"))
>>> header.alignment = Alignment(horizontal="center", vertical="center")

>>> # Now let's apply this to all first row (header) cells
>>> header_row = sheet[1]
>>> for cell in header_row:
...     cell.style = header

>>> workbook.save(filename="sample_styles.xlsx")
If you open the spreadsheet now, you should see that its first row is bold, the text is aligned to the center, and there’s a small bottom border! Have a look below:
As you saw above, there are many options when it comes to styling, and it depends on the use case, so feel free to check openpyxl documentation and see what other things you can do.
Conditional Formatting
This feature is one of my personal favorites when it comes to adding styles to a spreadsheet.
It’s a much more powerful approach to styling because it dynamically applies styles according to how the data in the spreadsheet changes.
In a nutshell, conditional formatting allows you to specify a list of styles to apply to a cell (or cell range) according to specific conditions.
For example, a widespread use case is to have a balance sheet where all the negative totals are in red, and the positive ones are in green. This formatting makes it much more efficient to spot good vs bad periods.
Without further ado, let’s pick our favorite spreadsheet—sample.xlsx—and add some conditional formatting.
You can start by adding a simple one that adds a red background to all reviews with less than 3 stars:
>>>
>>> from openpyxl.styles import PatternFill
>>> from openpyxl.styles.differential import DifferentialStyle
>>> from openpyxl.formatting.rule import Rule

>>> red_background = PatternFill(fgColor="00FF0000")
>>> diff_style = DifferentialStyle(fill=red_background)
>>> rule = Rule(type="expression", dxf=diff_style)
>>> rule.formula = ["$H1<3"]
>>> sheet.conditional_formatting.add("A1:O100", rule)
>>> workbook.save("sample_conditional_formatting.xlsx")
Now you’ll see all the reviews with a star rating below 3 marked with a red background:

Code-wise, the only things that are new here are the objects DifferentialStyle and Rule:
DifferentialStyleis quite similar toNamedStyle, which you already saw above, and it’s used to aggregate multiple styles such as fonts, borders, alignment, and so forth.Ruleis responsible for selecting the cells and applying the styles if the cells match the rule’s logic.
Using a Rule object, you can create numerous conditional formatting scenarios.
However, for simplicity sake, the openpyxl package offers 3 built-in formats that make it easier to create a few common conditional formatting patterns. These built-ins are:
ColorScaleIconSetDataBar
The ColorScale gives you the ability to create color gradients:
>>>
>>> from openpyxl.formatting.rule import ColorScaleRule
>>> color_scale_rule = ColorScaleRule(start_type="min",
...                                   start_color="00FF0000",  # Red
...                                   end_type="max",
...                                   end_color="0000FF00")  # Green

>>> # Again, let's add this gradient to the star ratings, column "H"
>>> sheet.conditional_formatting.add("H2:H100", color_scale_rule)
>>> workbook.save(filename="sample_conditional_formatting_color_scale.xlsx")
Now you should see a color gradient on column H, from red to green, according to the star rating:

You can also add a third color and make two gradients instead:
>>>
>>> from openpyxl.formatting.rule import ColorScaleRule
>>> color_scale_rule = ColorScaleRule(start_type="num",
...                                   start_value=1,
...                                   start_color="00FF0000",  # Red
...                                   mid_type="num",
...                                   mid_value=3,
...                                   mid_color="00FFFF00",  # Yellow
...                                   end_type="num",
...                                   end_value=5,
...                                   end_color="0000FF00")  # Green

>>> # Again, let's add this gradient to the star ratings, column "H"
>>> sheet.conditional_formatting.add("H2:H100", color_scale_rule)
>>> workbook.save(filename="sample_conditional_formatting_color_scale_3.xlsx")
This time, you’ll notice that star ratings between 1 and 3 have a gradient from red to yellow, and star ratings between 3 and 5 have a gradient from yellow to green:

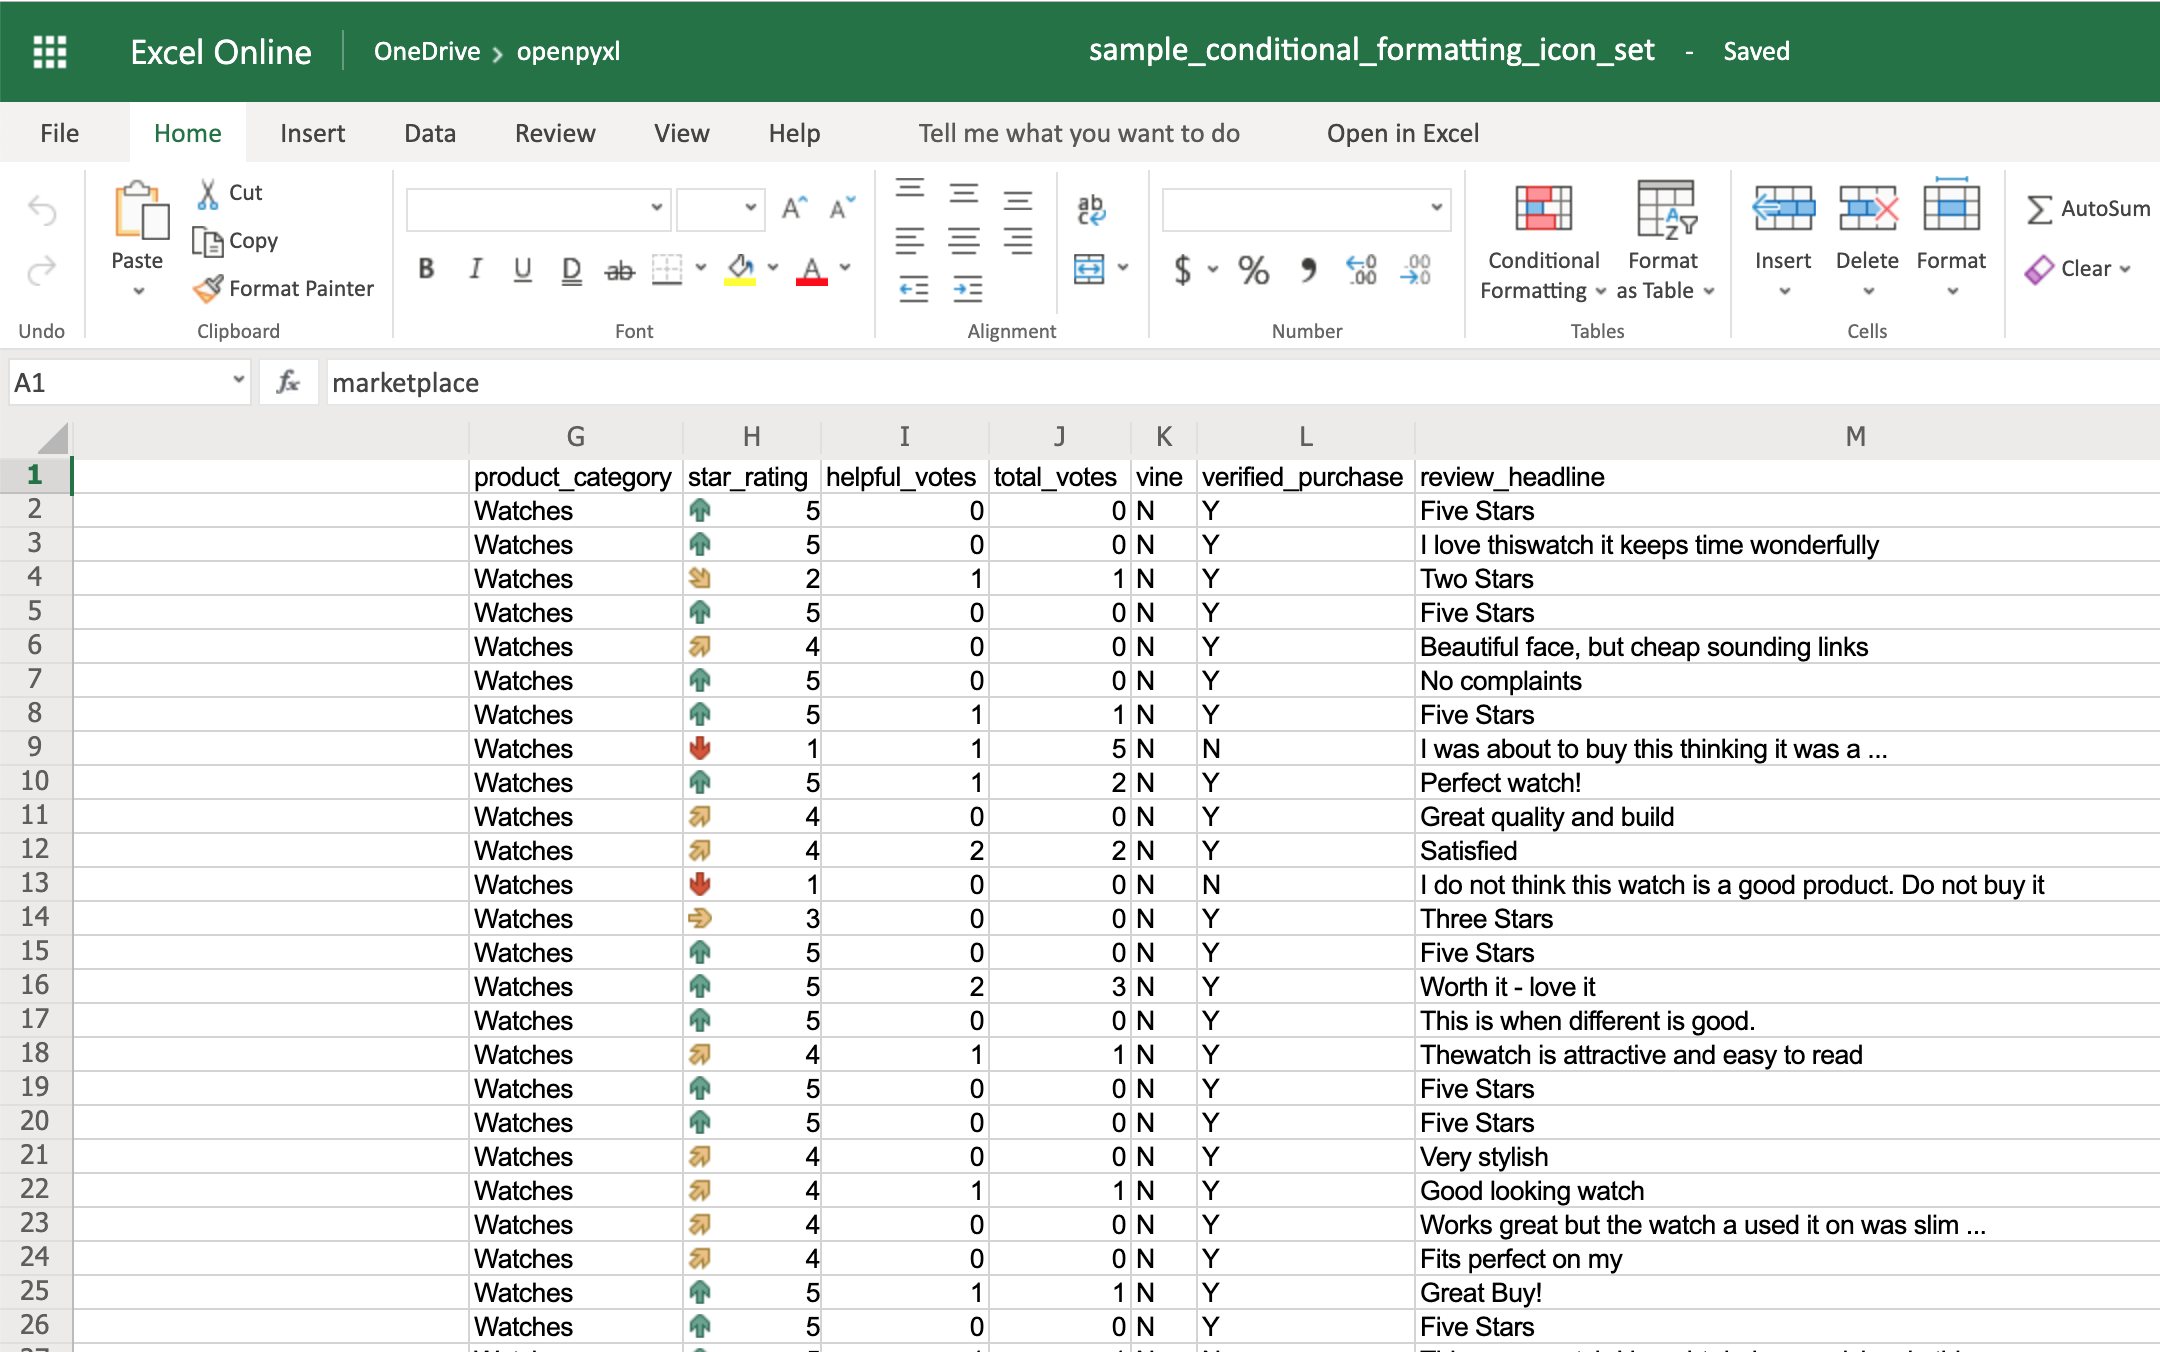
The IconSet allows you to add an icon to the cell according to its value:
>>>
>>> from openpyxl.formatting.rule import IconSetRule

>>> icon_set_rule = IconSetRule("5Arrows", "num", [1, 2, 3, 4, 5])
>>> sheet.conditional_formatting.add("H2:H100", icon_set_rule)
>>> workbook.save("sample_conditional_formatting_icon_set.xlsx")
You’ll see a colored arrow next to the star rating. This arrow is red and points down when the value of the cell is 1 and, as the rating gets better, the arrow starts pointing up and becomes green:
The openpyxl package has a full list of other icons you can use, besides the arrow.
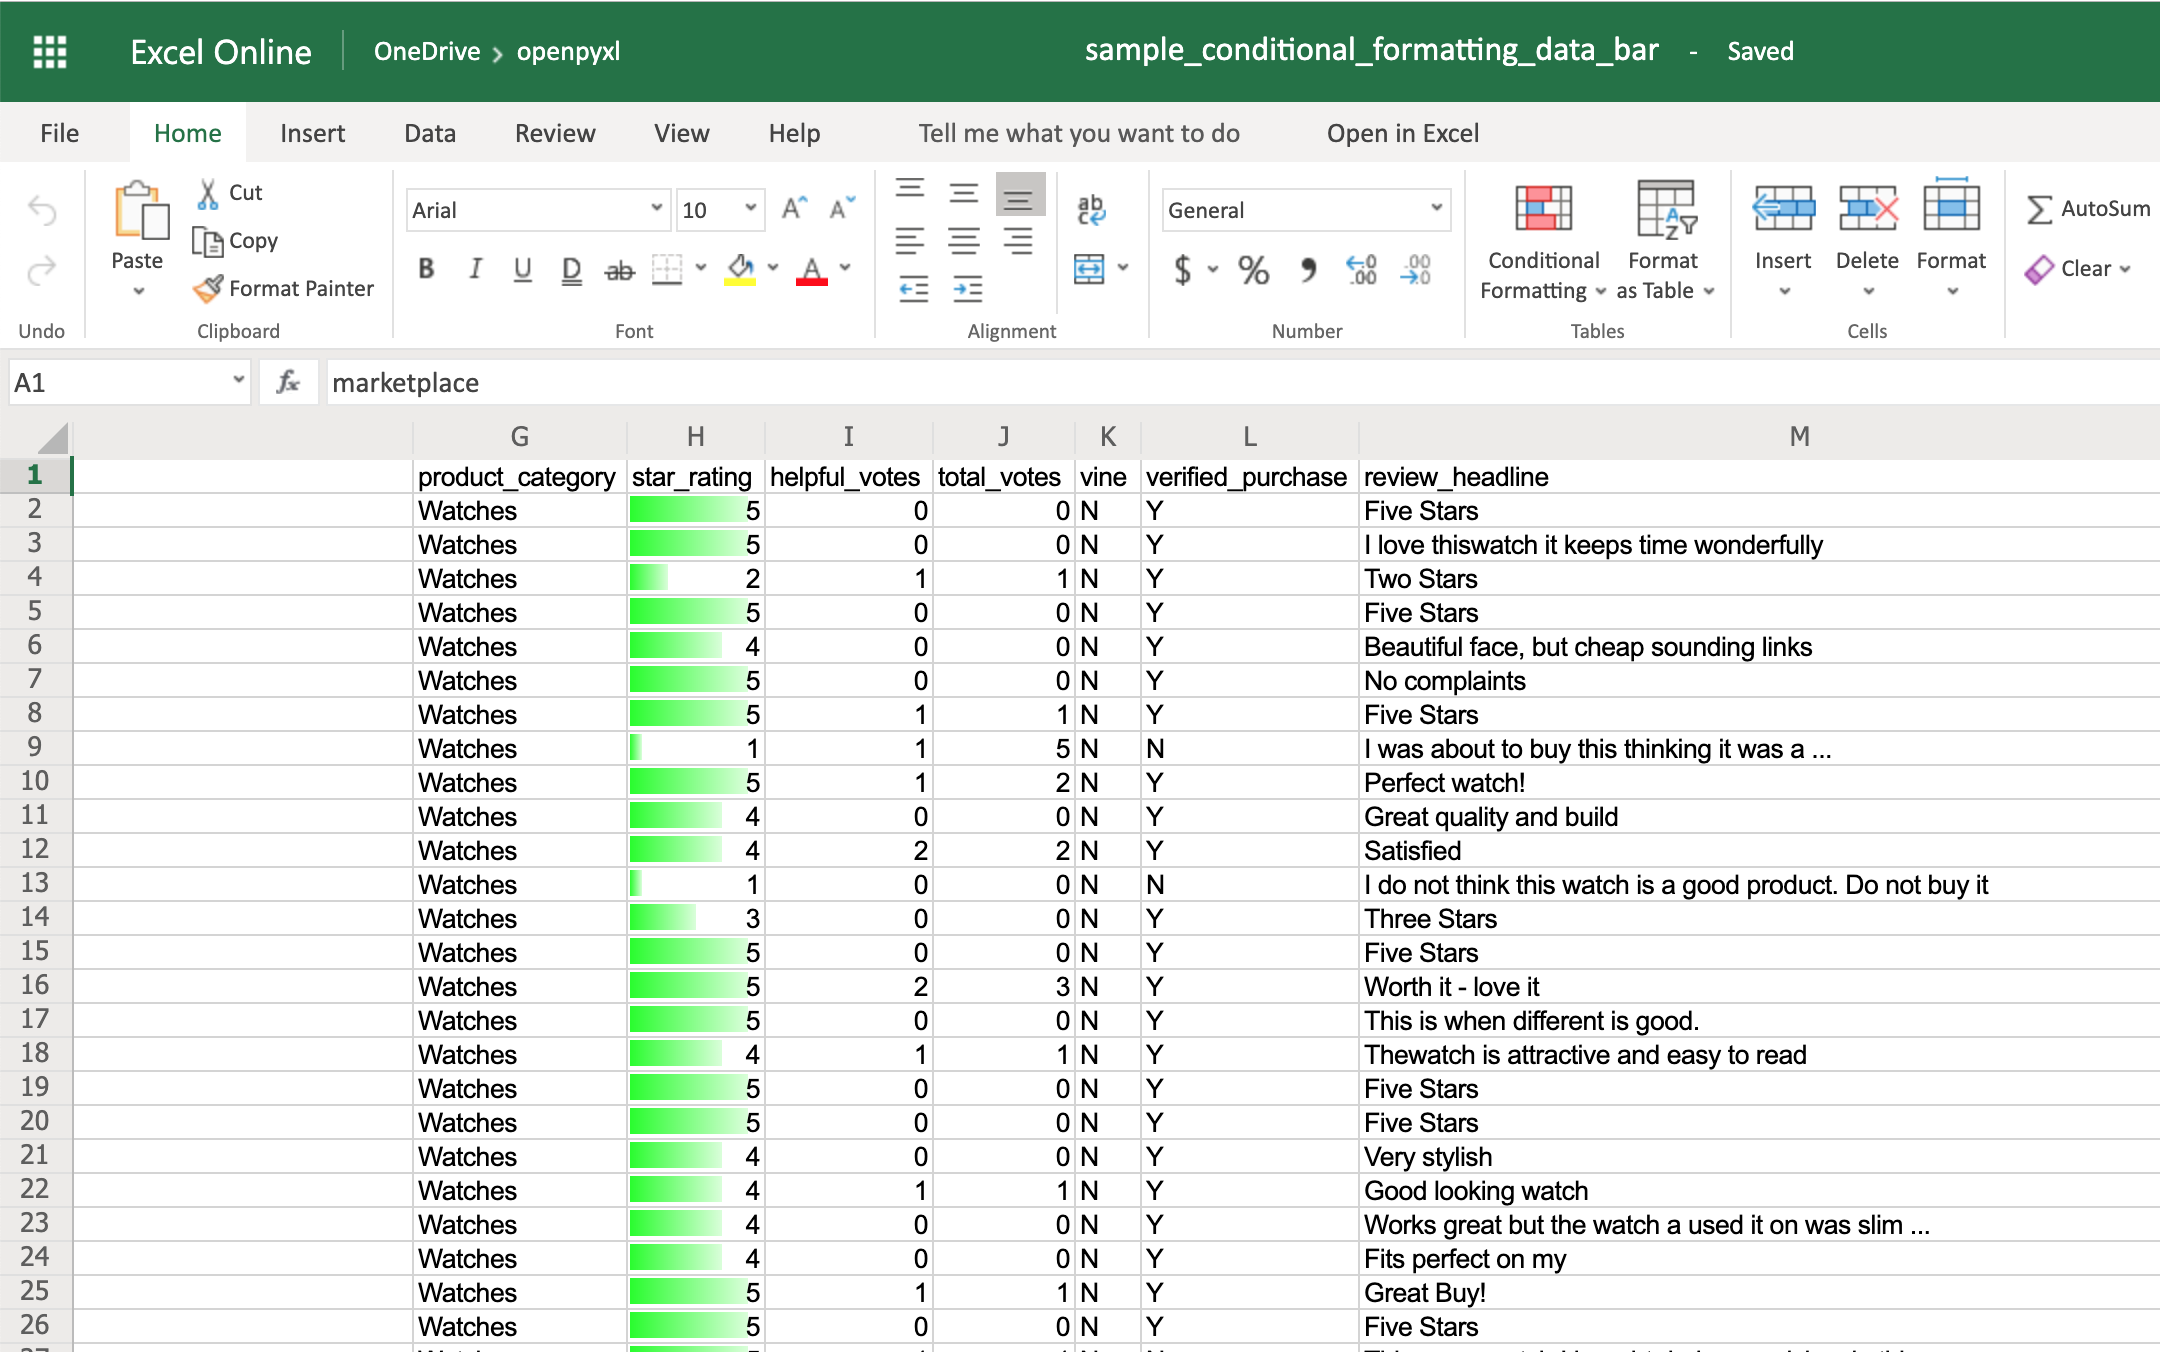
Finally, the DataBar allows you to create progress bars:
>>>
>>> from openpyxl.formatting.rule import DataBarRule

>>> data_bar_rule = DataBarRule(start_type="num",
...                             start_value=1,
...                             end_type="num",
...                             end_value="5",
...                             color="0000FF00")  # Green
>>> sheet.conditional_formatting.add("H2:H100", data_bar_rule)
>>> workbook.save("sample_conditional_formatting_data_bar.xlsx")
You’ll now see a green progress bar that gets fuller the closer the star rating is to the number 5:
As you can see, there are a lot of cool things you can do with conditional formatting.
Here, you saw only a few examples of what you can achieve with it, but check the openpyxl documentation to see a bunch of other options.
Adding Images
Even though images are not something that you’ll often see in a spreadsheet, it’s quite cool to be able to add them. Maybe you can use it for branding purposes or to make spreadsheets more personal.
To be able to load images to a spreadsheet using openpyxl, you’ll have to install Pillow:
Apart from that, you’ll also need an image. For this example, you can grab the Real Python logo below and convert it from .webp to .png using an online converter such as cloudconvert.com, save the final file as logo.png, and copy it to the root folder where you’re running your examples:
![]()
Afterward, this is the code you need to import that image into the hello_word.xlsx spreadsheet:
from openpyxl import load_workbook
from openpyxl.drawing.image import Image

# Let's use the hello_world spreadsheet since it has less data
workbook = load_workbook(filename="hello_world.xlsx")
sheet = workbook.active

logo = Image("logo.png")

# A bit of resizing to not fill the whole spreadsheet with the logo
logo.height = 150
logo.width = 150

sheet.add_image(logo, "A3")
workbook.save(filename="hello_world_logo.xlsx")
You have an image on your spreadsheet! Here it is:
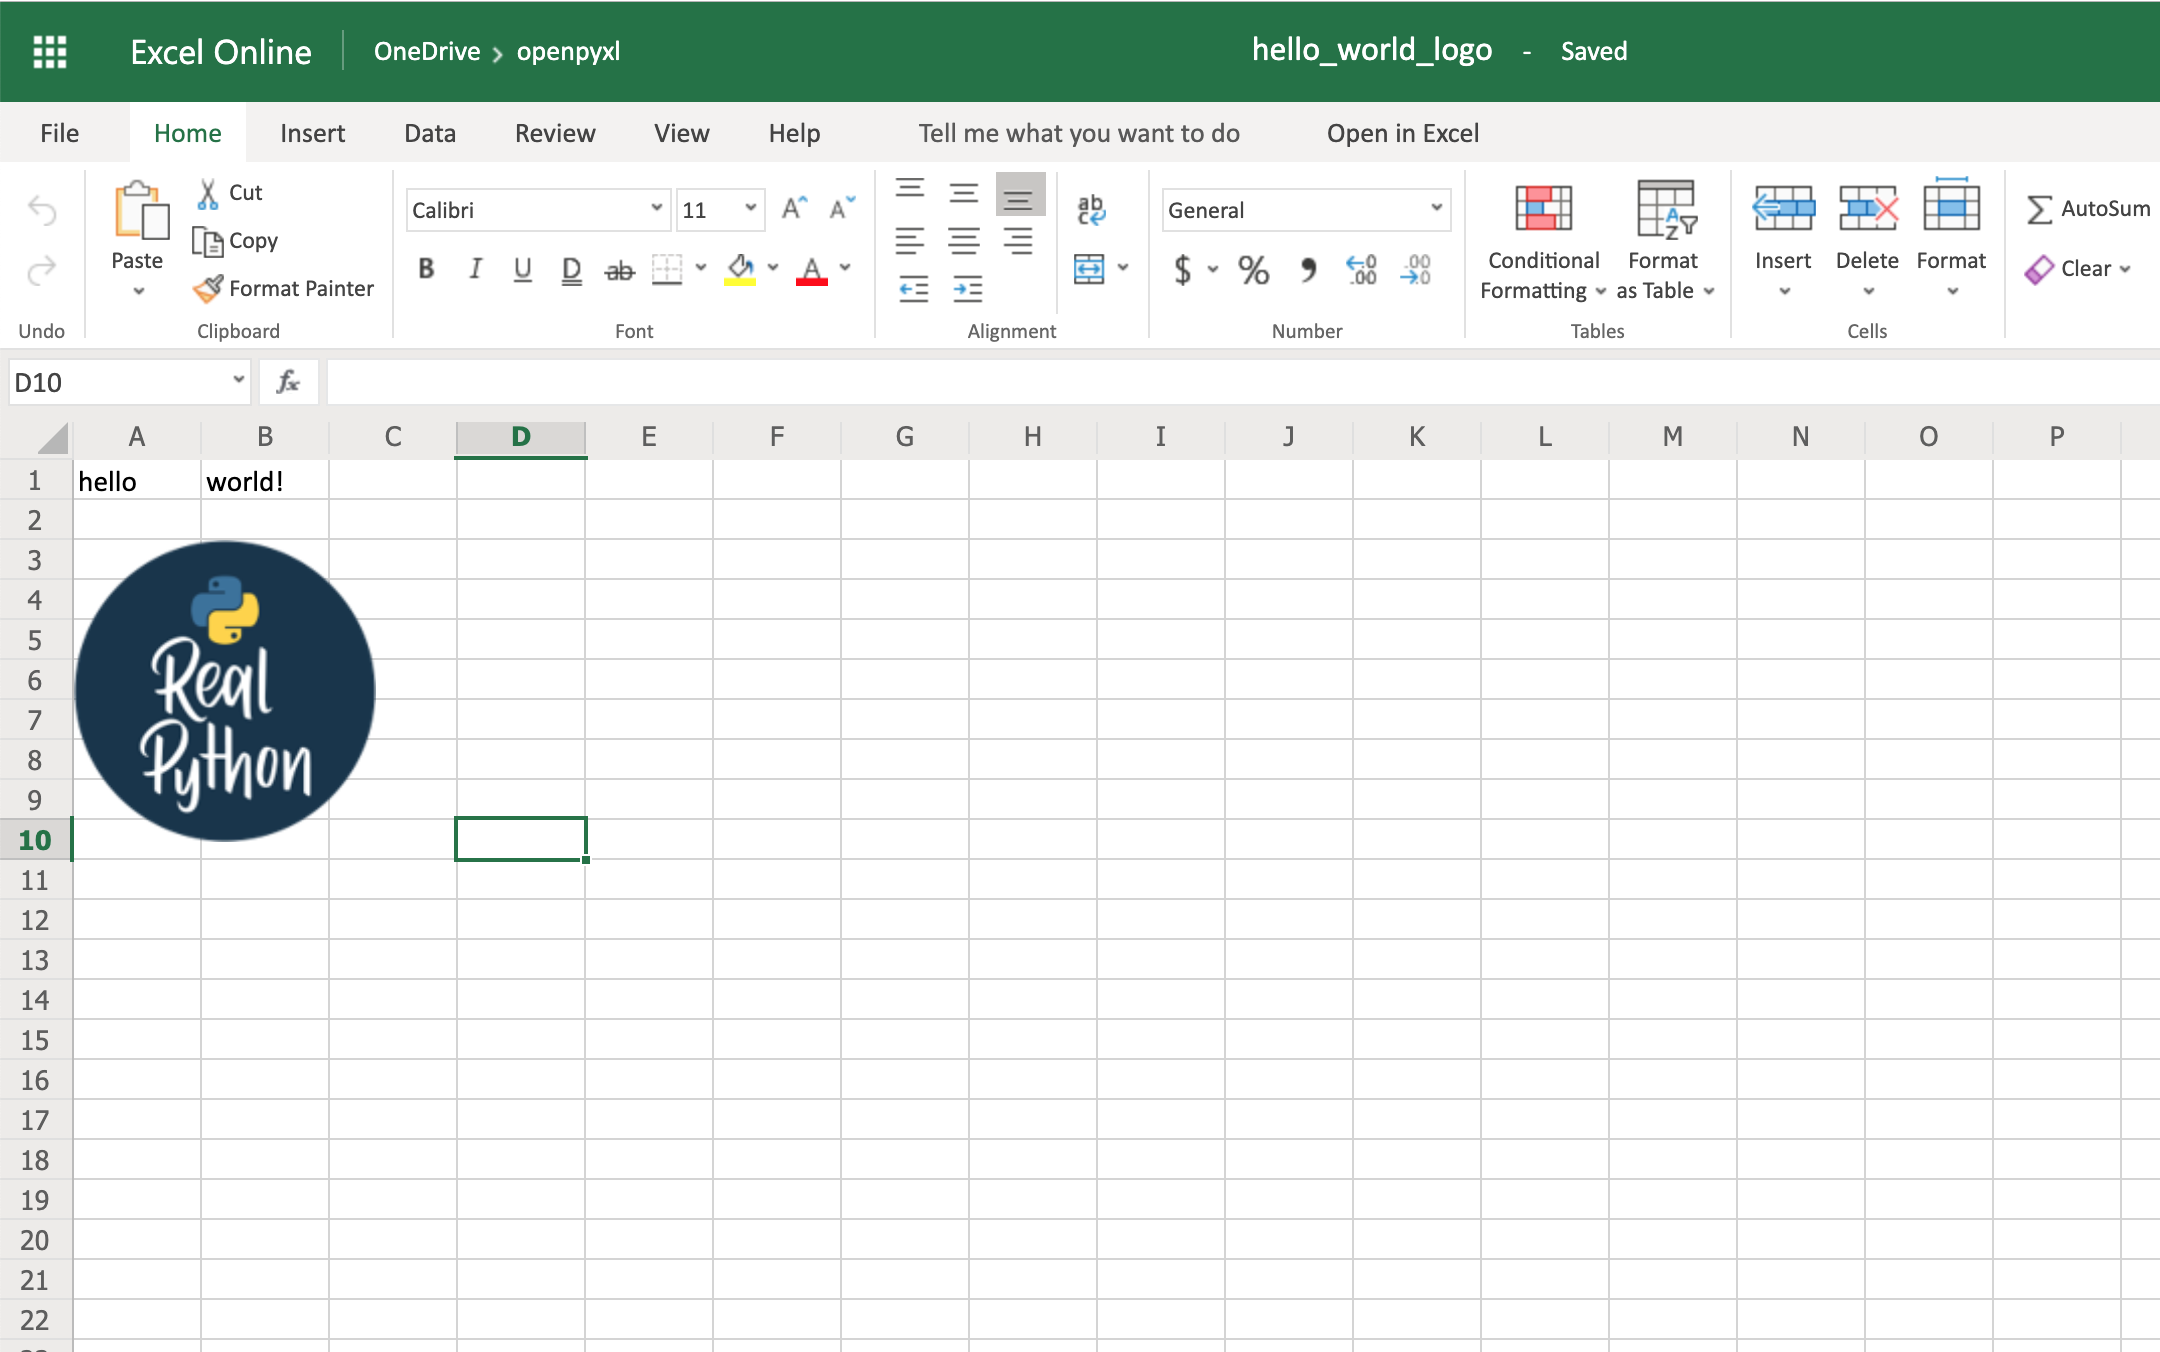
The image’s left top corner is on the cell you chose, in this case, A3.
Adding Pretty Charts
Another powerful thing you can do with spreadsheets is create an incredible variety of charts.
Charts are a great way to visualize and understand loads of data quickly. There are a lot of different chart types: bar chart, pie chart, line chart, and so on. openpyxl has support for a lot of them.
Here, you’ll see only a couple of examples of charts because the theory behind it is the same for every single chart type:
For any chart you want to build, you’ll need to define the chart type: BarChart, LineChart, and so forth, plus the data to be used for the chart, which is called Reference.
Before you can build your chart, you need to define what data you want to see represented in it. Sometimes, you can use the dataset as is, but other times you need to massage the data a bit to get additional information.
Let’s start by building a new workbook with some sample data:
 1from openpyxl import Workbook
 2from openpyxl.chart import BarChart, Reference
 3
 4workbook = Workbook()
 5sheet = workbook.active
 6
 7# Let's create some sample sales data
 8rows = [
 9    ["Product", "Online", "Store"],
10    [1, 30, 45],
11    [2, 40, 30],
12    [3, 40, 25],
13    [4, 50, 30],
14    [5, 30, 25],
15    [6, 25, 35],
16    [7, 20, 40],
17]
18
19for row in rows:
20    sheet.append(row)
Now you’re going to start by creating a bar chart that displays the total number of sales per product:
22chart = BarChart()
23data = Reference(worksheet=sheet,
24                 min_row=1,
25                 max_row=8,
26                 min_col=2,
27                 max_col=3)
28
29chart.add_data(data, titles_from_data=True)
30sheet.add_chart(chart, "E2")
31
32workbook.save("chart.xlsx")
There you have it. Below, you can see a very straightforward bar chart showing the difference between online product sales online and in-store product sales:
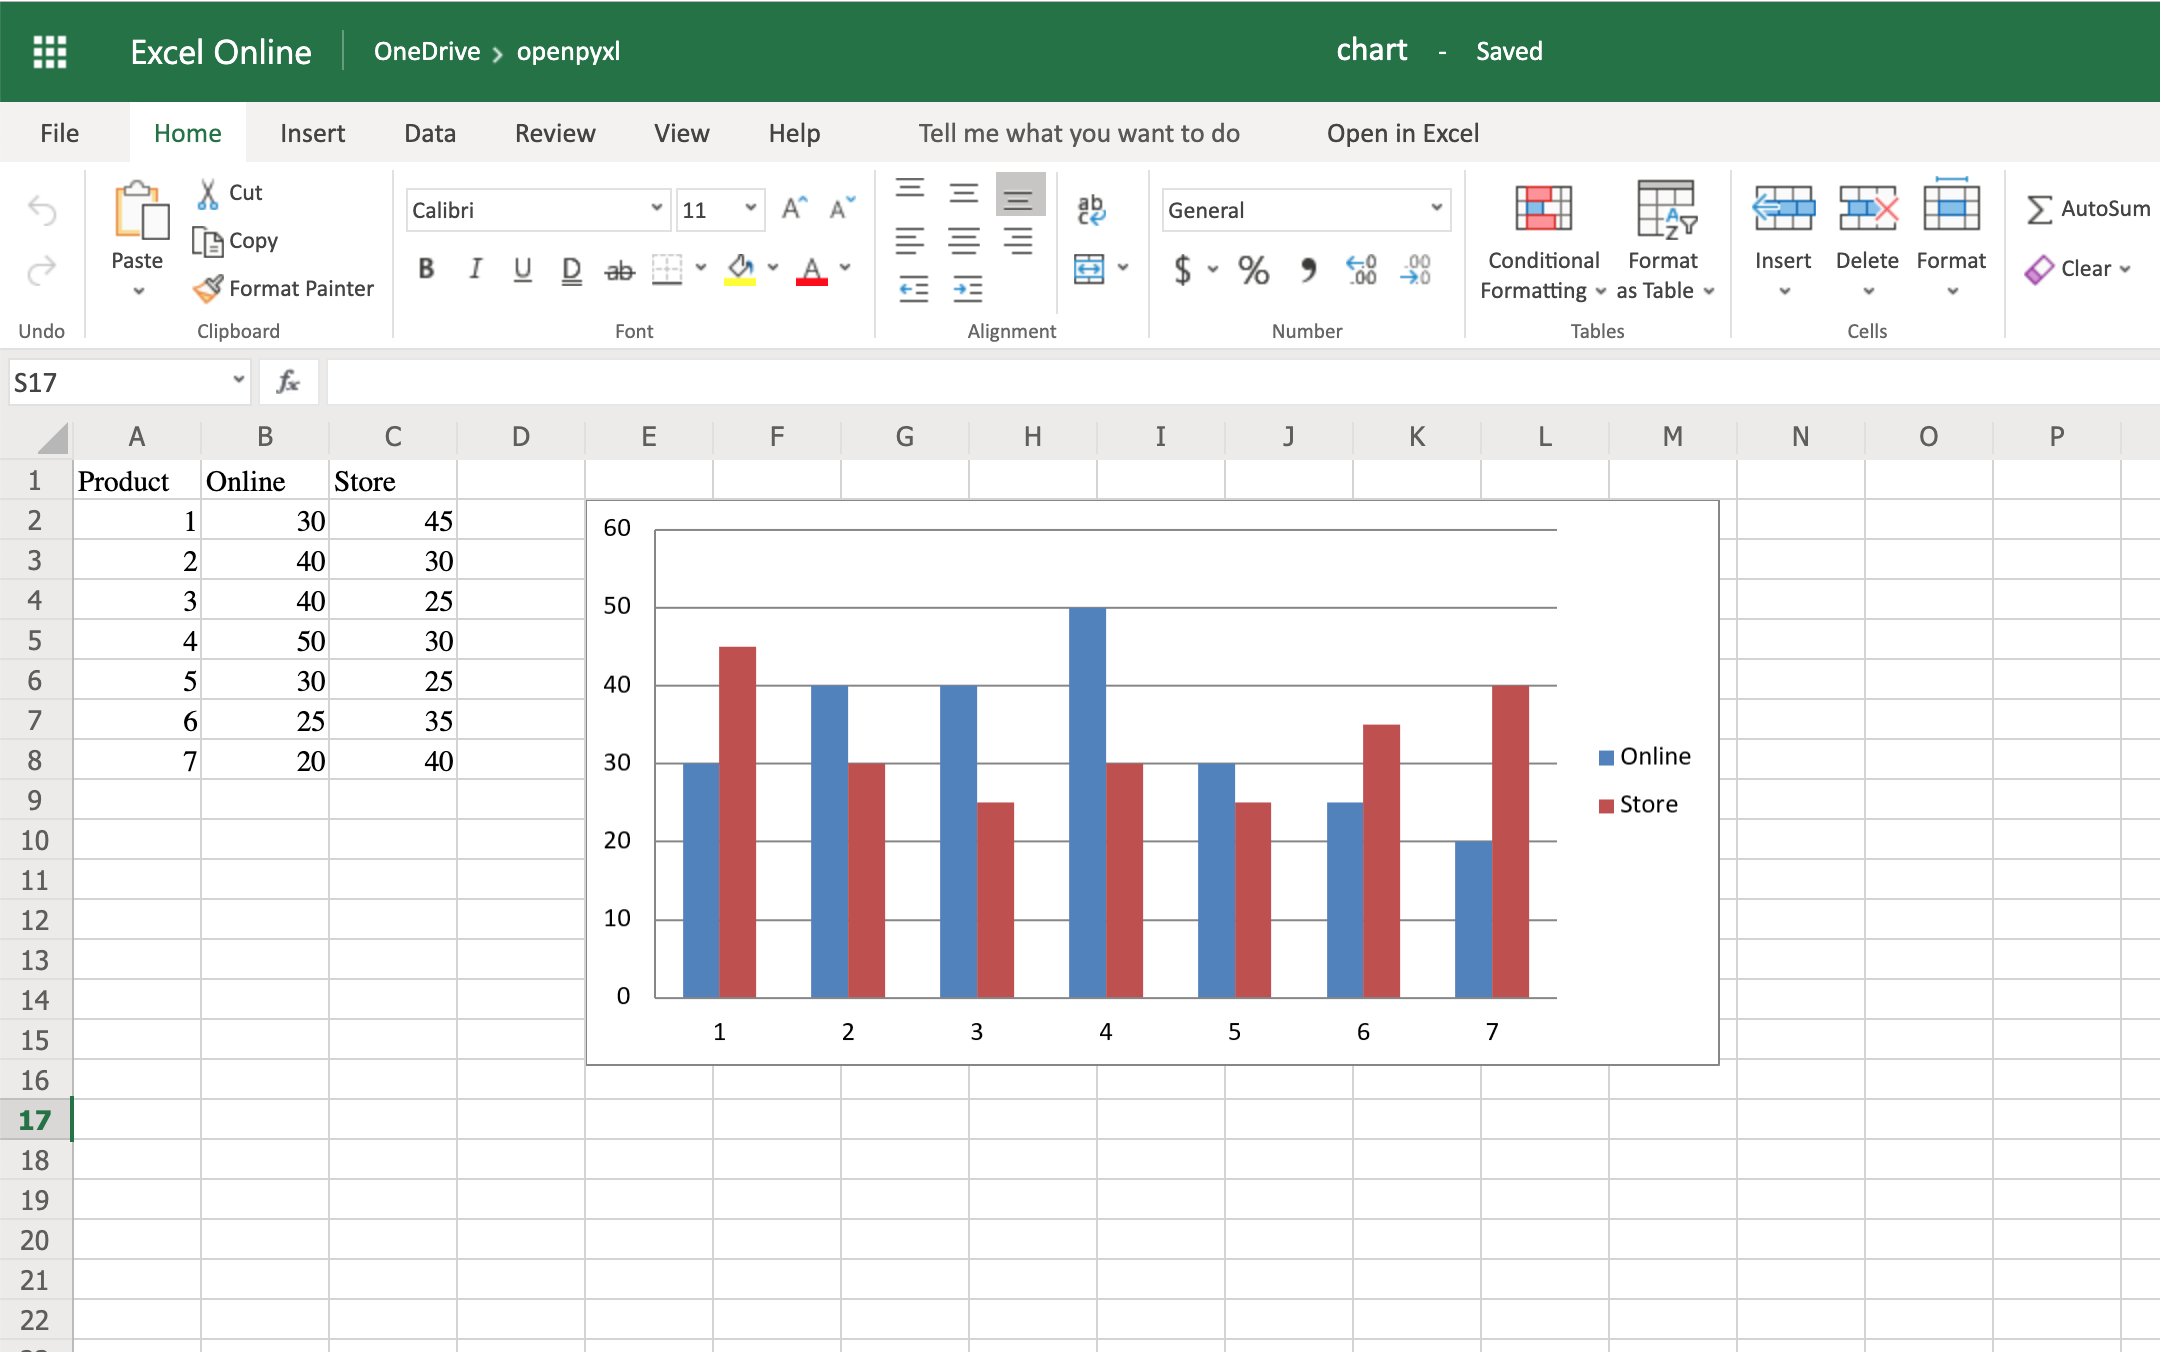
Like with images, the top left corner of the chart is on the cell you added the chart to. In your case, it was on cell E2.
Try creating a line chart instead, changing the data a bit:
 1import random
 2from openpyxl import Workbook
 3from openpyxl.chart import LineChart, Reference
 4
 5workbook = Workbook()
 6sheet = workbook.active
 7
 8# Let's create some sample sales data
 9rows = [
10    ["", "January", "February", "March", "April",
11    "May", "June", "July", "August", "September",
12     "October", "November", "December"],
13    [1, ],
14    [2, ],
15    [3, ],
16]
17
18for row in rows:
19    sheet.append(row)
20
21for row in sheet.iter_rows(min_row=2,
22                           max_row=4,
23                           min_col=2,
24                           max_col=13):
25    for cell in row:
26        cell.value = random.randrange(5, 100)
With the above code, you’ll be able to generate some random data regarding the sales of 3 different products across a whole year.
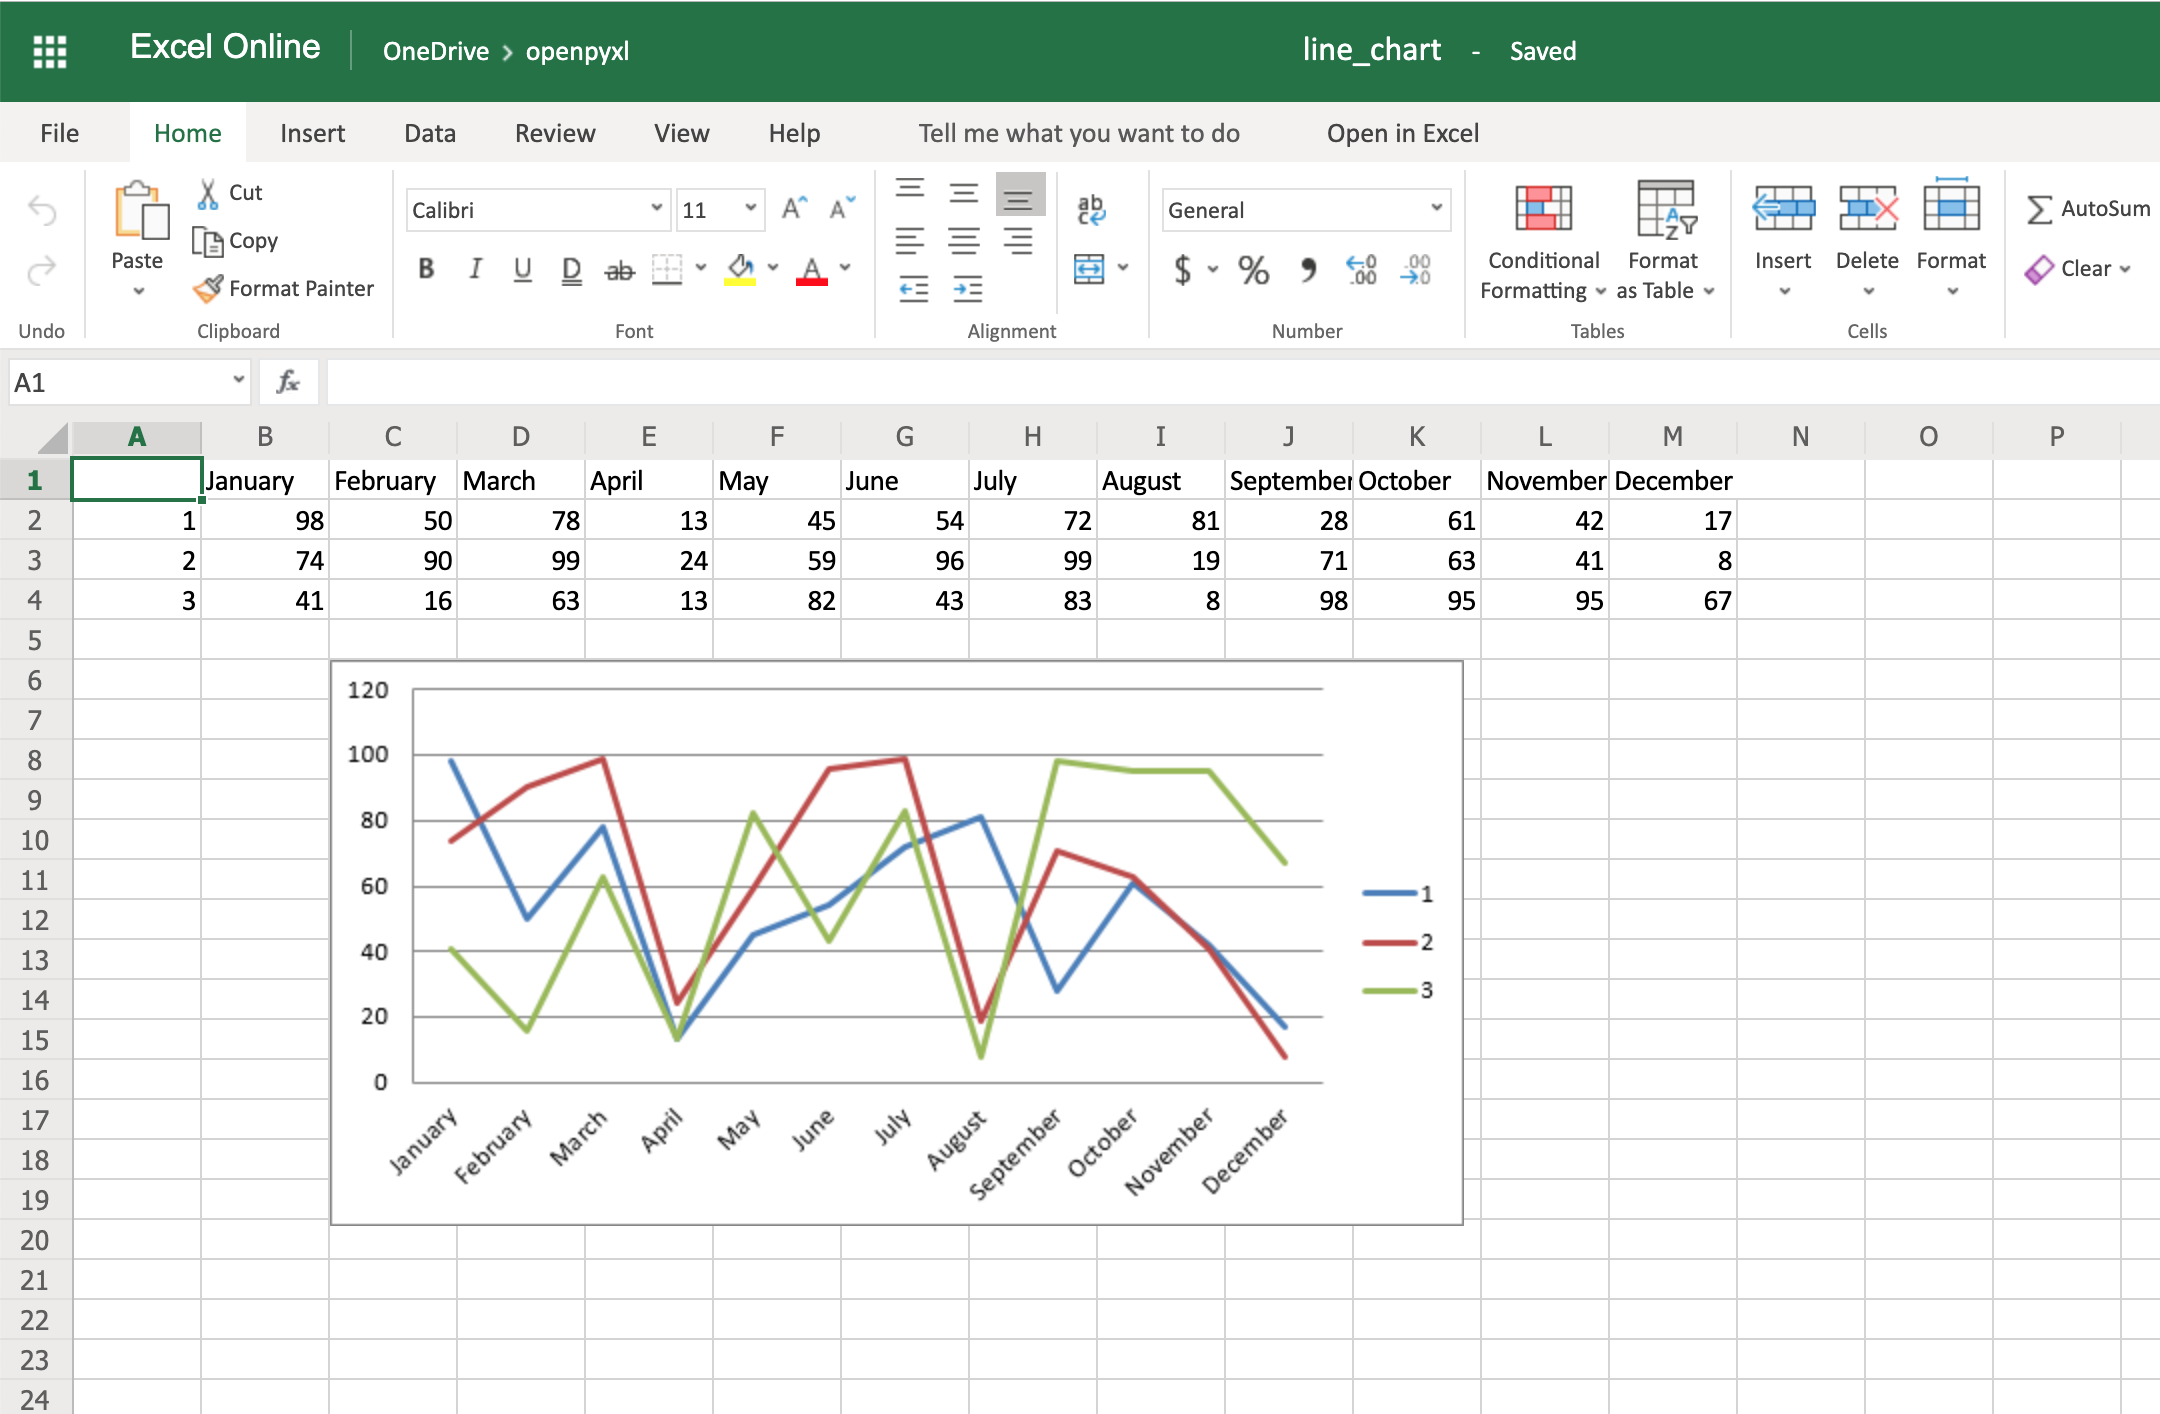
Once that’s done, you can very easily create a line chart with the following code:
28chart = LineChart()
29data = Reference(worksheet=sheet,
30                 min_row=2,
31                 max_row=4,
32                 min_col=1,
33                 max_col=13)
34
35chart.add_data(data, from_rows=True, titles_from_data=True)
36sheet.add_chart(chart, "C6")
37
38workbook.save("line_chart.xlsx")
Here’s the outcome of the above piece of code:

One thing to keep in mind here is the fact that you’re using from_rows=True when adding the data. This argument makes the chart plot row by row instead of column by column.
In your sample data, you see that each product has a row with 12 values (1 column per month). That’s why you use from_rows. If you don’t pass that argument, by default, the chart tries to plot by column, and you’ll get a month-by-month comparison of sales.
Another difference that has to do with the above argument change is the fact that our Reference now starts from the first column, min_col=1, instead of the second one. This change is needed because the chart now expects the first column to have the titles.
There are a couple of other things you can also change regarding the style of the chart. For example, you can add specific categories to the chart:
cats = Reference(worksheet=sheet,
                 min_row=1,
                 max_row=1,
                 min_col=2,
                 max_col=13)
chart.set_categories(cats)
Add this piece of code before saving the workbook, and you should see the month names appearing instead of numbers:
Code-wise, this is a minimal change. But in terms of the readability of the spreadsheet, this makes it much easier for someone to open the spreadsheet and understand the chart straight away.
Another thing you can do to improve the chart readability is to add an axis. You can do it using the attributes x_axis and y_axis:
chart.x_axis.title = "Months"
chart.y_axis.title = "Sales (per unit)"
This will generate a spreadsheet like the below one:
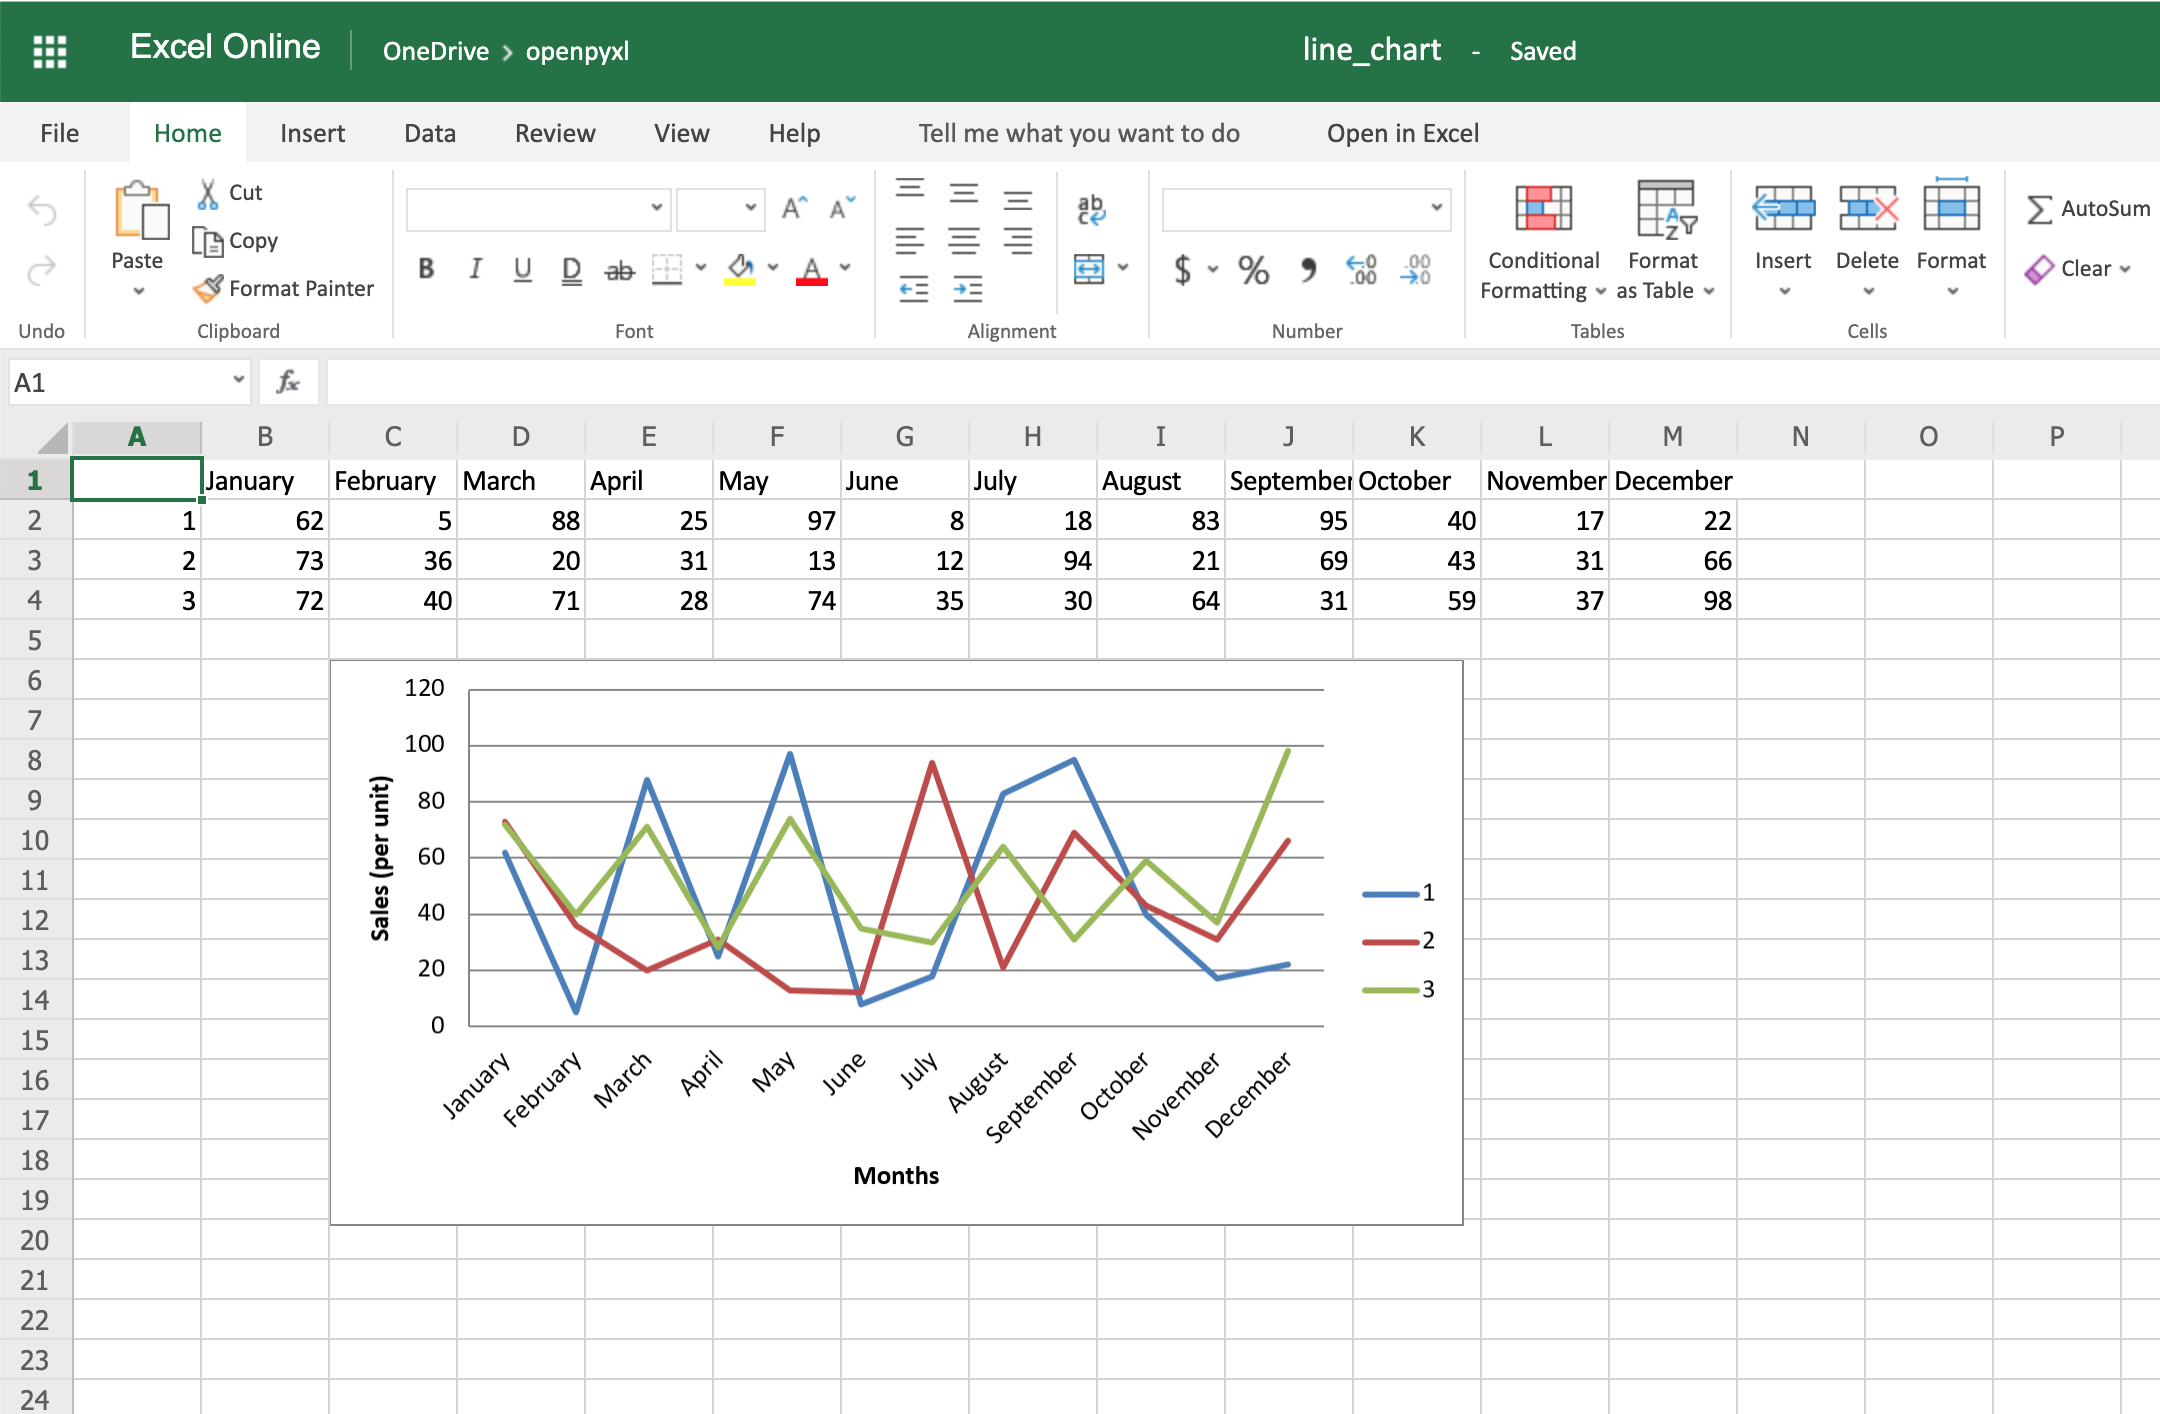
As you can see, small changes like the above make reading your chart a much easier and quicker task.
There is also a way to style your chart by using Excel’s default ChartStyle property. In this case, you have to choose a number between 1 and 48. Depending on your choice, the colors of your chart change as well:
# You can play with this by choosing any number between 1 and 48
chart.style = 24
With the style selected above, all lines have some shade of orange:

There is no clear documentation on what each style number looks like, but this spreadsheet has a few examples of the styles available.
Here’s the full code used to generate the line chart with categories, axis titles, and style:
import random
from openpyxl import Workbook
from openpyxl.chart import LineChart, Reference

workbook = Workbook()
sheet = workbook.active

# Let's create some sample sales data
rows = [
    ["", "January", "February", "March", "April",
    "May", "June", "July", "August", "September",
     "October", "November", "December"],
    [1, ],
    [2, ],
    [3, ],
]

for row in rows:
    sheet.append(row)

for row in sheet.iter_rows(min_row=2,
                           max_row=4,
                           min_col=2,
                           max_col=13):
    for cell in row:
        cell.value = random.randrange(5, 100)

# Create a LineChart and add the main data
chart = LineChart()
data = Reference(worksheet=sheet,
                           min_row=2,
                           max_row=4,
                           min_col=1,
                           max_col=13)
chart.add_data(data, titles_from_data=True, from_rows=True)

# Add categories to the chart
cats = Reference(worksheet=sheet,
                 min_row=1,
                 max_row=1,
                 min_col=2,
                 max_col=13)
chart.set_categories(cats)

# Rename the X and Y Axis
chart.x_axis.title = "Months"
chart.y_axis.title = "Sales (per unit)"

# Apply a specific Style
chart.style = 24

# Save!
sheet.add_chart(chart, "C6")
workbook.save("line_chart.xlsx")
There are a lot more chart types and customization you can apply, so be sure to check out the package documentation on this if you need some specific formatting.
Convert Python Classes to Excel Spreadsheet
You already saw how to convert an Excel spreadsheet’s data into Python classes, but now let’s do the opposite.
Let’s imagine you have a database and are using some Object-Relational Mapping (ORM) to map DB objects into Python classes. Now, you want to export those same objects into a spreadsheet.
Let’s assume the following data classes to represent the data coming from your database regarding product sales:
from dataclasses import dataclass
from typing import List

@dataclass
class Sale:
    quantity: int

@dataclass
class Product:
    id: str
    name: str
    sales: List[Sale]
Now, let’s generate some random data, assuming the above classes are stored in a db_classes.py file:
 1import random
 2
 3# Ignore these for now. You'll use them in a sec ;)
 4from openpyxl import Workbook
 5from openpyxl.chart import LineChart, Reference
 6
 7from db_classes import Product, Sale
 8
 9products = []
10
11# Let's create 5 products
12for idx in range(1, 6):
13    sales = []
14
15    # Create 5 months of sales
16    for _ in range(5):
17        sale = Sale(quantity=random.randrange(5, 100))
18        sales.append(sale)
19
20    product = Product(id=str(idx),
21                      name="Product %s" % idx,
22                      sales=sales)
23    products.append(product)
By running this piece of code, you should get 5 products with 5 months of sales with a random quantity of sales for each month.
Now, to convert this into a spreadsheet, you need to iterate over the data and append it to the spreadsheet:
25workbook = Workbook()
26sheet = workbook.active
27
28# Append column names first
29sheet.append(["Product ID", "Product Name", "Month 1",
30              "Month 2", "Month 3", "Month 4", "Month 5"])
31
32# Append the data
33for product in products:
34    data = [product.id, product.name]
35    for sale in product.sales:
36        data.append(sale.quantity)
37    sheet.append(data)
That’s it. That should allow you to create a spreadsheet with some data coming from your database.
However, why not use some of that cool knowledge you gained recently to add a chart as well to display that data more visually?
All right, then you could probably do something like this:
38chart = LineChart()
39data = Reference(worksheet=sheet,
40                 min_row=2,
41                 max_row=6,
42                 min_col=2,
43                 max_col=7)
44
45chart.add_data(data, titles_from_data=True, from_rows=True)
46sheet.add_chart(chart, "B8")
47
48cats = Reference(worksheet=sheet,
49                 min_row=1,
50                 max_row=1,
51                 min_col=3,
52                 max_col=7)
53chart.set_categories(cats)
54
55chart.x_axis.title = "Months"
56chart.y_axis.title = "Sales (per unit)"
57
58workbook.save(filename="oop_sample.xlsx")
Now we’re talking! Here’s a spreadsheet generated from database objects and with a chart and everything:

That’s a great way for you to wrap up your new knowledge of charts!
Bonus: Working With Pandas
Even though you can use Pandas to handle Excel files, there are few things that you either can’t accomplish with Pandas or that you’d be better off just using openpyxl directly.
For example, some of the advantages of using openpyxl are the ability to easily customize your spreadsheet with styles, conditional formatting, and such.
But guess what, you don’t have to worry about picking. In fact, openpyxl has support for both converting data from a Pandas DataFrame into a workbook or the opposite, converting an openpyxl workbook into a Pandas DataFrame.
First things first, remember to install the pandas package:
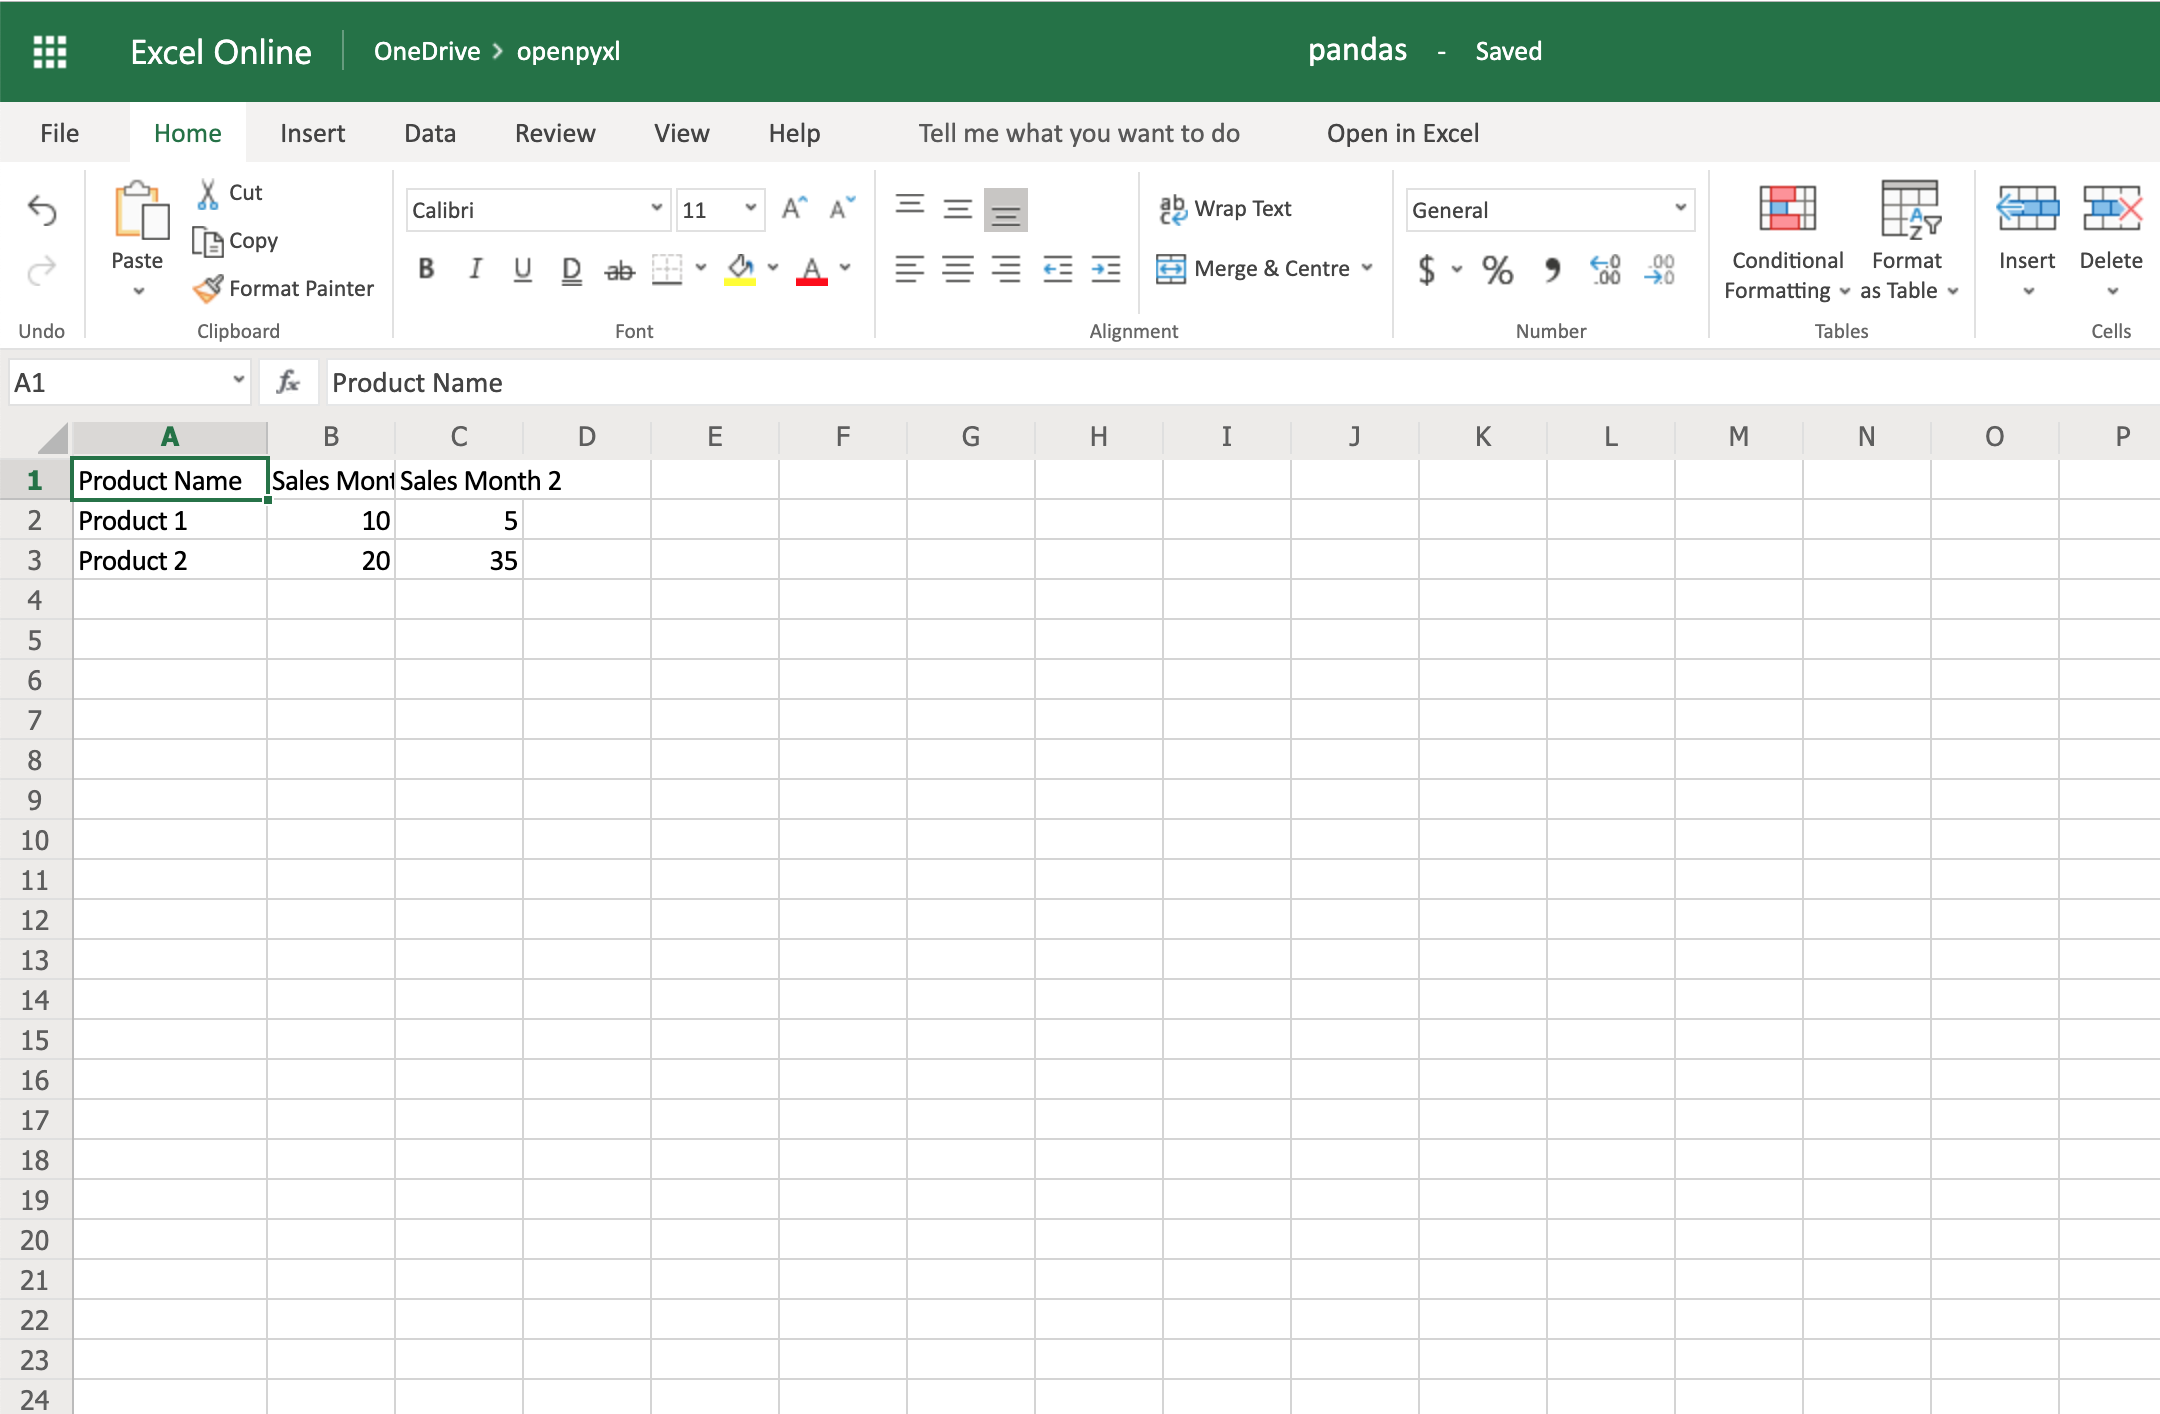
Then, let’s create a sample DataFrame:
 1import pandas as pd
 2
 3data = {
 4    "Product Name": ["Product 1", "Product 2"],
 5    "Sales Month 1": [10, 20],
 6    "Sales Month 2": [5, 35],
 7}
 8df = pd.DataFrame(data)
Now that you have some data, you can use .dataframe_to_rows() to convert it from a DataFrame into a worksheet:
10from openpyxl import Workbook
11from openpyxl.utils.dataframe import dataframe_to_rows
12
13workbook = Workbook()
14sheet = workbook.active
15
16for row in dataframe_to_rows(df, index=False, header=True):
17    sheet.append(row)
18
19workbook.save("pandas.xlsx")
You should see a spreadsheet that looks like this:
If you want to add the DataFrame’s index, you can change index=True, and it adds each row’s index into your spreadsheet.
On the other hand, if you want to convert a spreadsheet into a DataFrame, you can also do it in a very straightforward way like so:
import pandas as pd
from openpyxl import load_workbook

workbook = load_workbook(filename="sample.xlsx")
sheet = workbook.active

values = sheet.values
df = pd.DataFrame(values)
Alternatively, if you want to add the correct headers and use the review ID as the index, for example, then you can also do it like this instead:
import pandas as pd
from openpyxl import load_workbook
from mapping import REVIEW_ID

workbook = load_workbook(filename="sample.xlsx")
sheet = workbook.active

data = sheet.values

# Set the first row as the columns for the DataFrame
cols = next(data)
data = list(data)

# Set the field "review_id" as the indexes for each row
idx = [row[REVIEW_ID] for row in data]

df = pd.DataFrame(data, index=idx, columns=cols)
Using indexes and columns allows you to access data from your DataFrame easily:
>>>
>>> df.columns
Index(['marketplace', 'customer_id', 'review_id', 'product_id',
       'product_parent', 'product_title', 'product_category', 'star_rating',
       'helpful_votes', 'total_votes', 'vine', 'verified_purchase',
       'review_headline', 'review_body', 'review_date'],
      dtype='object')

>>> # Get first 10 reviews' star rating
>>> df["star_rating"][:10]
R3O9SGZBVQBV76    5
RKH8BNC3L5DLF     5
R2HLE8WKZSU3NL    2
R31U3UH5AZ42LL    5
R2SV659OUJ945Y    4
RA51CP8TR5A2L     5
RB2Q7DLDN6TH6     5
R2RHFJV0UYBK3Y    1
R2Z6JOQ94LFHEP    5
RX27XIIWY5JPB     4
Name: star_rating, dtype: int64

>>> # Grab review with id "R2EQL1V1L6E0C9", using the index
>>> df.loc["R2EQL1V1L6E0C9"]
marketplace               US
customer_id         15305006
review_id     R2EQL1V1L6E0C9
product_id        B004LURNO6
product_parent     892860326
review_headline   Five Stars
review_body          Love it
review_date       2015-08-31
Name: R2EQL1V1L6E0C9, dtype: object
There you go, whether you want to use openpyxl to prettify your Pandas dataset or use Pandas to do some hardcore algebra, you now know how to switch between both packages.
Conclusion
Phew, after that long read, you now know how to work with spreadsheets in Python! You can rely on openpyxl, your trustworthy companion, to:
- Extract valuable information from spreadsheets in a Pythonic manner
- Create your own spreadsheets, no matter the complexity level
- Add cool features such as conditional formatting or charts to your spreadsheets
There are a few other things you can do with openpyxl that might not have been covered in this tutorial, but you can always check the package’s official documentation website to learn more about it. You can even venture into checking its source code and improving the package further.
Feel free to leave any comments below if you have any questions, or if there’s any section you’d love to hear more about.
Watch Now This tutorial has a related video course created by the Real Python team. Watch it together with the written tutorial to deepen your understanding: Editing Excel Spreadsheets in Python With openpyxl
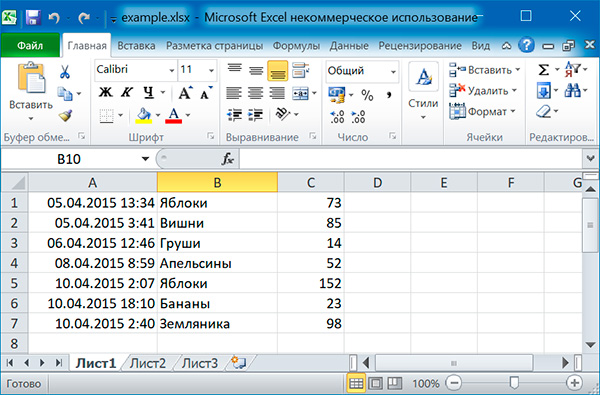
Документ электронной таблицы Excel называется рабочей книгой. Каждая книга может хранить некоторое количество листов. Лист, просматриваемый пользователем в данный момент, называется активным. Лист состоит из из столбцов (адресуемых с помощью букв, начиная с A) и строк (адресуемых с помощью цифр, начиная с 1).
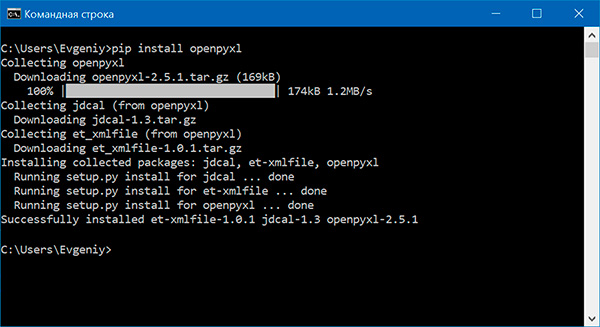
Модуль OpenPyXL не поставляется вместе с Python, поэтому его предварительно нужно установить:
> pip install openpyxl
Чтение файлов Excel
Начинаем работать:
>>> import openpyxl
>>> wb = openpyxl.load_workbook('example.xlsx')
>>> type(wb)
<class 'openpyxl.workbook.workbook.Workbook'>
>>> wb.sheetnames
['Лист1', 'Лист2', 'Лист3']
>>> sheet = wb.active
>>> sheet
<Worksheet "Лист1">
>>> sheet['A1']
<Cell Лист1.A1>
А теперь небольшой скрипт:
import openpyxl

# читаем excel-файл
wb = openpyxl.load_workbook('example.xlsx')

# печатаем список листов
sheets = wb.sheetnames
for sheet in sheets:
    print(sheet)

# получаем активный лист
sheet = wb.active

# печатаем значение ячейки A1
print(sheet['A1'].value)
# печатаем значение ячейки B1
print(sheet['B1'].value)
Результат работы:
Лист1
Лист2
Лист3

2015-04-05 13:34:02
Яблоки
Как получить другой лист книги:
# получаем другой лист
sheet2 = wb['Лист2']
# печатаем значение ячейки A1
print(sheet2['A2'].value)
Как сделать лист книги активным:
# делаем третий лист активным
wb.active = 2
Как задать имя листа:
sheet.title = 'Третий лист'
Объект Cell имеет атрибут value, который содержит значение, хранящееся в ячейке. Объект Cell также имеет атрибуты row, column и coordinate, которые предоставляют информацию о расположении данной ячейки в таблице.
# получаем ячейку листа B2
cell = sheet['B2']
print('Строка: ' + str(cell.row))
print('Столбец: ' + cell.column)
print('Ячейка: ' + cell.coordinate)
print('Значение: ' + cell.value)
Строка: 2
Столбец: B
Ячейка: B2
Значение: Вишни
К отдельной ячейке можно также обращаться с помощью метода cell() объекта Worksheet, передавая ему именованные аргументы row и column. Первому столбцу или первой строке соответствует число 1, а не 0:
# получаем ячейку листа B2
cell = sheet.cell(row = 2, column = 2)
print(cell.value)
Вишни
Размер листа можно получить с помощью атрибутов max_row и max_column объекта Worksheet:
rows = sheet.max_row
cols = sheet.max_column

for i in range(1, rows + 1):
    string = ''
    for j in range(1, cols + 1):
        cell = sheet.cell(row = i, column = j)
        string = string + str(cell.value) + ' '
    print(string)
2015-04-05 13:34:02 Яблоки 73
2015-04-05 03:41:23 Вишни 85
2015-04-06 12:46:51 Груши 14
2015-04-08 08:59:43 Апельсины 52
2015-04-10 02:07:00 Яблоки 152
2015-04-10 18:10:37 Бананы 23
2015-04-10 02:40:46 Земляника 98
Чтобы преобразовать буквенное обозначение столбца в цифровое, следует вызвать функцию
openpyxl.utils.column_index_from_string()
Чтобы преобразовать цифровое обозначение столбуа в буквенное, следует вызвать функцию
openpyxl.utils.get_column_letter()
Для вызова этих функций загружать рабочую книгу не обязательно.
>>> from openpyxl.utils import get_column_letter, column_index_from_string
>>> get_column_letter(1)
'A'
>>> get_column_letter(27)
'AA'
>>> column_index_from_string('A')
1
>>> column_index_from_string('AA')
27
Используя срезы объектов Worksheet, можно получить все объекты Cell, принадлежащие определенной строке, столбцу или прямоугольной области.
>>> sheet['A1':'C3']
((<Cell 'Лист1'.A1>, <Cell 'Лист1'.B1>, <Cell 'Лист1'.C1>),
 (<Cell 'Лист1'.A2>, <Cell 'Лист1'.B2>, <Cell 'Лист1'.C2>),
 (<Cell 'Лист1'.A3>, <Cell 'Лист1'.B3>, <Cell 'Лист1'.C3>))
for row in sheet['A1':'C3']:
    string = ''
    for cell in row:
        string = string + str(cell.value) + ' '
    print(string)
2015-04-05 13:34:02 Яблоки 73
2015-04-05 03:41:23 Вишни 85
2015-04-06 12:46:51 Груши 14
Выводим значения второй колонки:
>>> sheet['B']
(<Cell 'Лист1'.B1>, <Cell 'Лист1'.B2>, <Cell 'Лист1'.B3>, <Cell 'Лист1'.B4>, ..., <Cell 'Лист1'.B7>)
for cell in sheet['B']:
    print(cell.value)
Яблоки
Вишни
Груши
Апельсины
Яблоки
Бананы
Земляника
Выводим строки с первой по третью:
>>> sheet[1:3]
((<Cell 'Лист1'.A1>, <Cell 'Лист1'.B1>, <Cell 'Лист1'.C1>),
 (<Cell 'Лист1'.A2>, <Cell 'Лист1'.B2>, <Cell 'Лист1'.C2>),
 (<Cell 'Лист1'.A3>, <Cell 'Лист1'.B3>, <Cell 'Лист1'.C3>))
for row in sheet[1:3]:
    string = ''
    for cell in row:
        string = string + str(cell.value) + ' '
    print(string)
2015-04-05 13:34:02 Яблоки 73
2015-04-05 03:41:23 Вишни 85
2015-04-06 12:46:51 Груши 14
Для доступа к ячейкам конкретной строки или столбца также можно воспользоваться атрибутами rows и columns объекта Worksheet.
>>> list(sheet.rows)
[(<Cell 'Лист1'.A1>, <Cell 'Лист1'.B1>, <Cell 'Лист1'.C1>),
 (<Cell 'Лист1'.A2>, <Cell 'Лист1'.B2>, <Cell 'Лист1'.C2>),
 ..........
 (<Cell 'Лист1'.A6>, <Cell 'Лист1'.B6>, <Cell 'Лист1'.C6>),
 (<Cell 'Лист1'.A7>, <Cell 'Лист1'.B7>, <Cell 'Лист1'.C7>)]
for row in sheet.rows:
    print(row)
(<Cell 'Лист1'.A1>, <Cell 'Лист1'.B1>, <Cell 'Лист1'.C1>)
(<Cell 'Лист1'.A2>, <Cell 'Лист1'.B2>, <Cell 'Лист1'.C2>)
..........
(<Cell 'Лист1'.A6>, <Cell 'Лист1'.B6>, <Cell 'Лист1'.C6>)
(<Cell 'Лист1'.A7>, <Cell 'Лист1'.B7>, <Cell 'Лист1'.C7>)
>>> list(sheet.columns)
[(<Cell 'Лист1'.A1>, <Cell 'Лист1'.A2>, <Cell 'Лист1'.A3>, <Cell 'Лист1'.A4>, ..., <Cell 'Лист1'.A7>),
 (<Cell 'Лист1'.B1>, <Cell 'Лист1'.B2>, <Cell 'Лист1'.B3>, <Cell 'Лист1'.B4>, ..., <Cell 'Лист1'.B7>),
 (<Cell 'Лист1'.C1>, <Cell 'Лист1'.C2>, <Cell 'Лист1'.C3>, <Cell 'Лист1'.C4>, ..., <Cell 'Лист1'.C7>)]
for column in sheet.columns:
    print(column)
(<Cell 'Лист1'.A1>, <Cell 'Лист1'.A2>, <Cell 'Лист1'.A3>, <Cell 'Лист1'.A4>, ..., <Cell 'Лист1'.A7>)
(<Cell 'Лист1'.B1>, <Cell 'Лист1'.B2>, <Cell 'Лист1'.B3>, <Cell 'Лист1'.B4>, ..., <Cell 'Лист1'.B7>)
(<Cell 'Лист1'.C1>, <Cell 'Лист1'.C2>, <Cell 'Лист1'.C3>, <Cell 'Лист1'.C4>, ..., <Cell 'Лист1'.C7>)
Выводим значения всех ячеек листа:
for row in sheet.rows:
    string = ''
    for cell in row:
        string = string + str(cell.value) + ' '
    print(string)
2015-04-05 13:34:02 Яблоки 73
2015-04-05 03:41:23 Вишни 85
2015-04-06 12:46:51 Груши 14
2015-04-08 08:59:43 Апельсины 52
2015-04-10 02:07:00 Яблоки 152
2015-04-10 18:10:37 Бананы 23
2015-04-10 02:40:46 Земляника 98
Выводим значения второй строки (индекс 1):
for cell in list(sheet.rows)[1]:
    print(str(cell.value))
2015-04-05 03:41:23
Вишни
85
Выводим значения второй колонки (индекс 1):
for row in sheet.rows:
    print(str(row[1].value))
Яблоки
Вишни
Груши
Апельсины
Яблоки
Бананы
Земляника
Запись файлов Excel
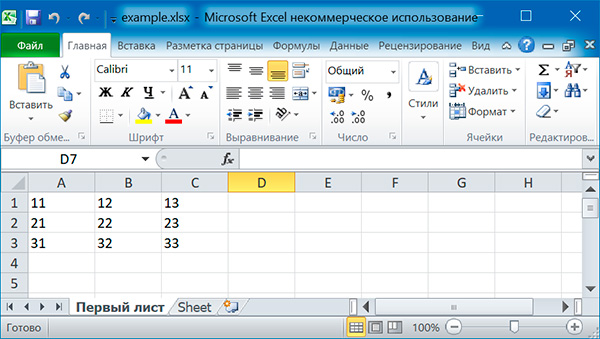
>>> import openpyxl
>>> wb = openpyxl.Workbook()
>>> wb.sheetnames
['Sheet']
>>> wb.create_sheet(title = 'Первый лист', index = 0)
<Worksheet "Первый лист">
>>> wb.sheetnames
['Первый лист', 'Sheet']
>>> wb.remove(wb['Первый лист'])
>>> wb.sheetnames
['Sheet']
>>> wb.save('example.xlsx')
Метод create_sheet() возвращает новый объект Worksheet, который по умолчанию становится последним листом книги. С помощью именованных аргументов title и index можно задать имя и индекс нового листа.
Метод remove() принимает в качестве аргумента не строку с именем листа, а объект Worksheet. Если известно только имя листа, который надо удалить, используйте wb[sheetname]. Еще один способ удалить лист — использовать инструкцию del wb[sheetname].
Не забудьте вызвать метод save(), чтобы сохранить изменения после добавления или удаления листа рабочей книги.
Запись значений в ячейки напоминает запись значений в ключи словаря:
>>> import openpyxl
>>> wb = openpyxl.Workbook()
>>> wb.create_sheet(title = 'Первый лист', index = 0)
>>> sheet = wb['Первый лист']
>>> sheet['A1'] = 'Здравствуй, мир!'
>>> sheet['A1'].value
'Здравствуй, мир!'
Заполняем таблицу 3×3:
import openpyxl

# создаем новый excel-файл
wb = openpyxl.Workbook()

# добавляем новый лист
wb.create_sheet(title = 'Первый лист', index = 0)

# получаем лист, с которым будем работать
sheet = wb['Первый лист']

for row in range(1, 4):
    for col in range(1, 4):
        value = str(row) + str(col)
        cell = sheet.cell(row = row, column = col)
        cell.value = value

wb.save('example.xlsx')
Можно добавлять строки целиком:
sheet.append(['Первый', 'Второй', 'Третий'])
sheet.append(['Четвертый', 'Пятый', 'Шестой'])
sheet.append(['Седьмой', 'Восьмой', 'Девятый'])
Стилевое оформление
Для настройки шрифтов, используемых в ячейках, необходимо импортировать функцию Font() из модуля openpyxl.styles:
from openpyxl.styles import Font
Ниже приведен пример создания новой рабочей книги, в которой для шрифта, используемого в ячейке A1, устанавливается шрифт Arial, красный цвет, курсивное начертание и размер 24 пункта:
import openpyxl
from openpyxl.styles import Font

# создаем новый excel-файл
wb = openpyxl.Workbook()
# добавляем новый лист
wb.create_sheet(title = 'Первый лист', index = 0)
# получаем лист, с которым будем работать
sheet = wb['Первый лист']

font = Font(name='Arial', size=24, italic=True, color='FF0000')
sheet['A1'].font = font
sheet['A1'] = 'Здравствуй мир!'

# записываем файл
wb.save('example.xlsx')
Именованные стили применяются, когда надо применить стилевое оформление к большому количеству ячеек.
import openpyxl
from openpyxl.styles import NamedStyle, Font, Border, Side

# создаем новый excel-файл
wb = openpyxl.Workbook()
# добавляем новый лист
wb.create_sheet(title = 'Первый лист', index = 0)
# получаем лист, с которым будем работать
sheet = wb['Первый лист']

# создаем именованный стиль
ns = NamedStyle(name='highlight')
ns.font = Font(bold=True, size=20)
border = Side(style='thick', color='000000')
ns.border = Border(left=border, top=border, right=border, bottom=border)

# вновь созданный именованный стиль надо зарегистрировать
# для дальнейшего использования
wb.add_named_style(ns)

# теперь можно использовать именованный стиль
sheet['A1'].style = 'highlight'

# записываем файл
wb.save('example.xlsx')
Добавление формул
Формулы, начинающиеся со знака равенства, позволяют устанавливать для ячеек значения, рассчитанные на основе значений в других ячейках.
sheet['B9'] = '=SUM(B1:B8)'
Эта инструкция сохранит =SUM(B1:B8) в качестве значения в ячейке B9. Тем самым для ячейки B9 задается формула, которая суммирует значения, хранящиеся в ячейках от B1 до B8.
Формула Excel — это математическое выражение, которое создается для вычисления результата и которое может зависеть от содержимого других ячеек. Формула в ячейке Excel может содержать данные, ссылки на другие ячейки, а также обозначение действий, которые необходимо выполнить.
Использование ссылок на ячейки позволяет пересчитывать результат по формулам, когда происходят изменения содержимого ячеек, включенных в формулы. Формулы Excel начинаются со знака =. Скобки () могут использоваться для определения порядка математических операции.
Примеры формул Excel: =27+36, =А1+А2-АЗ, =SUM(А1:А5), =MAX(АЗ:А5), =(А1+А2)/АЗ.
Хранящуюся в ячейке формулу можно читать, как любое другое значение. Однако, если нужно получить результат расчета по формуле, а не саму формулу, то при вызове функции load_workbook() ей следует передать именованный аргумент data_only со значением True.
Настройка строк и столбцов
С помощью модуля OpenPyXL можно задавать высоту строк и ширину столбцов таблицы, закреплять их на месте (чтобы они всегда были видны на экране), полностью скрывать из виду, объединять ячейки.
Настройка высоты строк и ширины столбцов
Объекты Worksheet имеют атрибуты row_dimensions и column_dimensions, которые управляют высотой строк и шириной столбцов.
sheet['A1'] = 'Высокая строка'
sheet['B2'] = 'Широкий столбец'

sheet.row_dimensions[1].height = 70
sheet.column_dimensions['B'].width = 30
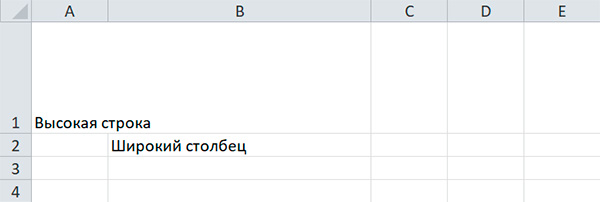
Атрибуты row_dimensions и column_dimensions представляют собой значения, подобные словарю. Атрибут row_dimensions содержит объекты RowDimensions, а атрибут column_dimensions содержит объекты ColumnDimensions. Доступ к объектам в row_dimensions осуществляется с использованием номера строки, а доступ к объектам в column_dimensions — с использованием буквы столбца.
Для указания высоты строки разрешено использовать целые или вещественные числа в диапазоне от 0 до 409. Для указания ширины столбца можно использовать целые или вещественные числа в диапазоне от 0 до 255. Столбцы с нулевой шириной и строки с нулевой высотой невидимы для пользователя.
Объединение ячеек
Ячейки, занимающие прямоугольную область, могут быть объединены в одну ячейку с помощью метода merge_cells() рабочего листа:
sheet.merge_cells('A1:D3')
sheet['A1'] = 'Объединены двенадцать ячеек'

sheet.merge_cells('C5:E5')
sheet['C5'] = 'Объединены три ячейки'
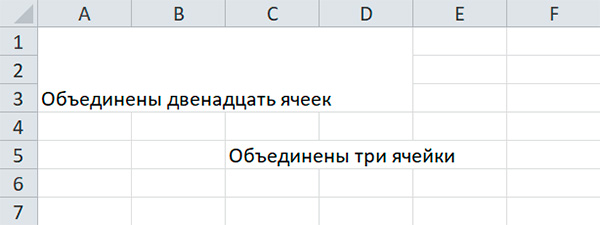
Чтобы отменить слияние ячеек, надо вызвать метод unmerge_cells():
sheet.unmerge_cells('A1:D3')
sheet.unmerge_cells('C5:E5')
Закрепление областей
Если размер таблицы настолько велик, что ее нельзя увидеть целиком, можно заблокировать несколько верхних строк или крайних слева столбцов в их позициях на экране. В этом случае пользователь всегда будет видеть заблокированные заголовки столбцов или строк, даже если он прокручивает таблицу на экране.
У объекта Worksheet имеется атрибут freeze_panes, значением которого может служить объект Cell или строка с координатами ячеек. Все строки и столбцы, расположенные выше и левее, будут заблокированы.
| Значение атрибута freeze_panes | Заблокированные строки и столбцы |
|---|---|
sheet.freeze_panes = 'A2' |
Строка 1 |
sheet.freeze_panes = 'B1' |
Столбец A |
sheet.freeze_panes = 'C1' |
Столбцы A и B |
sheet.freeze_panes = 'C2' |
Строка 1 и столбцы A и B |
sheet.freeze_panes = None |
Закрепленные области отсутствуют |
Диаграммы
Модуль OpenPyXL поддерживает создание гистогорамм, графиков, а также точечных и круговых диаграмм с использование данных, хранящихся в электронной таблице. Чтобы создать диаграмму, необходимо выполнить следующие действия:
- создать объект
Referenceна основе ячеек в пределах выделенной прямоугольной области; - создать объект
Series, передав функцииSeries()объектReference; - создать объект Chart;
- дополнительно можно установить значения переменных
drawing.top,drawing.left,drawing.width,drawing.heightобъектаChart, определяющих положение и размеры диаграммы; - добавить объект
Chartв объектWorksheet.
Объекты Reference создаются путем вызова функции openpyxl.charts.Reference(), принимающей пять аргуменов:
- Объект
Worksheet, содержащий данные диаграммы. - Два целых числа, представляющих верхнюю левую ячейку выделенной прямоугольной области, в которых содержатся данные диаграммы: первое число задает строку, второе — столбец; первой строке соответствует 1, а не 0.
- Два целых числа, представляющих нижнюю правую ячейку выделенной прямоугольной области, в которых содержатся данные диаграммы: первое число задает строку, второе — столбец.
from openpyxl import Workbook
from openpyxl.chart import BarChart, Reference

# создаем новый excel-файл
wb = Workbook()
# добавляем новый лист
wb.create_sheet(title = 'Первый лист', index = 0)
# получаем лист, с которым будем работать
sheet = wb['Первый лист']

sheet['A1'] = 'Серия 1'
# это колонка с данными
for i in range(1, 11):
    cell = sheet.cell(row = i + 1, column = 1)
    cell.value = i * i

# создаем диаграмму
chart = BarChart()
chart.title = 'Первая серия данных'
data = Reference(sheet, min_col = 1, min_row = 1, max_col = 1, max_row = 11)
chart.add_data(data, titles_from_data = True)

# добавляем диаграмму на лист
sheet.add_chart(chart, 'C2')

# записываем файл
wb.save('example.xlsx')
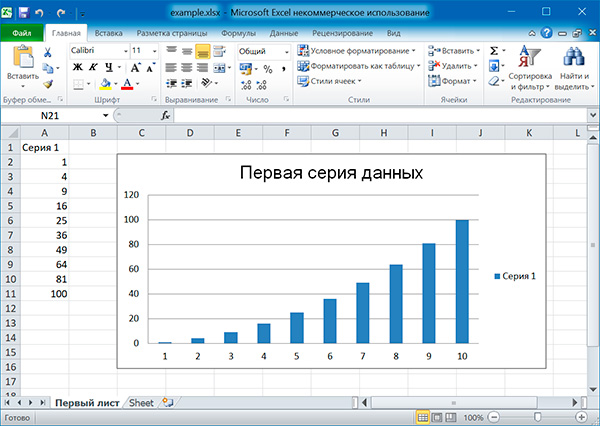
Аналогично можно создавать графики, точечные и круговые диаграммы, вызывая методы:
openpyxl.chart.LineChart()openpyxl.chart.ScatterChart()openpyxl.chart.PieChart()
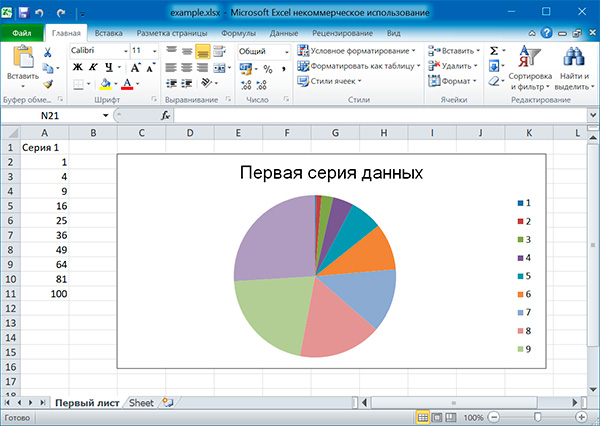
Поиск:
Excel • MS • Python • Web-разработка • Модуль
В этом уроке я расскажу, как создать файл excel в Python с помощью библиотеки openpyxl.
Многие приложения, работающие с данными, нуждаются в экспорте этих данных в различные форматы. Очень распространенным и широко используемым форматом являются электронные таблицы.
В Python существуют различные библиотеки для создания файлов excel, одной из самых популярных является openpyxl благодаря простоте использования и тому, что она позволяет как читать, так и записывать электронные таблицы.
Содержание
- 1 Установка openpyxl
- 2 Создание файла excel в python
- 3 Создание листа
- 4 Доступ к листу
- 5 Доступ к ячейке
- 6 Запись значений в ячейку
- 7 Сохранение списка значений
- 8 Сохранение книги excel в Python
- 8.1 Похожие записи
Поскольку это внешняя библиотека, первое, что вы должны сделать для использования openpyxl, это установить ее.
Создайте новый каталог для вашего проекта, получите к нему доступ и запустите виртуальную среду.
После активации виртуальной среды выполните следующую команду из терминала для установки openpyxl:
$> pip install openpyxl
Создание файла excel в python
Как вы, возможно, знаете электронные таблицы группируются в книги. Книга – это родительская сущность электронной таблицы (обычно соответствующая файлу excel). В свою очередь, она состоит из одного или нескольких листов.
Книга Excel состоит как минимум из одного листа. Лист, с которым вы работаете, называется активным листом.
Для начала работы с openpyxl вам не нужно сохранять какой-либо файл в файловой системе. Вы просто создаете книгу.
В приведенном ниже коде вы узнаете, как создать книгу в openpyxl:
Code language: JavaScript (javascript)
import openpyxl wb = openpyxl.Workbook()
Переменная wb является экземпляром пустой книги. Вновь созданная книга содержит один лист, который является активным. Доступ к нему можно получить через активный атрибут.
Одним из основных свойств листа является его имя, поскольку, как мы увидим в следующем разделе, это позволяет нам обращаться к нему непосредственно через его имя.
В следующем примере показано, как получить доступ к имени активного листа и как его изменить:
Code language: PHP (php)
>>> import openpyxl >>> wb = openpyxl.Workbook() >>> hoja = wb.active >>> print(f'Active list: {list.title}') Active list: Sheet >>> list.title = "Values" >>> print(f'Active list: {wb.active.title}') Active list: Values
Создание листа
Помимо листа по умолчанию, с помощью openpyxl можно создать несколько листов в книге, используя метод create_sheet() у workbook как показано ниже (продолжение предыдущего примера):
Code language: PHP (php)
# Добавление листа 'Sheet' в конец (по умолчанию). >>> list1 = wb.create_sheet("List") # Добавим лист 'Sheet' в первую позицию. # Если "List" существует, добавим цифру 1 в конец имени >>> list2 = wb.create_sheet("List", 0) # Добавим лист "Another list" на позицию 1 >>> wb.create_sheet(index=1, title="Another list") # Вывод на экран названий листов >>> print(wb.sheetnames) ['List1', 'Another list', 'Values', 'List']
Также можно создать копию листа с помощью метода copy_worksheet():
Code language: JavaScript (javascript)
>>> sourse = wb.active >>> new = wb.copy_worksheet(sourse)
Доступ к листу
Как я уже говорил в предыдущем разделе, имена листов являются очень важным свойством, поскольку они позволяют нам обращаться к ним напрямую, рассматривая workbook как словарь. Продолжаем пример:
Code language: PHP (php)
>>> list = wb.active # Это лист, который находится в индексе 0 >>> print(f'Active list: {list.title}') Active list: list1 >>> list = wb['Another list'] >>> wb.active = list >>> print(f'Active list: {wb.active.title}') Active list: Another list
С другой стороны, как мы видели в предыдущем разделе, можно получить список с именами всех листов, обратившись к свойству sheetnames у workbook. Также можно перебирать все листы:
Code language: PHP (php)
>>> print(wb.sheetnames) ['List1', 'Another list', 'Values', 'List'] >>> for list in wb: ... print(list.title) List1 Another list Values List
Доступ к ячейке
До сих пор мы видели, как создать книгу, листы и как получить к ним доступ. Теперь перейдем к самому главному – как получить доступ к значению ячейки и как сохранить данные.
Можно получить доступ к ячейке, рассматривая лист как словарь, где имя ячейки используется в качестве ключа. Это происходит в результате комбинации имени столбца и номера строки.
Вот как получить доступ к ячейке в столбце A и строке 1:
Code language: PHP (php)
>>> wb = openpyxl.Workbook() >>> hoja = wb.active >>> a1 = list["A1"] >>> print(a1.value) None
Также можно получить доступ к ячейке, используя обозначения строк и столбцов, с помощью метода cell() следующим образом:
Code language: PHP (php)
>>> b2 = list.cell(row=2, column=2) >>> print(b2.value)
ВАЖНО: Когда создается книга, она не содержит ячеек. Ячейки создаются в памяти по мере обращения к ним, даже если они не содержат никакого значения.
Запись значений в ячейку
В предыдущем разделе вы могли заметить, что при выводе содержимого ячейки (print(a1.value)) всегда возвращалось None. Это происходит потому, что ячейка не содержит никакого значения.
Чтобы присвоить значение определенной ячейке, вы можете сделать это тремя различными способами:
Code language: PHP (php)
# 1.- Присвоение значения непосредственно ячейке >>> list["A1"] = 10 >>> a1 = list["A1"] >>> print(a1.value) 10 # 2.- Использование обозначения строки, столбца со значением аргумента >>> b1 = list.cell(row=1, column=2, value=20) >>> print(b1.value) 20 # 3.- Обновление свойства значения ячейки >>> c1 = list.cell(row=1, column=3) >>> c1.value = 30 >>> print(c1.value) 30
Сохранение списка значений
Присвоение значения ячейке может быть использовано в отдельных ситуациях. Однако в Python часто бывает так, что данные хранятся в списках или кортежах. Для таких случаев, когда вам нужно экспортировать такие данные, я покажу вам более оптимальный способ создания excel-файла с помощью openpyxl.
Представьте, что у вас есть список товаров с названием, артикулом, количеством и ценой, как показано ниже:
Code language: JavaScript (javascript)
products = [ ('product_1', 'a859', 1500, 9.95), ('product_2', 'b125', 600, 4.95), ('product_3', 'c764', 200, 19.95), ('product_4', 'd399', 2000, 49.95) ]
Как мы можем экспортировать эти данные в excel с помощью openpyxl? Самый простой способ – использовать метод append() объекта листа.
Вот как это можно сделать:
Code language: PHP (php)
products = [ ('product_1', 'a859', 1500, 9.95), ('product_2', 'b125', 600, 4.95), ('product_3', 'c764', 200, 19.95), ('product_4', 'd399', 2000, 49.95) ] wb = openpyxl.Workbook() list = wb.active # Создание строки с заголовками list.append(('Название', 'Артикул', 'Количество', 'Цена')) for product in products: # продукт - кортеж со значениями продукта list.append(product)
Сохранение книги excel в Python
В завершение этогй статьи я покажу вам, как сохранить файл excel в Python с помощью openpyxl.
Чтобы сохранить файл excel с помощью openpyxl, достаточно вызвать метод save() у workbook с именем файла. Это позволит сохранить рабочую книгу со всеми листами и данными в каждом из них.
Если мы сделаем это на предыдущем примере , то получим следующий результат:
Code language: JavaScript (javascript)
wb.save('products.xlsx')