
The read_excel() method can read Excel 2003 (.xls) and
Excel 2007+ (.xlsx) files using the xlrd Python
module. The to_excel() instance method is used for
saving a DataFrame to Excel. Generally the semantics are
similar to working with csv data. See the cookbook for some
advanced strategies
10.5.1 Reading Excel Files
In the most basic use-case, read_excel takes a path to an Excel
file, and the sheetname indicating which sheet to parse.
# Returns a DataFrame
read_excel('path_to_file.xls', sheetname='Sheet1')
10.5.1.1 ExcelFile class
To facilitate working with multiple sheets from the same file, the ExcelFile
class can be used to wrap the file and can be be passed into read_excel
There will be a performance benefit for reading multiple sheets as the file is
read into memory only once.
xlsx = pd.ExcelFile('path_to_file.xls)
df = pd.read_excel(xlsx, 'Sheet1')
The ExcelFile class can also be used as a context manager.
with pd.ExcelFile('path_to_file.xls') as xls:
    df1 = pd.read_excel(xls, 'Sheet1')
    df2 = pd.read_excel(xls, 'Sheet2')
The sheet_names property will generate
a list of the sheet names in the file.
The primary use-case for an ExcelFile is parsing multiple sheets with
different parameters
data = {}
# For when Sheet1's format differs from Sheet2
with pd.ExcelFile('path_to_file.xls') as xls:
    data['Sheet1'] = pd.read_excel(xls, 'Sheet1', index_col=None, na_values=['NA'])
    data['Sheet2'] = pd.read_excel(xls, 'Sheet2', index_col=1)
Note that if the same parsing parameters are used for all sheets, a list
of sheet names can simply be passed to read_excel with no loss in performance.
# using the ExcelFile class
data = {}
with pd.ExcelFile('path_to_file.xls') as xls:
    data['Sheet1'] = read_excel(xls, 'Sheet1', index_col=None, na_values=['NA'])
    data['Sheet2'] = read_excel(xls, 'Sheet2', index_col=None, na_values=['NA'])

# equivalent using the read_excel function
data = read_excel('path_to_file.xls', ['Sheet1', 'Sheet2'], index_col=None, na_values=['NA'])
New in version 0.12.
ExcelFile has been moved to the top level namespace.
New in version 0.17.
read_excel can take an ExcelFile object as input
10.5.1.2 Specifying Sheets
Note
The second argument is sheetname, not to be confused with ExcelFile.sheet_names
Note
An ExcelFile’s attribute sheet_names provides access to a list of sheets.
- The arguments
sheetnameallows specifying the sheet or sheets to read. - The default value for
sheetnameis 0, indicating to read the first sheet - Pass a string to refer to the name of a particular sheet in the workbook.
- Pass an integer to refer to the index of a sheet. Indices follow Python
convention, beginning at 0. - Pass a list of either strings or integers, to return a dictionary of specified sheets.
- Pass a
Noneto return a dictionary of all available sheets.
# Returns a DataFrame
read_excel('path_to_file.xls', 'Sheet1', index_col=None, na_values=['NA'])
Using the sheet index:
# Returns a DataFrame
read_excel('path_to_file.xls', 0, index_col=None, na_values=['NA'])
Using all default values:
# Returns a DataFrame
read_excel('path_to_file.xls')
Using None to get all sheets:
# Returns a dictionary of DataFrames
read_excel('path_to_file.xls',sheetname=None)
Using a list to get multiple sheets:
# Returns the 1st and 4th sheet, as a dictionary of DataFrames.
read_excel('path_to_file.xls',sheetname=['Sheet1',3])
New in version 0.16.
read_excel can read more than one sheet, by setting sheetname to either
a list of sheet names, a list of sheet positions, or None to read all sheets.
New in version 0.13.
Sheets can be specified by sheet index or sheet name, using an integer or string,
respectively.
10.5.1.3 Reading a MultiIndex
New in version 0.17.
read_excel can read a MultiIndex index, by passing a list of columns to index_col
and a MultiIndex column by passing a list of rows to header. If either the index
or columns have serialized level names those will be read in as well by specifying
the rows/columns that make up the levels.
For example, to read in a MultiIndex index without names:
In [1]: df = pd.DataFrame({'a':[1,2,3,4], 'b':[5,6,7,8]},
   ...:                   index=pd.MultiIndex.from_product([['a','b'],['c','d']]))
   ...:

In [2]: df.to_excel('path_to_file.xlsx')

In [3]: df = pd.read_excel('path_to_file.xlsx', index_col=[0,1])

In [4]: df
Out[4]:
     a  b
a c  1  5
  d  2  6
b c  3  7
  d  4  8
If the index has level names, they will parsed as well, using the same
parameters.
In [5]: df.index = df.index.set_names(['lvl1', 'lvl2'])

In [6]: df.to_excel('path_to_file.xlsx')

In [7]: df = pd.read_excel('path_to_file.xlsx', index_col=[0,1])

In [8]: df
Out[8]:
           a  b
lvl1 lvl2
a    c     1  5
     d     2  6
b    c     3  7
     d     4  8
If the source file has both MultiIndex index and columns, lists specifying each
should be passed to index_col and header
In [9]: df.columns = pd.MultiIndex.from_product([['a'],['b', 'd']], names=['c1', 'c2'])

In [10]: df.to_excel('path_to_file.xlsx')

In [11]: df = pd.read_excel('path_to_file.xlsx',
   ....:                     index_col=[0,1], header=[0,1])
   ....:

In [12]: df
Out[12]:
c1         a
c2         b  d
lvl1 lvl2
a    c     1  5
     d     2  6
b    c     3  7
     d     4  8
Warning
Excel files saved in version 0.16.2 or prior that had index names will still able to be read in,
but the has_index_names argument must specified to True.
10.5.1.4 Parsing Specific Columns
It is often the case that users will insert columns to do temporary computations
in Excel and you may not want to read in those columns. read_excel takes
a parse_cols keyword to allow you to specify a subset of columns to parse.
If parse_cols is an integer, then it is assumed to indicate the last column
to be parsed.
read_excel('path_to_file.xls', 'Sheet1', parse_cols=2)
If parse_cols is a list of integers, then it is assumed to be the file column
indices to be parsed.
read_excel('path_to_file.xls', 'Sheet1', parse_cols=[0, 2, 3])
10.5.1.5 Cell Converters
It is possible to transform the contents of Excel cells via the converters
option. For instance, to convert a column to boolean:
read_excel('path_to_file.xls', 'Sheet1', converters={'MyBools': bool})
This options handles missing values and treats exceptions in the converters
as missing data. Transformations are applied cell by cell rather than to the
column as a whole, so the array dtype is not guaranteed. For instance, a
column of integers with missing values cannot be transformed to an array
with integer dtype, because NaN is strictly a float. You can manually mask
missing data to recover integer dtype:
cfun = lambda x: int(x) if x else -1
read_excel('path_to_file.xls', 'Sheet1', converters={'MyInts': cfun})
10.5.2 Writing Excel Files
10.5.2.1 Writing Excel Files to Disk
To write a DataFrame object to a sheet of an Excel file, you can use the
to_excel instance method. The arguments are largely the same as to_csv
described above, the first argument being the name of the excel file, and the
optional second argument the name of the sheet to which the DataFrame should be
written. For example:
df.to_excel('path_to_file.xlsx', sheet_name='Sheet1')
Files with a .xls extension will be written using xlwt and those with a
.xlsx extension will be written using xlsxwriter (if available) or
openpyxl.
The DataFrame will be written in a way that tries to mimic the REPL output. One
difference from 0.12.0 is that the index_label will be placed in the second
row instead of the first. You can get the previous behaviour by setting the
merge_cells option in to_excel() to False:
df.to_excel('path_to_file.xlsx', index_label='label', merge_cells=False)
The Panel class also has a to_excel instance method,
which writes each DataFrame in the Panel to a separate sheet.
In order to write separate DataFrames to separate sheets in a single Excel file,
one can pass an ExcelWriter.
with ExcelWriter('path_to_file.xlsx') as writer:
    df1.to_excel(writer, sheet_name='Sheet1')
    df2.to_excel(writer, sheet_name='Sheet2')
Note
Wringing a little more performance out of read_excel
Internally, Excel stores all numeric data as floats. Because this can
produce unexpected behavior when reading in data, pandas defaults to trying
to convert integers to floats if it doesn’t lose information (1.0 -->). You can pass
1convert_float=False to disable this behavior, which
may give a slight performance improvement.
10.5.2.2 Writing Excel Files to Memory
New in version 0.17.
Pandas supports writing Excel files to buffer-like objects such as StringIO or
BytesIO using ExcelWriter.
New in version 0.17.
Added support for Openpyxl >= 2.2
# Safe import for either Python 2.x or 3.x
try:
    from io import BytesIO
except ImportError:
    from cStringIO import StringIO as BytesIO

bio = BytesIO()

# By setting the 'engine' in the ExcelWriter constructor.
writer = ExcelWriter(bio, engine='xlsxwriter')
df.to_excel(writer, sheet_name='Sheet1')

# Save the workbook
writer.save()

# Seek to the beginning and read to copy the workbook to a variable in memory
bio.seek(0)
workbook = bio.read()
Note
engine is optional but recommended. Setting the engine determines
the version of workbook produced. Setting engine='xlrd' will produce an
Excel 2003-format workbook (xls). Using either 'openpyxl' or
'xlsxwriter' will produce an Excel 2007-format workbook (xlsx). If
omitted, an Excel 2007-formatted workbook is produced.
10.5.3 Excel writer engines
New in version 0.13.
pandas chooses an Excel writer via two methods:
- the
enginekeyword argument - the filename extension (via the default specified in config options)
By default, pandas uses the XlsxWriter for .xlsx and openpyxl
for .xlsm files and xlwt for .xls files. If you have multiple
engines installed, you can set the default engine through setting the
config options io.excel.xlsx.writer and
io.excel.xls.writer. pandas will fall back on openpyxl for .xlsx
files if Xlsxwriter is not available.
To specify which writer you want to use, you can pass an engine keyword
argument to to_excel and to ExcelWriter. The built-in engines are:
openpyxl: This includes stable support for Openpyxl from 1.6.1. However,
it is advised to use version 2.2 and higher, especially when working with
styles.xlsxwriterxlwt
# By setting the 'engine' in the DataFrame and Panel 'to_excel()' methods.
df.to_excel('path_to_file.xlsx', sheet_name='Sheet1', engine='xlsxwriter')

# By setting the 'engine' in the ExcelWriter constructor.
writer = ExcelWriter('path_to_file.xlsx', engine='xlsxwriter')

# Or via pandas configuration.
from pandas import options
options.io.excel.xlsx.writer = 'xlsxwriter'

df.to_excel('path_to_file.xlsx', sheet_name='Sheet1')
When it comes to data analysis, the primary task is to import data into the tool which analyses the data. The tricky part lies in getting the data imported since there is no universal format to consolidate data. Some prefer spreadsheets while others make do with the ‘.csv’ files. Some might even import data directly from websites, while others would like it in the form of ‘.txt’ files.
With the umpteen ways to import data, a data analytic tool should be compatible with the different formats of data repositories available. This article focuses on one such repository which is ubiquitous in recording data – MS Excel. We shall import the details of an MS Excel file using the ExcelFile.Parse( ) function from the pandas library.
So, let us start things off by importing the pandas library using the below code.
Thereafter we shall dive into the greater depths of the ExcelFile.Parse( ) function through each of the following sections.
- Syntax of the ExcelFile.Parse( ) function
- ExcelFile.Parse( ) function explained with an example
Syntax of the ExcelFile.Parse( ) function
Following is the syntax containing the mandatory and optional constructs that are required for the proper functioning of the ExcelFile.Parse( ) function.
pandas.ExcelFile.Parse(sheet_name=0, header=0, names=None,
index_col=None, usecols=None, sqeeze=None, converters=None,
true_values=None, false_values=None, skiprows=None,
nrows=None, na_values=None, parse_dates=False,
date_parser=None, thousands=None, comment=None,
skipfooter=0, convert_float=None, mangle_dupe_col=True, **kwds)
where,
- sheet_name – Name or page number of the sheet within the MS Excel file containing the data to be imported.
- header – Set to zero (0) by default, it is used to specify the row that contains the labels of the data that is to be parsed.
- names – Set to ‘None’ by default, it is used to specify the column names that are to be used.
- index_col – Set to ‘None’ by default, it is used to specify the column that is to be used as row labels for the parsed data.
- usecols – Used to return a subset of the input columns based on whether it is been set to a string or a list of strings/numbers. Being set to ‘None’ by default, it also has the provision to be set as callable.
- squeeze – Set to ‘None’ by default, it is used to return a series when the parsed data contains only one column but has been deprecated in the versions following 1.4.0.
- converters – Set to ‘None’ by default, it is used to specify the dict of functions that can covert the values in specific columns.
- true_values – Set to ‘None’ by default, it is used to specify the values that are to be considered ‘True’ when parsing the data.
- false_values – Set to ‘None’ by default, it is used to specify the values that are to be considered ‘False’ when parsing the data.
- skiprows – Set to ‘None’ by default, it is used to specify the line numbers or the number of lines to be skipped from the start of the file.
- nrows – Set to ‘None’ by default, it is used to specify the number of rows to be parsed.
- na_values – Set to ‘None’ by default, it is used to specify the strings that are to be considered as NA values such as ‘#N/A’, ‘#NA’, ‘NaN’, ‘na’ & so on.
- parse_dates – Set to ‘False’ by default, it is used to specify the list of dates within the input data that are to be parsed.
- date_parser – Set to ‘None’ by default, it is used to convert columns containing strings into an array of ‘datetime’ format.
- thousands – Set to ‘None’ by default, it is used to include a thousand separator for the column values stored in ‘Text’ format in the input data.
- comment – Set to ‘None’ by default, it is used to highlight the locations of comments in the input MS Excel file by passing a character(s).
- skipfooter – Set to zero (0) by default, it is used to skip the rows at the end of the input data.
- convert_float – Set to ‘None’ by default, it is used to convert data stored as ‘float’ into ‘int’, but is deprecated in versions following 1.3.0.
- mangle_dupe_col – Set to ‘True’ by default, it is used to specify duplicate columns as ‘X’, ‘X.1’, …. ‘X.N’ & is used to overwrite the data in the duplicate columns if set to ‘False’. It is deprecated in versions following 1.5.0.
- **kwds – kwargs or keyword argument which is an optional construct used to pass keyword variable length of argument to a function.
ExcelFile.Parse( ) function explained with an example
Let us first specify the location of the file containing the data that is to be parsed within the ExcelFile( ) function as given below.
XL = pd.ExcelFile('D:Ask PythonExamples.xlsx')
Once done, it is time to parse the data within this file, specifically the data of interest are those that fall within the first three columns of the first sheet. This can be done using the following code.
df = XL.parse('Sheet1', usecols = [1, 2, 3])
print (df)
Printing the dataframe yields the below result.
Now let’s say we would like the very first column of the output, those with ‘0, 1, 2 & 3’ to be replaced with the contents of those in the second column then, the same can be done as follows.
df = XL.parse('Sheet1', usecols = [1, 2, 3], index_col = 0)
print (df)
Suppose only the results of the first three rows are only needed, one can use the nrows option to make it happen.
df = XL.parse('Sheet1', usecols = [1, 2, 3], index_col = 0, nrows = 3)
print (df)
Conclusion
Now that we have reached the end of this article, hope it has elaborated on how to use the ExcelFile.Parse( ) function from the pandas library. Here’s another article that details the usage of the convolve( ) function from the numpy library in Python. There are numerous other enjoyable and equally informative articles in AskPython that might be of great help to those who are looking to level up in Python. Audere est facere!
Reference
- Pandas.ExcelFile.Parse( ) – Source documentation
Время на прочтение
5 мин
Количество просмотров 63K
Excel — это чрезвычайно распространённый инструмент для анализа данных. С ним легко научиться работать, есть он практически на каждом компьютере, а тот, кто его освоил, может с его помощью решать довольно сложные задачи. Python часто считают инструментом, возможности которого практически безграничны, но который освоить сложнее, чем Excel. Автор материала, перевод которого мы сегодня публикуем, хочет рассказать о решении с помощью Python трёх задач, которые обычно решают в Excel. Эта статья представляет собой нечто вроде введения в Python для тех, кто хорошо знает Excel.

Загрузка данных
Начнём с импорта Python-библиотеки pandas и с загрузки в датафреймы данных, которые хранятся на листах sales и states книги Excel. Такие же имена мы дадим и соответствующим датафреймам.
import pandas as pd
sales = pd.read_excel('https://github.com/datagy/mediumdata/raw/master/pythonexcel.xlsx', sheet_name = 'sales')
states = pd.read_excel('https://github.com/datagy/mediumdata/raw/master/pythonexcel.xlsx', sheet_name = 'states')
Теперь воспользуемся методом .head() датафрейма sales для того чтобы вывести элементы, находящиеся в начале датафрейма:
print(sales.head())
Сравним то, что будет выведено, с тем, что можно видеть в Excel.
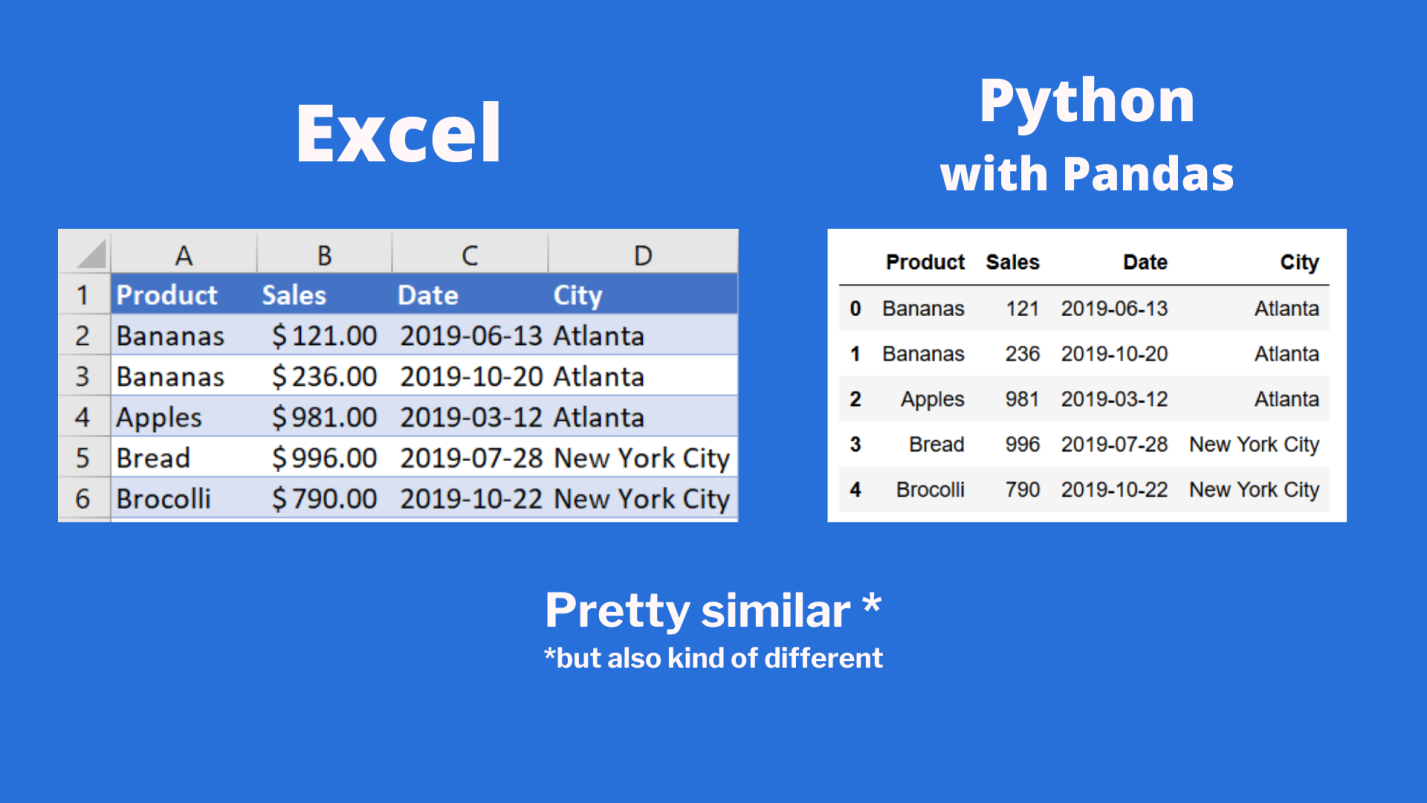
Сравнение внешнего вида данных, выводимых в Excel, с внешним видом данных, выводимых из датафрейма pandas
Тут можно видеть, что результаты визуализации данных из датафрейма очень похожи на то, что можно видеть в Excel. Но тут имеются и некоторые очень важные различия:
- Нумерация строк в Excel начинается с 1, а в pandas номер (индекс) первой строки равняется 0.
- В Excel столбцы имеют буквенные обозначения, начинающиеся с буквы
A, а в pandas названия столбцов соответствуют именам соответствующих переменных.
Продолжим исследование возможностей pandas, позволяющих решать задачи, которые обычно решают в Excel.
Реализация возможностей Excel-функции IF в Python
В Excel существует очень удобная функция IF, которая позволяет, например, записать что-либо в ячейку, основываясь на проверке того, что находится в другой ячейке. Предположим, нужно создать в Excel новый столбец, ячейки которого будут сообщать нам о том, превышают ли 500 значения, записанные в соответствующие ячейки столбца B. В Excel такому столбцу (в нашем случае это столбец E) можно назначить заголовок MoreThan500, записав соответствующий текст в ячейку E1. После этого, в ячейке E2, можно ввести следующее:
=IF([@Sales]>500, "Yes", "No")
Использование функции IF в Excel
Для того чтобы сделать то же самое с использованием pandas, можно воспользоваться списковым включением (list comprehension):
sales['MoreThan500'] = ['Yes' if x > 500 else 'No' for x in sales['Sales']]
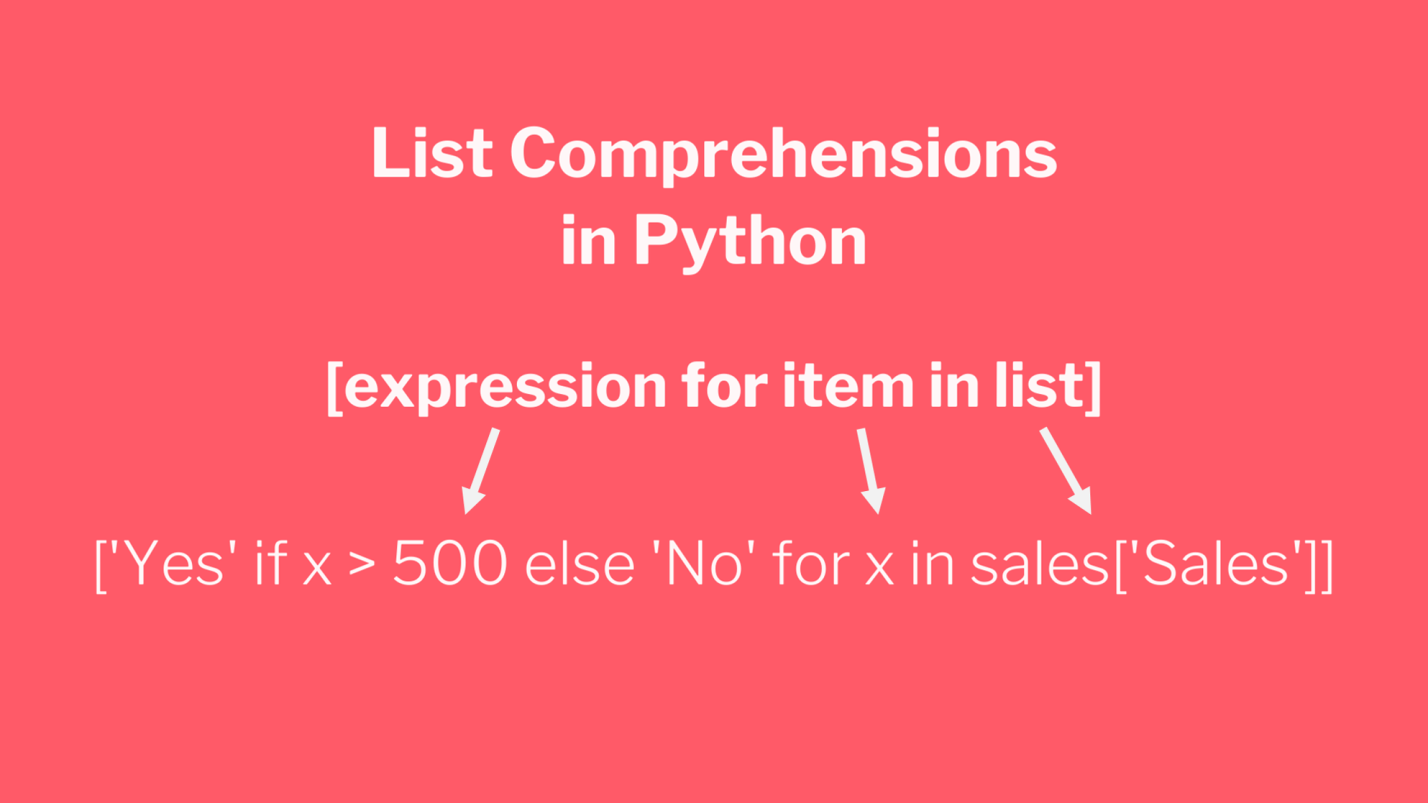
Списковые включения в Python: если текущее значение больше 500 — в список попадает Yes, в противном случае — No
Списковые включения — это отличное средство для решения подобных задач, позволяющее упростить код за счёт уменьшения потребности в сложных конструкциях вида if/else. Ту же задачу можно решить и с помощью if/else, но предложенный подход экономит время и делает код немного чище. Подробности о списковых включениях можно найти здесь.
Реализация возможностей Excel-функции VLOOKUP в Python
В нашем наборе данных, на одном из листов Excel, есть названия городов, а на другом — названия штатов и провинций. Как узнать о том, где именно находится каждый город? Для этого подходит Excel-функция VLOOKUP, с помощью которой можно связать данные двух таблиц. Эта функция работает по принципу левого соединения, когда сохраняется каждая запись из набора данных, находящегося в левой части выражения. Применяя функцию VLOOKUP, мы предлагаем системе выполнить поиск определённого значения в заданном столбце указанного листа, а затем — вернуть значение, которое находится на заданное число столбцов правее найденного значения. Вот как это выглядит:
=VLOOKUP([@City],states,2,false)
Зададим на листе sales заголовок столбца F как State и воспользуемся функцией VLOOKUP для того чтобы заполнить ячейки этого столбца названиями штатов и провинций, в которых расположены города.

Использование функции VLOOKUP в Excel
В Python сделать то же самое можно, воспользовавшись методом merge из pandas. Он принимает два датафрейма и объединяет их. Для решения этой задачи нам понадобится следующий код:
sales = pd.merge(sales, states, how='left', on='City')
Разберём его:
- Первый аргумент метода
merge— это исходный датафрейм. - Второй аргумент — это датафрейм, в котором мы ищем значения.
- Аргумент
howуказывает на то, как именно мы хотим соединить данные. - Аргумент
onуказывает на переменную, по которой нужно выполнить соединение (тут ещё можно использовать аргументыleft_onиright_on, нужные в том случае, если интересующие нас данные в разных датафреймах названы по-разному).
Сводные таблицы
Сводные таблицы (Pivot Tables) — это одна из самых мощных возможностей Excel. Такие таблицы позволяют очень быстро извлекать ценные сведения из больших наборов данных. Создадим в Excel сводную таблицу, выводящую сведения о суммарных продажах по каждому городу.
Создание сводной таблицы в Excel
Как видите, для создания подобной таблицы достаточно перетащить поле City в раздел Rows, а поле Sales — в раздел Values. После этого Excel автоматически выведет суммарные продажи для каждого города.
Для того чтобы создать такую же сводную таблицу в pandas, нужно будет написать следующий код:
sales.pivot_table(index = 'City', values = 'Sales', aggfunc = 'sum')
Разберём его:
- Здесь мы используем метод
sales.pivot_table, сообщая pandas о том, что мы хотим создать сводную таблицу, основанную на датафреймеsales. - Аргумент
indexуказывает на столбец, по которому мы хотим агрегировать данные. - Аргумент
valuesуказывает на то, какие значения мы собираемся агрегировать. - Аргумент
aggfuncзадаёт функцию, которую мы хотим использовать при обработке значений (тут ещё можно воспользоваться функциямиmean,max,minи так далее).
Итоги
Из этого материала вы узнали о том, как импортировать Excel-данные в pandas, о том, как реализовать средствами Python и pandas возможности Excel-функций IF и VLOOKUP, а также о том, как воспроизвести средствами pandas функционал сводных таблиц Excel. Возможно, сейчас вы задаётесь вопросом о том, зачем вам пользоваться pandas, если то же самое можно сделать и в Excel. На этот вопрос нет однозначного ответа. Python позволяет создавать код, который поддаётся тонкой настройке и глубокому исследованию. Такой код можно использовать многократно. Средствами Python можно описывать очень сложные схемы анализа данных. А возможностей Excel, вероятно, достаточно лишь для менее масштабных исследований данных. Если вы до этого момента пользовались только Excel — рекомендую испытать Python и pandas, и узнать о том, что у вас из этого получится.
А какие инструменты вы используете для анализа данных?
Напоминаем, что у нас продолжается конкурс прогнозов, в котором можно выиграть новенький iPhone. Еще есть время ворваться в него, и сделать максимально точный прогноз по злободневным величинам.

Close: first you call ExcelFile, but then you call the .parse method and pass it the sheet name.
>>> xl = pd.ExcelFile("dummydata.xlsx")
>>> xl.sheet_names
[u'Sheet1', u'Sheet2', u'Sheet3']
>>> df = xl.parse("Sheet1")
>>> df.head()
                  Tid  dummy1    dummy2    dummy3    dummy4    dummy5
0 2006-09-01 00:00:00       0  5.894611  0.605211  3.842871  8.265307
1 2006-09-01 01:00:00       0  5.712107  0.605211  3.416617  8.301360
2 2006-09-01 02:00:00       0  5.105300  0.605211  3.090865  8.335395
3 2006-09-01 03:00:00       0  4.098209  0.605211  3.198452  8.170187
4 2006-09-01 04:00:00       0  3.338196  0.605211  2.970015  7.765058

     dummy6  dummy7    dummy8    dummy9
0  0.623354       0  2.579108  2.681728
1  0.554211       0  7.210000  3.028614
2  0.567841       0  6.940000  3.644147
3  0.581470       0  6.630000  4.016155
4  0.595100       0  6.350000  3.974442
What you’re doing is calling the method which lives on the class itself, rather than the instance, which is okay (although not very idiomatic), but if you’re doing that you would also need to pass the sheet name:
>>> parsed = pd.io.parsers.ExcelFile.parse(xl, "Sheet1")
>>> parsed.columns
Index([u'Tid', u'dummy1', u'dummy2', u'dummy3', u'dummy4', u'dummy5', u'dummy6', u'dummy7', u'dummy8', u'dummy9'], dtype=object)
Хотя многие Data Scientist’ы больше привыкли работать с CSV-файлами, на практике очень часто приходится сталкиваться с обычными Excel-таблицами. Поэтому сегодня мы расскажем, как читать Excel-файлы в Pandas, а также рассмотрим основные возможности Python-библиотеки OpenPyXL для чтения метаданных ячеек.
Дополнительные зависимости для возможности чтения Excel таблиц
Для чтения таблиц Excel в Pandas требуются дополнительные зависимости:
- xlrd поддерживает старые и новые форматы MS Excel [1];
- OpenPyXL поддерживает новые форматы MS Excel (.xlsx) [2];
- ODFpy поддерживает свободные форматы OpenDocument (.odf, .ods и .odt) [3];
- pyxlsb поддерживает бинарные MS Excel файлы (формат .xlsb) [4].
Мы рекомендуем установить только OpenPyXL, поскольку он нам пригодится в дальнейшем. Для этого в командной строке прописывается следующая операция:
pip install openpyxl
Затем в Pandas нужно указать путь к Excel-файлу и одну из установленных зависимостей. Python-код выглядит следующим образом:
import pandas as pd
pd.read_excel(io='temp1.xlsx', engine='openpyxl')
#
     Name  Age  Weight
0    Alex   35      87
1   Lesha   57      72
2  Nastya   21      64
Читаем несколько листов
Excel-файл может содержать несколько листов. В Pandas, чтобы прочитать конкретный лист, в аргументе нужно указать sheet_name. Можно указать список названий листов, тогда Pandas вернет словарь (dict) с объектами DataFrame:
dfs = pd.read_excel(io='temp1.xlsx',
                    engine='openpyxl',
                    sheet_name=['Sheet1', 'Sheet2'])
dfs
#
{'Sheet1':      Name  Age  Weight
 0    Alex   35      87
 1   Lesha   57      72
 2  Nastya   21      64,
 'Sheet2':     Name  Age  Weight
 0  Gosha   43      95
 1   Anna   24      65
 2   Lena   22      78}
Если таблицы в словаре имеют одинаковые атрибуты, то их можно объединить в один DataFrame. В Python это выглядит так:
pd.concat(dfs).reset_index(drop=True)
     Name  Age  Weight
0    Alex   35      87
1   Lesha   57      72
2  Nastya   21      64
3   Gosha   43      95
4    Anna   24      65
5    Lena   22      78
Указание диапазонов
Таблицы могут размещаться не в самом начале, а как, например, на рисунке ниже. Как видим, таблица располагается в диапазоне A:F.
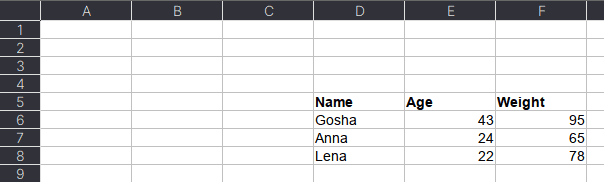
Чтобы прочитать такую таблицу, нужно указать диапазон в аргументе usecols. Также дополнительно можно добавить header — номер заголовка таблицы, а также nrows — количество строк, которые нужно прочитать. В аргументе header всегда передается номер строки на единицу меньше, чем в Excel-файле, поскольку в Python индексация начинается с 0 (на рисунке это номер 5, тогда указываем 4):
pd.read_excel(io='temp1.xlsx',
              engine='openpyxl',
              usecols='D:F',
              header=4, # в excel это №5
              nrows=3)
#
    Name  Age  Weight
0  Gosha   43      95
1   Anna   24      65
2   Lena   22      78
Читаем таблицы в OpenPyXL
Pandas прочитывает только содержимое таблицы, но игнорирует метаданные: цвет заливки ячеек, примечания, стили таблицы и т.д. В таком случае пригодится библиотека OpenPyXL. Загрузка файлов осуществляется через функцию load_workbook, а к листам обращаться можно через квадратные скобки:
from openpyxl import load_workbook
wb = load_workbook('temp2.xlsx')
ws = wb['Лист1']
type(ws)
# openpyxl.worksheet.worksheet.Worksheet
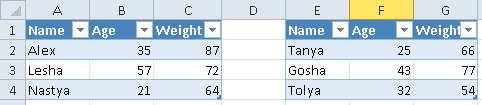
Допустим, имеется Excel-файл с несколькими таблицами на листе (см. рисунок выше). Если бы мы использовали Pandas, то он бы выдал следующий результат:
pd.read_excel(io='temp2.xlsx',
              engine='openpyxl')
#
     Name  Age  Weight  Unnamed: 3 Name.1  Age.1  Weight.1
0    Alex   35      87         NaN  Tanya     25        66
1   Lesha   57      72         NaN  Gosha     43        77
2  Nastya   21      64         NaN  Tolya     32        54
Можно, конечно, заняться обработкой и привести таблицы в нормальный вид, а можно воспользоваться OpenPyXL, который хранит таблицу и его диапазон в словаре. Чтобы посмотреть этот словарь, нужно вызвать ws.tables.items. Вот так выглядит Python-код:
ws.tables.items()
wb = load_workbook('temp2.xlsx')
ws = wb['Лист1']
ws.tables.items()
#
[('Таблица1', 'A1:C4'), ('Таблица13', 'E1:G4')]
Обращаясь к каждому диапазону, можно проходить по каждой строке или столбцу, а внутри них – по каждой ячейке. Например, следующий код на Python таблицы объединяет строки в список, где первая строка уходит на заголовок, а затем преобразует их в DataFrame:
dfs = []
for table_name, value in ws.tables.items():
    table = ws[value]
    header, *body = [[cell.value for cell in row]
                      for row in table]
    df = pd.DataFrame(body, columns=header)
    dfs.append(df)
Если таблицы имеют одинаковые атрибуты, то их можно соединить в одну:
pd.concat(dfs)
#
     Name  Age  Weight
0    Alex   35      87
1   Lesha   57      72
2  Nastya   21      64
0   Tanya   25      66
1   Gosha   43      77
2   Tolya   32      54
Сохраняем метаданные таблицы
Как указано в коде выше, у ячейки OpenPyXL есть атрибут value, который хранит ее значение. Помимо value, можно получить тип ячейки (data_type), цвет заливки (fill), примечание (comment) и др.
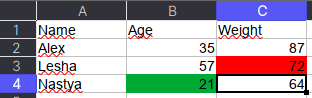
Например, требуется сохранить данные о цвете ячеек. Для этого мы каждую ячейку с числами перезапишем в виде <значение,RGB>, где RGB — значение цвета в формате RGB (red, green, blue). Python-код выглядит следующим образом:
# _TYPES = {int:'n', float:'n', str:'s', bool:'b'}
data = []
for row in ws.rows:
    row_cells = []
    for cell in row:
        cell_value = cell.value
        if cell.data_type == 'n':
            cell_value = f"{cell_value},{cell.fill.fgColor.rgb}"
        row_cells.append(cell_value)
    data.append(row_cells)
Первым элементом списка является строка-заголовок, а все остальное уже значения таблицы:
pd.DataFrame(data[1:], columns=data[0])
#
     Name          Age       Weight
0    Alex  35,00000000  87,00000000
1   Lesha  57,00000000  72,FFFF0000
2  Nastya  21,FF00A933  64,00000000
Теперь представим атрибуты в виде индексов с помощью метода stack, а после разобьём все записи на значение и цвет методом str.split:
(pd.DataFrame(data[1:], columns=data[0])
 .set_index('Name')
 .stack()
 .str.split(',', expand=True)
)
#
                0         1
Name
Alex   Age     35  00000000
       Weight  87  00000000
Lesha  Age     57  00000000
       Weight  72  FFFF0000
Nastya Age     21  FF00A933
       Weight  64  0000000
Осталось только переименовать 0 и 1 на Value и Color, а также добавить атрибут Variable, который обозначит Вес и Возраст. Полный код на Python выглядит следующим образом:
(pd.DataFrame(data[1:], columns=data[0])
 .set_index('Name')
 .stack()
 .str.split(',', expand=True)
 .set_axis(['Value', 'Color'], axis=1)
 .rename_axis(index=['Name', 'Variable'])
 .reset_index()
)
#
     Name Variable Value     Color
0    Alex      Age    35  00000000
1    Alex   Weight    87  00000000
2   Lesha      Age    57  00000000
3   Lesha   Weight    72  FFFF0000
4  Nastya      Age    21  FF00A933
5  Nastya   Weight    64  00000000
Ещё больше подробностей о работе с таблицами в Pandas, а также их обработке на реальных примерах Data Science задач, вы узнаете на наших курсах по Python в лицензированном учебном центре обучения и повышения квалификации IT-специалистов в Москве.
Источники
- https://xlrd.readthedocs.io/en/latest/
- https://openpyxl.readthedocs.io/en/latest/
- https://github.com/eea/odfpy
- https://github.com/willtrnr/pyxlsb