
Время прочтения: 6 мин.
В данном материале мы пройдемся по наиболее полезным функциям, которые нам предоставляет связка pandas и XlsxWriter для записи данных.
Для начала загружаем зависимости и создаём DataFrame:
import pandas as pd
import numpy as np
import matplotlib.pyplot as plt
sales_df = pd.read_excel('https://github.com/chris1610/pbpython/blob/master/data/sample-salesv3.xlsx?raw=true')
sales_summary = sales_df.groupby(['name'])['ext price'].agg(['sum', 'mean']).reset_index()
sales_summary

Сохранение данных с использованием библиотеки XlsxWriter следует проводить одним из следующих образов:
1-й способ
sales_summary.to_excel('table.xlsx', engine='xlsxwriter', index=False)2-й способ
with pd.ExcelWriter('table.xlsx', engine='xlsxwriter') as wb:
    sales_summary.to_excel(wb, sheet_name='Summary', index=False)
Используя первый способ данные просто сохраняются в файл table.xlsx с использованием движка XlsxWriter (требует, чтобы был установлен соответствующий пакет). В целом, когда нам не требуется применять форматирование, параметр engine можно и опустить.
Во втором случае, помимо того, что мы имеем возможность сохранить несколько DataFrame на одном или нескольких листах, так же возможно добавить ячейкам форматирование, вставить графики и специализированные таблицы.
Автофильтрация
Наиболее простой в реализации функцией форматирования будет добавления автофильтров. Для этого на соответствующем листе следует вызвать метод autofilter и указать диапазон применения фильтрования:
with pd.ExcelWriter('table.xlsx', engine='xlsxwriter') as wb:
    sales_summary.to_excel(wb, sheet_name='Sheet1', index=False)
    sheet = wb.sheets['Sheet1']
    sheet.autofilter('A1:C'+str(sales_summary.shape[0]))
Возможно применение и индексной нотации:
sheet.autofilter(0, 0, sales_summary.shape[0], 2)(Более подробно о autofilter по ссылке )
По документации требуется указывать полностью диапазон ячеек, использующихся в автофильтре, но в реальности excel корректно применяет фильтр даже когда указан только диапазон колонок, что несколько упрощает работу. Например, как в следующем случае:
sheet.autofilter(0, 0, 0, 2)Настройка размеров ячеек
Изначально XlsxWriter предоставляет нам инструменты для установки высоты и ширины как для целых строк и столбцов, так и для их диапазонов, с некоторой оговоркой.
Чтобы установить высоту одной строки следует использовать метод:
sheet.set_row(0, 20)где 0 – индекс строки, 20 – высота строки.
Для установки высоты нескольких строк потребуется провести итерацию по всем нужным строкам, или же можно установить значение высоты строки по умолчанию для всего документа:
sheet.set_default_row(20)Для установки ширины столбца есть такой метод:
sheet.set_column(0, 0, 30) # Установить ширину одного столбца A в 30
sheet.set_column(0, 2, 30) # Установить ширину столбцов A, B, C в 30
sheet.set_column('A:C', 30) # Установить ширину столбцов A, B, C в 30
Важно заметить, что хоть официальная документация и утверждает, что при настройке ширины столбцов не должно быть пересекающихся диапазонов, однако следующий код прекрасно работает:
with pd.ExcelWriter('table.xlsx', engine='xlsxwriter') as wb:
    sales_summary.to_excel(wb, sheet_name='Sheet1', index=False)
    sheet = wb.sheets['Sheet1']

    sheet.autofilter(0, 0, 0, 2)
    sheet.set_column('A:C', 30)
    sheet.set_column('B:B', 8)

Установка значения по умолчанию для ширины столбцов не предусмотрена автором библиотеки. Так же библиотека не предусматривает инструмента для определения автоматической ширины или высоты ячеек, приходится мириться с этим неудобством и искать похожие по функциям обходные решения на форумах (например, тут).
Форматирование текста
Форматирование текста, такое как изменение размера, шрифта, цвета и т.д. так же делается с использованием уже известных нам функций: set_column и set_row.
with pd.ExcelWriter('table.xlsx', engine='xlsxwriter') as wb:
    sales_summary.to_excel(wb, sheet_name='Sheet1', index=False)
    sheet = wb.sheets['Sheet1']

    cell_format = wb.book.add_format()
    cell_format.set_bold()
    cell_format.set_font_color('red')
    sheet.set_row(1, 40, cell_format) # Установка стиля для строки 2 и высоты 40

    cell_format = wb.book.add_format()
    cell_format.set_bold()
    cell_format.set_font_color('green')
    sheet.set_column(2, 2, 20, cell_format) # Установка стиля для столбца C и ширины 20

    cell_format = wb.book.add_format()
    cell_format.set_bold()
    cell_format.set_font_color('blue')
    sheet.set_column('A:B', 20, cell_format) # Установка стиля для столбцов A и B и ширины 20
В результате получаем следующий файл:

Из таблицы виден важный факт:
стиль ячеек не может быть перезаписан. На строку с заголовками pandas уже применил форматирование, таким образов мы на него уже воздействовать никак не можем. Аналогично со строкой 2, ячейки которой по идее должны были окраситься в синий и зеленый цвета, однако этого не произошло.
Если есть сильное желание придать свой собственный формат строке с заголовками таблицы, то можно сделать так:
with pd.ExcelWriter('table.xlsx', engine='xlsxwriter') as wb:
    sales_summary.to_excel(wb, sheet_name='Sheet1', index=False, header=False, startrow=1)
    sheet = wb.sheets['Sheet1']

    cell_format = wb.book.add_format()
    cell_format.set_font_color('purple')
    cell_format.set_bg_color('#AAAAAA')
    cell_format.set_font_size(18)

    sheet.write_row(0, 0, sales_summary.columns, cell_format) # сразу пишем целую строку данных
    # аналогично
    #for col, name in enumerate(sales_summary.columns):
    #    sheet.write(0, col, name, cell_format)

Добавление графиков
Помимо чистых цифр, бывает полезно добавить в таблицу некоторую сопровождающую информацию, например графики. Они могут быть сгенерированы средствами Excel или же как обыкновенное сгенерированное изображение.
Добавление сгенерированного изображения максимально просто и понятно.
- Создаём изображение
- Сохраняем его как файл
- Указываем полный или относительный путь к файлу изображения, ячейку, в которую хотим поместить изображение и дополнительные опции, если нужно (например отступ от края ячейки, масштабирование ширины, высоты изображения и т.д.. Подробнее о списке опций по ссылке
Пример добавления изображения в документ:
with pd.ExcelWriter('table.xlsx', engine='xlsxwriter') as wb:
    sales_summary.to_excel(wb, sheet_name='Sheet1', index=False)
    sheet = wb.sheets['Sheet1']
    sheet.set_column('A:C', 12)

    plt.pie(sales_summary['sum'], labels=sales_summary['name'], radius=1.4)
    plt.savefig('pie.jpeg', dpi=200, bbox_inches='tight')
    sheet.insert_image('E2', 'pie.jpeg')

С другой стороны, для добавления графиков используется непосредственно средствами библиотеки XlsxWriter метод add_chart объекта типа worksheet, в параметрах которого можно указать тип графика (pie в данном случае). После этого нужно заполнить списки категорий и значений через метод add_series. Данный метод принимает ссылки в буквенной и в численной нотации.
Перед добавлением графика на лист, можно дополнительно отформатировать внешний вид легенды, добавить ещё данных на ту же область, добавить названия осей и т.д. Под конец необходимо добавить график на лист вызовом метода insert_chart. Более подробно о работе с графиками в XlsxWriter можно почитать по ссылке
with pd.ExcelWriter('table.xlsx', engine='xlsxwriter') as wb:
    sales_summary.to_excel(wb, sheet_name='Sheet1', index=False)
    sheet = wb.sheets['Sheet1']
    sheet.set_column('A:C', 12)

    chart = wb.book.add_chart({'type': 'pie'})
    chart.add_series({
        'categories': '=Sheet1!$A$2:$A$'+str(sales_summary.shape[0]+1),
        'values':     '=Sheet1!$B$2:$B$'+str(sales_summary.shape[0]+1),
    })
    # Аналогично
    #chart.add_series({
    #    'categories': ['Sheet1', 1, 0, sales_summary.shape[0], 0],
    #    'values':     ['Sheet1', 1, 1, sales_summary.shape[0], 1],
    #})
    chart.set_legend({'position': 'bottom'})

    sheet.insert_chart('E2', chart, {
        'x_scale': 2, 'y_scale': 2
    })
    #Аналогично
    #sheet.insert_chart(1, 4, chart, {
    #    'x_scale': 1.5, 'y_scale': 2
    #})

Мы рассмотрели некоторые возможности, которые предоставляет нам связка библиотек Pandas и XlsxWriter. Их очень легко и удобно встраивать в собственные проекты. Использование средств, описанных в данной статье, не исчерпывают все возможности этих библиотек, но даже с этим скромным инструментарием в кармане, вы можете сделать ваши выгрузки намного более информативными и приятными глазу.
You can use conditional_format:
df = pd.DataFrame({'Pass/Fail':['Pass','Fail','Fail'],
                   'expect':[1,2,3]})
print (df)
  Pass/Fail  expect
0      Pass       1
1      Fail       2
2      Fail       3

writer = pd.ExcelWriter('pandas_conditional.xlsx', engine='xlsxwriter')
df.to_excel(writer, sheet_name='Sheet1')
workbook  = writer.book
worksheet = writer.sheets['Sheet1']
red_format = workbook.add_format({'bg_color':'red'})
green_format = workbook.add_format({'bg_color':'green'})

worksheet.conditional_format('B2:B4', {'type': 'text',
                                      'criteria': 'containing',
                                       'value':     'Fail',
                                       'format': red_format})

worksheet.conditional_format('B2:B4', {'type': 'text',
                                      'criteria': 'containing',
                                       'value':   'Pass',
                                       'format':  green_format})
writer.save()
More dynamic solution with get_loc for position of column and mapping with dictionary:
import string

df = pd.DataFrame({'Pass/Fail':['Pass','Fail','Fail'],
                   'expect':[1,2,3]})
print (df)
  Pass/Fail  expect
0      Pass       1
1      Fail       2
2      Fail       3
writer = pd.ExcelWriter('pandas_conditional.xlsx', engine='xlsxwriter')
df.to_excel(writer, sheet_name='Sheet1')
workbook  = writer.book
worksheet = writer.sheets['Sheet1']
red_format = workbook.add_format({'bg_color':'red'})
green_format = workbook.add_format({'bg_color':'green'})

#dict for map excel header, first A is index, so omit it
d = dict(zip(range(25), list(string.ascii_uppercase)[1:]))
print (d)
{0: 'B', 1: 'C', 2: 'D', 3: 'E', 4: 'F', 5: 'G', 6: 'H', 7: 'I', 8: 'J',
 9: 'K', 10: 'L', 11: 'M', 12: 'N', 13: 'O', 14: 'P', 15: 'Q', 16: 'R',
 17: 'S', 18: 'T', 19: 'U', 20: 'V', 21: 'W', 22: 'X', 23: 'Y', 24: 'Z'}

#set column for formatting
col = 'Pass/Fail'
excel_header = str(d[df.columns.get_loc(col)])
#get length of df
len_df = str(len(df.index) + 1)
rng = excel_header + '2:' + excel_header + len_df
print (rng)
B2:B4

worksheet.conditional_format(rng, {'type': 'text',
                                      'criteria': 'containing',
                                       'value':     'Fail',
                                       'format': red_format})

worksheet.conditional_format(rng, {'type': 'text',
                                      'criteria': 'containing',
                                       'value':   'Pass',
                                       'format':  green_format})
writer.save()
EDIT1:
Thank you jmcnamara for comment and for XlsxWriter
col = 'Pass/Fail'
loc = df.columns.get_loc(col) + 1
len_df = len(df.index) + 1

worksheet.conditional_format(1,loc,len_df,loc, {'type': 'text',
                                      'criteria': 'containing',
                                       'value':     'Fail',
                                       'format': red_format})

worksheet.conditional_format(1,loc,len_df,loc, {'type': 'text',
                                      'criteria': 'containing',
                                       'value':   'Pass',
                                       'format':  green_format})
writer.save()
EDIT:
Another solution with last version of pandas (0.20.1) and styles:
df = pd.DataFrame({'Pass/Fail':['Pass','Fail','Fail'],
                   'expect':['d','f','g']})
print (df)
  Pass/Fail expect
0      Pass      d
1      Fail      f
2      Fail      g

def f(x):
    col = 'Pass/Fail'
    r = 'background-color: red'
    g = 'background-color: green'
    c = np.where(x[col] == 'Pass', g, r)
    y = pd.DataFrame('', index=x.index, columns=x.columns)
    y[col] = c
    return y

styled = df.style.apply(f, axis=None)
styled.to_excel('styled.xlsx', engine='openpyxl')
Python Pandas is a Python data analysis
library. It can read, filter and re-arrange small and large data sets and
output them in a range of formats including Excel.
Pandas writes Excel xlsx files using either openpyxl or XlsxWriter.
Using XlsxWriter with Pandas
To use XlsxWriter with Pandas you specify it as the Excel writer engine:
import pandas as pd

# Create a Pandas dataframe from the data.
df = pd.DataFrame({'Data': [10, 20, 30, 20, 15, 30, 45]})

# Create a Pandas Excel writer using XlsxWriter as the engine.
writer = pd.ExcelWriter('pandas_simple.xlsx', engine='xlsxwriter')

# Convert the dataframe to an XlsxWriter Excel object.
df.to_excel(writer, sheet_name='Sheet1')

# Close the Pandas Excel writer and output the Excel file.
writer.close()
The output from this would look like the following:
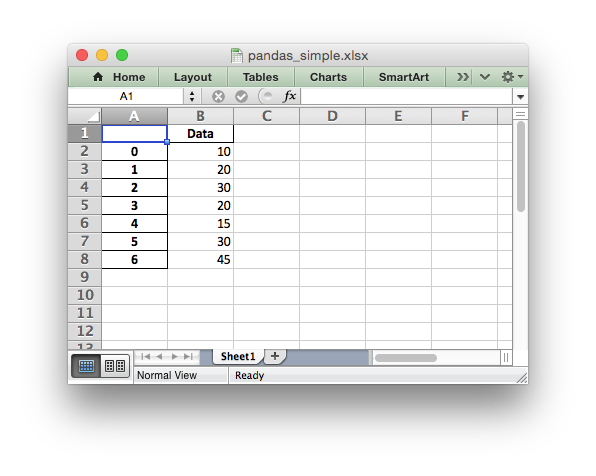
See the full example at Example: Pandas Excel example.
Accessing XlsxWriter from Pandas
In order to apply XlsxWriter features such as Charts, Conditional Formatting
and Column Formatting to the Pandas output we need to access the underlying
workbook and worksheet objects. After
that we can treat them as normal XlsxWriter objects.
Continuing on from the above example we do that as follows:
import pandas as pd

# Create a Pandas dataframe from the data.
df = pd.DataFrame({'Data': [10, 20, 30, 20, 15, 30, 45]})

# Create a Pandas Excel writer using XlsxWriter as the engine.
writer = pd.ExcelWriter('pandas_simple.xlsx', engine='xlsxwriter')

# Convert the dataframe to an XlsxWriter Excel object.
df.to_excel(writer, sheet_name='Sheet1')

# Get the xlsxwriter objects from the dataframe writer object.
workbook  = writer.book
worksheet = writer.sheets['Sheet1']
This is equivalent to the following code when using XlsxWriter on its own:
workbook  = xlsxwriter.Workbook('filename.xlsx')
worksheet = workbook.add_worksheet()
The Workbook and Worksheet objects can then be used to access other XlsxWriter
features, see below.
Adding Charts to Dataframe output
Once we have the Workbook and Worksheet objects, as shown in the previous
section, we we can use them to apply other features such as adding a chart:
# Get the xlsxwriter objects from the dataframe writer object.
workbook  = writer.book
worksheet = writer.sheets['Sheet1']

# Create a chart object.
chart = workbook.add_chart({'type': 'column'})

# Get the dimensions of the dataframe.
(max_row, max_col) = df.shape

# Configure the series of the chart from the dataframe data.
chart.add_series({'values': ['Sheet1', 1, 1, max_row, 1]})

# Insert the chart into the worksheet.
worksheet.insert_chart(1, 3, chart)
The output would look like this:
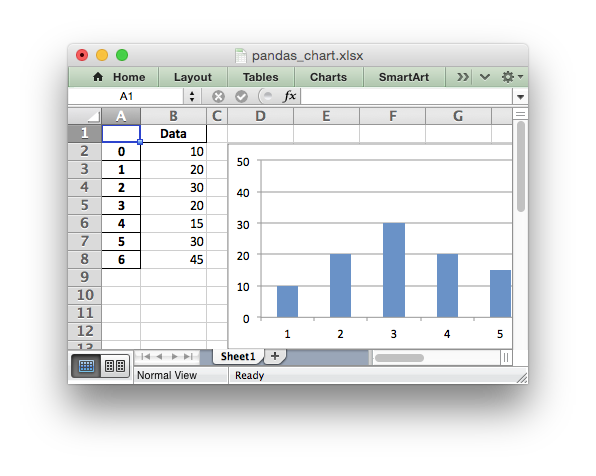
See the full example at Example: Pandas Excel output with a chart.
Formatting of the Dataframe output
XlsxWriter and Pandas provide very little support for formatting the output
data from a dataframe apart from default formatting such as the header and
index cells and any cells that contain dates or datetimes. In addition it
isn’t possible to format any cells that already have a default format applied.
If you require very controlled formatting of the dataframe output then you
would probably be better off using Xlsxwriter directly with raw data taken
from Pandas. However, some formatting options are available.
For example it is possible to set the default date and datetime formats via
the Pandas interface:
writer = pd.ExcelWriter("pandas_datetime.xlsx",
                        engine='xlsxwriter',
                        datetime_format='mmm d yyyy hh:mm:ss',
                        date_format='mmmm dd yyyy')
Which would give:
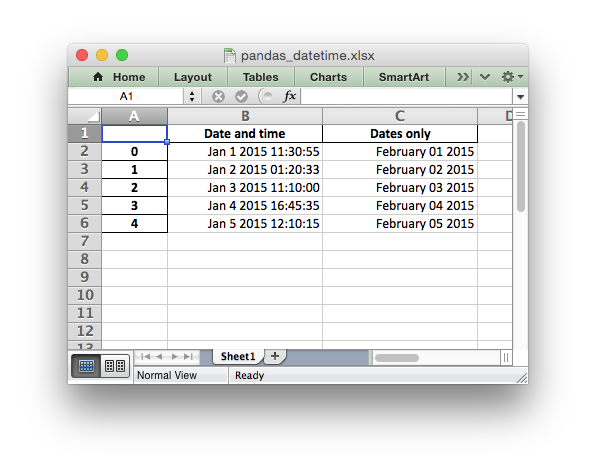
See the full example at Example: Pandas Excel output with datetimes.
It is possible to format any other, non date/datetime column data using
set_column():
# Add some cell formats.
format1 = workbook.add_format({'num_format': '#,##0.00'})
format2 = workbook.add_format({'num_format': '0%'})

# Set the column width and format.
worksheet.set_column(1, 1, 18, format1)

# Set the format but not the column width.
worksheet.set_column(2, 2, None, format2)
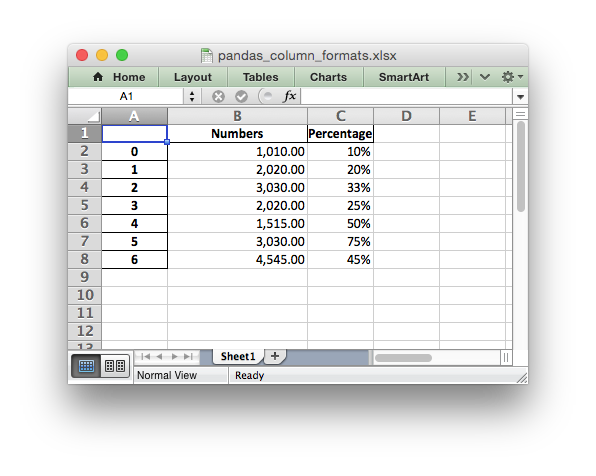
See the full example at Example: Pandas Excel output with column formatting.
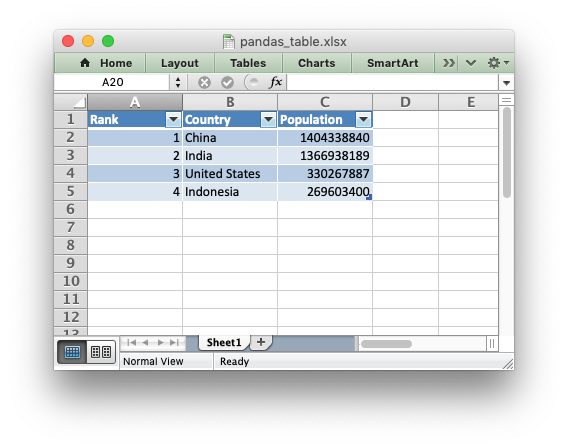
Adding a Dataframe to a Worksheet Table
As explained in Working with Worksheet Tables, tables in Excel are a way of grouping a range
of cells into a single entity, like this:
The way to do this with a Pandas dataframe is to first write the data without
the index or header, and by starting 1 row forward to allow space for the
table header:
df.to_excel(writer, sheet_name='Sheet1',
            startrow=1, header=False, index=False)
We then create a list of headers to use in add_table():
column_settings = [{'header': column} for column in df.columns]
Finally we add the Excel table structure, based on the dataframe shape and
with the column headers we generated from the dataframe columns:
(max_row, max_col) = df.shape

worksheet.add_table(0, 0, max_row, max_col - 1, {'columns': column_settings})
See the full example at Example: Pandas Excel output with a worksheet table.
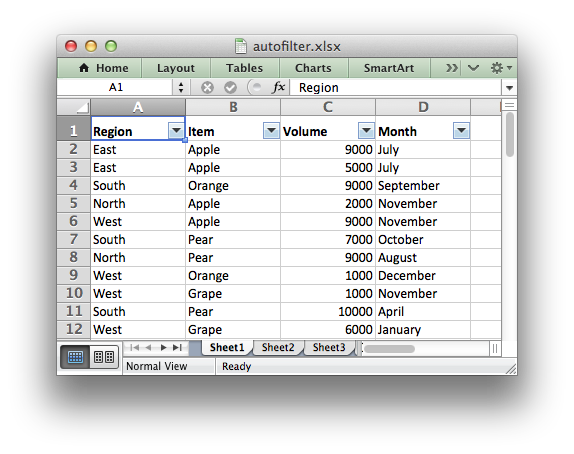
Adding an autofilter to a Dataframe output
As explained in Working with Autofilters, autofilters in Excel are a
way of filtering a 2d range of data to only display rows that match a user
defined criteria.
The way to do this with a Pandas dataframe is to first write the data without
the index (unless you want to include it in the filtered data):
df.to_excel(writer, sheet_name='Sheet1', index=False)
We then get the dataframe shape and add the autofilter:
worksheet.autofilter(0, 0, max_row, max_col - 1)
We can also add an optional filter criteria. The placeholder “Region” in the
filter is ignored and can be any string that adds clarity to the expression:
worksheet.filter_column(0, 'Region == East')
However, it isn’t enough to just apply the criteria. The rows that don’t match
must also be hidden. We use Pandas to figure our which rows to hide:
for row_num in (df.index[(df['Region'] != 'East')].tolist()):
    worksheet.set_row(row_num + 1, options={'hidden': True})
This gives us a filtered worksheet like this:
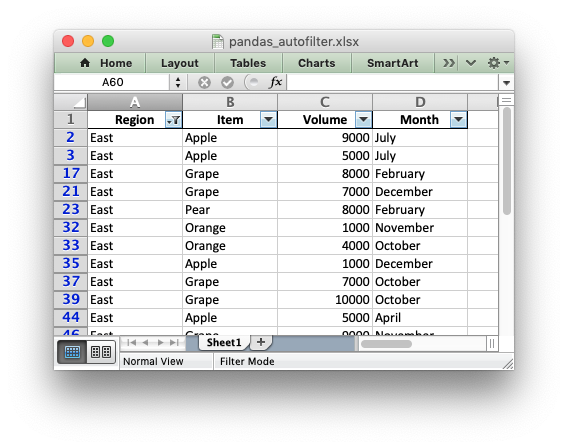
See the full example at Example: Pandas Excel output with an autofilter.
Handling multiple Pandas Dataframes
It is possible to write more than one dataframe to a worksheet or to several
worksheets. For example to write multiple dataframes to multiple worksheets:
# Write each dataframe to a different worksheet.
df1.to_excel(writer, sheet_name='Sheet1')
df2.to_excel(writer, sheet_name='Sheet2')
df3.to_excel(writer, sheet_name='Sheet3')
See the full example at Example: Pandas Excel with multiple dataframes.
It is also possible to position multiple dataframes within the same
worksheet:
# Position the dataframes in the worksheet.
df1.to_excel(writer, sheet_name='Sheet1')  # Default position, cell A1.
df2.to_excel(writer, sheet_name='Sheet1', startcol=3)
df3.to_excel(writer, sheet_name='Sheet1', startrow=6)

# Write the dataframe without the header and index.
df4.to_excel(writer, sheet_name='Sheet1',
             startrow=7, startcol=4, header=False, index=False)
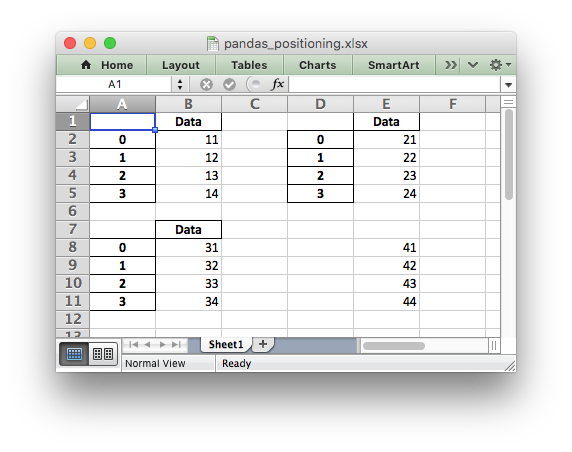
See the full example at Example: Pandas Excel dataframe positioning.
Passing XlsxWriter constructor options to Pandas
XlsxWriter supports several Workbook() constructor options such as
strings_to_urls(). These can also be applied to the Workbook object
created by Pandas using the engine_kwargs keyword:
writer = pd.ExcelWriter('pandas_example.xlsx',
                        engine='xlsxwriter',
                        engine_kwargs={'options': {'strings_to_numbers': True}})
Note, versions of Pandas prior to 1.3.0 used this syntax:
writer = pd.ExcelWriter('pandas_example.xlsx',
                        engine='xlsxwriter',
                        options={'strings_to_numbers': True})
Saving the Dataframe output to a string
It is also possible to write the Pandas XlsxWriter DataFrame output to a
byte array:
import pandas as pd
import io

# Create a Pandas dataframe from the data.
df = pd.DataFrame({'Data': [10, 20, 30, 20, 15, 30, 45]})

output = io.BytesIO()

# Use the BytesIO object as the filehandle.
writer = pd.ExcelWriter(output, engine='xlsxwriter')

# Write the data frame to the BytesIO object.
df.to_excel(writer, sheet_name='Sheet1')

writer.close()
xlsx_data = output.getvalue()

# Do something with the data...
Note: This feature requires Pandas >= 0.17.
В Pandas есть встроенная функция для сохранения датафрейма в электронную таблицу Excel. Все очень просто:
|
df.to_excel( path ) # где path это путь до файла, куда будем сохранять |
Как записать в лист с заданным именем
В этом случае будет создан xls / xlsx файл, а данные сохранятся на лист с именем Sheet1. Если хочется сохранить на лист с заданным именем, то можно использовать конструкцию:
|
df.to_excel( path, sheet_name=«Лист 1») # где sheet_name название листа |
Как записать в один файл сразу два листа
Но что делать, если хочется записать в файл сразу два листа? Логично было бы использовать две команды
df.to_excel друг за другом, но с одним путем до файла и разными
sheet_name , однако в Pandas это так не работает. Для решения этой задачи придется использовать конструкцию посложнее:
|
from pandas.io.excel import ExcelWriter with ExcelWriter(path) as writer: df.sample(10).to_excel(writer, sheet_name=«Лист 1») df.sample(10).to_excel(writer, sheet_name=«Лист 2») |
В результате будет создан файл Excel, где будет два листа с именами Лист 1 и Лист 2.
Как добавить ещё один лист у уже существующему файлу
Если использовать предыдущий код, то текущий файл будет перезаписан и в него будет записан новый лист. Старые данные при этом, ожидаемо, будут утеряны. Выход есть, достаточно лишь добавить модификатор «a» (append):
|
with ExcelWriter(path, mode=«a») as writer: df.sample(10).to_excel(writer, sheet_name=«Лист 3») |
Но что, если оставить этот код, удалить существующий файл Excel и попробовать выполнить код? Получим ошибку Файл не найден. В Python существует модификатор «a+», который создает файл, если его нет, и открывает его на редактирование, если файл существует. Но в Pandas такого модификатора не существует, поэтому мы должны выбрать модификатор для ExcelWriter в зависимости от наличия или отсутствия файла. Но это не сложно:
|
with ExcelWriter(path, mode=«a» if os.path.exists(path) else «w») as writer: df.sample().to_excel(writer, sheet_name=«Лист 4») |
К сожалению в Pandas, на момент написания поста, такого функционала нет. Но это можно реализовать с помощью пакета openpyxl. Вот пример такой функции:
|
def update_spreadsheet(path : str, _df, starcol : int = 1, startrow : int = 1, sheet_name : str =«ToUpdate»): »’ :param path: Путь до файла Excel :param _df: Датафрейм Pandas для записи :param starcol: Стартовая колонка в таблице листа Excel, куда буду писать данные :param startrow: Стартовая строка в таблице листа Excel, куда буду писать данные :param sheet_name: Имя листа в таблице Excel, куда буду писать данные :return: »’ wb = ox.load_workbook(path) for ir in range(0, len(_df)): for ic in range(0, len(_df.iloc[ir])): wb[sheet_name].cell(startrow + ir, starcol + ic).value = _df.iloc[ir][ic] wb.save(path) |
Как работает код и пояснения смотри в видео
Если у тебя есть вопросы, что-то не получается или ты знаешь как решить задачи в посте лучше и эффективнее (такое вполне возможно) то смело пиши в комментариях к видео.
When I want to save the current state of a pandas DataFrame for “manual consumption”, I often write df.to_excel('foo.xlsx') within my IPython session or Jupyter Notebook. However, the default style does not look pretty and often needs manual adjustments (e.g. column widths) to be usable.
If you want to create custom reports from pandas, you therefore might want to to this styling programmatically. Package openpyxl does this job nicely. Here is a motivational example that shows you the basic ways of its API. First, have some random data:
import pandas as pd
from io import StringIO

df = pd.read_csv(StringIO("""
               alpha      beta     gamma
2000-01-01 -0.173215  0.119209 -1.044236
2000-01-02 -0.861849 -2.104569 -0.494929
2000-01-03  1.071804  0.721555 -0.706771
2000-01-04 -1.039575  0.271860 -0.424972
2000-01-05  0.567020  0.276232 -1.087401
2000-01-06 -0.673690  0.113648 -1.478427
2000-01-07  0.524988  0.404705  0.577046
2000-01-08 -1.715002 -1.039268 -0.370647
"""), sep="s+", parse_dates=True)

output_filename = 'pandas-to-excel.xlsx'
No customization
Just for comparison, a plain export of the dataframe to the first worksheet:
sheet_name = 'No customization'
df.to_excel(output_filename, sheet_name)
Little customisation
As the first column is not readable with the default column width, we increase it slightly. The unit roughly corresponds to Excel’s column width unit. On my machine, the resulting worksheets has a column width of 20.29…
with pd.ExcelWriter(
        output_filename,
        mode='a',  # append; default='w' (overwrite)
        engine='openpyxl') as xlsx:
    sheet_name = 'Little customization'
    df.to_excel(xlsx, sheet_name)

    # set index column width
    ws = xlsx.sheets[sheet_name]
    ws.column_dimensions['A'].width = 21
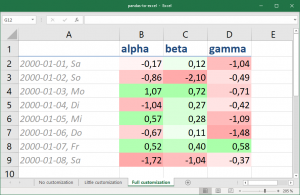
Full customisation
Motivational example of what you can do with some more specifications, namely:
- Conditional formatting, here with a custom color scale using percentiles for lower and upper bound (10%-90%), while the midpoint is defined by value (0 is white). Symbols and color bars are possible as well, of course.
- Number format, using the same syntax as in Excel’s cell properties dialogue. Here, the index column’s date includes the shortened weekday name (Mo-Su).
- Applying a builtin named style by name (Headline 2) to the title row.
- Creating and applying a custom named style (Index Style) including number format, font and alignment.
First, the imports and rule/style definitions:
from openpyxl.formatting.rule import ColorScaleRule
from openpyxl.styles import Alignment, Font, NamedStyle
from openpyxl.utils import get_column_letter

percentile_rule = ColorScaleRule(
    start_type='percentile',
    start_value=10,
    start_color='ffaaaa',  # red-ish
    mid_type='num',
    mid_value=0,
    mid_color='ffffff',  # white
    end_type='percentile',
    end_value=90,
    end_color='aaffaa')  # green-ish

# custom named style for the index
index_style = NamedStyle(
    name="Index Style",
    number_format='YYYY-MM-DD, DDD',
    font=Font(color='999999', italic=True),
    alignment=Alignment(horizontal='left'))

# pass keyword args as dictionary
writer_args = {
    'path': output_filename,
    'mode': 'a',
    'engine': 'openpyxl'}
With that, the actual writing looks like this:
with pd.ExcelWriter(**writer_args) as xlsx:
    sheet_name = 'Full customization'
    df.to_excel(xlsx, sheet_name)
    ws = xlsx.sheets[sheet_name]

    # cell ranges
    index_column = 'A'
    value_cells = 'B2:{col}{row}'.format(
        col=get_column_letter(ws.max_column),
        row=ws.max_row)
    title_row = '1'

    # index column width
    ws.column_dimensions[index_column].width = 21

    # color all value cells
    ws.conditional_formatting.add(value_cells,
                                  percentile_rule)

    # for general styling, one has to iterate over
    # all cells individually
    for row in ws[value_cells]:
        for cell in row:
            cell.number_format = '0.00'

    # builtin or named styles can be applied by using
    # the style object or their name (shown below)
    for cell in ws[index_column]:
        cell.style = index_style

    # style title row last, so that headline style
    # wins over index style in top-left cell A1
    for cell in ws[title_row]:
        cell.style = 'Headline 2'
If you want the above in one script, try my gist pandas-to-excel.py. It creates a single Excel file with the three appropriately named spreadsheets.