
Время на прочтение
6 мин
Количество просмотров 349K
Добрый день, уважаемые читатели.
В сегодняшней статье я хотел бы, как можно подробнее, рассмотреть интеграцию приложений Python и MS Excel. Данные вопрос может возникнуть, например, при создании какой-либо системы онлайн отчетности, которая должна выгружать результаты в общепринятый формат ну или какие-либо другие задачи. Также в статье я покажу и обратную интеграцию, т.е. как использовать функцию написанную на python в Excel, что также может быть полезно для автоматизации отчетов.
Работаем с файлами MS Excel на Python
Для работы с Excel файлами из Python мне известны 2 варианта:
- Использование библиотек, таких как xlrd, xlwt, xlutils или openpyxl
- Работа с com-объектом
Рассмотрим работу с этими способами подробнее. В качестве примера будем использовать готовый файл excel из которого мы сначала считаем данные из первой ячейки, а затем запишем их во вторую. Таких простых примеров будет достаточно для первого ознакомления.
Использование библиотек
Итак, первый метод довольно простой и хорошо описан. Например, есть отличная статья для описания работы c xlrd, xlwt, xlutils. Поэтому в данном материале я приведу небольшой кусок кода с их использованием.
Для начала загрузим нужные библиотеки и откроем файл xls на чтение и выберем
нужный лист с данными:
import xlrd, xlwt
#открываем файл
rb = xlrd.open_workbook('../ArticleScripts/ExcelPython/xl.xls',formatting_info=True)

#выбираем активный лист
sheet = rb.sheet_by_index(0)
Теперь давайте посмотрим, как считать значения из нужных ячеек:
#получаем значение первой ячейки A1
val = sheet.row_values(0)[0]

#получаем список значений из всех записей
vals = [sheet.row_values(rownum) for rownum in range(sheet.nrows)]
Как видно чтение данных не составляет труда. Теперь запишем их в другой файл. Для этого создам новый excel файл с новой рабочей книгой:
wb = xlwt.Workbook()
ws = wb.add_sheet('Test')
Запишем в новый файл полученные ранее данные и сохраним изменения:
#в A1 записываем значение из ячейки A1 прошлого файла
ws.write(0, 0, val[0])

#в столбец B запишем нашу последовательность из столбца A исходного файла
i = 0
for rec in vals:
    ws.write(i,1,rec[0])
    i =+ i

#сохраняем рабочую книгу
wb.save('../ArticleScripts/ExcelPython/xl_rec.xls')
Из примера выше видно, что библиотека xlrd отвечает за чтение данных, а xlwt — за запись, поэтому нет возможности внести изменения в уже созданную книгу без ее копирования в новую. Кроме этого указанные библиотеки работают только с файлами формата xls (Excel 2003) и у них нет поддержки нового формата xlsx (Excel 2007 и выше).
Чтобы успешно работать с форматом xlsx, понадобится библиотека openpyxl. Для демонстрации ее работы проделаем действия, которые были показаны для предыдущих библиотек.
Для начала загрузим библиотеку и выберем нужную книгу и рабочий лист:
import openpyxl
wb = openpyxl.load_workbook(filename = '../ArticleScripts/ExcelPython/openpyxl.xlsx')
sheet = wb['test']
Как видно из вышеприведенного листинга сделать это не сложно. Теперь посмотрим как можно считать данные:
#считываем значение определенной ячейки
val = sheet['A1'].value

#считываем заданный диапазон
vals = [v[0].value for v in sheet.range('A1:A2')]
Отличие от прошлых библиотек в том, что openpyxl дает возможность отображаться к ячейкам и последовательностям через их имена, что довольно удобно и понятно при чтении программы.
Теперь посмотрим как нам произвести запись и сохранить данные:
#записываем значение в определенную ячейку
sheet['B1'] = val

#записываем последовательность
i = 0
for rec in vals:
    sheet.cell(row=i, column=2).value = rec
    i =+ 1

# сохраняем данные
wb.save('../ArticleScripts/ExcelPython/openpyxl.xlsx')
Из примера видно, что запись, тоже производится довольно легко. Кроме того, в коде выше, можно заметить, что openpyxl кроме имен ячеек может работать и с их индексами.
К недостаткам данной библиотеки можно отнести, то что, как и в предыдущем примере, нет возможности сохранить изменения без создания новой книги.
Как было показано выше, для более менее полноценной работы с excel файлами, в данном случае, нужно 4 библиотеки, и это не всегда удобно. Кроме этого, возможно нужен будет доступ к VBA (допустим для какой-либо последующей обработки) и с помощью этих библиотек его не получить.
Однако, работа с этими библиотеками достаточно проста и удобна для быстрого создания Excel файлов их форматирования, но если Вам надо больше возможностей, то следующий подпункт для Вас.
Работа с com-объектом
В своих отчетах я предпочитаю использовать второй способ, а именно использование файла Excel через com-объект с использованием библиотеки win32com. Его преимуществом, является то, что вы можете выполнять с файлом все операции, которые позволяет делать обычный Excel с использованием VBA.
Проиллюстрируем это на той же задаче, что и предыдущие примеры.
Для начала загрузим нужную библиотеку и создадим COM объект.
import win32com.client
Excel = win32com.client.Dispatch("Excel.Application")
Теперь мы можем работать с помощью объекта Excel мы можем получить доступ ко всем возможностям VBA. Давайте, для начала, откроем любую книгу и выберем активный лист. Это можно сделать так:
wb = Excel.Workbooks.Open(u'D:\Scripts\DataScience\ArticleScripts\ExcelPython\xl.xls')
sheet = wb.ActiveSheet
Давайте получим значение первой ячейки и последовательности:
#получаем значение первой ячейки
val = sheet.Cells(1,1).value

#получаем значения цепочки A1:A2
vals = [r[0].value for r in sheet.Range("A1:A2")]
Как можно заметить, мы оперируем здесь функциями чистого VBA. Это очень удобно если у вас есть написанные макросы и вы хотите использовать их при работе с Python при минимальных затратах на переделку кода.
Посмотрим, как можно произвести запись полученных значений:
#записываем значение в определенную ячейку
sheet.Cells(1,2).value = val

#записываем последовательность
i = 1
for rec in vals:
    sheet.Cells(i,3).value = rec
    i = i + 1

#сохраняем рабочую книгу
wb.Save()

#закрываем ее
wb.Close()

#закрываем COM объект
Excel.Quit()
Из примера видно, что данные операции тоже довольно просто реализовываются. Кроме этого, можно заметить, что изменения мы сохранили в той же книге, которую открыли для чтения, что достаточно удобно.
Однако, внимательный читатель, обратит внимание на переменную i, которая инициализируется не 0, как принято python, а 1. Это связано с тем, что мы работаем с индексами ячеек как из VBA, а там нумерация начинается не с 0, а с 1.
На этом закончим разбор способов работы с excel файлами в python и перейдем к обратной задаче.
Вызываем функции Python из MS Excel
Может возникнуть такая ситуация, что у вас уже есть какой-либо функция, которая обрабатывает данные на python, и нужно перенести ее функциональность в Excel. Конечно же можно переписать ее на VBA, но зачем?
Для использования функций python в Excel есть прекрасная надстройка ExcelPython. С ее помощью вы сможете вызывать функции написанные на python прямо из Excel, правда придется еще написать небольшую обертку на VBA, и все это будет показано ниже.
Итак, предположим у нас есть функция, написанная на python, которой мы хотим воспользоваться:
def get_unique(lists):
    sm = 0
    for i in lists:
        sm = sm + int(i.pop())
    return sm
На вход ей подается список, состоящий из списков, это одно из условий, которое должно выполняться для работы данной функции в Excel.
Сохраним функцию в файле plugin.py и положим его в ту же директорию, где будет лежать наш excel файл, с которым мы будем работать.
Теперь установим ExcelPython. Установка происходит через запуск exe-файла и не вызывает затруднений.
Когда все приготовления выполнены, открываем тестовый файл excel и вызовем редактор VBA (Alt+F11). Для работы с вышеуказанной надстройкой необходимо ее подключить, через Tools->References, как показано на рисунке:

Ну что же, теперь можно приступить к написанию функции-обертки для нашего Python-модуля plugin.py. Выглядеть она будет следующим образом:
Function sr(lists As Range)
    On Error GoTo do_error
        Set plugin = PyModule("plugin", AddPath:=ThisWorkbook.Path)
        Set result = PyCall(plugin, "get_unique", PyTuple(lists.Value2))
        sr = WorksheetFunction.Transpose(PyVar(result))
        Exit Function
do_error:
        sr = Err.Description
End Function
Итак, что же происходит в данной функции?
Для начала, с помощью PyModule, мы подключаем нужный модуль. Для этого в качестве параметров ей передается имя модуля без расширения, и путь до папки в которой он находится. На выходе работы PyModule мы получаем объект для работы с модулем.
Затем, с помощью PyCall, вызываем нужную нам функцию из указанного модуля. В качестве параметров PyCall получает следующее:
- Объект модуля, полученный на предыдущем шаге
- Имя вызываемой функции
- Параметры, передаваемые функции (передаются в виде списка)
Функция PyTuple, получает на вход какие-либо значения и преобразует их в объект tuple языка Python.
Ну и, соответственно, PyVar выполняет операцию преобразования результата функции python, к типу понятному Excel.
Теперь, чтобы убедиться в работоспособности нашей связки, вызовем нашу свежеиспеченую функцию на листе в Excel:

Как видно из рисунка все отработало правильно.
Надо отметить, что в данном материале используется старая версия ExcelPython, и на GitHub’e автора доступна новая версия.
Заключение
В качестве заключения, надо отметить, примеры в данной статье самые простые и для более глубоко изучения данных методов, я рекомендую обратиться к
документации по нужным пакетам.
Также хочу заметить, что указанные пакеты не являются единственными и в статье опущено рассмотрение, таких пакетов как xlsxwriter для генерации excel файлов или xlwings, который может работать с Excel файлами «на лету», а также же PyXLL, который выполняет аналогичные функции ExcelPython.
Кроме этого в статье я попытался несколько обобщить разборасанный по сети материал, т.к. такие вопросы часто фигурируют на форумах и думаю некоторым будет полезно иметь, такую «шпаргалку» под рукой.
Содержание
- Working With Excel in Python
- Introduction
- Setup
- Loading an Excel File
- Processing an Excel File – Common Cases
- Processing Cells
- Advanced Addressing of Cells
- Cell Iterators
- Writing an Excel File
- Modifying Individual Cells
- Adding and Removing Sheets
- Adding and Removing Rows, Columns, and Cells
- Working With Formulas
- Calculating the Values of All Formulas
- Compiling Individual Formulas as Python Functions
- Handling Dependencies of Formulas
- Computing Formulas Over Cell Ranges
- Adding New Formula Functions
- Conclusions
- Read more:
- The Best Programming Languages
Working With Excel in Python

Introduction
Excel is ubiquitous. Many software projects originate from some company or process overgrowing the Excel spreadsheets that were being employed to manage it. As application developers, more than once we’ve had to reverse-engineer Excel files and translate them into a software application. Exploring working with Excel in Python is the goal of this article.
Excel is also quite common as an export format for data, and sometimes also as an input format. And while Excel is not by any means a domain-specific language, we can sometimes consider it as part of the “notation” that some domain experts use to formalize their problems. Thus, software that can “speak” Excel is often closer to its users. Even when the long-term objective is to convert them to an application or to a domain-specific language (DSL), it’s often a good idea to provide an automated migration path from Excel, as well as borrowing notation from Excel.
For example, an application could consume existing Excel files that people use to exchange among themselves as part of the project, effectively gaining the ability to “speak the same language” as the users. Or, it could produce a spreadsheet as the output of some query or calculation, because some users may want to further expand on it to compile a report with additional charts and formulas.
In this tutorial, we’ll explore working with Excel spreadsheets in Python, using the openpyxl library and other tools. In particular, we’ll learn how to:
- Process Excel files as input, with various methods to access the data in them;
- Evaluate formulas;
- Write Excel files as output.
Note: here, we’re talking about “modern” (2010) XML-based Excel files only, that have a .xlsx extension. Openpyxl does not support legacy binary Excel files (.xls). There are other solutions for that that we won’t explore in this tutorial.
All the sample code shown in this tutorial is available in our GitHub repository.
Setup
In the following, we assume a UNIX-like environment – Linux, OSX, or WSL, the Windows Substrate for Linux. As the first step, we’ll create a directory to hold our project:
Alternatively, if we plan to push our code on GitHub, we may create a repository on GitHub first, and clone it on our local machine:
This will give us the option to have GitHub generate a .gitignore file for Python, a README file, and a license file for us.
After we’ve created the project root directory, we can use pip to install openpyxl. We may want to set a virtual environment up so that we don’t pollute our system’s Python installation:
Having activated the environment, we should see it reflected in our shell prompt, like this:
We’ll then write a requirements.txt file that lists our dependencies:
Even if we only have a single dependency right now, explicitly listing it in a file that can be interpreted by the machine will make it easier for other developers to work on our project – including a future version of ourselves that has long forgotten about it.
Then, we’ll install the required dependencies with pip:
We can also easily automate these steps in our CI pipeline, such as GitHub actions.
Loading an Excel File
In Openpyxl, an Excel file is called a “workbook” and is represented by an instance of the class openpyxl.workbook.Workbook. Opening one is super easy:
 A glimpse into the results of calling load_workbook
Openpyxl opens workbooks for reading and for writing at the same time unless we specify that we want a read-only workbook with read_only=True as an argument to load_workbook.
When we finish working with an Excel file, we have to close it:
Unfortunately, a Workbook is not a “context manager”, so we cannot use Python’s with statement to automatically close it when we’re done. Instead, we have to manually arrange to close it even in case of exceptions:
Processing an Excel File – Common Cases
In general, workbooks may contain multiple sheets, so in order to access the data in an Excel file, we first need to choose a sheet to work on.
Later on, we’ll see how to process multiple worksheets, but for now, we’ll assume that the data that we’re interested in is in the active sheet – the one that the user will see when they open the file in their spreadsheet application:
This is quite often the only sheet in the document, actually.
Now that we have a sheet, we can access the data in its cells in several ways.
Iterating over rows. We can process the data one row at a time, using a Pythonic generator:
The rows that rows() yields are themselves generators, and we can iterate through them:
Or we can access them by index:
Actually, the sheet itself is iterable in row order, so we can omit rows altogether:
Iterating over columns. Similarly, we can iterate by column using the cols method:
Columns work the same as rows: they are themselves iterable and addressable by index.
Accessing cells by address. If we need a piece of data that is in one specific cell, we don’t need to iterate through the whole sheet until we encounter it; we can use Excel-style coordinates to access the cell:
We can also obtain a generator for a row, column, or a range of cells; we’ll show that in a later section.
Processing Cells
In any case, to process the data in a spreadsheet we have to deal with individual cells. In Openpyxl, a cell has a value and a bunch of other information that is mostly interesting only for writing, such as style information.
Conveniently, we work with cell values as Python objects (numbers, dates, strings, and so on) as Openpyxl will translate them to Excel types and back appropriately. So, cell contents are not restricted to be strings. Here, for example, we read the contents of a cell as a number:
However, we have no guarantee that the user actually put a number in that cell; if it contains the string “bug”, in the lucky case, we’ll get a runtime error when we run the code above:
However, in the not-so-lucky case, i.e. when taxable_amount is an integer – as it should be, since we’re dealing with money in the example – we’ll get a long string of “bug” repeated taxable_amount times. That’s because Python overloads the * operator for strings and integers to mean “repeat the string n times”. This will potentially result in further type errors down the line, or in a memory error when Python cannot allocate such a big string.
Therefore, we should always validate the input to our program, including Excel files. In this particular case, we can check the type of the value of a cell with Python’s isinstance function:
Or we can ask the cell for which type of data it contains:
Advanced Addressing of Cells
So far, we’ve explored the simplest, most straightforward ways of accessing cells. However, that doesn’t cover all the use cases that we may encounter; let’s have a look at more complex access schemes.
Sheets other than the active one. We can obtain sheets by access them by name from the workbook:
Then we can access cells in the sheet as we’ve seen earlier.
Ranges of cells. We’re not limited to addressing cells one by one – we can also obtain cell ranges:
- sheet[‘D’] is a whole row (D in this case)
- sheet[7] is a whole column (7 in this case)
- sheet[‘B:F’] represents a range of rows
- sheet[‘4:10’] represents a range of columns
- sheet[‘C3:H5’] is the most versatile option, representing an arbitrary range of cells.
In any of the above cases, the result is an iterable of all the cells, in row order (except when the range represents one or more columns, in which case, cells are arranged in column order):
![]() for cell in sheet[‘B2:F10’]
for cell in sheet[‘B2:F10’] ![]() for cell in sheet[‘4:10’]
for cell in sheet[‘4:10’]
Cell Iterators
If the above addressing schemes don’t suit our problem, we can resort to the lower-level methods iter_rows and iter_columns, that return generators – respectively by row and by column – over a range of cells.
In particular, both methods take 5 named parameters:
- min_row – the number of the starting row (1 is A, 2 is B, etc.)
- min_col – the starting column
- max_row – the number of the last row
- max_col – the last column
- values_only – if true, the generator will yield only the value of each cell, rather than the entire cell object. So, we won’t have to spell cell.value , just value . On the other hand, we won’t have access to the other properties of the cell, such as its data_type.
So, for example, if we want to iterate over the range B2:F10 by column we’ll write:
Writing an Excel File
To write an Excel file, we just call the save method on our workbook:
There’s not much to say about that. It’s more interesting to know how to modify a workbook before saving it. This can be a workbook that has been loaded from a file or a brand new workbook created in Python with the new operator.
Modifying Individual Cells
We can alter the value of a cell simply by assigning to it:
Note that this will automatically update the cell’s data type to reflect the new value. Besides the obvious primitive types (integer, float, string), the available types include various classes in the datetime module, as well as NumPy numeric types if NumPy is installed.
Not just values and types, we can set other properties of cells, notably style information (font, color, …), which is useful if we’re set on producing a good-looking report. The documentation of Openpyxl contains a thorough explanation of working with styles so we’ll just refer to that.
Adding and Removing Sheets
So far we’ve seen that we can address some objects – particularly workbooks and worksheets – as if they were dictionaries, to access their components: worksheets, rows, columns, individual cells, cell ranges. We’ll now see how we can add new information to the dictionaries and how to replace existing information. We’ll start with sheets.
To create a worksheet, we use the create_sheet method on a workbook:
This will add a new sheet to the workbook, after the other sheets, and will return it. We can also give it a title:
If we want to place the sheet at another position in the list, we can specify its index (which is zero-based, zero being the first):
To delete a sheet, instead, we have two options. We can delete it by name in accordance with the dictionary abstraction:
We can check if a sheet with a given name is present in the workbook using the in operator:
Alternatively, we can call the remove method with the sheet as the argument:
Adding and Removing Rows, Columns, and Cells
Similarly, we have methods for adding or removing rows, columns, or individual cells in a worksheet. Let’s see some examples.
First and foremost, by simply accessing a cell, we cause the creation of all rows and columns needed to make room for it:
Additionally, we can use the insert_rows and insert_cols methods to add rows or columns in the middle of the sheet. Existing cells are automatically moved after the newly inserted rows/columns:
We have the corresponding delete_rows and delete_cols to remove rows/columns instead:
Working With Formulas
Spreadsheets are powerful because they support formulas to compute cell values. Calculated cells automatically update their value when other cells change. Let’s see how we can work with formulas in Openpyxl.
First of all, we can ignore formulas altogether if we just want to read an Excel file. In that case, opening it in “data only” mode will hide formulas, presenting all cells with a concrete value – as computed the last time Excel opened the file:
Only when modifying an Excel file we may want to recalculate formulas. While openpyxl has some support for parsing formulas, that we could use to analyze them (e.g., to check if they’re only calling known functions), it doesn’t know how to evaluate formulas by itself. So, we have to resort to a third-party library if we want to compute formulas.
Enter the library called, well, “formulas”. Let’s add it to our requirements.txt file and install it:
With the formulas library, we have two options:
- calculating the values of all the formulas in a workbook, recursively following dependencies, the way Excel does it;
- compiling individual formulas to Python functions that we can then invoke with different arguments.
Calculating the Values of All Formulas
The first use case is not the most interesting in the context of this tutorial because it overlaps with the data_only approach we’ve seen earlier. In fact, in that mode, we cannot load a workbook, modify it, and then recompute the formulas in it. We’d have to:
- save the modified workbook to a file;
- have formulas load the file again;
- calculate formula values with an API call;
- save the file with the calculated values;
- open the file with openpyxl in data_only mode and finally see the computed values.
Not really efficient use of developer and computer time!
That said, this feature of the formulas library does have its value, because it supports some advanced use cases:
- Calculating formulas across multiple workbooks. In Excel, it’s possible to have a formula refer to another file. formulas can load multiple workbooks as part of the same set so as to resolve these cross-file references, which is a pretty rarely used feature of Excel that, e.g., Apple’s Numbers doesn’t support.
- Compiling an entire Excel workbook into a Python function. We can define certain cells as input cells, others as output cells, and obtain a function that, given the inputs, computes the formulas in the workbook and returns the values it finds in the output cells after the calculation.
However, to keep it simple, we’ll leave those out of this tutorial.
Compiling Individual Formulas as Python Functions
Let’s concentrate on individual formulas, that we can better integrate with our work based on openpyxl. As per formulas’ documentation, the incantation for compiling an Excel formula into a Python function is the following:
Note the [1] there – for some reason, the ast method returns a tuple of two objects of which the second, the builder, is the most useful. Even though this is documented, apparently it’s a piece of internal API that would need to be wrapped in a more user-friendly interface.
Anyway, when we evaluate the code above, the resulting func will be a function with as many arguments as the inputs of the formula:
Handling Dependencies of Formulas
So, we can compile the formula of a single cell into a function. However, what happens when the formula depends on other cells that contain formulas themselves? The formulas library doesn’t help us in that regard; we have to compute all the inputs recursively if they are themselves formulas. Let’s see how we might do that.
First of all, how do we distinguish between a cell with a formula and a cell with a regular value? Openpyxl doesn’t offer a method to do that, so we have to check if the value of the cell starts with an equal character:
Therefore, we know how to compute the values of cells that don’t contain formulas:
Now, the interesting thing is how to compute the value when the cell does contain a formula:
We compile the formula into a Python function and then we invoke it on its inputs. Since the inputs are references to cells, we recursively invoke compute_cell_value in order to get their values:
We leverage the fact that every cell keeps a reference to its parent, i.e., the sheet that contains it. We also make use of introspection information retained by formulas, that allows us to inspect the inputs of a function – a dictionary of cell references.
Note that this doesn’t support references across sheets or, for that matter, files.
Computing Formulas Over Cell Ranges
So far, our compute_cell_value function successfully computes the values of cells without formulas and with formulas that may depend on other cells. However, what about formulas that depend, not on individual cells, but on cell ranges?
Well, in that case, the input of a function is a range expression, such as A1:Z1 in =SUM(A1:Z1) . When we call compute_cell_value recursively, we pass it the following:
When the key is the address of a single cell, we obtain a cell object; but when it refers to a range of cells, we obtain a tuple with one entry per cell. Our compute_cell_value doesn’t know how to deal with such input, so we have to modify it to handle that case:
Then, the complete version of the function becomes:
Adding New Formula Functions
formulas supports many built-in Excel functions, but not all of them. And of course it doesn’t know about user-defined functions in VBA. However, we can register new Python functions with it so that they can be called in formulas:
Simple as that. The inputs to the function are its actual arguments as native Python values, so strings, numbers, dates, etc. – not instances of the Cell class.
Also, compared to a regular Python function, we have to guard against XlError, which represents errors in calculations such as #DIV/0! or #REF! (we typically see those in Excel when we’ve made some mistake in writing a formula):
Conclusions
We can work productively with Excel in Python with the aid of two mature open-source libraries, openpyxl and formulas. Consuming and producing complex Excel files is a valuable capability in applications whose users routinely work with Excel.
In this tutorial, we’ve learned how to read and write Excel files that may contain formulas. We didn’t talk about styling, charts, merging cells, and other possibilities you may want to read about.
All the sample code shown in this tutorial is available in our GitHub repository.
Read more:
To discover more about how to write a python parser, you can read Parsing In Python: Tools And Libraries
The Best Programming Languages

Get the guide to the best programming languages to use in each situation delivered to your email and read it when you want on the device you want
Success! Now check your email to confirm your subscription.
Источник
Last Updated on July 14, 2022 by
In this tutorial, I will show you how to automate Excel with Python xlwings library. Excel is an awesome software with a simple and intuitive user interface, and Python is a powerful programming language that is very efficient at data analysis. xlwings is the glue that allows us to have the best of both worlds.
The author of xlwings says the library “Make Excel Fly!”, and I couldn’t agree more. You can use xlwings + Python for the following tasks:
- Automate Excel with Python, such as producing reports
- Write macros in Python, and run from Excel by clicking on a button
- Write user-defined functions in Python, and call those function from Excel just like any Excel function
Sounds exciting? Let’s get started!
Part 1. Installing xlwings
There are two parts to install xlwings: Python library and Excel add-in. Let’s start with getting the Python library first:
pip install xlwingsThen download the Excel add-in from xlwings’ official Github repository. It’s the xlwings.xlam file on the page, and feel free to grab the latest version. The link here is to v0.18.0.
Put the xlwings.xlam file into your Excel add-in folder, which is:
C:UsersxxxxAppDataRoamingMicrosoftAddIns
The xxxx is your own user name on your computer.
Then, open Excel, File -> Options -> Add-ins. Click on the “Go” button besides Manage: Excel Add-ins.

When the Add-ins window pops up, click on “Browse”.

This will take you directly to the Addins folder, simply select the xlwings.xlam file from the folder, and hit “OK”. xlwings addin is now added to your Excel, this add-in will be automatically enabled whenever you launch the Excel app.

Now, the xlwings tab should appear on your Excel ribbon.

The set up is done at this point, and now let’s have fun with automating Excel with Python!
Part 2. Automating Excel
Run the following Python script, which will open a new Excel instance.
import xlwings as xw
wb = xw.Book()
Write data to Excel
Here, wb refers to the new (and open) Excel file, and it’s also a Python object at the same time, which means we can manipulate it (the Excel file) in Python! Try the following code, which will allow you to input values from Python into Excel.
sheet = wb.sheets['Sheet1']
sheet.range('A1').value = "Hello Excel from Python"
We can also use the .range((x,y)) notation to refer to individual cells in Excel. x refers to row, and y refers to column. So .range((3, 2)) means cell B3.
sheet.range((3,2)).value = 'x-axis'
sheet.range((3,3)).value = 'y-axis'
for i in range(5):
    sheet.range((i+4, 2)).value = i
It’s also possible to write formulas in Excel using Python. Basically we are writing a string into the cell. Here, we want to calculate the exponential values of the x-axis in another column. In the below code, we are using an “f-string”, which is an improved string formatting syntax starting from Python 3.6.
for i in range(5):
    sheet.range((i+4,3)).value = f'=exp(B{i+4})'
Reading data from Excel
Reading data from Excel is as easy, the following code reads Excel data into Python as a list.
data = sheet.range('B3:C8').value
Check out the following short code if you want to read Excel data into Python as a pandas Dataframe. .expand() automatically detects the dimension of the data, and .options() specifies that we want a pandas Dataframe. We reset the index at the end so the x-axis will be treated as a column instead of a dataframe index.
import pandas as pd
df = xw.Range('B3').expand().options(pd.DataFrame).value
df.reset_index(inplace=True)
Now we have a table, what are we missing?… Yes, a graph! Since the data is already read into Python, we can generate a graph then put it into Excel file. For plotting the graph, we’ll use the matplotlib library.
import matplotlib.pyplot as plt
fig = plt.figure()
plt.plot(df['x-axis'],df['y-axis'])
plt.xlabel('x-axis')
plt.ylabel('y-axis')
sheet.pictures.add(fig, name='MyPlot', update=True)   #add the graph back into Excel
Finally, as we do for every Excel spreadsheet, we gotta save our work and close the file! wb refers to the workbook here.
wb.save('automate_excel_with_python.xlsx')
wb.close()
Part 3. Write a macro in Python and run in Excel
Let me just clarify, the “macro” isn’t referring to the VBA Excel macros. These are Python programs, which can be executed from Excel. However, it requires a tiny bit of VBA to allow Excel to call a Python function.
Python Script
Let’s first write a simple Python function to generate 10 random numbers, and then place them in an Excel sheet cell A1. Note the xw.Book.caller() refers to the current workbook. Save the following script as “rand_10.py”.
import numpy as np
import xlwings as xw

def generate():
    wb = xw.Book.caller()
    wb.sheets[0].range('A1').value = np.random.rand(10)
Excel VBA & linking to the Python script
Once we have the Python script, open up the VBA Editor, you can do this by pressing Alt + F11 inside the Excel app.
In the VBA editor, go to Tools -> Reference, and check the “xlwings” checkbox. OK and save.

Next, in the VBAProject window, right click on your Excel file, and insert a module. In the new module window appears on the right-hand side, you can type the following VBA code.

Sub Rand_10()
    RunPython ("import rand_10; rand_10.generate()")
End Sub
Some notes here: rand_10 is the Python script file name. i.e. we just saved the script as “rand_10.py”. The VBA code RunPython("import rand_10; rand_10.generate()") basically says: import the Python script called “rand_10”, then run the function generate() using Python.
Next, save the VBA code, and now we want to create a button in Excel sheet. Going back into Excel, under the “Developer” tab. Insert -> Button. If you don’t have the Developer tab. Right click on your Excel ribbon, and “Customize the Ribbon”. Check the Developer checkbox, and then OK to save the change.

Once you have a button, right click on it, then Assign Macro to assign the button to the VBA macro named Rand_10(). Click on the button, and 10 random numbers will be populated from cells A1 to J1.

Part 3. Write a user-defined function in Python and call it within Excel
Advanced Excel users know that we can create user-defined functions in VBA. This feature is great, as not all built-in Excel functions fit our needs. However, VBA is 1) hard to use/learn, and 2) has very limited functionality. With xlwings, we can create our own user-defined functions in Python. All we need is a Python script, and a little bit setup in Excel to achieve this.
Python script
Let’s write a simple Python function that calculates the square of a number.
import xlwings as xw

@xw.func
def square(x):
    return x ** 2
Two things to note here:
@xw.funcis a decorator. It must be added right before thedefto let xlwings know this is a user-defined function.- The function must return something so the returned value can be passed into Excel.
Excel setup
The default settings expect that the Python code and the Excel file to be:
- in the same directory
- with the same name, but Python file ends with
.pyand the Excel file ends with.xlsm(or.xlsb)
To illustrate, I’m going to name my files as “square.py” and “square.xlsb”. Open up square.xlsb in Excel, go to the xlwings tab, then click on Import Functions.
In some cases, you might get an “Automation error 440” pop up. 
We can fix this by taking the below steps:
- In Excel, click on File -> Options -> Trust Center -> Trust Center Settings… -> Macro Settings. Check “Trust access to the VBA project object model” box, and enable macros. OK to save changes.

- Go to VBA editor (press
Alt + F11). Tools -> References, then check “xlwings” box. OK to save change.


Once you complete the above 2 steps, go back to Excel the xlwings tab, click on the Import Functions again. After a brief pause, if no error message pops up, it means the Python function was imported successfully, and we can start using the Python function sqaure() inside Excel sheets. Let’s now test it!
You can type =square(A1) inside any cell, and notice that as you type out the function, square actually shows up in the function list! That’s a neat feature. Yep, you saw that – we can use this Python function just like an Excel function, and we can pass cell references into the function. Make no mistake here – it appears we are using an Excel function, but under the hood, Python is doing all the calculation, then only the result is displayed to the user via Excel. This means that, we can create really complex functions thanks to Python’s power. For example, a dynamic function that extract financial data from a website and display data in Excel.

Debugging
Two common errors you might experience as a beginner are:
- Automation error 404. We talked about how to fix this error, make sure the Excel Macro setting is correct.
- When you type the user defined function, “Object Require” shows up in the cell. Make sure xlwings is checked in VBA Editor -> Tools -> References, and the change is saved for the appropriate Excel file. Sometimes, when we have multiple Excel sheets open, we might end up applying this change to another file unintentionally.
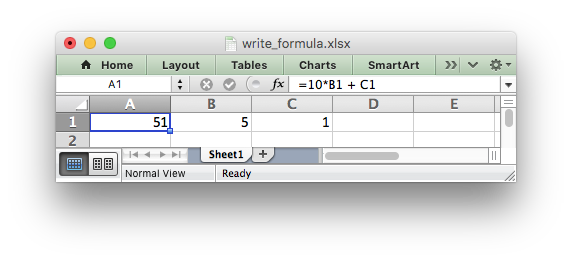
In general a formula in Excel can be used directly in the
write_formula() method:
worksheet.write_formula('A1', '=10*B1 + C1')
However, there are a few potential issues and differences that the user should
be aware of. These are explained in the following sections.
Non US Excel functions and syntax
Excel stores formulas in the format of the US English version, regardless
of the language or locale of the end-user’s version of Excel. Therefore all
formula function names written using XlsxWriter must be in English:
worksheet.write_formula('A1', '=SUM(1, 2, 3)')    # OK
worksheet.write_formula('A2', '=SOMME(1, 2, 3)')  # French. Error on load.
Also, formulas must be written with the US style separator/range operator
which is a comma (not semi-colon). Therefore a formula with multiple values
should be written as follows:
worksheet.write_formula('A1', '=SUM(1, 2, 3)')   # OK
worksheet.write_formula('A2', '=SUM(1; 2; 3)')   # Semi-colon. Error on load.
If you have a non-English version of Excel you can use the following
multi-lingual formula translator
to help you convert the formula. It can also replace semi-colons with commas.
Formula Results
XlsxWriter doesn’t calculate the result of a formula and instead stores the
value 0 as the formula result. It then sets a global flag in the XLSX file to
say that all formulas and functions should be recalculated when the file is
opened.
This is the method recommended in the Excel documentation and in general it
works fine with spreadsheet applications. However, applications that don’t
have a facility to calculate formulas will only display the 0
results. Examples of such applications are Excel Viewer, PDF Converters, and
some mobile device applications.
If required, it is also possible to specify the calculated result of the
formula using the optional value parameter for write_formula():
worksheet.write_formula('A1', '=2+2', num_format, 4)
The value parameter can be a number, a string, a bool or one of the
following Excel error codes:
#DIV/0!
#N/A
#NAME?
#NULL!
#NUM!
#REF!
#VALUE!
It is also possible to specify the calculated result of an array formula
created with write_array_formula():
# Specify the result for a single cell range.
worksheet.write_array_formula('A1:A1', '{=SUM(B1:C1*B2:C2)}', cell_format, 2005)
However, using this parameter only writes a single value to the upper left
cell in the result array. For a multi-cell array formula where the results are
required, the other result values can be specified by using write_number()
to write to the appropriate cell:
# Specify the results for a multi cell range.
worksheet.write_array_formula('A1:A3', '{=TREND(C1:C3,B1:B3)}', cell_format, 15)
worksheet.write_number('A2', 12, cell_format)
worksheet.write_number('A3', 14, cell_format)
Dynamic Array support
Excel introduced the concept of “Dynamic Arrays” and new functions that use
them in Office 365. The new functions are:
FILTER()UNIQUE()SORT()SORTBY()XLOOKUP()XMATCH()RANDARRAY()SEQUENCE()
The following special case functions were also added with Dynamic Arrays:
SINGLE()— Explained below in Dynamic Arrays — The Implicit Intersection Operator “@”.ANCHORARRAY()— Explained below in Dynamic Arrays — The Spilled Range Operator “#”.LAMBDA()andLET()— Explained below in The Excel 365 LAMBDA() function.
Dynamic arrays are ranges of return values that can change in size based on
the results. For example, a function such as FILTER() returns an array of
values that can vary in size depending on the filter results. This is
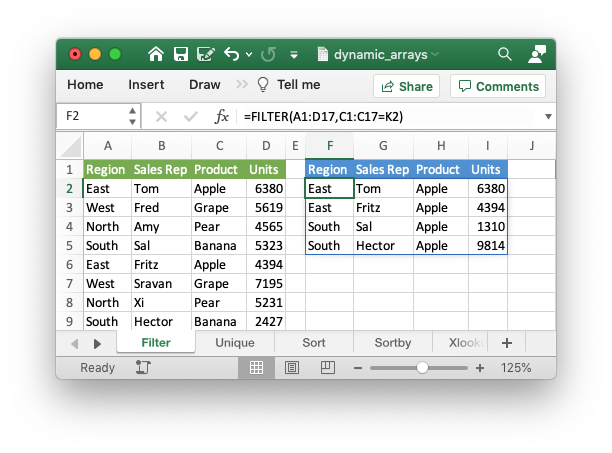
shown in the snippet below from Example: Dynamic array formulas:
worksheet1.write('F2', '=FILTER(A1:D17,C1:C17=K2)')
Which gives the results shown in the image below. The dynamic range here is
“F2:I5” but it could be different based on the filter criteria.
It is also possible to get dynamic array behavior with older Excel
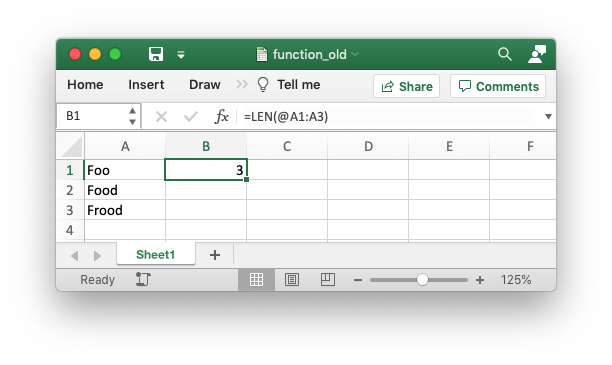
functions. For example, the Excel function =LEN(A1) applies to a single
cell and returns a single value but it is also possible to apply it to a range
of cells and return a range of values using an array formula like
{=LEN(A1:A3)}. This type of “static” array behavior is called a CSE
(Ctrl+Shift+Enter) formula. With the introduction of dynamic arrays in Excel
365 you can now write this function as =LEN(A1:A3) and get a dynamic range
of return values. In XlsxWriter you can use the write_array_formula()
worksheet method to get a static/CSE range and
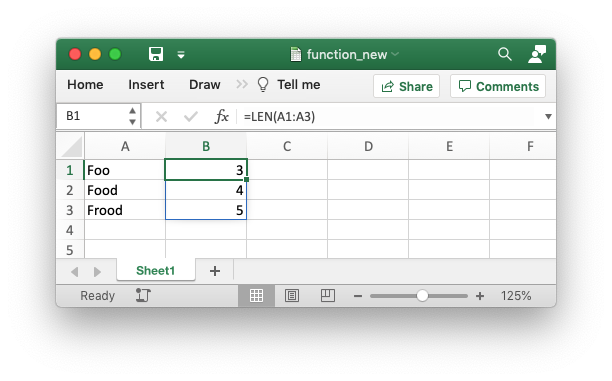
write_dynamic_array_formula() to get a dynamic range. For example:
worksheet.write_dynamic_array_formula('B1:B3', '=LEN(A1:A3)')
Which gives the following result:
The difference between the two types of array functions is explained in the
Microsoft documentation on Dynamic array formulas vs. legacy CSE array
formulas. Note
the use of the word “legacy” here. This, and the documentation itself, is a
clear indication of the future importance of dynamic arrays in Excel.
For a wider and more general introduction to dynamic arrays see the following:
Dynamic array formulas in Excel.
Dynamic Arrays — The Implicit Intersection Operator “@”
The Implicit Intersection Operator, “@”, is used by Excel 365 to indicate a
position in a formula that is implicitly returning a single value when a range
or an array could be returned.
We can see how this operator works in practice by considering the formula we
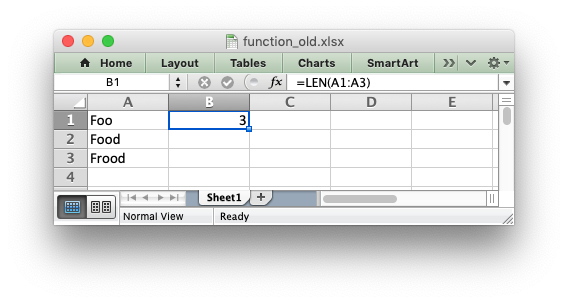
used in the last section: =LEN(A1:A3). In Excel versions without support
for dynamic arrays, i.e. prior to Excel 365, this formula would operate on a
single value from the input range and return a single value, like this:
There is an implicit conversion here of the range of input values, “A1:A3”, to
a single value “A1”. Since this was the default behavior of older versions of
Excel this conversion isn’t highlighted in any way. But if you open the same
file in Excel 365 it will appear as follows:
The result of the formula is the same (this is important to note) and it still
operates on, and returns, a single value. However the formula now contains a
“@” operator to show that it is implicitly using a single value from the given
range.
Finally, if you entered this formula in Excel 365, or with
write_dynamic_array_formula() in XlsxWriter, it would operate on the
entire range and return an array of values:
If you are encountering the Implicit Intersection Operator “@” for the first
time then it is probably from a point of view of “why is Excel/XlsxWriter
putting @s in my formulas”. In practical terms if you encounter this operator,
and you don’t intend it to be there, then you should probably write the
formula as a CSE or dynamic array function using write_array_formula()
or write_dynamic_array_formula() (see the previous section on
Dynamic Array support).
A full explanation of this operator is shown in the Microsoft documentation on
the Implicit intersection operator: @.
One important thing to note is that the “@” operator isn’t stored with the
formula. It is just displayed by Excel 365 when reading “legacy”
formulas. However, it is possible to write it to a formula, if necessary,
using SINGLE() or _xlfn.SINGLE(). The unusual cases where this may be
necessary are shown in the linked document in the previous paragraph.
Dynamic Arrays — The Spilled Range Operator “#”
In the section above on Dynamic Array support we saw that dynamic
array formulas can return variable sized ranges of results. The Excel
documentation refers to this as a “Spilled” range/array from the idea that the
results spill into the required number of cells. This is explained in the
Microsoft documentation on Dynamic array formulas and spilled array behavior.
Since a spilled range is variable in size a new operator is required to refer
to the range. This operator is the Spilled range operator
and it is represented by “#”. For example, the range F2# in the image
below is used to refer to a dynamic array returned by UNIQUE() in the cell
F2. This example is taken from the XlsxWriter program Example: Dynamic array formulas.
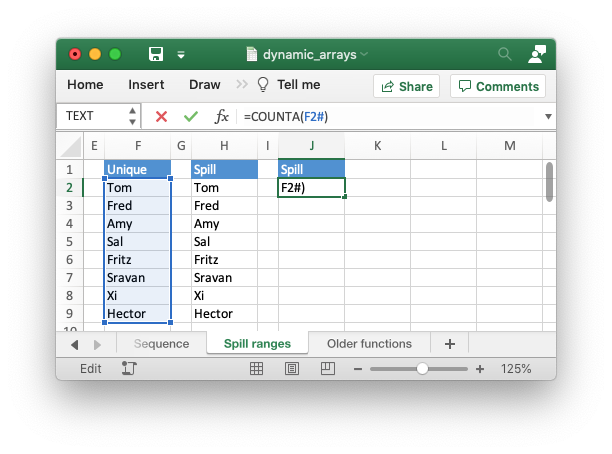
Unfortunately, Excel doesn’t store the formula like this and in XlsxWriter you
need to use the explicit function ANCHORARRAY() to refer to a spilled
range. The example in the image above was generated using the following:
worksheet9.write('J2', '=COUNTA(ANCHORARRAY(F2))') # Same as '=COUNTA(F2#)' in Excel.
The Excel 365 LAMBDA() function
Recent versions of Excel 365 have introduced a powerful new
function/feature called LAMBDA(). This is similar to the lambda
function in Python (and other languages).
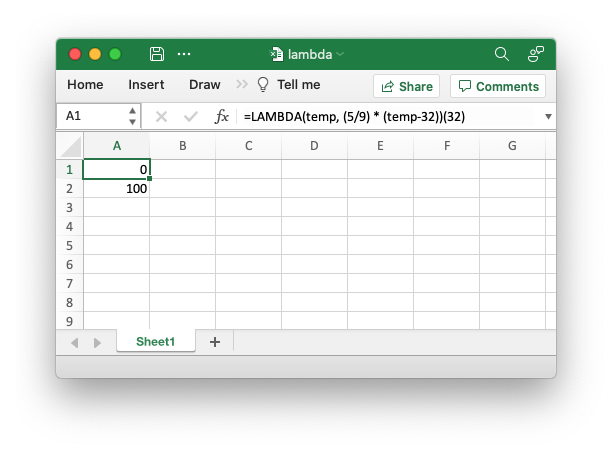
Consider the following Excel example which converts the variable temp from Fahrenheit to Celsius:
LAMBDA(temp, (5/9) * (temp-32))
This could be called in Excel with an argument:
=LAMBDA(temp, (5/9) * (temp-32))(212)
Or assigned to a defined name and called as a user defined function:
This is similar to this example in Python:
>>> to_celsius = lambda temp: (5.0/9.0) * (temp-32)
>>> to_celsius(212)
100.0
A XlsxWriter program that replicates the Excel is shown in Example: Excel 365 LAMBDA() function.
The formula is written as follows:
worksheet.write('A2', '=LAMBDA(_xlpm.temp, (5/9) * (_xlpm.temp-32))(32)')
Note, that the parameters in the LAMBDA() function must have a “_xlpm.”
prefix for compatibility with how the formulas are stored in Excel. These
prefixes won’t show up in the formula, as shown in the image.
The LET() function is often used in conjunction with LAMBDA() to assign
names to calculation results.
Formulas added in Excel 2010 and later
Excel 2010 and later added functions which weren’t defined in the original
file specification. These functions are referred to by Microsoft as future
functions. Examples of these functions are ACOT, CHISQ.DIST.RT ,
CONFIDENCE.NORM, STDEV.P, STDEV.S and WORKDAY.INTL.
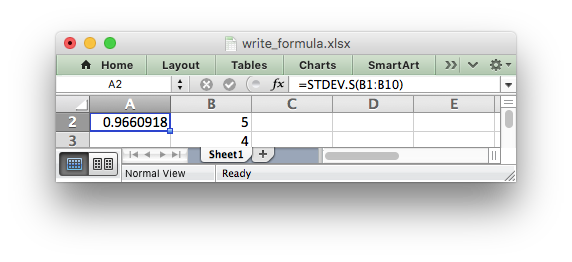
When written using write_formula() these functions need to be fully
qualified with a _xlfn. (or other) prefix as they are shown the list
below. For example:
worksheet.write_formula('A1', '=_xlfn.STDEV.S(B1:B10)')
These functions will appear without the prefix in Excel:
Alternatively, you can enable the use_future_functions option in the
Workbook() constructor, which will add the prefix as required:
workbook = Workbook('write_formula.xlsx', {'use_future_functions': True})

# ...

worksheet.write_formula('A1', '=STDEV.S(B1:B10)')
If the formula already contains a _xlfn. prefix, on any function, then the
formula will be ignored and won’t be expanded any further.
Note
Enabling the use_future_functions option adds an overhead to all formula
processing in XlsxWriter. If your application has a lot of formulas or is
performance sensitive then it is best to use the explicit _xlfn. prefix
instead.
The following list is taken from
MS XLSX extensions documentation on future functions.
_xlfn.ACOT_xlfn.ACOTH_xlfn.AGGREGATE_xlfn.ARABIC_xlfn.BASE_xlfn.BETA.DIST_xlfn.BETA.INV_xlfn.BINOM.DIST_xlfn.BINOM.DIST.RANGE_xlfn.BINOM.INV_xlfn.BITAND_xlfn.BITLSHIFT_xlfn.BITOR_xlfn.BITRSHIFT_xlfn.BITXOR_xlfn.CEILING.MATH_xlfn.CEILING.PRECISE_xlfn.CHISQ.DIST_xlfn.CHISQ.DIST.RT_xlfn.CHISQ.INV_xlfn.CHISQ.INV.RT_xlfn.CHISQ.TEST_xlfn.COMBINA_xlfn.CONCAT_xlfn.CONFIDENCE.NORM_xlfn.CONFIDENCE.T_xlfn.COT_xlfn.COTH_xlfn.COVARIANCE.P_xlfn.COVARIANCE.S_xlfn.CSC_xlfn.CSCH_xlfn.DAYS_xlfn.DECIMALECMA.CEILING_xlfn.ERF.PRECISE_xlfn.ERFC.PRECISE_xlfn.EXPON.DIST_xlfn.F.DIST_xlfn.F.DIST.RT_xlfn.F.INV_xlfn.F.INV.RT_xlfn.F.TEST_xlfn.FILTERXML_xlfn.FLOOR.MATH_xlfn.FLOOR.PRECISE_xlfn.FORECAST.ETS_xlfn.FORECAST.ETS.CONFINT_xlfn.FORECAST.ETS.SEASONALITY_xlfn.FORECAST.ETS.STAT_xlfn.FORECAST.LINEAR_xlfn.FORMULATEXT_xlfn.GAMMA_xlfn.GAMMA.DIST_xlfn.GAMMA.INV_xlfn.GAMMALN.PRECISE_xlfn.GAUSS_xlfn.HYPGEOM.DIST_xlfn.IFNA_xlfn.IFS_xlfn.IMCOSH_xlfn.IMCOT_xlfn.IMCSC_xlfn.IMCSCH_xlfn.IMSEC_xlfn.IMSECH_xlfn.IMSINH_xlfn.IMTAN_xlfn.ISFORMULAISO.CEILING_xlfn.ISOWEEKNUM_xlfn.LOGNORM.DIST_xlfn.LOGNORM.INV_xlfn.MAXIFS_xlfn.MINIFS_xlfn.MODE.MULT_xlfn.MODE.SNGL_xlfn.MUNIT_xlfn.NEGBINOM.DISTNETWORKDAYS.INTL_xlfn.NORM.DIST_xlfn.NORM.INV_xlfn.NORM.S.DIST_xlfn.NORM.S.INV_xlfn.NUMBERVALUE_xlfn.PDURATION_xlfn.PERCENTILE.EXC_xlfn.PERCENTILE.INC_xlfn.PERCENTRANK.EXC_xlfn.PERCENTRANK.INC_xlfn.PERMUTATIONA_xlfn.PHI_xlfn.POISSON.DIST_xlfn.QUARTILE.EXC_xlfn.QUARTILE.INC_xlfn.QUERYSTRING_xlfn.RANK.AVG_xlfn.RANK.EQ_xlfn.RRI_xlfn.SEC_xlfn.SECH_xlfn.SHEET_xlfn.SHEETS_xlfn.SKEW.P_xlfn.STDEV.P_xlfn.STDEV.S_xlfn.SWITCH_xlfn.T.DIST_xlfn.T.DIST.2T_xlfn.T.DIST.RT_xlfn.T.INV_xlfn.T.INV.2T_xlfn.T.TEST_xlfn.TEXTJOIN_xlfn.UNICHAR_xlfn.UNICODE_xlfn.VAR.P_xlfn.VAR.S_xlfn.WEBSERVICE_xlfn.WEIBULL.DISTWORKDAY.INTL_xlfn.XOR_xlfn.Z.TEST
The dynamic array functions shown in the Dynamic Array support section
above are also future functions:
_xlfn.UNIQUE_xlfn.XMATCH_xlfn.XLOOKUP_xlfn.SORTBY_xlfn._xlws.SORT_xlfn._xlws.FILTER_xlfn.RANDARRAY_xlfn.SEQUENCE_xlfn.ANCHORARRAY_xlfn.SINGLE_xlfn.LAMBDA
However, since these functions are part of a powerful new feature in Excel,
and likely to be very important to end users, they are converted automatically
from their shorter version to the explicit future function version by
XlsxWriter, even without the use_future_function option. If you need to
override the automatic conversion you can use the explicit versions with the
prefixes shown above.
Using Tables in Formulas
Worksheet tables can be added with XlsxWriter using the add_table()
method:
worksheet.add_table('B3:F7', {options})
By default tables are named Table1, Table2, etc., in the order that
they are added. However it can also be set by the user using the name parameter:
worksheet.add_table('B3:F7', {'name': 'SalesData'})
When used in a formula a table name such as TableX should be referred to
as TableX[] (like a Python list):
worksheet.write_formula('A5', '=VLOOKUP("Sales", Table1[], 2, FALSE')
Dealing with formula errors
If there is an error in the syntax of a formula it is usually displayed in
Excel as #NAME?. Alternatively you may get a warning from Excel when the
file is loaded. If you encounter an error like this you can debug it as
follows:
- Ensure the formula is valid in Excel by copying and pasting it into a
cell. Note, this should be done in Excel and not other applications such as
OpenOffice or LibreOffice since they may have slightly different syntax. - Ensure the formula is using comma separators instead of semi-colons, see
Non US Excel functions and syntax above. - Ensure the formula is in English, see Non US Excel functions and syntax above.
- Ensure that the formula doesn’t contain an Excel 2010+ future function as
listed above (Formulas added in Excel 2010 and later). If it does then ensure that the
correct prefix is used. - If the function loads in Excel but appears with one or more
@symbols
added then it is probably an array function and should be written using
write_array_formula()orwrite_dynamic_array_formula()(see the
sections above on Dynamic Array support and
Dynamic Arrays — The Implicit Intersection Operator “@”).
Finally if you have completed all the previous steps and still get a
#NAME? error you can examine a valid Excel file to see what the correct
syntax should be. To do this you should create a valid formula in Excel and
save the file. You can then examine the XML in the unzipped file.
The following shows how to do that using Linux unzip and libxml’s xmllint to format the XML for clarity:
$ unzip myfile.xlsx -d myfile
$ xmllint --format myfile/xl/worksheets/sheet1.xml | grep '</f>'

        <f>SUM(1, 2, 3)</f>
Excel is very, very pervasive in today’s businesses. At Dataquest, we generally recommend working with code for quite a few reasons, and many of our data science courses are aimed at teaching efficient coding for data analysis and data science. But no matter how strongly you prefer working with Python, at the end of the day there is sometimes a need to present your findings or share your data using Excel.
But that doesn’t mean can’t still enjoy some of the efficiencies of Python! In fact, using a library called xlwings, you can use Python to make working in Excel faster.
In this xlwings tutorial, we’ll walk through how to use Python in Excel to execute and use some common operations like deleting rows based on certain criteria, using Excel functions and formulas, autofilling, creating sheets, charts, etc. In order to follow this post you should be familiar with basic Python concepts (objects, methods, attributes, functions) and Python’s syntax and have an intermediate knowledge of Excel and VBA.
We will be working with a data set that contains information regarding the draws of an European lottery called EuroMillions. This data set was downloaded from this link and it contains all the EuroMillions draws up to, and including, the 20th of September. The data available at that link should be updated with the latest information up to whenever you’re reading this post, but in case it’s unavailable, here’s a CSV file with the data from that link as of September 20.
Euromillions is a multinational lottery available in some European countries, specifically in Andorra, Austria, Belgium, France (including overseas regions and collectivities), Ireland, the Isle of Man, Liechtenstein, Luxembourg, Monaco, Portugal, Spain, Switzerland and the United Kingdom (source).
As of this writing, the draw consists of five numbers from a pool of 50 numbers (numbered 1 through 50) and two numbers called lucky stars from a pool of 12 numbers. In order to win the jackpot, participants must correctly choose all drawn numbers and lucky stars. The largest jackpot ever won was €190 million. (Note, though, that our data set denominates winnings in Pounds, not Euros).
In this tutorial, we’ll use Python and xlwings with Excel to clean up a data set and then generate some graphs to visualize which numbers win the EuroMillions most frequently.
import pandas as pd
import xlwings as xw
df = pd.read_csv('euromillions.csv')
df.sample(5)
| No. | Day | DD | MMM | YYYY | N1 | N2 | N3 | N4 | N5 | L1 | L2 | Jackpot | Wins | |
|---|---|---|---|---|---|---|---|---|---|---|---|---|---|---|
| 627 | 514 | Fri | 24 | Aug | 2012 | 6 | 5 | 19 | 37 | 12 | 7 | 3 | 37709047 | 1 |
| 230 | 911 | Tue | 14 | Jun | 2016 | 13 | 50 | 42 | 39 | 34 | 11 | 9 | 11928000 | 0 |
| 998 | 143 | Fri | 3 | Nov | 2006 | 13 | 11 | 44 | 24 | 49 | 9 | 3 | 88344099 | 0 |
| 1071 | 70 | Fri | 10 | Jun | 2005 | 37 | 32 | 47 | 7 | 6 | 7 | 1 | 21734699 | 0 |
| 522 | 619 | Tue | 27 | Aug | 2013 | 7 | 40 | 38 | 43 | 30 | 6 | 2 | 12931500 | 0 |
The first column is the draw number, columns N1-L2 are the drawn numbers and lucky stars (by the order they were drawn), the Jackpot column is the jackpot in Euros and the Wins column tell us how many bets hit the jackpot.
Meet xlwings
xlwings is a Python library that makes some of the data analysis features of Python available in an Excel instance, including support for numpy arrays and pandas Series and DataFrames. Like any other Python library, it can be installed using common methods like pip or conda, but you can access the documentation for xlwings here if you need additional details.
Note that you’ll need to have a version of Microsoft Excel installed on the computer you’re using to do this xlwings tutorial.
xlwings objects
In xlwings there are four main object types which are, in decreasing hierarchical order: App (which represents an Excel instance), Book, Sheet and Range. In addition to these we’ll also be dealing with Chart and Shape objects. You can find useful information regarding these and other objects in the official documentation, but we’ll be looking at each of these objects one at a time.
Let’s start by creating a Book instance and naming it wb (workbook).
wb = xw.Book() # wb = xw.Book(filename) would open an existing file
When you run that code, it should look something like this.
Notice that when the code cell is run in the Jupyter Notebook, Excel is launched automatically.
By instantiating a Book object, an App object that belongs to our book object is created automatically. Here’s how we can check all opened Excel instances.
Note: we’re not going to include gifs for every step of this tutorial, because we don’t want this page to be a hassle to load for people with slow or limited internet connections. However, subsequent code-running steps should look similar to what we can see above: when we run a cell in Juypter, the Excel spreadsheet is updated in accordance with whatever code we’ve run.
print(xw.apps)
Apps([<Excel App 9536>])
The object xw.apps is an iterable. To check what workbooks belong to the unique instances in this iterable we can invoke the books method on it like so.
print(xw.apps[0].books)
Books([<Book [Book1]>])
As expected the only instance of this iterable is the workbook wb. We check this fact below.
print(xw.apps[0].books[0] == wb)
True
Similarly, we can check what sheets belong to this workbook:
print(wb.sheets)
Sheets([<Sheet [Book1]Sheet1>])
We can also refer to sheets by their name:
#creates a worksheet object assigns it to ws
ws = wb.sheets["Sheet1"]
#checks that wb.sheets[0] equals ws
print(ws == wb.sheets[0])
True
Sheet objects have a name attribute that works as expected. Let us change the name of our only sheet.
ws.name = "EuroMillions"
We can move data from certain Python objects (e.g. lists and tuples) into Excel. Let’s move the data in our dataframe into the sheet EuroMillions. To do this, we’ll make use of range to create a range object that stores the data from our DataFrame in a range of cells in Excel, starting in this case with the cell A1:
#ws.range("A1") is a Range object
ws.range("A1").value = df
Here’s how that will look:
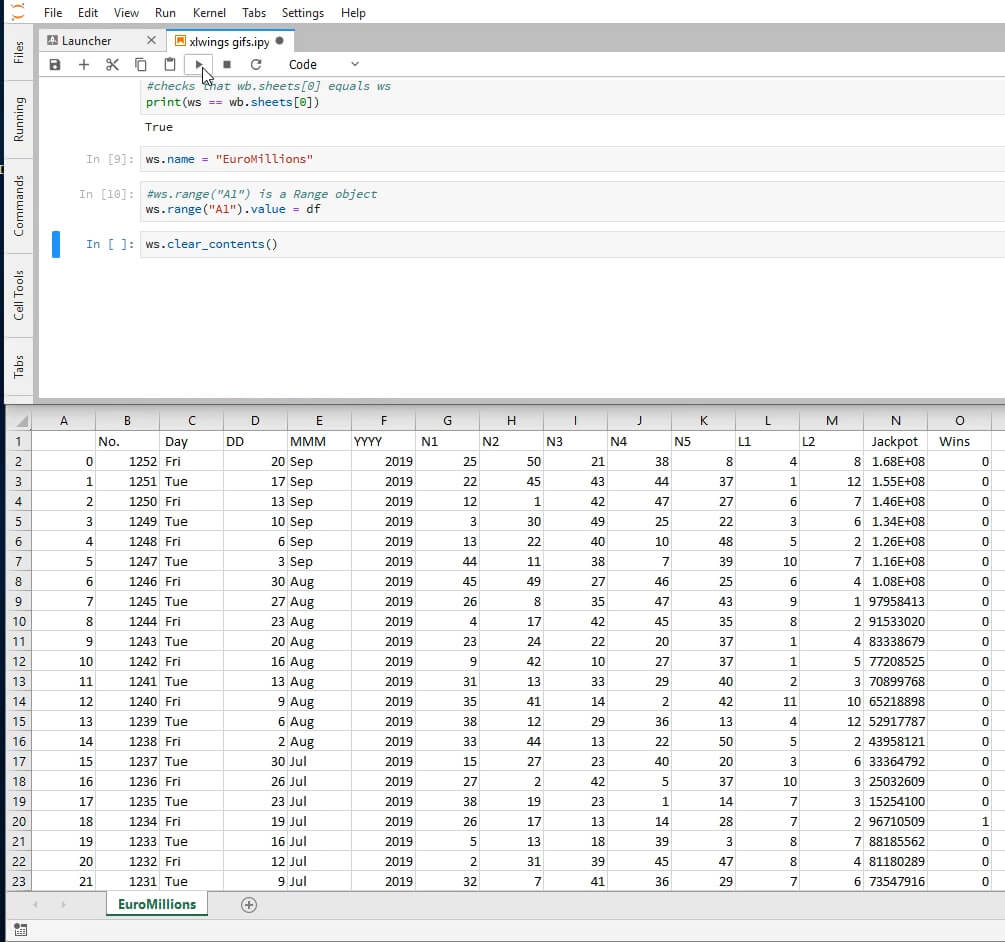
As we can see, the index column of df was also moved to Excel. Let’s clear the contents of this sheet and copy the data without the index.
ws.clear_contents()
ws.range("A1").options(index=False).value = df
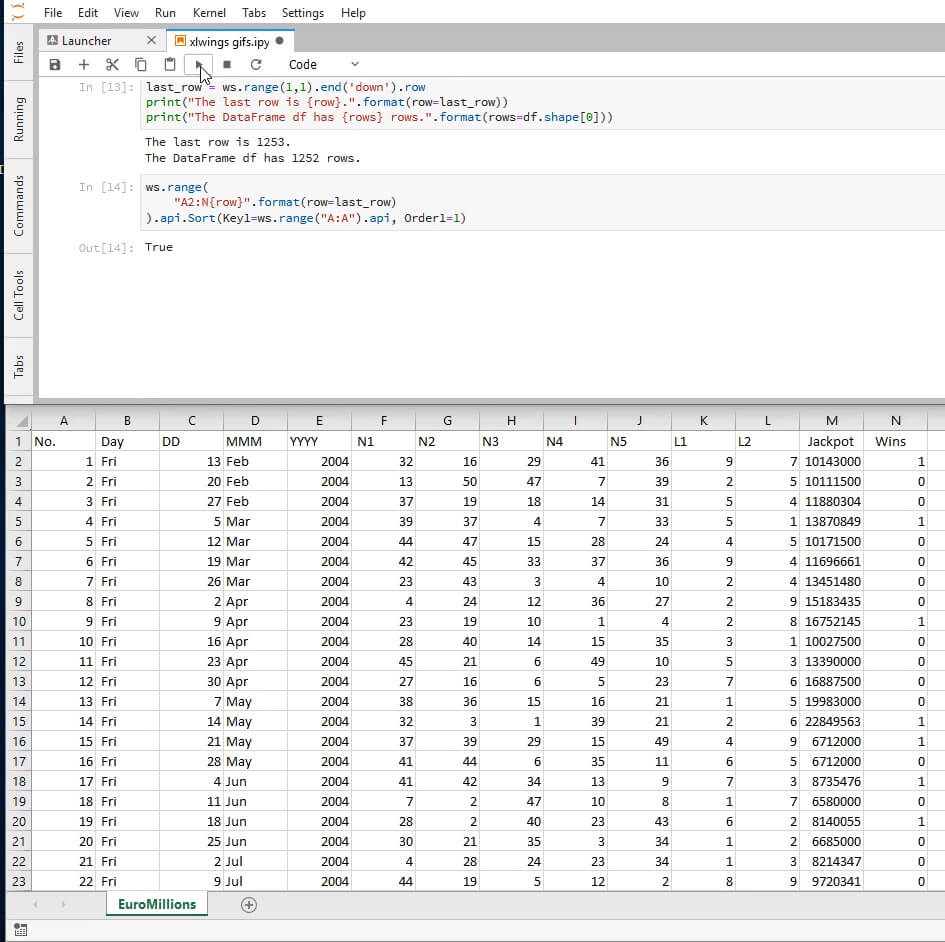
It will be useful to be able to tell where our table ends. More specifically, we’ll need the last row that has data in it. To this end, we can use the end method and the row attribute of Range objects.
The row method, not surprisingly, returns the row of the Range object.
The method end takes in as an argument a direction ("up" (or 1), "right" (or 2), "left" (or 3, "down" (or 4)) and returns another range object. It mimics the very common action in Excel CTRL+Shift+Arrow.
last_row = ws.range(1,1).end('down').row
print("The last row is {row}.".format(row=last_row))
print("The DataFrame df has {rows} rows.".format(rows=df.shape[0]))
The last row is 1142.
The DataFrame df has 1141 rows.
It checks out!
The API property
Not every Excel functionality is available as a native xlwings feature. Sometimes we’ll have to find workarounds to do what we want. Fortunately xlwings makes this very easy for us. From the Missing Features section in the official documentation:
Workaround: in essence, xlwings is just a smart wrapper around pywin32 on Windows and appscript on Mac. You can access the underlying objects by calling the api property. The underlying objects will offer you pretty much everything you can do with VBA, using the syntax of pywin32 (which pretty much feels like VBA) and appscript (which doesn’t feel like VBA). But apart from looking ugly, keep in mind that it makes your code platform specific (!). Excel Visual Basic for Applications is a rich source of explanations for the various existing Excel objects.
Sorting is one such functionality that is missing from xlwings. You may have noticed that the records are ordered from the most recent to the oldest draw. In the next few steps we’ll be reversing the order.
The object ws.range("A2:N{row}".format(row=last_row)) is a Range object. Appending the api property to it yields a VBA Range object which in turn gives access to its VBA features.
We’ll be using the Sort property of this VBA object. In its simplest application, Sort takes in two arguments: the column by which we want to order the table (as a VBA Range object), and the order type (whether we want to sort it in ascending or descending order). The second argument’s parameter’s documentation can be seen here. We’ll be sorting in ascending order.
Putting all of that together looks like this:
ws.range(
"A2:N{row}".format(row=last_row)
).api.Sort(Key1=ws.range("A:A").api, Order1=1)
True
Here’s how it’ll look on your screen after running (note that the first column has changed, and it’s now sorted in ascending rather than descending order.
Analyzing Our Data
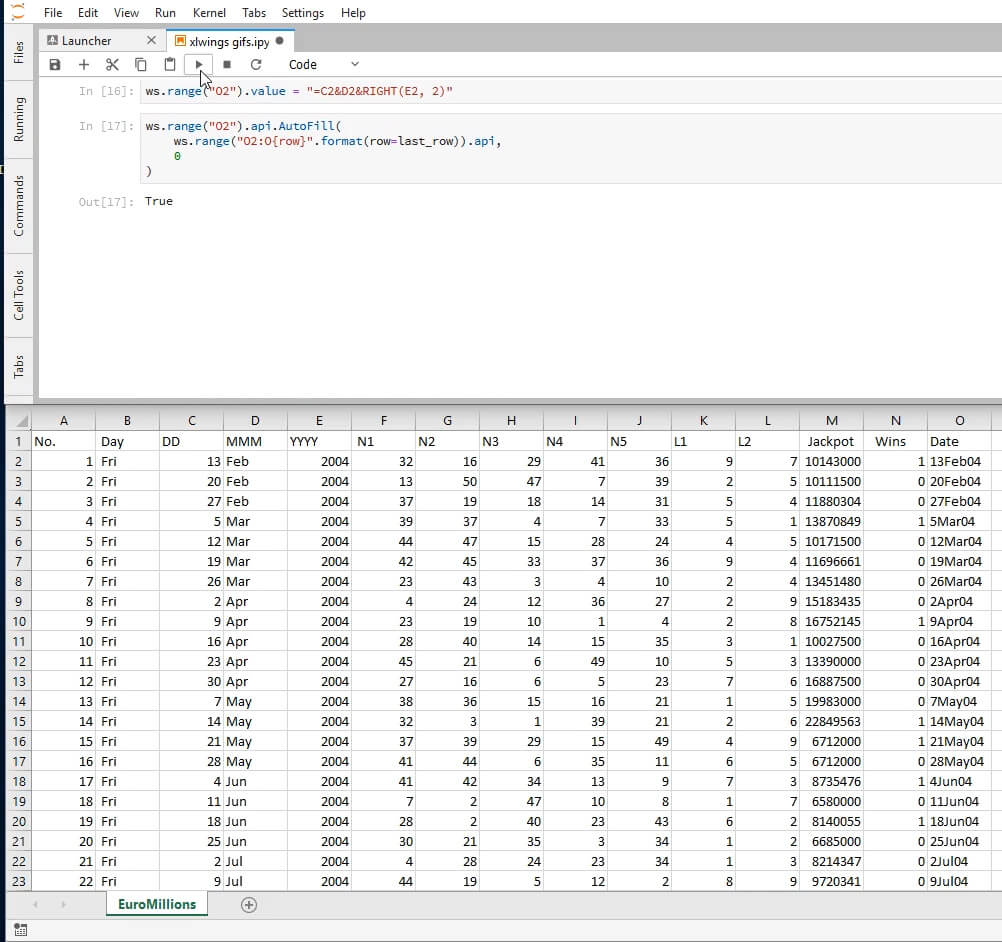
One problem we’ll encounter in trying to analyze this data set is that the dates are scattered across three different columns. We’ll need to compress it into a single column. To do this, we’ll concatenate the columns appropriately in Excel, using Python. We begin by inserting a header in the empty adjacent column.
ws.range("O1").value = "Date"
Next, we can insert the Excel formula we want to use as a string. Note: the specifics of what argument separator you should use depends on your machine’s local regional settings. On mine, the argument separator is a comma and that’s what I’ve used in this tutorial, but on yours it might be a semicolon.
ws.range("O2").value = "=C2&D2&RIGHT(E2, 2)"
Having inserted the formula in the first cell, it’s second nature in the regular Excel workflow to autofill the rest of the cells through the end of the table. Autofill is a method of the VBA Range object. It takes as parameters the destination cells as a VBA Range object and the type of fill. We’re interested in the default one whose enumeration is 0.
ws.range("O2").api.AutoFill(
ws.range("O2:O{row}".format(row=last_row)).api,
0
)
True
Here’s roughly how the screen should look after this step; note the new «Date» column on the far right.
We can also use the named form of the type of fill we want. To do this we’ll need to retrieve it from the module xlwings.constants which contains named versions of the enumerated arguments of most VBA properties. Recall that you can always check the available attributes by printing dir(xlwings.constants).
(If you’re not familiar with it, dir is a native Python function and can take several kinds of arguments (modules, classes and regular objects (like lists and strings). For example, if you print dir(some_list) it will give you all the methods and attributes that you can use with a list.)
What we did above could also be achieved with the following code snippet.
from xlwings.constants import AutoFillType
ws.range("O2").api.AutoFill(
ws.range("O2:O{row}".format(row=last_row)).api,
    AutoFillType.xlFillDefault
)
Since we’ll be using this often, we’ll create a function that applies the default fill, given:
- a worksheet
- a string representing a cell in the worksheet
- a last row to fill.
To do this we’ll introduce a new Range method called get_address. It takes in four Boolean arguments and returns a string that identifies the range with varying levels of detail. Here’s a hopefully enlightening illustration of this method.
for arg4 in (0, 1):
for arg3 in (0,1):
for arg2 in (0,1):
for arg1 in (0,1):
print(ws.range("O2").get_address(arg1, arg2, arg3, arg4))
O2
O$2
$O2
$O$2
EuroMillions!O2
EuroMillions!O$2
EuroMillions!$O2
EuroMillions!$O$2
[Book1]EuroMillions!O2
[Book1]EuroMillions!O$2
[Book1]EuroMillions!$O2
[Book1]EuroMillions!$O$2
[Book1]EuroMillions!O2
[Book1]EuroMillions!O$2
[Book1]EuroMillions!$O2
[Book1]EuroMillions!$O$2
And now we define our function.
def autofill(worksheet, cell, last_row):
   rg_cell = worksheet.range(cell)
   to_fill = "{col}{top_row}:{col}{last_row}".format(
      col=rg_cell.get_address(0,0)[0],
      top_row=rg_cell.row,
      last_row=last_row
   )
   rg_cell.api.Autofill(worksheet.range(to_fill).api, 0)
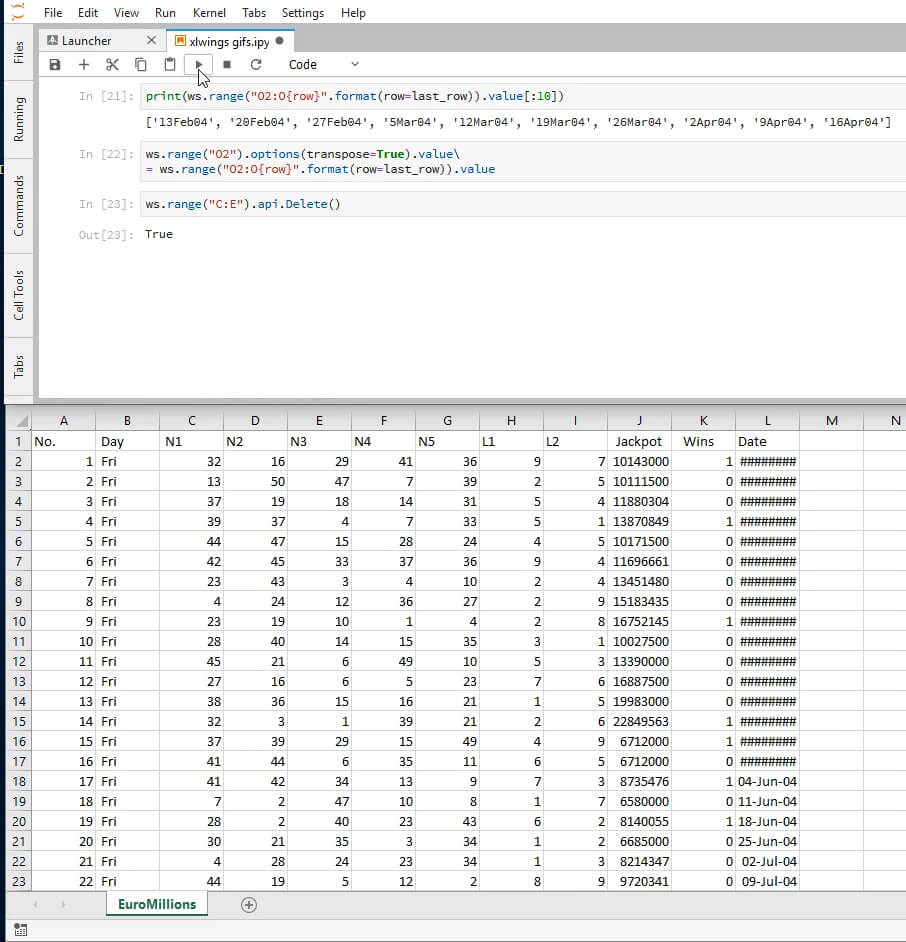
In order to save Excel from making unnecessary computations, we’ll replace the formulas we just inserted on column O with hard coded values. Before we do this let us take a moment to think about what kind of Python object is Range.value when Range is an array.
print(type(ws.range("O2:O{row}".format(row=last_row)).value))
<class 'list'>
It’s a list! Let’s see its first ten elements.
print(ws.range('O2:O{row}'.format(row=last_row)).value[:10])
['13Feb04', '20Feb04', '27Feb04', '5Mar04', '12Mar04', '19Mar04', '26Mar04', '2Apr04', '9Apr04', '16Apr04']
If we insert this list into any range, it will place the values horizontally, which isn’t what we want. In order to place them vertically, we’ll need to use the options method of Range objects with the option transpose=True as a parameter, like this:
ws.range('O2').options(transpose=True).value
= ws.range('O2:O{row}'.format(row=last_row)).value
And we can now delete columns C through E.
ws.range('C:E').api.Delete()
True
EuroMillions format has suffered some mild modifications over the years, the last one happened on September 24, 2016.
From September 24, 2016 the amount of lucky stars changed from a pool of 11 to a pool of 12 numbers. In order to make a meaningful analysis, we’ll only consider draws that occurred after the last modification. The next code snippet finds the last game that happened prior to the modification and names it to_delete.
import datetime

for day in ws.range('L2:L{}'.format(last_row)):
# checks if day is not prior to the change of the rules
    if day.value <= datetime.datetime(2016, 9, 24, 0, 0):
        # since day is past the modification date,
        # the row we want is the previous one, hence minus 1
        to_delete = int(day.get_address(0, 0)[1:])-1
        # leave the for cycle
        break
And we can now delete every row from the first game to to_delete.
ws.range('2:{}'.format(to_delete)).api.Delete()
True
Here’s where we’re at, at this point:
Having finished preparing the data, we will now format this table. We’ll begin by setting the font of the first row to bold.
ws.range('1:1').api.Font.Bold = True
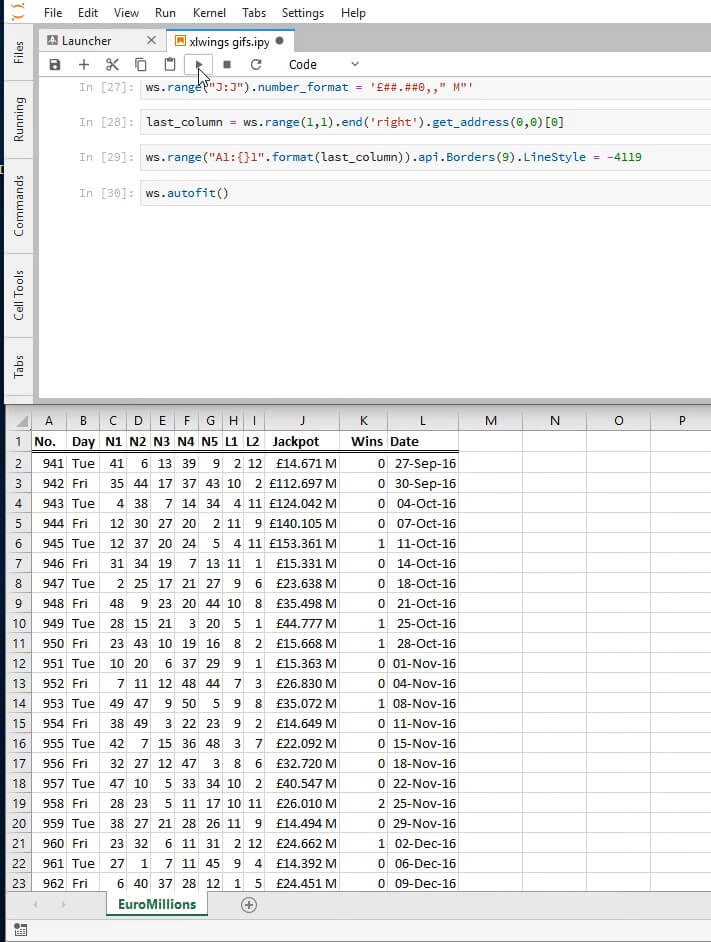
We can follow that by formatting the Jackpot column in millions. Note that the string format below depends on your machine’s local regional settings. If the format looks odd on your end, try swapping the commas with the dots. More on Excel custom formats here.
ws.range('J:J').number_format = "£##.##0,,' M'"
As an auxiliary step for what will follow, we’ll find the letter corresponding to the last column that has data.
last_column = ws.range(1,1).end('right').get_address(0,0)[0]
Let’s now add a border to the bottom of the header cells. Similarly to what we have been doing, we’ll use the api property. Additionally we are going to need the Border property of Range objects, the border orientation enumeration and the style of the border. We’ll be setting a double edged border (line style -4119) on the bottom of the header cells only (orientation 9).
ws.range('A1:{}1'.format(last_column)).api.Borders(9).LineStyle = -4119
Let us now autofit by both rows and columns.
ws.autofit()
Oops! This looks a bit squished, let us set the width of all columns to that of column J which seems to be the largest. Here is the ColumnWidth documentation that we are using just below.
ws.range('A:L').api.ColumnWidth = ws.range('J:J').api.ColumnWidth
That should look better. And we’re done with this sheet!
Let us add a new blank sheet called Frequencies and let us assign it to the Python name frequencies.
wb.sheets.add('Frequencies')
frequencies = wb.sheets['Frequencies']
We will be populating this sheet with the absolute frequencies of each number and each lucky star in the data set we just organized in the sheet EuroMillions.
# add a header for the numbers
frequencies.range('A1').value = 'Number'
# populate the fifty cells immediately below with the numbers 1 through 50
# since we're starting from the second row, we'll want to substract 1 from the row
frequencies.range('A2:A51').value = '=ROW()-1'
Below we’ll be inserting a header for the frequencies in cell B1 and in cell B2 we will input a formula that will count how many times the value in A2 occurs in the range C2:G201. In other words, we will count how many times 1 occurred in the columns N1-N5. After this we will autofill the rest of the cells on column B to do the same for their respective rows.
# add a header for the frequencies
frequencies.range('B1').value = 'Frequency'
# insert on B2 the result of a standard Excel formula
frequencies.range('B2').value = '=COUNTIF(Euromillions!$C$2:$G$201,Frequencies!A2)'
autofill(frequencies, 'B2', 51)
And we do the same for the lucky stars:
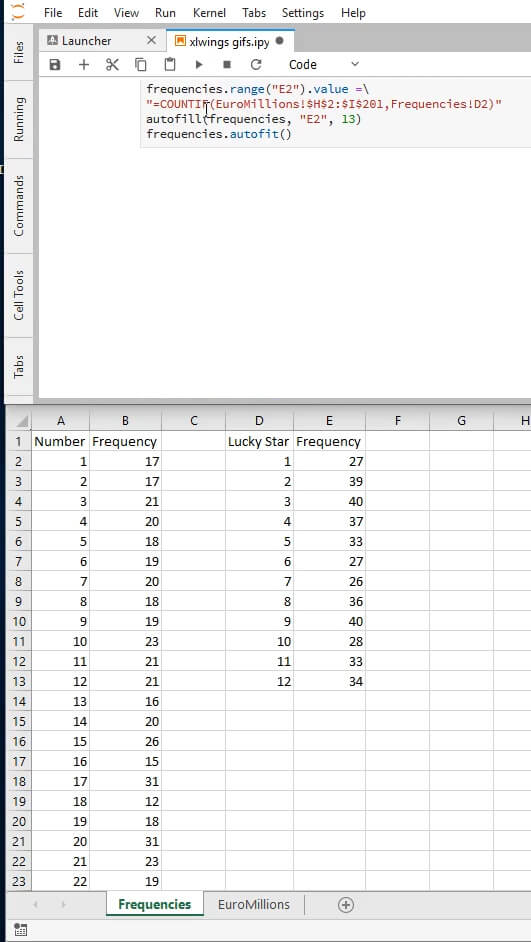
frequencies.range('D1').value = 'Lucky Star'
frequencies.range('E1').value = 'Frequency'
frequencies.range('D2:D13').value = '=ROW()-1'
frequencies.range('E2').value =
'=COUNTIF(EuroMillions!$H$2:$I$201,Frequencies!D2)'
autofill(frequencies, 'E2', 13)
frequencies.autofit()
Here’s how our new sheet should be looking at this point:
We are nearing our goal. Let’s create a sheet called Graphs.
wb.sheets.add('Graphs')
graphs = wb.sheets['Graphs']
Now we’ll create a Chart object. This will only produce a blank white box, but don’t worry! We’re going to use that box to chart our data in a moment.
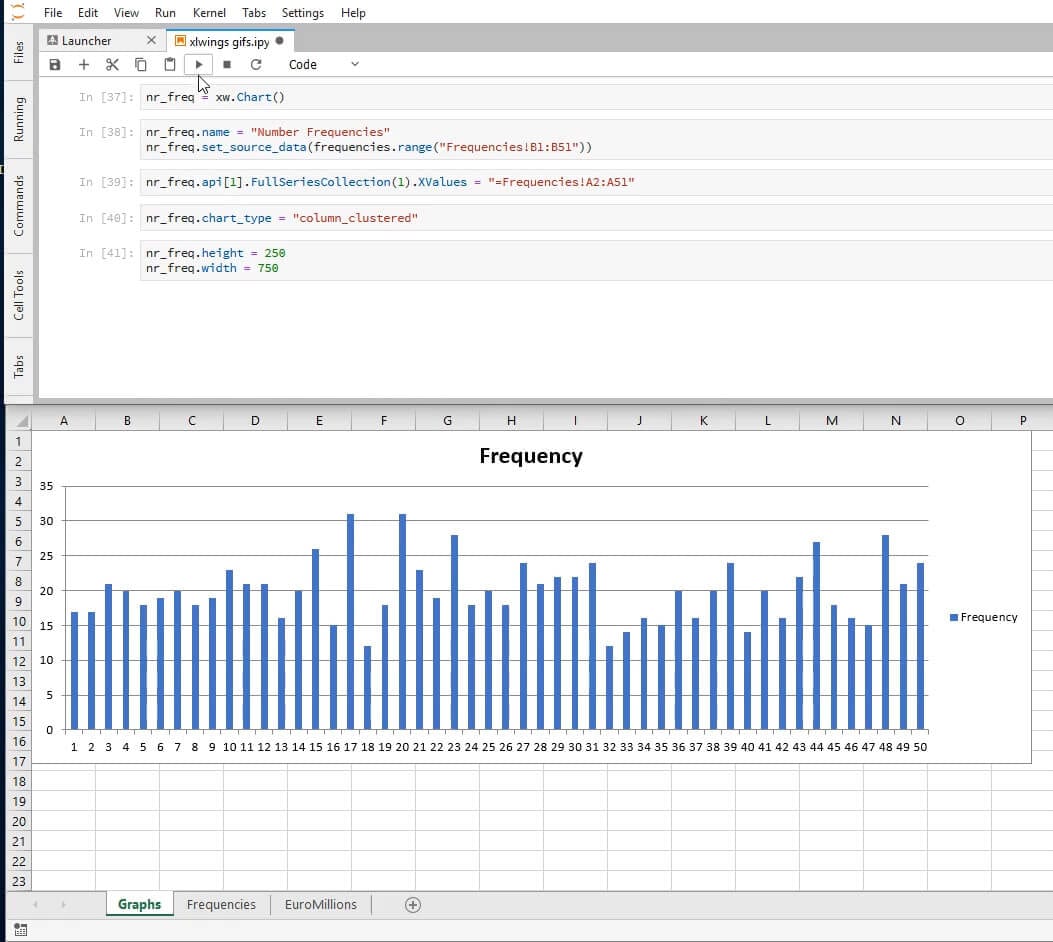
nr_freq = xw.Chart()
We can name our chart similarly to what we did for sheets. The method set_source_data allows us to define the data source for our chart by passing in a range object.
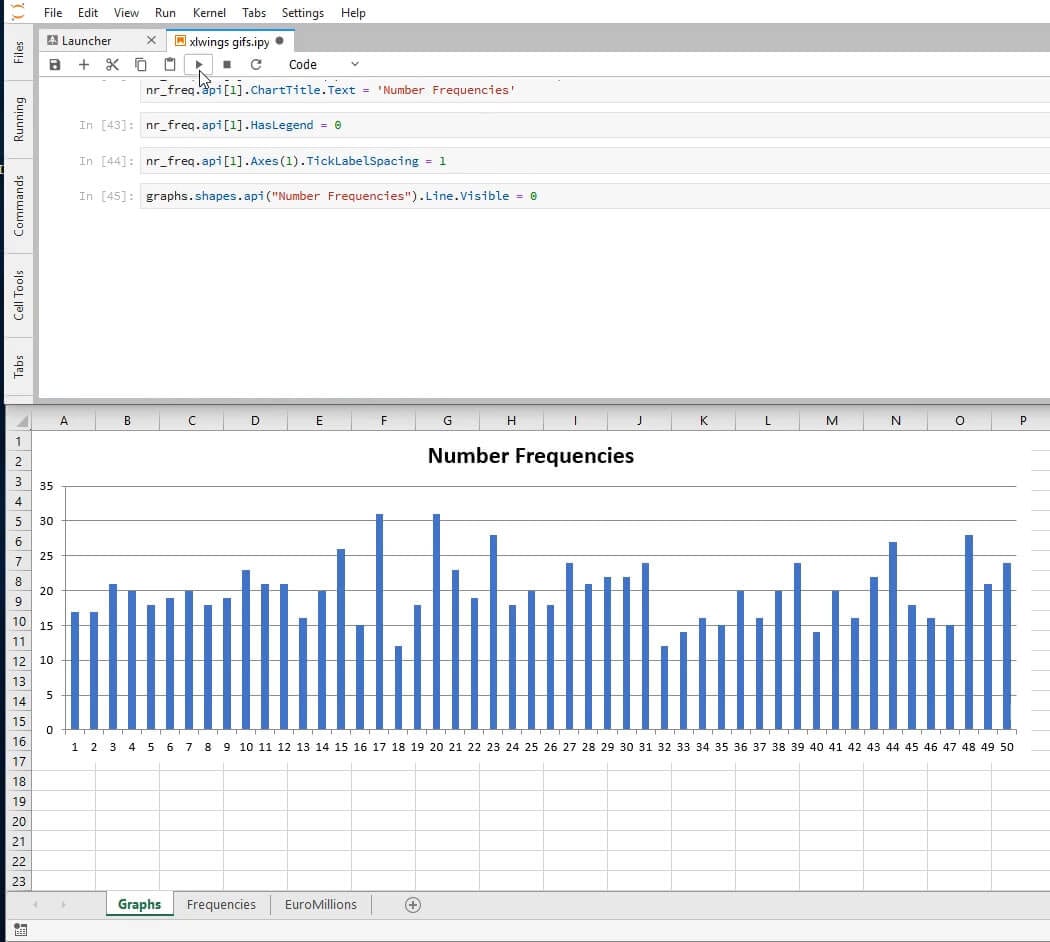
nr_freq.name = 'Number Frequencies'
nr_freq.set_source_data(frequencies.range('Frequencies!B1:B51'))
Excel will try to guess what the x-axis should be, but we can force it to be the numbers we created on Frequencies by using the VBA Chart method FullSeriesCollection. We can edit the chart by using the object at index 1 of nr_freq.api:
nr_freq.api[1].FullSeriesCollection(1).XValues = '=Frequencies!A2:A51'
Excel is very good at guessing what kind of chart the user wants, but just in case it guesses incorrectly, we will force it to be a column chart. The various types of charts are listed here. Alas, the only documentation bridging these to the possible values of the chart_type attribute is the source code itself.
nr_freq.chart_type = 'column_clustered'
We will now define the height and the width of the chart. The measure unit will be points.
nr_freq.height = 250
nr_freq.width = 750
Here’s what we should be seeing at this point:
The SetElement method together with the parameter 2 sets the title above the chart. See other arguments here.
nr_freq.api[1].SetElement(2)  # Place chart title at the top
nr_freq.api[1].ChartTitle.Text = 'Number Frequencies'
And we add the final touches. We remove the legend using the HasLegend property.
nr_freq.api[1].HasLegend = 0
The xlCategory category passed in as the argument 1 to the Axes method, together with the property TickLabelSpacing set to 1, ensures that every element of our axis is displayed.
nr_freq.api[1].Axes(1).TickLabelSpacing = 1
To finish formatting this chart, we remove the outline by setting the property Visible of the Line object to 0.
graphs.shapes.api('Number Frequencies').Line.Visible = 0
And here’s what we’ll see:
Below we do nearly the same thing for the lucky stars.
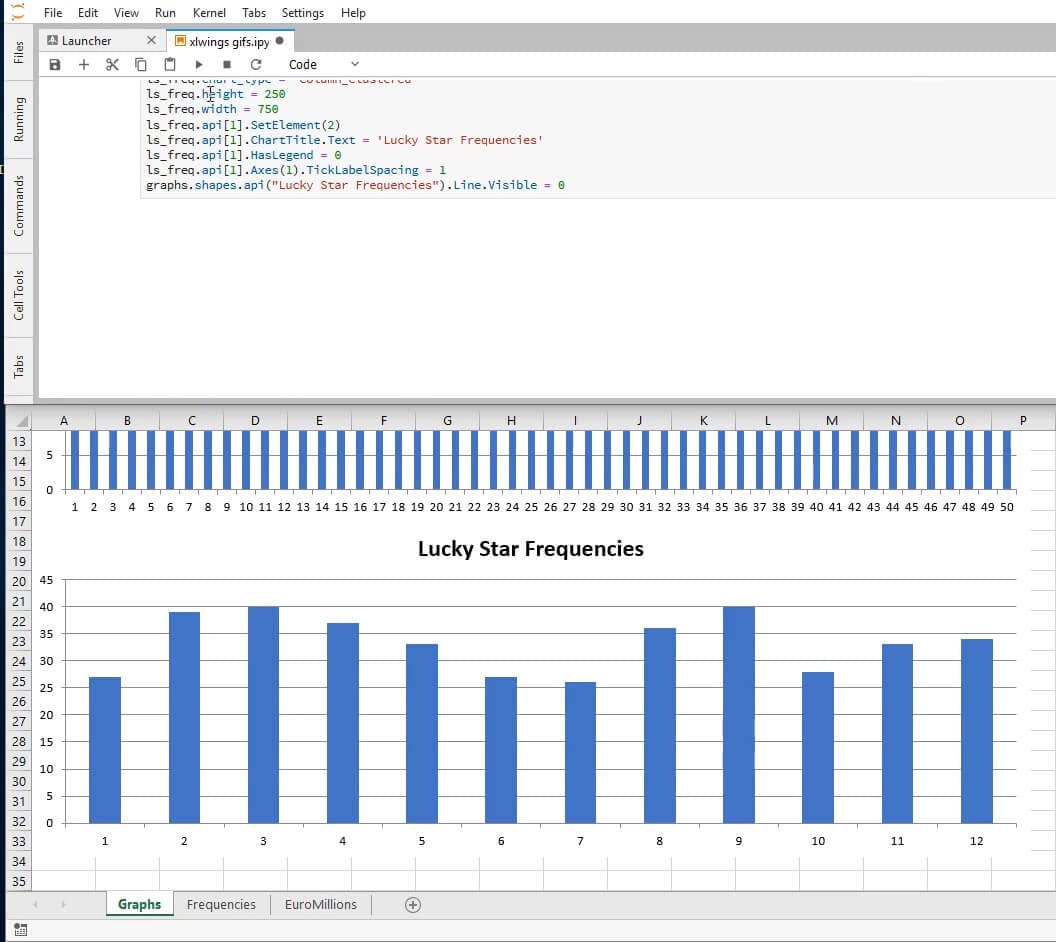
ls_freq = xw.Chart()
ls_freq.top = 250
ls_freq.name = 'Lucky Star Frequencies'
ls_freq.set_source_data(frequencies.range('Frequencies!E1:E13'))
ls_freq.api[1].FullSeriesCollection(1).XValues = '=Frequencies!D2:D13'
ls_freq.chart_type = 'column_clustered'
ls_freq.height = 250
ls_freq.width = 750
ls_freq.api[1].SetElement(2)
ls_freq.api[1].ChartTitle.Text = 'Lucky Star Frequencies'
ls_freq.api[1].HasLegend = 0
ls_freq.api[1].Axes(1).TickLabelSpacing = 1
graphs.shapes.api('Lucky Star Frequencies').Line.Visible = 0
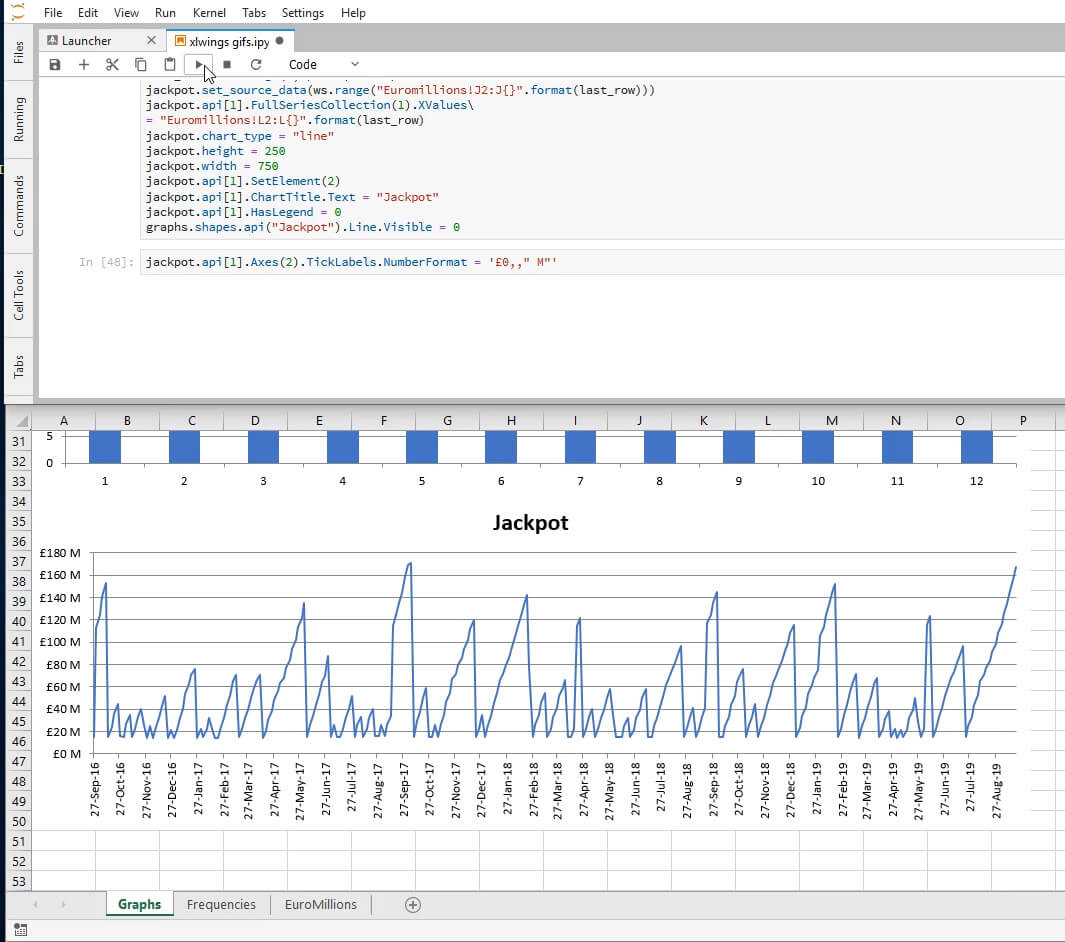
And to finalize we create a time series graph displaying the evolution of the jackpot.
jackpot = xw.Chart()
jackpot.top = 500
jackpot.name = 'Jackpot'
last_row = ws.range(1,1).end('down').row
jackpot.set_source_data(ws.range('Euromillions!J2:J{}'.format(last_row)))
jackpot.api[1].FullSeriesCollection(1).XValues
= 'Euromillions!L2:L{}'.format(last_row)
jackpot.chart_type = 'line'
jackpot.height = 250
jackpot.width = 750
jackpot.api[1].SetElement(2)
jackpot.api[1].ChartTitle.Text = 'Jackpot'
jackpot.api[1].HasLegend = 0
graphs.shapes.api('Jackpot').Line.Visible = 0
And we fix the vertical axis’ labels’ format by setting the TickLabels property NumberFormat to the desired appearance.
jackpot.api[1].Axes(2).TickLabels.NumberFormat = "£0,,' M'"
And we’re done! Now we save the file and exit our Excel instance.
wb.save('EuroMillions.xlsx')
xw.apps[0].quit()
Hopefully, this xlwings tutorial has been helpful!
Some useful resources for learning about xlwings are the official documentation, this formatting cheat sheet, the VBA for Excel documentation and the course xlwings: Python for Excel designed by Felix Zumstein himself, the developer of xlwings.