
Introduction
Styles are used to change the look of your data while displayed on screen.
They are also used to determine the formatting for numbers.
Styles can be applied to the following aspects:
- font to set font size, color, underlining, etc.
- fill to set a pattern or color gradient
- border to set borders on a cell
- cell alignment
- protection
The following are the default values
>>> from openpyxl.styles import PatternFill, Border, Side, Alignment, Protection, Font
>>> font = Font(name='Calibri',
...                 size=11,
...                 bold=False,
...                 italic=False,
...                 vertAlign=None,
...                 underline='none',
...                 strike=False,
...                 color='FF000000')
>>> fill = PatternFill(fill_type=None,
...                 start_color='FFFFFFFF',
...                 end_color='FF000000')
>>> border = Border(left=Side(border_style=None,
...                           color='FF000000'),
...                 right=Side(border_style=None,
...                            color='FF000000'),
...                 top=Side(border_style=None,
...                          color='FF000000'),
...                 bottom=Side(border_style=None,
...                             color='FF000000'),
...                 diagonal=Side(border_style=None,
...                               color='FF000000'),
...                 diagonal_direction=0,
...                 outline=Side(border_style=None,
...                              color='FF000000'),
...                 vertical=Side(border_style=None,
...                               color='FF000000'),
...                 horizontal=Side(border_style=None,
...                                color='FF000000')
...                )
>>> alignment=Alignment(horizontal='general',
...                     vertical='bottom',
...                     text_rotation=0,
...                     wrap_text=False,
...                     shrink_to_fit=False,
...                     indent=0)
>>> number_format = 'General'
>>> protection = Protection(locked=True,
...                         hidden=False)
>>>
Cell Styles and Named Styles
There are two types of styles: cell styles and named styles, also known as style templates.
Cell Styles
Cell styles are shared between objects and once they have been assigned they
cannot be changed. This stops unwanted side-effects such as changing the
style for lots of cells when only one changes.
>>> from openpyxl.styles import colors
>>> from openpyxl.styles import Font, Color
>>> from openpyxl import Workbook
>>> wb = Workbook()
>>> ws = wb.active
>>>
>>> a1 = ws['A1']
>>> d4 = ws['D4']
>>> ft = Font(color="FF0000")
>>> a1.font = ft
>>> d4.font = ft
>>>
>>> a1.font.italic = True # is not allowed # doctest: +SKIP
>>>
>>> # If you want to change the color of a Font, you need to reassign it::
>>>
>>> a1.font = Font(color="FF0000", italic=True) # the change only affects A1
Copying styles
Styles can also be copied
>>> from openpyxl.styles import Font
>>> from copy import copy
>>>
>>> ft1 = Font(name='Arial', size=14)
>>> ft2 = copy(ft1)
>>> ft2.name = "Tahoma"
>>> ft1.name
'Arial'
>>> ft2.name
'Tahoma'
>>> ft2.size # copied from the
14.0
Colours
Colours for fonts, backgrounds, borders, etc. can be set in three ways: indexed, aRGB or theme. Indexed colours are the legacy implementation and the colours themselves depend upon the index provided with the workbook or with the application default. Theme colours are useful for complementary shades of colours but also depend upon the theme being present in the workbook. It is, therefore, advisable to use aRGB colours.
aRGB colours
RGB colours are set using hexadecimal values for red, green and blue.
>>> from openpyxl.styles import Font
>>> font = Font(color="FF0000")
The alpha value refers in theory to the transparency of the colour but this is not relevant for cell styles. The default of 00 will prepended to any simple RGB value:
>>> from openpyxl.styles import Font
>>> font = Font(color="00FF00")
>>> font.color.rgb
'0000FF00'
There is also support for legacy indexed colours as well as themes and tints.
>>> from openpyxl.styles.colors import Color
>>> c = Color(indexed=32)
>>> c = Color(theme=6, tint=0.5)
Indexed Colours
| Index | |||||
|---|---|---|---|---|---|
| 0-4 | 00000000 | 00FFFFFF | 00FF0000 | 0000FF00 | 000000FF |
| 5-9 | 00FFFF00 | 00FF00FF | 0000FFFF | 00000000 | 00FFFFFF |
| 10-14 | 00FF0000 | 0000FF00 | 000000FF | 00FFFF00 | 00FF00FF |
| 15-19 | 0000FFFF | 00800000 | 00008000 | 00000080 | 00808000 |
| 20-24 | 00800080 | 00008080 | 00C0C0C0 | 00808080 | 009999FF |
| 25-29 | 00993366 | 00FFFFCC | 00CCFFFF | 00660066 | 00FF8080 |
| 30-34 | 000066CC | 00CCCCFF | 00000080 | 00FF00FF | 00FFFF00 |
| 35-39 | 0000FFFF | 00800080 | 00800000 | 00008080 | 000000FF |
| 40-44 | 0000CCFF | 00CCFFFF | 00CCFFCC | 00FFFF99 | 0099CCFF |
| 45-49 | 00FF99CC | 00CC99FF | 00FFCC99 | 003366FF | 0033CCCC |
| 50-54 | 0099CC00 | 00FFCC00 | 00FF9900 | 00FF6600 | 00666699 |
| 55-60 | 00969696 | 00003366 | 00339966 | 00003300 | 00333300 |
| 60-63 | 00993300 | 00993366 | 00333399 | 00333333 | |
The indices 64 and 65 cannot be set and are reserved for the system foreground and background colours respectively.
Applying Styles
Styles are applied directly to cells
>>> from openpyxl.workbook import Workbook
>>> from openpyxl.styles import Font, Fill
>>> wb = Workbook()
>>> ws = wb.active
>>> c = ws['A1']
>>> c.font = Font(size=12)
Styles can also applied to columns and rows but note that this applies only
to cells created (in Excel) after the file is closed. If you want to apply
styles to entire rows and columns then you must apply the style to each cell
yourself. This is a restriction of the file format:
>>> col = ws.column_dimensions['A']
>>> col.font = Font(bold=True)
>>> row = ws.row_dimensions[1]
>>> row.font = Font(underline="single")
Styling Merged Cells
The merged cell behaves similarly to other cell objects.
Its value and format is defined in its top-left cell.
In order to change the border of the whole merged cell,
change the border of its top-left cell.
The formatting is generated for the purpose of writing.
>>> from openpyxl.styles import Border, Side, PatternFill, Font, GradientFill, Alignment
>>> from openpyxl import Workbook
>>>
>>> wb = Workbook()
>>> ws = wb.active
>>> ws.merge_cells('B2:F4')
>>>
>>> top_left_cell = ws['B2']
>>> top_left_cell.value = "My Cell"
>>>
>>> thin = Side(border_style="thin", color="000000")
>>> double = Side(border_style="double", color="ff0000")
>>>
>>> top_left_cell.border = Border(top=double, left=thin, right=thin, bottom=double)
>>> top_left_cell.fill = PatternFill("solid", fgColor="DDDDDD")
>>> top_left_cell.fill = fill = GradientFill(stop=("000000", "FFFFFF"))
>>> top_left_cell.font  = Font(b=True, color="FF0000")
>>> top_left_cell.alignment = Alignment(horizontal="center", vertical="center")
>>>
>>> wb.save("styled.xlsx")
Using number formats
You can specify the number format for cells, or for some instances (ie datetime) it will automatically format.
>>> import datetime
>>> from openpyxl import Workbook
>>> wb = Workbook()
>>> ws = wb.active
>>> # set date using a Python datetime
>>> ws['A1'] = datetime.datetime(2010, 7, 21)
>>>
>>> ws['A1'].number_format
'yyyy-mm-dd h:mm:ss'
>>>
>>> ws["A2"] = 0.123456
>>> ws["A2"].number_format = "0.00" # Display to 2dp
Edit Page Setup
>>> from openpyxl.workbook import Workbook
>>>
>>> wb = Workbook()
>>> ws = wb.active
>>>
>>> ws.page_setup.orientation = ws.ORIENTATION_LANDSCAPE
>>> ws.page_setup.paperSize = ws.PAPERSIZE_TABLOID
>>> ws.page_setup.fitToHeight = 0
>>> ws.page_setup.fitToWidth = 1
Named Styles
In contrast to Cell Styles, Named Styles are mutable. They make sense when
you want to apply formatting to lots of different cells at once. NB. once you
have assigned a named style to a cell, additional changes to the style will
not affect the cell.
Once a named style has been registered with a workbook, it can be referred to simply by name.
Creating a Named Style
>>> from openpyxl.styles import NamedStyle, Font, Border, Side
>>> highlight = NamedStyle(name="highlight")
>>> highlight.font = Font(bold=True, size=20)
>>> bd = Side(style='thick', color="000000")
>>> highlight.border = Border(left=bd, top=bd, right=bd, bottom=bd)
Once a named style has been created, it can be registered with the workbook:
>>> wb.add_named_style(highlight)
But named styles will also be registered automatically the first time they are assigned to a cell:
>>> ws['A1'].style = highlight
Once registered, assign the style using just the name:
>>> ws['D5'].style = 'highlight'
Using builtin styles
The specification includes some builtin styles which can also be used.
Unfortunately, the names for these styles are stored in their localised
forms. openpyxl will only recognise the English names and only exactly as
written here. These are as follows:
- ‘Normal’ # same as no style
Number formats
- ‘Comma’
- ‘Comma [0]’
- ‘Currency’
- ‘Currency [0]’
- ‘Percent’
Informative
- ‘Calculation’
- ‘Total’
- ‘Note’
- ‘Warning Text’
- ‘Explanatory Text’
Text styles
- ‘Title’
- ‘Headline 1’
- ‘Headline 2’
- ‘Headline 3’
- ‘Headline 4’
- ‘Hyperlink’
- ‘Followed Hyperlink’
- ‘Linked Cell’
Comparisons
- ‘Input’
- ‘Output’
- ‘Check Cell’
- ‘Good’
- ‘Bad’
- ‘Neutral’
Highlights
- ‘Accent1’
- ‘20 % — Accent1’
- ‘40 % — Accent1’
- ‘60 % — Accent1’
- ‘Accent2’
- ‘20 % — Accent2’
- ‘40 % — Accent2’
- ‘60 % — Accent2’
- ‘Accent3’
- ‘20 % — Accent3’
- ‘40 % — Accent3’
- ‘60 % — Accent3’
- ‘Accent4’
- ‘20 % — Accent4’
- ‘40 % — Accent4’
- ‘60 % — Accent4’
- ‘Accent5’
- ‘20 % — Accent5’
- ‘40 % — Accent5’
- ‘60 % — Accent5’
- ‘Accent6’
- ‘20 % — Accent6’
- ‘40 % — Accent6’
- ‘60 % — Accent6’
- ‘Pandas’
For more information about the builtin styles please refer to the openpyxl.styles.builtins
OpenPyXL gives you the ability to style your cells in many different ways. Styling cells will give your spreadsheets pizazz! Your spreadsheets can have some pop and zing to them that will help differentiate them from others. However, don’t go overboard! If every cell had a different font and color, your spreadsheet would look like a mess.
You should use the skills that you learn in this article sparingly. You’ll still have beautiful spreadsheets that you can share with your colleagues. If you would like to learn more about what styles OpenPyXL supports, you should check out their documentation.
In this article, you will learn about the following:
- Working with fonts
- Setting the alignment
- Adding a border
- Changing the cell background-color
- Inserting images into cells
- Styling merged cells
- Using a built-in style
- Creating a custom named style
Now that you know what you’re going to learn, it’s time to get started by discovering how to work with fonts using OpenPyXL!
Working with Fonts
You use fonts to style your text on a computer. A font controls the size, weight, color, and style of the text you see on-screen or in print. There are thousands of fonts that your computer can use. Microsoft includes many fonts with its Office products.
When you want to set a font with OpenPyXL, you will need to import the Font class from openpyxl.styles. Here is how you would do the import:
from openpyxl.styles import Font
The Font class takes many parameters. Here is the Font class’s full list of parameters according to OpenPyXL’s documentation:
class openpyxl.styles.fonts.Font(name=None, sz=None, b=None, i=None, charset=None, u=None,
    strike=None, color=None, scheme=None, family=None, size=None, bold=None, italic=None,
    strikethrough=None, underline=None, vertAlign=None, outline=None, shadow=None,
    condense=None, extend=None)
The following list shows the parameters you are most likely to use and their defaults:
- name=’Calibri’
- size=11
- bold=False
- italic=False
- vertAlign=None
- underline=’none’
- strike=False
- color=’FF000000′
These settings allow you to set most of the things you’ll need to make your text look nice. Note that the color names in OpenPyXL use hexadecimal values to represent RGB (red, green, blue) color values. You can set whether or not the text should be bold, italic, underlined, or struck-through.
To see how you can use fonts in OpenPyXL, create a new file named font_sizes.py and add the following code to it:
# font_sizes.py

import openpyxl
from openpyxl.styles import Font


def font_demo(path):
    workbook = openpyxl.Workbook()
    sheet = workbook.active
    cell = sheet["A1"]
    cell.font = Font(size=12)
    cell.value = "Hello"

    cell2 = sheet["A2"]
    cell2.font = Font(name="Arial", size=14, color="00FF0000")
    sheet["A2"] = "from"

    cell2 = sheet["A3"]
    cell2.font = Font(name="Tahoma", size=16, color="00339966")
    sheet["A3"] = "OpenPyXL"

    workbook.save(path)


if __name__ == "__main__":
    font_demo("font_demo.xlsx")
This code uses three different fonts in three different cells. In A1, you use the default, which is Calibri. Then in A2, you set the font size to Arial and increase the size to 14 points. Finally, in A3, you change the font to Tahoma and the font size to 16 points.
For the second and third fonts, you also change the text color. In A2, you set the color to red, and in A3, you set the color to green.
When you run this code, your output will look like this:

Try changing the code to use other fonts or colors. If you want to get adventurous, you should try to make your text bold or italicized.
Now you’re ready to learn about text alignment.
Setting the Alignment
You can set alignment in OpenPyXL by using openpyxl.styles.Alignment. You use this class to rotate the text, set text wrapping, and for indentation.
Here are the defaults that the Alignment class uses:
- horizontal=’general’
- vertical=’bottom’
- text_rotation=0
- wrap_text=False
- shrink_to_fit=False
- indent=0
It’s time for you to get some practice in. Open up your Python editor and create a new file named alignment.py. Then add this code to it:
# alignment.py

from openpyxl import Workbook
from openpyxl.styles import Alignment


def center_text(path, horizontal="center", vertical="center"):
    workbook = Workbook()
    sheet = workbook.active
    sheet["A1"] = "Hello"
    sheet["A1"].alignment = Alignment(horizontal=horizontal,
                                      vertical=vertical)
    sheet["A2"] = "from"
    sheet["A3"] = "OpenPyXL"
    sheet["A3"].alignment = Alignment(text_rotation=90)
    workbook.save(path)


if __name__ == "__main__":
    center_text("alignment.xlsx")
You will center the string both horizontally and vertically in A1 when you run this code. Then you use the defaults for A2. Finally, for A3, you rotate the text 90 degrees.
Try running this code, and you will see something like the following:

That looks nice! It would be best if you took the time to try out different text_rotation values. Then try changing the horizontal and vertical parameters with different values. Pretty soon, you will be able to align your text like a pro!
Now you’re ready to learn about adding borders to your cells!
Adding a Border
OpenPyXL gives you the ability to style the borders on your cell. You can specify a different border style for each of the four sides of a cell.
You can use any of the following border styles:
- ‘dashDot’
- ‘dashDotDot’
- ‘dashed’
- ‘dotted’
- ‘double’
- ‘hair’
- ‘medium’
- ‘mediumDashDot’
- ‘mediumDashDotDot’,
- ‘mediumDashed’
- ‘slantDashDot’
- ‘thick’
- ‘thin’
Open your Python editor and create a new file named border.py. Then enter the following code in your file:
# border.py

from openpyxl import Workbook
from openpyxl.styles import Border, Side


def border(path):
    pink = "00FF00FF"
    green = "00008000"
    thin = Side(border_style="thin", color=pink)
    double = Side(border_style="double", color=green)

    workbook = Workbook()
    sheet = workbook.active

    sheet["A1"] = "Hello"
    sheet["A1"].border = Border(top=double, left=thin, right=thin, bottom=double)
    sheet["A2"] = "from"
    sheet["A3"] = "OpenPyXL"
    sheet["A3"].border = Border(top=thin, left=double, right=double, bottom=thin)
    workbook.save(path)


if __name__ == "__main__":
    border("border.xlsx")
This code will add a border to cell A1 and A3. The top and bottom of A1 use a “double” border style and are green, while the cell sides are using a “thin” border style and are colored pink.
Cell A3 uses the same borders but swaps them so that the sides are now green and the top and bottom are pink.
You get this effect by creating Side objects in the border_style and the color to be used. Then you pass those Side objects to a Border class, which allows you to set each of the four sides of a cell individually. To apply the Border to a cell, you must set the cell’s border attribute.
When you run this code, you will see the following result:

This image is zoomed in a lot so that you can easily see the borders of the cells. It would be best if you tried modifying this code with some of the other border styles mentioned at the beginning of this section so that you can see what else you can do.
Changing the Cell Background Color
You can highlight a cell or a range of cells by changing its background color. Highlighting a cell is more eye-catching than changing the text’s font or color in most cases. OpenPyXL gives you a class called PatternFill that you can use to change a cell’s background color.
The PatternFill class takes in the following arguments (defaults included below):
- patternType=None
- fgColor=Color()
- bgColor=Color()
- fill_type=None
- start_color=None
- end_color=None
There are several different fill types you can use. Here is a list of currently supported fill types:
- ‘none’
- ‘solid’
- ‘darkDown’
- ‘darkGray’
- ‘darkGrid’
- ‘darkHorizontal’
- ‘darkTrellis’
- ‘darkUp’
- ‘darkVertical’
- ‘gray0625’
- ‘gray125’
- ‘lightDown’
- ‘lightGray’
- ‘lightGrid’
- ‘lightHorizontal’
- ‘lightTrellis’
- ‘lightUp’
- ‘lightVertical’
- ‘mediumGray’
Now you have enough information to try setting the background color of a cell using OpenPyXL. Open up a new file in your Python editor and name it background_colors.py. Then add this code to your new file:
# background_colors.py

from openpyxl import Workbook
from openpyxl.styles import PatternFill


def background_colors(path):
    workbook = Workbook()
    sheet = workbook.active
    yellow = "00FFFF00"
    for rows in sheet.iter_rows(min_row=1, max_row=10, min_col=1, max_col=12):
        for cell in rows:
            if cell.row % 2:
                cell.fill = PatternFill(start_color=yellow, end_color=yellow,
                                        fill_type = "solid")
    workbook.save(path)


if __name__ == "__main__":
    background_colors("bg.xlsx")
This example will iterate over nine rows and 12 columns. It will set every cell’s background color to yellow if that cell is in an odd-numbered row. The cells with their background color changes will be from column A through column L.
When you want to set the cell’s background color, you set the cell’s fill attribute to an instance of PatternFill. In this example, you specify a start_color and an end_color. You also set the fill_type to “solid”. OpenPyXL also supports using a GradientFill for the background.
Try running this code. After it runs, you will have a new Excel document that looks like this:

Here are some ideas that you can try out with this code:
- Change the number of rows or columns that are affected
- Change the color that you are changing to
- Update the code to color the even rows with a different color
- Try out other fill types
Once you are done experimenting with background colors, you can learn about inserting images in your cells!
Inserting Images into Cells
OpenPyXL makes inserting an image into your Excel spreadsheets nice and straightforward. To make this magic happen, you use the Worksheet object’s add_image() method. This method takes in two arguments:
img– The path to the image file that you are insertinganchor– Provide a cell as a top-left anchor of the image (optional)
For this example, you will be using the Mouse vs. Python logo:
![]()
The GitHub repository for this book has the image for you to use.
Once you have the image downloaded, create a new Python file and name it insert_image.py. Then add the following:
# insert_image.py

from openpyxl import Workbook
from openpyxl.drawing.image import Image


def insert_image(path, image_path):
    workbook = Workbook()
    sheet = workbook.active
    img = Image("logo.png")
    sheet.add_image(img, "B1")
    workbook.save(path)


if __name__ == "__main__":
    insert_image("logo.xlsx", "logo.png")
Here you pass in the path to the image that you wish to insert. To insert the image, you call add_image(). In this example, you are hard-coding to use cell B1 as the anchor cell. Then you save your Excel spreadsheet.
If you open up your spreadsheet, you will see that it looks like this:
![]()
You probably won’t need to insert an image into an Excel spreadsheet all that often, but it’s an excellent skill to have.
Styling Merged Cells
Merged cells are cells where you have two or more adjacent cells merged into one. If you want to set the value of a merged cell with OpenPyXL, you must use the top left-most cell of the merged cells.
You also must use this particular cell to set the style for the merged cell as a whole. You can use all the styles and font settings you used on an individual cell with the merged cell. However, you must apply the style to the top-left cell for it to apply to the entire merged cell.
You will understand how this works if you see some code. Go ahead and create a new file named style_merged_cell.py. Now enter this code in your file:
# style_merged_cell.py

from openpyxl import Workbook
from openpyxl.styles import Font, Border, Side, GradientFill, Alignment


def merge_style(path):
    workbook = Workbook()
    sheet = workbook.active
    sheet.merge_cells("A2:G4")
    top_left_cell = sheet["A2"]

    light_purple = "00CC99FF"
    green = "00008000"
    thin = Side(border_style="thin", color=light_purple)
    double = Side(border_style="double", color=green)

    top_left_cell.value = "Hello from PyOpenXL"
    top_left_cell.border = Border(top=double, left=thin, right=thin,
                                  bottom=double)
    top_left_cell.fill = GradientFill(stop=("000000", "FFFFFF"))
    top_left_cell.font = Font(b=True, color="FF0000", size=16)
    top_left_cell.alignment = Alignment(horizontal="center",
                                        vertical="center")
    workbook.save(path)


if __name__ == "__main__":
    merge_style("merged_style.xlsx")
Here you create a merged cell that starts at A2 (the top-left cell) through G4. Then you set the cell’s value, border, fill, font and alignment.
When you run this code, your new spreadsheet will look like this:

Doesn’t that look nice? You should take some time and try out some different styles on your merged cell. Maybe come up with a better gradient than the gray one used here, for example.
Now you’re ready to learn about OpenPyXL’s built-in styles!
Using a Built-in Style
OpenPyXL comes with multiple built-in styles that you can use as well. Rather than reproducing the entire list of built-in styles in this book, you should go to the official documentation as it will be the most up-to-date source for the style names.
However, it is worth noting some of the styles. For example, here are the number format styles you can use:
- ‘Comma’
- ‘Comma [0]’
- ‘Currency’
- ‘Currency [0]’
- ‘Percent’
You can also apply text styles. Here is a listing of those styles:
- ‘Title’
- ‘Headline 1’
- ‘Headline 2’
- ‘Headline 3’
- ‘Headline 4’
- ‘Hyperlink’
- ‘Followed Hyperlink’
- ‘Linked Cell’
OpenPyXL has several other built-in style groups. You should check out the documentation to learn about all the different styles that are supported.
Now that you know about some of the built-in styles you can use, it’s time to write some code! Create a new file and name it builtin_styls.py. Then enter the following code:
# builtin_styles.py

from openpyxl import Workbook


def builtin_styles(path):
    workbook = Workbook()
    sheet = workbook.active
    sheet["A1"].value = "Hello"
    sheet["A1"].style = "Title"

    sheet["A2"].value = "from"
    sheet["A2"].style = "Headline 1"

    sheet["A3"].value = "OpenPyXL"
    sheet["A3"].style = "Headline 2"

    workbook.save(path)


if __name__ == "__main__":
    builtin_styles("builtin_styles.xlsx")
Here you apply three different styles to three different cells. You use “Title”, “Headline 1” and “Headline 2”, specifically.
When you run this code, you will end up having a spreadsheet that looks like this:

As always, you should try out some of the other built-in styles. Trying them out is the only way to determine what they do and if they will work for you.
But wait! What if you wanted to create your style? That’s what you will cover in the next section!
Creating a Custom Named Style
You can create custom styles of your design using OpenPyXL as well. To create your style, you must use the NamedStyle class.
The NamedStyle class takes the following arguments (defaults are included too):
- name=”Normal”
- font=Font()
- fill=PatternFill()
- border=Border()
- alignment=Alignment()
- number_format=None
- protection=Protection()
- builtinId=None
- hidden=False
- xfId=None
You should always provide your own name to your NamedStyle to keep it unique. Go ahead and create a new file and call it named_style.py. Then add this code to it:
# named_style.py

from openpyxl import Workbook
from openpyxl.styles import Font, Border, Side, NamedStyle


def named_style(path):
    workbook = Workbook()
    sheet = workbook.active

    red = "00FF0000"
    font = Font(bold=True, size=22)
    thick = Side(style="thick", color=red)
    border = Border(left=thick, right=thick, top=thick, bottom=thick)
    named_style = NamedStyle(name="highlight", font=font, border=border)

    sheet["A1"].value = "Hello"
    sheet["A1"].style = named_style

    sheet["A2"].value = "from"
    sheet["A3"].value = "OpenPyXL"

    workbook.save(path)


if __name__ == "__main__":
    named_style("named_style.xlsx")
Here you create a Font(), Side(), and Border() instance to pass to your NamedStyle(). Once you have your custom style created, you can apply it to a cell by setting the cell’s style attribute. Applying a custom style is done in the same way as you applied built-in styles!
You applied the custom style to the cell, A1.
When you run this code, you will get a spreadsheet that looks like this:

Now it’s your turn! Edit the code to use a Side style, which will change your border. Or create multiple Side instances so you can make each side of the cell unique. Play around with different fonts or add a custom background color!
Wrapping Up
You can do a lot of different things with cells using OpenPyXL. The information in this article gives you the ability to format your data in beautiful ways.
In this article, you learned about the following topics:
- Working with fonts
- Setting the alignment
- Adding a border
- Changing the cell background-color
- Inserting images into cells
- Styling merged cells
- Using a built-in style
- Creating a custom named style
You can take the information that you learned in this article to make beautiful spreadsheets. You can highlight exciting data by changing the cell’s background color or font. You can also change the cell’s format by using a built-in style. Go ahead and give it a try.
Experiment with the code in this article and see how powerful and valuable OpenPyXL is when working with cells.
Related Reading
- Reading Spreadsheets with OpenPyXL and Python
- Creating Spreadsheets with OpenPyXL and Python
- Automating Excel with Python (book)
Like openpyxl doc said:
This is an open source project, maintained by volunteers in their spare time. This may well mean that particular features or functions that you would like are missing.
I checked openpyxl source code, found that:
Till openpyxl 1.8.x, styles are mutable. Their attribute can be assigned directly like this:
from openpyxl.workbook import Workbook
from openpyxl.style import Color

wb = Workbook()
ws = wb.active
ws['A1'].style.font.color.index = Color.RED
However from of openpyxl 1.9, styles are immutable.
Styles are shared between objects and once they have been assigned they cannot be changed. This stops unwanted side-effects such as changing the style for lots of cells when instead of only one.
To create a new style object, you can assign it directly, or copy one from an existing cell’s style with new attributes, answer to the question as an example(forgive my Chinese English):
from openpyxl.styles import colors
from openpyxl.styles import Font, Color
from openpyxl import Workbook
wb = Workbook()
ws = wb.active

a1 = ws['A1']
d4 = ws['D4']

# create a new style with required attributes
ft_red = Font(color=colors.RED)
a1.font = ft_red

# you can also do it with function copy
ft_red_bold = ft_red.copy(bold=True)

# you can copy from a cell's style with required attributes
ft_red_sigle_underline = a1.font.copy(underline="single")

d4.font = ft_red_bold

# apply style to column E
col_e = ws.column_dimensions['E']
col_e.font = ft_red_sigle_underline
A cell’ style contains these attributes: font, fill, border, alignment, protection and number_format. Check openpyxl.styles.
They are similar and should be created as an object, except number_format, its value is string type.
Some pre-defined number formats are available, number formats can also be defined in string type. Check openpyxl.styles.numbers.
from openpyxl.styles import numbers

# use pre-defined values
ws.cell['T49'].number_format = numbers.FORMAT_GENERAL
ws.cell(row=2, column=4).number_format = numbers.FORMAT_DATE_XLSX15

# use strings
ws.cell['T57'].number_format = 'General'
ws.cell(row=3, column=5).number_format = 'd-mmm-yy'
ws.cell['E5'].number_format = '0.00'
ws.cell['E50'].number_format = '0.00%'
ws.cell['E100'].number_format = '_ * #,##0_ ;_ * -#,##0_ ;_ * "-"??_ ;_ @_ '
Last Updated on July 14, 2022 by
This tutorial will show you how to use the Python openpyxl library to customize Excel formatting such as cell color, alignment, borderlines, etc. We’ll continue with the previous example to make our monthly budget spreadsheet look prettier.
Library
The only library required is openpyxl, type the following in the command prompt window to install the library:
pip install openpyxlIn openpyxl, each Cell object has a bunch of attributes we can use for formatting:
| Attribute | Usage |
| Cell.font | font style, size, color, etc |
| Cell.number_format | number formats |
| Cell.fill | cell color and pattern |
| Cell.border | cell border |
| Cell.alignment | text alignment |
Collectively, these attributes are called styles but I still prefer calling them just formats. One thing to note is that we can apply styles to only one cell at a time. So we’ll need to do a loop in order to format a range of cells.
Color – Pattern (solid) Fill
There are two types of cell color formatting: Pattern Fill and Gradient Fill.
We use Pattern Fill to make a solid color or a pattern for the cell. A Pattern Fill refers to the following formatting in Excel:

The below code changes cells B11:C11 to a light gray background and changes cells B19:C19 to a dotted background known as 6.25% Gray (found in the Pattern Style dropbox). To make the formatting easier to see, we’ll hide all gridlines in Excel by setting ws.sheet_view.showGridLines to False.
from openpyxl.styles import PatternFill, GradientFill
ws.sheet_view.showGridLines = False

for c in ws['B11:C11'][0]:
    c.fill = PatternFill('solid', fgColor = 'F2F2F2')

for c in ws['B19:C19'][0]:
    c.fill = PatternFill('gray0625')
Color – Gradient Fill
A Gradient Fill usually takes two colors and interpolates colors between them and fills the cell background. The following code takes a cyan color (’85E4F7′) and a light blue color (‘4617F1’) for the gradient fill. You can change the two RGB hex code inside the stop argument to any color to create your own gradient fill.
ws['E7'].fill = GradientFill('linear', stop = ('85E4F7','4617F1'))
ws['E9'].fill = GradientFill('linear', stop = ('85E4F7','4617F1'))
ws['E11'].fill = GradientFill('linear', stop = ('85E4F7','4617F1'))
ws['E13'].fill = GradientFill('linear', stop = ('85E4F7','4617F1'))
Borderlines
Borderlines refer to the four sides of a cell. With openpyxl, we can control the style (solid vs dash, etc), thickness, color, and position of the borderlines. We need two objects to model a cell’s borderline: Border and Side.
A Border can contain one or multiple Sides. Then we assign the cell.border attribute to a Border object to create the borderlines.
from openpyxl.styles import Border, Side

double = Side(border_style="double", color="4617F1")
thin = Side(border_style="thin", color="4617F1")
regular = Side(border_style="medium", color="000000")

## For the title cells B2 to F2
for c in ws['B2:F2'][0]:
    c.border = Border(bottom=double, top=thin)


no_left_side = Border(top = regular,bottom=regular,right=regular)
no_right_side = Border(top = regular,bottom=regular, left=regular)
box = Border(top = regular,bottom=regular, left=regular,right=regular)

## For the "table-like" cells
for c in ws['B8:B11']+ws['B15:B19']:
    c[0].border = no_left_side

for c in ws['C8:C11']+ws['C15:C19']:
    c[0].border = no_right_side
Text Alignment
We use the Alignment object to model text/number alignment within a cell, then assign the cell.alignment attribute to the object.
from openpyxl.styles import Alignment

center_align = Alignment(horizontal='center', vertical='center')

for c in ws['C8:C11']+ws['C15:C19']:
    c[0].border = no_right_side
    c[0].alignment = center_align

for c in ws['F7:F14']:
    c[0].alignment = center_align
Additional Resources
Python & Excel – Number Format
Python openpyxl – How to Insert Rows, Columns in Excel
Adjust Excel Fonts using Python openpyxl
Write Data to Excel using Python
Документ электронной таблицы Excel называется рабочей книгой. Каждая книга может хранить некоторое количество листов. Лист, просматриваемый пользователем в данный момент, называется активным. Лист состоит из из столбцов (адресуемых с помощью букв, начиная с A) и строк (адресуемых с помощью цифр, начиная с 1).
Модуль OpenPyXL не поставляется вместе с Python, поэтому его предварительно нужно установить:
> pip install openpyxl
Чтение файлов Excel
Начинаем работать:
>>> import openpyxl
>>> wb = openpyxl.load_workbook('example.xlsx')
>>> type(wb)
<class 'openpyxl.workbook.workbook.Workbook'>
>>> wb.sheetnames
['Лист1', 'Лист2', 'Лист3']
>>> sheet = wb.active
>>> sheet
<Worksheet "Лист1">
>>> sheet['A1']
<Cell Лист1.A1>
А теперь небольшой скрипт:
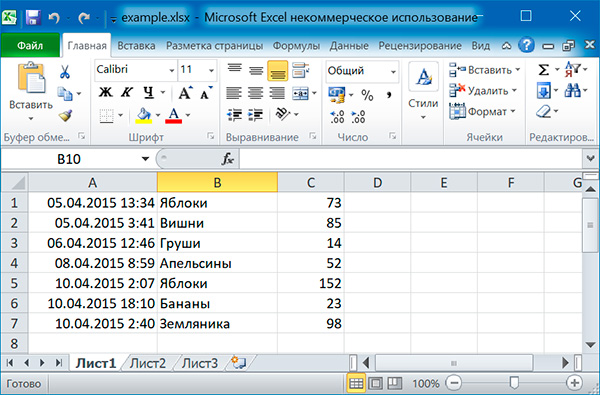
import openpyxl

# читаем excel-файл
wb = openpyxl.load_workbook('example.xlsx')

# печатаем список листов
sheets = wb.sheetnames
for sheet in sheets:
    print(sheet)

# получаем активный лист
sheet = wb.active

# печатаем значение ячейки A1
print(sheet['A1'].value)
# печатаем значение ячейки B1
print(sheet['B1'].value)
Результат работы:
Лист1
Лист2
Лист3

2015-04-05 13:34:02
Яблоки
Как получить другой лист книги:
# получаем другой лист
sheet2 = wb['Лист2']
# печатаем значение ячейки A1
print(sheet2['A2'].value)
Как сделать лист книги активным:
# делаем третий лист активным
wb.active = 2
Как задать имя листа:
sheet.title = 'Третий лист'
Объект Cell имеет атрибут value, который содержит значение, хранящееся в ячейке. Объект Cell также имеет атрибуты row, column и coordinate, которые предоставляют информацию о расположении данной ячейки в таблице.
# получаем ячейку листа B2
cell = sheet['B2']
print('Строка: ' + str(cell.row))
print('Столбец: ' + cell.column)
print('Ячейка: ' + cell.coordinate)
print('Значение: ' + cell.value)
Строка: 2
Столбец: B
Ячейка: B2
Значение: Вишни
К отдельной ячейке можно также обращаться с помощью метода cell() объекта Worksheet, передавая ему именованные аргументы row и column. Первому столбцу или первой строке соответствует число 1, а не 0:
# получаем ячейку листа B2
cell = sheet.cell(row = 2, column = 2)
print(cell.value)
Вишни
Размер листа можно получить с помощью атрибутов max_row и max_column объекта Worksheet:
rows = sheet.max_row
cols = sheet.max_column

for i in range(1, rows + 1):
    string = ''
    for j in range(1, cols + 1):
        cell = sheet.cell(row = i, column = j)
        string = string + str(cell.value) + ' '
    print(string)
2015-04-05 13:34:02 Яблоки 73
2015-04-05 03:41:23 Вишни 85
2015-04-06 12:46:51 Груши 14
2015-04-08 08:59:43 Апельсины 52
2015-04-10 02:07:00 Яблоки 152
2015-04-10 18:10:37 Бананы 23
2015-04-10 02:40:46 Земляника 98
Чтобы преобразовать буквенное обозначение столбца в цифровое, следует вызвать функцию
openpyxl.utils.column_index_from_string()
Чтобы преобразовать цифровое обозначение столбуа в буквенное, следует вызвать функцию
openpyxl.utils.get_column_letter()
Для вызова этих функций загружать рабочую книгу не обязательно.
>>> from openpyxl.utils import get_column_letter, column_index_from_string
>>> get_column_letter(1)
'A'
>>> get_column_letter(27)
'AA'
>>> column_index_from_string('A')
1
>>> column_index_from_string('AA')
27
Используя срезы объектов Worksheet, можно получить все объекты Cell, принадлежащие определенной строке, столбцу или прямоугольной области.
>>> sheet['A1':'C3']
((<Cell 'Лист1'.A1>, <Cell 'Лист1'.B1>, <Cell 'Лист1'.C1>),
 (<Cell 'Лист1'.A2>, <Cell 'Лист1'.B2>, <Cell 'Лист1'.C2>),
 (<Cell 'Лист1'.A3>, <Cell 'Лист1'.B3>, <Cell 'Лист1'.C3>))
for row in sheet['A1':'C3']:
    string = ''
    for cell in row:
        string = string + str(cell.value) + ' '
    print(string)
2015-04-05 13:34:02 Яблоки 73
2015-04-05 03:41:23 Вишни 85
2015-04-06 12:46:51 Груши 14
Выводим значения второй колонки:
>>> sheet['B']
(<Cell 'Лист1'.B1>, <Cell 'Лист1'.B2>, <Cell 'Лист1'.B3>, <Cell 'Лист1'.B4>, ..., <Cell 'Лист1'.B7>)
for cell in sheet['B']:
    print(cell.value)
Яблоки
Вишни
Груши
Апельсины
Яблоки
Бананы
Земляника
Выводим строки с первой по третью:
>>> sheet[1:3]
((<Cell 'Лист1'.A1>, <Cell 'Лист1'.B1>, <Cell 'Лист1'.C1>),
 (<Cell 'Лист1'.A2>, <Cell 'Лист1'.B2>, <Cell 'Лист1'.C2>),
 (<Cell 'Лист1'.A3>, <Cell 'Лист1'.B3>, <Cell 'Лист1'.C3>))
for row in sheet[1:3]:
    string = ''
    for cell in row:
        string = string + str(cell.value) + ' '
    print(string)
2015-04-05 13:34:02 Яблоки 73
2015-04-05 03:41:23 Вишни 85
2015-04-06 12:46:51 Груши 14
Для доступа к ячейкам конкретной строки или столбца также можно воспользоваться атрибутами rows и columns объекта Worksheet.
>>> list(sheet.rows)
[(<Cell 'Лист1'.A1>, <Cell 'Лист1'.B1>, <Cell 'Лист1'.C1>),
 (<Cell 'Лист1'.A2>, <Cell 'Лист1'.B2>, <Cell 'Лист1'.C2>),
 ..........
 (<Cell 'Лист1'.A6>, <Cell 'Лист1'.B6>, <Cell 'Лист1'.C6>),
 (<Cell 'Лист1'.A7>, <Cell 'Лист1'.B7>, <Cell 'Лист1'.C7>)]
for row in sheet.rows:
    print(row)
(<Cell 'Лист1'.A1>, <Cell 'Лист1'.B1>, <Cell 'Лист1'.C1>)
(<Cell 'Лист1'.A2>, <Cell 'Лист1'.B2>, <Cell 'Лист1'.C2>)
..........
(<Cell 'Лист1'.A6>, <Cell 'Лист1'.B6>, <Cell 'Лист1'.C6>)
(<Cell 'Лист1'.A7>, <Cell 'Лист1'.B7>, <Cell 'Лист1'.C7>)
>>> list(sheet.columns)
[(<Cell 'Лист1'.A1>, <Cell 'Лист1'.A2>, <Cell 'Лист1'.A3>, <Cell 'Лист1'.A4>, ..., <Cell 'Лист1'.A7>),
 (<Cell 'Лист1'.B1>, <Cell 'Лист1'.B2>, <Cell 'Лист1'.B3>, <Cell 'Лист1'.B4>, ..., <Cell 'Лист1'.B7>),
 (<Cell 'Лист1'.C1>, <Cell 'Лист1'.C2>, <Cell 'Лист1'.C3>, <Cell 'Лист1'.C4>, ..., <Cell 'Лист1'.C7>)]
for column in sheet.columns:
    print(column)
(<Cell 'Лист1'.A1>, <Cell 'Лист1'.A2>, <Cell 'Лист1'.A3>, <Cell 'Лист1'.A4>, ..., <Cell 'Лист1'.A7>)
(<Cell 'Лист1'.B1>, <Cell 'Лист1'.B2>, <Cell 'Лист1'.B3>, <Cell 'Лист1'.B4>, ..., <Cell 'Лист1'.B7>)
(<Cell 'Лист1'.C1>, <Cell 'Лист1'.C2>, <Cell 'Лист1'.C3>, <Cell 'Лист1'.C4>, ..., <Cell 'Лист1'.C7>)
Выводим значения всех ячеек листа:
for row in sheet.rows:
    string = ''
    for cell in row:
        string = string + str(cell.value) + ' '
    print(string)
2015-04-05 13:34:02 Яблоки 73
2015-04-05 03:41:23 Вишни 85
2015-04-06 12:46:51 Груши 14
2015-04-08 08:59:43 Апельсины 52
2015-04-10 02:07:00 Яблоки 152
2015-04-10 18:10:37 Бананы 23
2015-04-10 02:40:46 Земляника 98
Выводим значения второй строки (индекс 1):
for cell in list(sheet.rows)[1]:
    print(str(cell.value))
2015-04-05 03:41:23
Вишни
85
Выводим значения второй колонки (индекс 1):
for row in sheet.rows:
    print(str(row[1].value))
Яблоки
Вишни
Груши
Апельсины
Яблоки
Бананы
Земляника
Запись файлов Excel
>>> import openpyxl
>>> wb = openpyxl.Workbook()
>>> wb.sheetnames
['Sheet']
>>> wb.create_sheet(title = 'Первый лист', index = 0)
<Worksheet "Первый лист">
>>> wb.sheetnames
['Первый лист', 'Sheet']
>>> wb.remove(wb['Первый лист'])
>>> wb.sheetnames
['Sheet']
>>> wb.save('example.xlsx')
Метод create_sheet() возвращает новый объект Worksheet, который по умолчанию становится последним листом книги. С помощью именованных аргументов title и index можно задать имя и индекс нового листа.
Метод remove() принимает в качестве аргумента не строку с именем листа, а объект Worksheet. Если известно только имя листа, который надо удалить, используйте wb[sheetname]. Еще один способ удалить лист — использовать инструкцию del wb[sheetname].
Не забудьте вызвать метод save(), чтобы сохранить изменения после добавления или удаления листа рабочей книги.
Запись значений в ячейки напоминает запись значений в ключи словаря:
>>> import openpyxl
>>> wb = openpyxl.Workbook()
>>> wb.create_sheet(title = 'Первый лист', index = 0)
>>> sheet = wb['Первый лист']
>>> sheet['A1'] = 'Здравствуй, мир!'
>>> sheet['A1'].value
'Здравствуй, мир!'
Заполняем таблицу 3×3:
import openpyxl

# создаем новый excel-файл
wb = openpyxl.Workbook()

# добавляем новый лист
wb.create_sheet(title = 'Первый лист', index = 0)

# получаем лист, с которым будем работать
sheet = wb['Первый лист']

for row in range(1, 4):
    for col in range(1, 4):
        value = str(row) + str(col)
        cell = sheet.cell(row = row, column = col)
        cell.value = value

wb.save('example.xlsx')
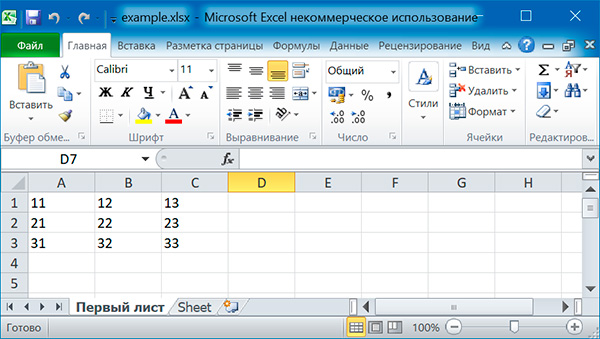
Можно добавлять строки целиком:
sheet.append(['Первый', 'Второй', 'Третий'])
sheet.append(['Четвертый', 'Пятый', 'Шестой'])
sheet.append(['Седьмой', 'Восьмой', 'Девятый'])
Стилевое оформление
Для настройки шрифтов, используемых в ячейках, необходимо импортировать функцию Font() из модуля openpyxl.styles:
from openpyxl.styles import Font
Ниже приведен пример создания новой рабочей книги, в которой для шрифта, используемого в ячейке A1, устанавливается шрифт Arial, красный цвет, курсивное начертание и размер 24 пункта:
import openpyxl
from openpyxl.styles import Font

# создаем новый excel-файл
wb = openpyxl.Workbook()
# добавляем новый лист
wb.create_sheet(title = 'Первый лист', index = 0)
# получаем лист, с которым будем работать
sheet = wb['Первый лист']

font = Font(name='Arial', size=24, italic=True, color='FF0000')
sheet['A1'].font = font
sheet['A1'] = 'Здравствуй мир!'

# записываем файл
wb.save('example.xlsx')
Именованные стили применяются, когда надо применить стилевое оформление к большому количеству ячеек.
import openpyxl
from openpyxl.styles import NamedStyle, Font, Border, Side

# создаем новый excel-файл
wb = openpyxl.Workbook()
# добавляем новый лист
wb.create_sheet(title = 'Первый лист', index = 0)
# получаем лист, с которым будем работать
sheet = wb['Первый лист']

# создаем именованный стиль
ns = NamedStyle(name='highlight')
ns.font = Font(bold=True, size=20)
border = Side(style='thick', color='000000')
ns.border = Border(left=border, top=border, right=border, bottom=border)

# вновь созданный именованный стиль надо зарегистрировать
# для дальнейшего использования
wb.add_named_style(ns)

# теперь можно использовать именованный стиль
sheet['A1'].style = 'highlight'

# записываем файл
wb.save('example.xlsx')
Добавление формул
Формулы, начинающиеся со знака равенства, позволяют устанавливать для ячеек значения, рассчитанные на основе значений в других ячейках.
sheet['B9'] = '=SUM(B1:B8)'
Эта инструкция сохранит =SUM(B1:B8) в качестве значения в ячейке B9. Тем самым для ячейки B9 задается формула, которая суммирует значения, хранящиеся в ячейках от B1 до B8.
Формула Excel — это математическое выражение, которое создается для вычисления результата и которое может зависеть от содержимого других ячеек. Формула в ячейке Excel может содержать данные, ссылки на другие ячейки, а также обозначение действий, которые необходимо выполнить.
Использование ссылок на ячейки позволяет пересчитывать результат по формулам, когда происходят изменения содержимого ячеек, включенных в формулы. Формулы Excel начинаются со знака =. Скобки () могут использоваться для определения порядка математических операции.
Примеры формул Excel: =27+36, =А1+А2-АЗ, =SUM(А1:А5), =MAX(АЗ:А5), =(А1+А2)/АЗ.
Хранящуюся в ячейке формулу можно читать, как любое другое значение. Однако, если нужно получить результат расчета по формуле, а не саму формулу, то при вызове функции load_workbook() ей следует передать именованный аргумент data_only со значением True.
Настройка строк и столбцов
С помощью модуля OpenPyXL можно задавать высоту строк и ширину столбцов таблицы, закреплять их на месте (чтобы они всегда были видны на экране), полностью скрывать из виду, объединять ячейки.
Настройка высоты строк и ширины столбцов
Объекты Worksheet имеют атрибуты row_dimensions и column_dimensions, которые управляют высотой строк и шириной столбцов.
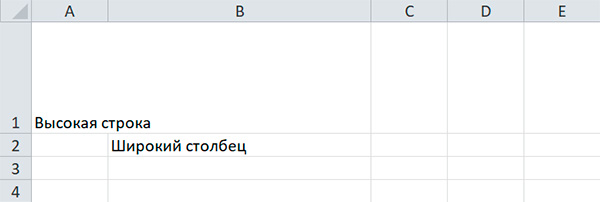
sheet['A1'] = 'Высокая строка'
sheet['B2'] = 'Широкий столбец'

sheet.row_dimensions[1].height = 70
sheet.column_dimensions['B'].width = 30
Атрибуты row_dimensions и column_dimensions представляют собой значения, подобные словарю. Атрибут row_dimensions содержит объекты RowDimensions, а атрибут column_dimensions содержит объекты ColumnDimensions. Доступ к объектам в row_dimensions осуществляется с использованием номера строки, а доступ к объектам в column_dimensions — с использованием буквы столбца.
Для указания высоты строки разрешено использовать целые или вещественные числа в диапазоне от 0 до 409. Для указания ширины столбца можно использовать целые или вещественные числа в диапазоне от 0 до 255. Столбцы с нулевой шириной и строки с нулевой высотой невидимы для пользователя.
Объединение ячеек
Ячейки, занимающие прямоугольную область, могут быть объединены в одну ячейку с помощью метода merge_cells() рабочего листа:
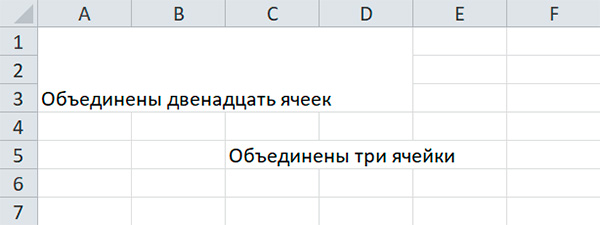
sheet.merge_cells('A1:D3')
sheet['A1'] = 'Объединены двенадцать ячеек'

sheet.merge_cells('C5:E5')
sheet['C5'] = 'Объединены три ячейки'
Чтобы отменить слияние ячеек, надо вызвать метод unmerge_cells():
sheet.unmerge_cells('A1:D3')
sheet.unmerge_cells('C5:E5')
Закрепление областей
Если размер таблицы настолько велик, что ее нельзя увидеть целиком, можно заблокировать несколько верхних строк или крайних слева столбцов в их позициях на экране. В этом случае пользователь всегда будет видеть заблокированные заголовки столбцов или строк, даже если он прокручивает таблицу на экране.
У объекта Worksheet имеется атрибут freeze_panes, значением которого может служить объект Cell или строка с координатами ячеек. Все строки и столбцы, расположенные выше и левее, будут заблокированы.
| Значение атрибута freeze_panes | Заблокированные строки и столбцы |
|---|---|
sheet.freeze_panes = 'A2' |
Строка 1 |
sheet.freeze_panes = 'B1' |
Столбец A |
sheet.freeze_panes = 'C1' |
Столбцы A и B |
sheet.freeze_panes = 'C2' |
Строка 1 и столбцы A и B |
sheet.freeze_panes = None |
Закрепленные области отсутствуют |
Диаграммы
Модуль OpenPyXL поддерживает создание гистогорамм, графиков, а также точечных и круговых диаграмм с использование данных, хранящихся в электронной таблице. Чтобы создать диаграмму, необходимо выполнить следующие действия:
- создать объект
Referenceна основе ячеек в пределах выделенной прямоугольной области; - создать объект
Series, передав функцииSeries()объектReference; - создать объект Chart;
- дополнительно можно установить значения переменных
drawing.top,drawing.left,drawing.width,drawing.heightобъектаChart, определяющих положение и размеры диаграммы; - добавить объект
Chartв объектWorksheet.
Объекты Reference создаются путем вызова функции openpyxl.charts.Reference(), принимающей пять аргуменов:
- Объект
Worksheet, содержащий данные диаграммы. - Два целых числа, представляющих верхнюю левую ячейку выделенной прямоугольной области, в которых содержатся данные диаграммы: первое число задает строку, второе — столбец; первой строке соответствует 1, а не 0.
- Два целых числа, представляющих нижнюю правую ячейку выделенной прямоугольной области, в которых содержатся данные диаграммы: первое число задает строку, второе — столбец.
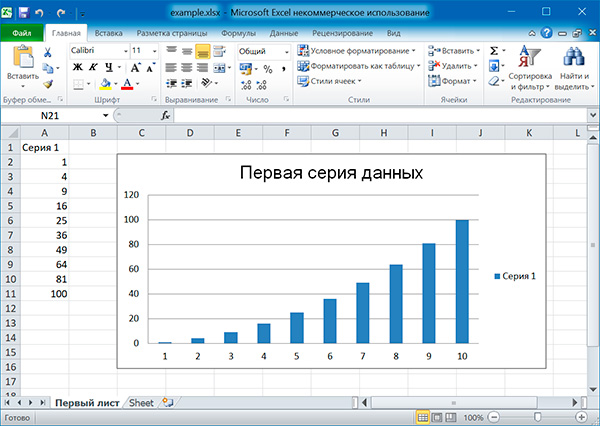
from openpyxl import Workbook
from openpyxl.chart import BarChart, Reference

# создаем новый excel-файл
wb = Workbook()
# добавляем новый лист
wb.create_sheet(title = 'Первый лист', index = 0)
# получаем лист, с которым будем работать
sheet = wb['Первый лист']

sheet['A1'] = 'Серия 1'
# это колонка с данными
for i in range(1, 11):
    cell = sheet.cell(row = i + 1, column = 1)
    cell.value = i * i

# создаем диаграмму
chart = BarChart()
chart.title = 'Первая серия данных'
data = Reference(sheet, min_col = 1, min_row = 1, max_col = 1, max_row = 11)
chart.add_data(data, titles_from_data = True)

# добавляем диаграмму на лист
sheet.add_chart(chart, 'C2')

# записываем файл
wb.save('example.xlsx')
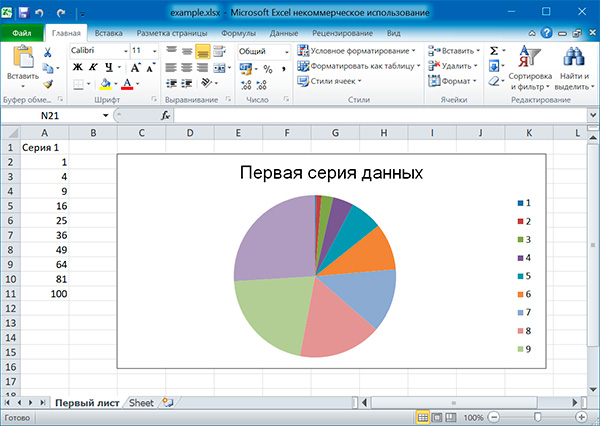
Аналогично можно создавать графики, точечные и круговые диаграммы, вызывая методы:
openpyxl.chart.LineChart()openpyxl.chart.ScatterChart()openpyxl.chart.PieChart()
Поиск:
Excel • MS • Python • Web-разработка • Модуль
Теги: python excel openpyxl
Стиль ячейки
Введение
Стиль ячейки openpyxl определяется 6 атрибутами, каждый из которых является классом. Как показано ниже (приблизительно):
- font (тип шрифта): размер шрифта, цвет шрифта, подчеркивание и т. д.
- fill (класс заливки): цвет и т. д.
- border (класс границы): установите границу ячейки
- выравнивание (класс позиции): выравнивание
- number_format (класс формата): формат данных
- защита (защита): защита от записи
-
Стиль ячейки по умолчанию выглядит следующим образом:
>>> from openpyxl.styles import PatternFill, Border, Side, Alignment, Protection, Font >>> font = Font(name='Calibri', ... size=11, ... bold=False, ... italic=False, ... vertAlign=None, ... underline='none', ... strike=False, ... color='FF000000') >>> fill = PatternFill(fill_type=None, ... start_color='FFFFFFFF', ... end_color='FF000000') >>> border = Border(left=Side(border_style=None, ... color='FF000000'), ... right=Side(border_style=None, ... color='FF000000'), ... top=Side(border_style=None, ... color='FF000000'), ... bottom=Side(border_style=None, ... color='FF000000'), ... diagonal=Side(border_style=None, ... color='FF000000'), ... diagonal_direction=0, ... outline=Side(border_style=None, ... color='FF000000'), ... vertical=Side(border_style=None, ... color='FF000000'), ... horizontal=Side(border_style=None, ... color='FF000000') ... ) >>> alignment=Alignment(horizontal='general', ... vertical='bottom', ... text_rotation=0, ... wrap_text=False, ... shrink_to_fit=False, ... indent=0) >>> number_format = 'General' >>> protection = Protection(locked=True, ... hidden=False)- 1
- 2
- 3
- 4
- 5
- 6
- 7
- 8
- 9
- 10
- 11
- 12
- 13
- 14
- 15
- 16
- 17
- 18
- 19
- 20
- 21
- 22
- 23
- 24
- 25
- 26
- 27
- 28
- 29
- 30
- 31
- 32
- 33
- 34
- 35
- 36
- 37
- 38
- 39
После создания экземпляра вышеуказанных стилей (шрифт, заливка, граница, положение и защита) свойства экземпляра не могут быть изменены, и экземпляр можно только воссоздать.
>>> from openpyxl.styles import colors >>> from openpyxl.styles import Font, Color >>> from openpyxl.styles import colors >>> from openpyxl import Workbook >>> wb = Workbook() >>> ws = wb.active >>> >>> a1 = ws['A1'] >>> d4 = ws['D4'] >>> ft = Font(color=colors.RED) >>> a1.font = ft >>> d4.font = ft >>> >>> a1.font.italic = True # Не вступит в силу, после создания экземпляра стиля свойства экземпляра изменить нельзя. >>> >>> # Если вы хотите изменить стиль, вы должны создать новый экземпляр стиля >>> >>> a1.font = Font(color=colors.RED, italic=True) # Создаем экземпляр шрифта (красный, курсив, другие атрибуты по умолчанию) -
Копировать стиль
Стиль можно скопировать:
>>> from openpyxl.styles import Font
>>>
>>> ft1 = Font(name='Arial', size=14)
>>> ft2 = ft1.copy(name="Tahoma") # Укажите шрифт как "Tahoma" при копировании, а остальные атрибуты копируются из ft1
>>> ft1.name
'Arial'
>>> ft2.name
'Tahoma'
>>> ft2.size
14.0
Основной цвет шрифта
Цвет шрифта имеет некоторые цветовые константы, которые можно вызывать напрямую:
from openpyxl.styles import Font from openpyxl.styles.colors import RED font = Font(color=RED) font = Font(color="00FFBB00")- 1
- 2
- 3
- 4
Вы также можете создать экземпляр по индексу:
from openpyxl.styles.colors import Color c = Color(indexed=32) c = Color(theme=6, tint=0.5)- 1
- 2
- 3
Говоря о цветах, версия V2.3.5 должна использовать формат «00XXXXXX», а не формат «#XXXXXX». Если цвет не действует, проверьте версию и измените ее.
Применить стиль
Может применяться непосредственно к ячейке:
from openpyxl.workbook import Workbook from openpyxl.styles import Font, Fill wb = Workbook() ws = wb.active c = ws['A1'] c.font = Font(size=12)- 1
- 2
- 3
- 4
- 5
- 6
Вы можете установить стили для целых строк и столбцов, при условии, что ячейка создана.
col = ws.column_dimensions['A']
col.font = Font(bold=True)
row = ws.row_dimensions[1]
row.font = Font(underline="single")
Формат данных
Значение атрибута формата данных number_format является строковым типом, а не объектом, просто назначьте его напрямую. Чтобы
openpyxl имеет встроенное представление формата данныхopenpyxl.styles.numbers, Также поддерживает пользовательский формат Excel, следующие два метода имеют одинаковый эффект:# Использовать встроенный формат openpyxl from openpyxl.styles import numbers ws.cell['D2'].number_format = numbers.FORMAT_GENERAL ws.cell(row=2, column=4).number_format = numbers.FORMAT_DATE_XLSX15- 1
- 2
- 3
- 4
# Использовать строку напрямую ws.cell['D2].number_format = 'General' ws.cell(row=2, column=4).number_format = 'd-mmm-yy'- 1
- 2
- 3
Изменить настройки страницы
from openpyxl.workbook import Workbook wb = Workbook() ws = wb.active ws.page_setup.orientation = ws.ORIENTATION_LANDSCAPE ws.page_setup.paperSize = ws.PAPERSIZE_TABLOID ws.page_setup.fitToHeight = 0 ws.page_setup.fitToWidth = 1- 1
- 2
- 3
- 4
- 5
- 6
- 7
- 8
- 9
Изменить параметры печати
from openpyxl.workbook import Workbook

wb = Workbook()
ws = wb.active

ws.print_options.horizontalCentered = True
ws.print_options.verticalCentered = True


Интеллектуальная рекомендация
Помимо восстановления Oracle длинного поля
Система обслуживания клиентов из-за неправильной работы удалила данные и сразу же rman восстановила данные в тестовой среде, а затем постепенно восстановила данные в производственной среде в соответст…

python — распознавать текст в картинках
Эта статья в основном относится кОбработка изображений Python для идентификации текста в изображенияхЭта статья, есть некоторые отклонения в процессе реализации, настоящим записью. Поскольку я не уста…
722.Remove Comments
Given a C++ program, remove comments from it. The program source is an array where source[i] is the i-th line of the source code. This represents the result of splitting the original source code strin…
Вам также может понравиться

Создайте ресурсы изображения из слоя (группа)
В файле PSD, если вы измените имя группы или группы слоя, вы можете автоматически генерировать ресурсы изображения в форматах JPEG, PNG или GIF и указать качество и размер. Включить метод Меню: Ресурс…

Искать имя файла файла под Linux
1. Поиск команды файла. Команда 1, когда используется для поиска абсолютного пути исполняемого файла. Команда 2-х годов, найдите файл, связанный с именем файла, формат, где [-BMS] [имя файла]. Имя]. П…
Принцип динамического прокси-JDK Proxy
В прошлый раз, когда мы объясняли реализацию динамического прокси cglib, сегодня мы рассмотрим принцип реализации прокси JDK. Отображение текущей метки времени до и после выполнения метода класса Subj…
Мин Чэнь: сегодняшняя информация
25 марта: ночная важная новость 1. Режим продаж Smirect Playpad Pointpad Proop — это шаблон лотереи лотереи. BNB увеличился на 13% за последние 24 часа. 2. Бывший министр финансов США Джейкоб Л заявил…
You all must have worked with Excel at some time in your life and must have felt the need for automating some repetitive or tedious task. Don’t worry in this tutorial we are going to learn about how to work with Excel using Python, or automating Excel using Python. We will be covering this with the help of the Openpyxl module.
Getting Started
Openpyxl is a Python library that provides various methods to interact with Excel Files using Python. It allows operations like reading, writing, arithmetic operations, plotting graphs, etc.
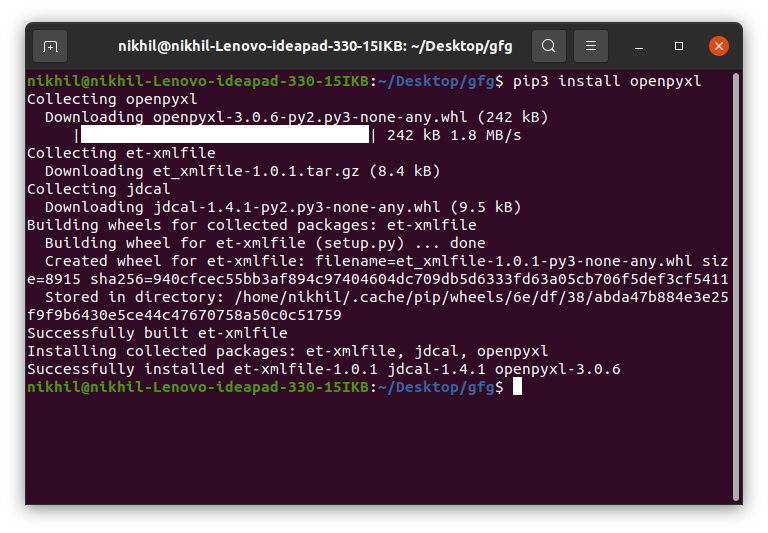
This module does not come in-built with Python. To install this type the below command in the terminal.
pip install openpyxl
Reading from Spreadsheets
To read an Excel file you have to open the spreadsheet using the load_workbook() method. After that, you can use the active to select the first sheet available and the cell attribute to select the cell by passing the row and column parameter. The value attribute prints the value of the particular cell. See the below example to get a better understanding.
Note: The first row or column integer is 1, not 0.
Dataset Used: It can be downloaded from here.
Example:
Python3
import openpyxl
path = "gfg.xlsx"
wb_obj = openpyxl.load_workbook(path)
sheet_obj = wb_obj.active
cell_obj = sheet_obj.cell(row = 1, column = 1)
print(cell_obj.value)
Output:
Name
Reading from Multiple Cells
There can be two ways of reading from multiple cells.
Method 1: We can get the count of the total rows and columns using the max_row and max_column respectively. We can use these values inside the for loop to get the value of the desired row or column or any cell depending upon the situation. Let’s see how to get the value of the first column and first row.
Example:
Python3
import openpyxl
path = "gfg.xlsx"
wb_obj = openpyxl.load_workbook(path)
sheet_obj = wb_obj.active
row = sheet_obj.max_row
column = sheet_obj.max_column
print("Total Rows:", row)
print("Total Columns:", column)
print("nValue of first column")
for i in range(1, row + 1):
cell_obj = sheet_obj.cell(row = i, column = 1)
print(cell_obj.value)
print("nValue of first row")
for i in range(1, column + 1):
cell_obj = sheet_obj.cell(row = 2, column = i)
print(cell_obj.value, end = " ")
Output:
Total Rows: 6
Total Columns: 4

Value of first column
Name
Ankit
Rahul
Priya
Nikhil
Nisha

Value of first row
Ankit  B.Tech CSE 4
Method 2: We can also read from multiple cells using the cell name. This can be seen as the list slicing of Python.
Python3
import openpyxl
path = "gfg.xlsx"
wb_obj = openpyxl.load_workbook(path)
sheet_obj = wb_obj.active
cell_obj = sheet_obj['A1': 'B6']
for cell1, cell2 in cell_obj:
print(cell1.value, cell2.value)
Output:
Name Course
Ankit  B.Tech
Rahul M.Tech
Priya MBA
Nikhil B.Tech
Nisha B.Tech
Refer to the below article to get detailed information about reading excel files using openpyxl.
- Reading an excel file using Python openpyxl module
Writing to Spreadsheets
First, let’s create a new spreadsheet, and then we will write some data to the newly created file. An empty spreadsheet can be created using the Workbook() method. Let’s see the below example.
Example:
Python3
from openpyxl import Workbook
workbook = Workbook()
workbook.save(filename="sample.xlsx")
Output:
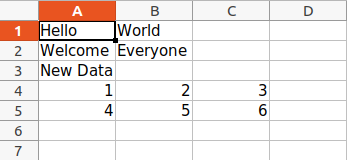
After creating an empty file, let’s see how to add some data to it using Python. To add data first we need to select the active sheet and then using the cell() method we can select any particular cell by passing the row and column number as its parameter. We can also write using cell names. See the below example for a better understanding.
Example:
Python3
import openpyxl
wb = openpyxl.Workbook()
sheet = wb.active
c1 = sheet.cell(row = 1, column = 1)
c1.value = "Hello"
c2 = sheet.cell(row= 1 , column = 2)
c2.value = "World"
c3 = sheet['A2']
c3.value = "Welcome"
c4 = sheet['B2']
c4.value = "Everyone"
wb.save("sample.xlsx")
Output:
Refer to the below article to get detailed information about writing to excel.
- Writing to an excel file using openpyxl module
Appending to the Spreadsheet
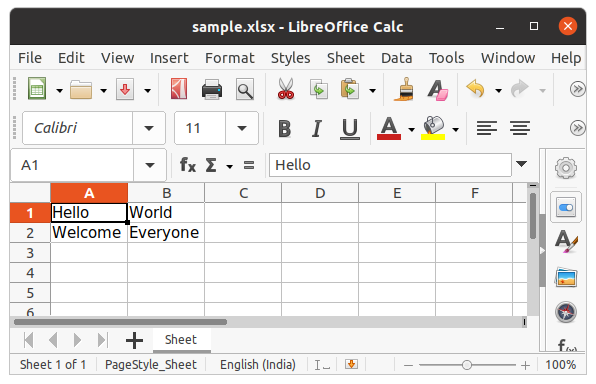
In the above example, you will see that every time you try to write to a spreadsheet the existing data gets overwritten, and the file is saved as a new file. This happens because the Workbook() method always creates a new workbook file object. To write to an existing workbook you must open the file with the load_workbook() method. We will use the above-created workbook.
Example:
Python3
import openpyxl
wb = openpyxl.load_workbook("sample.xlsx")
sheet = wb.active
c = sheet['A3']
c.value = "New Data"
wb.save("sample.xlsx")
Output:
We can also use the append() method to append multiple data at the end of the sheet.
Example:
Python3
import openpyxl
wb = openpyxl.load_workbook("sample.xlsx")
sheet = wb.active
data = (
(1, 2, 3),
(4, 5, 6)
)
for row in data:
sheet.append(row)
wb.save('sample.xlsx')
Output:
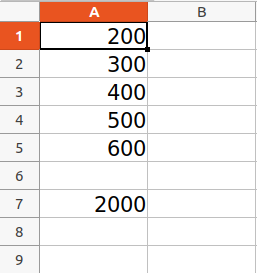
Arithmetic Operation on Spreadsheet
Arithmetic operations can be performed by typing the formula in a particular cell of the spreadsheet. For example, if we want to find the sum then =Sum() formula of the excel file is used.
Example:
Python3
import openpyxl
wb = openpyxl.Workbook()
sheet = wb.active
sheet['A1'] = 200
sheet['A2'] = 300
sheet['A3'] = 400
sheet['A4'] = 500
sheet['A5'] = 600
sheet['A7'] = '= SUM(A1:A5)'
wb.save("sum.xlsx")
Output:
Refer to the below article to get detailed information about the Arithmetic operations on Spreadsheet.
- Arithmetic operations in excel file using openpyxl
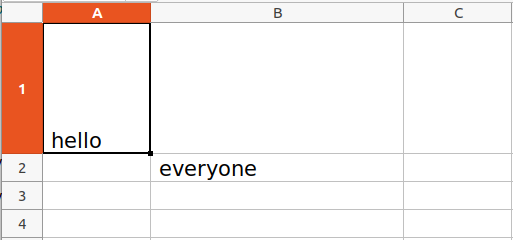
Adjusting Rows and Column
Worksheet objects have row_dimensions and column_dimensions attributes that control row heights and column widths. A sheet’s row_dimensions and column_dimensions are dictionary-like values; row_dimensions contains RowDimension objects and column_dimensions contains ColumnDimension objects. In row_dimensions, one can access one of the objects using the number of the row (in this case, 1 or 2). In column_dimensions, one can access one of the objects using the letter of the column (in this case, A or B).
Example:
Python3
import openpyxl
wb = openpyxl.Workbook()
sheet = wb.active
sheet.cell(row = 1, column = 1).value = ' hello '
sheet.cell(row = 2, column = 2).value = ' everyone '
sheet.row_dimensions[1].height = 70
sheet.column_dimensions['B'].width = 20
wb.save('sample.xlsx')
Output:
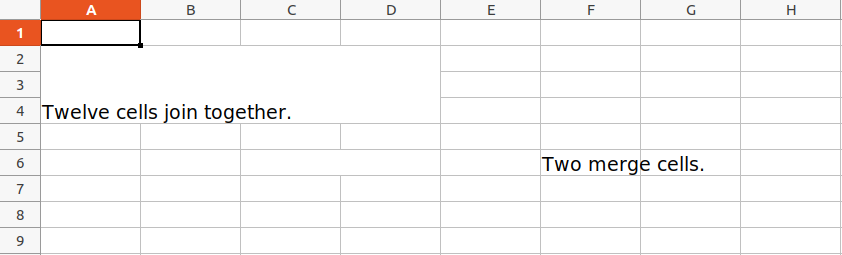
Merging Cells
A rectangular area of cells can be merged into a single cell with the merge_cells() sheet method. The argument to merge_cells() is a single string of the top-left and bottom-right cells of the rectangular area to be merged.
Example:
Python3
import openpyxl
wb = openpyxl.Workbook()
sheet = wb.active
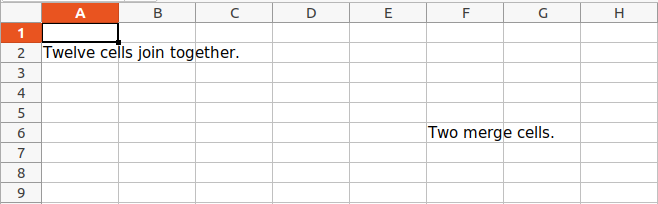
sheet.merge_cells('A2:D4')
sheet.cell(row = 2, column = 1).value = 'Twelve cells join together.'
sheet.merge_cells('C6:D6')
sheet.cell(row = 6, column = 6).value = 'Two merge cells.'
wb.save('sample.xlsx')
Output:
Unmerging Cells
To unmerge cells, call the unmerge_cells() sheet method.
Example:
Python3
import openpyxl
wb = openpyxl.load_workbook('sample.xlsx')
sheet = wb.active
sheet.unmerge_cells('A2:D4')
sheet.unmerge_cells('C6:D6')
wb.save('sample.xlsx')
Output:
Setting Font Style
To customize font styles in cells, important, import the Font() function from the openpyxl.styles module.
Example:
Python3
import openpyxl
from openpyxl.styles import Font
wb = openpyxl.Workbook()
sheet = wb.active
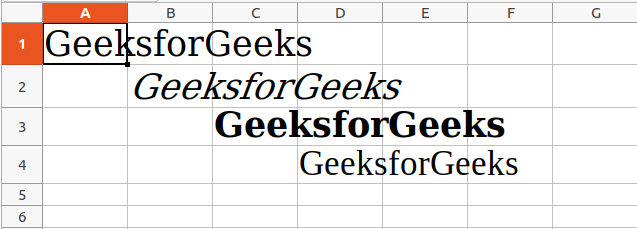
sheet.cell(row = 1, column = 1).value = "GeeksforGeeks"
sheet.cell(row = 1, column = 1).font = Font(size = 24 )
sheet.cell(row = 2, column = 2).value = "GeeksforGeeks"
sheet.cell(row = 2, column = 2).font = Font(size = 24, italic = True)
sheet.cell(row = 3, column = 3).value = "GeeksforGeeks"
sheet.cell(row = 3, column = 3).font = Font(size = 24, bold = True)
sheet.cell(row = 4, column = 4).value = "GeeksforGeeks"
sheet.cell(row = 4, column = 4).font = Font(size = 24, name = 'Times New Roman')
wb.save('sample.xlsx')
Output:
Refer to the below article to get detailed information about adjusting rows and columns.
- Adjusting rows and columns of an excel file using openpyxl module
Plotting Charts
Charts are composed of at least one series of one or more data points. Series themselves are comprised of references to cell ranges. For plotting the charts on an excel sheet, firstly, create chart objects of specific chart class( i.e BarChart, LineChart, etc.). After creating chart objects, insert data in it, and lastly, add that chart object in the sheet object.
Example 1:
Python3
import openpyxl
from openpyxl.chart import BarChart, Reference
wb = openpyxl.Workbook()
sheet = wb.active
for i in range(10):
sheet.append([i])
values = Reference(sheet, min_col=1, min_row=1,
max_col=1, max_row=10)
chart = BarChart()
chart.add_data(values)
chart.title = " BAR-CHART "
chart.x_axis.title = " X_AXIS "
chart.y_axis.title = " Y_AXIS "
sheet.add_chart(chart, "E2")
wb.save("sample.xlsx")
Output:

Example 2:
Python3
import openpyxl
from openpyxl.chart import LineChart, Reference
wb = openpyxl.Workbook()
sheet = wb.active
for i in range(10):
sheet.append([i])
values = Reference(sheet, min_col=1, min_row=1,
max_col=1, max_row=10)
chart = LineChart()
chart.add_data(values)
chart.title = " LINE-CHART "
chart.x_axis.title = " X-AXIS "
chart.y_axis.title = " Y-AXIS "
sheet.add_chart(chart, "E2")
wb.save("sample.xlsx")
Output:

Refer to the below articles to get detailed information about plotting in excel using Python.
- Plotting charts in excel sheet using openpyxl module | Set 1
- Plotting charts in excel sheet using openpyxl module | Set 2
- Plotting charts in excel sheet using openpyxl module | Set 3
Adding Images
For the purpose of importing images inside our worksheet, we would be using openpyxl.drawing.image.Image. The method is a wrapper over PIL.Image method found in PIL (pillow) library. Due to which it is necessary for the PIL (pillow) library to be installed in order to use this method.
Image Used:

Example:
Python3
import openpyxl
from openpyxl.drawing.image import Image
wb = openpyxl.Workbook()
sheet = wb.active
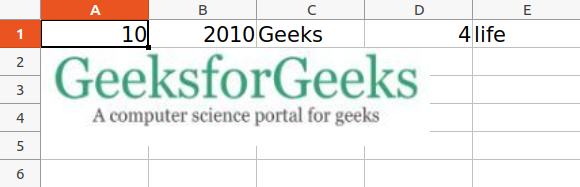
sheet.append([10, 2010, "Geeks", 4, "life"])
img = Image("geek.jpg")
sheet.add_image(img, 'A2')
wb.save('sample.xlsx')
Output:
Refer to the below article to get detailed information about adding images.
- Openpyxl – Adding Image
Some More Functionality of Excel using Python
- How to delete one or more rows in excel using Openpyxl?
- Trigonometric operations in excel file using openpyxl
- How to copy data from one excel sheet to another
- How to Automate an Excel Sheet in Python?