
Основные атрибуты и методы объекта ячейки Cell.
Объект ячейки Cell управляет отдельными ячейками электронной таблицы, а также описывает ее свойства. Класс Cell() должен знать свое значение и тип, параметры отображения и любые другие функции ячейки Excel.
Не создавайте объекты ячейки самостоятельно. Доступ к произвольной ячейке можно получить, обратившись к объекту рабочего листа Worksheet как к словарю, при этом ключом будет служить строка с именем ячейки, например ws['A1']. Это вернет ячейку на 'A4' или создаст ее, если она еще не существует. Значения могут быть присвоены напрямую:
>>> from openpyxl import Workbook
>>> wb = Workbook()
>>> ws = wb.active
>>> ws['A4'] = 5
>>> ws['A4'].value
# 5

# присваивание значений
>>> ws['A4'].value = ws['A4'].value * 2
>>> ws['A4'].value
# 10
Для доступа к ячейке с использованием индексов столбцов и строк, можно использовать метод Worksheet.cell().
Пример работы с объектом ячейки через переменную:
# доступ к объекту ячейки
>>> cell = ws.cell(row=4, column=2)
# доступ с присваиваем значения ячейки
>>> cell = ws.cell(row=4, column=2, value=10)
>>> cell.value
# 10

# присваивание значений
>>> cell.value *= 2
>>> cell.value
# 20
Содержание:
Cell.base_dateбазовый класс обработки даты,Cell.check_error()проверяет правильность кодировка строки,Cell.col_idxчисловой индекс столбца,Cell.columnномер столбца этой ячейки,Cell.column_letterвозвращает букву столбца ячейки,Cell.commentвозвращает/назначает объект комментария,Cell.coordinateвозвращает координаты этой ячейки,Cell.encodingвозвращает кодировку этой ячейки,Cell.hyperlinkустанавливает гиперссылку,Cell.is_dateпроверяет значение ячейки на дату,Cell.offset()смещенный объект ячейки,Cell.parentобъект рабочего листа,Cell.rowномер строки этой ячейки,Cell.valueвозвращает/устанавливает значение в ячейку,Cell.alignmentвыравнивает значения в ячейке,Cell.fontстиль шрифта ячейки,Cell.borderстиль оформления границ ячейки,Cell.fillцвет заливки ячейки.
Cell.base_date:
Свойство Cell.base_date содержит базовый класс обработки даты. По умолчанию это datetime.
Cell.check_string(value):
Метод Cell.check_string() проверяет правильность кодировка строки, а также ее допустимой длины и символ разрыва строки.
Cell.col_idx:
Атрибут Cell.col_idx возвращает числовой индекс столбца. Нумерация столбцов в модуле openpyxl начинается с 1, а не с 0 как в списке.
Cell.column:
Атрибут Cell.column возвращает номер столбца этой ячейки. Нумерация столбцов в модуле openpyxl начинается с 1, а не с 0 как в списке.
Cell.column_letter:
Атрибут Cell.column_letter возвращает букву столбца ячейки.
>>> ws['C4'].column_letter
# 'C'
Cell.comment:
Атрибут Cell.comment возвращает/назначает объект комментария Comment, связанный с этой ячейкой. Объект комментария содержит текстовый атрибут и атрибут автора, которые должны быть установлены.
Если назначить один и тот же комментарий нескольким ячейкам, то openpyxl автоматически создаст копии.
>>> from openpyxl import Workbook
>>> from openpyxl.comments import Comment
>>> wb=Workbook()
>>> ws=wb.active
>>> comment = Comment("Text", "Author")
>>> ws["A1"].comment = comment
>>> ws["A1"].comment.text
# 'Text'
>>> ws["A1"].comment.author
# 'Author'

# присвоим этот же комментарий другой ячейке
>>> ws["B2"].comment = comment
>>> ws["A1"].comment is comment
# True
>>> ws["B2"].comment is comment
# False
Cell.coordinate:
Атрибут Cell.coordinate возвращает координаты этой ячейки.
>>> ws['C4'].coordinate
# 'C4'
Cell.encoding:
Атрибут Cell.encoding возвращает кодировку этой ячейки.
>>> ws['C4'].encoding
# 'utf-8'
Cell.hyperlink:
Свойство Cell.hyperlink устанавливает целевую гиперссылку.
ws['A1'].hyperlink = 'https://docs-python.ru/'
ws['A1'].value = 'Справочник Python'
ws['A1'].style = 'Hyperlink'
Некоторые говорят что код, представленный выше — не работает. В таком случае установить ссылку в ячейку можно используя встроенную в Excel функцию ‘=HYPERLINK(link, linkName)`, например:
>>> link = 'https://docs-python.ru/'
>>> link_name = 'Справочник Python'
>>> ws.cell(row=2, column=1).value = f'=HYPERLINK("{link}", "{link_name}")'
Cell.is_date:
Свойство Cell.is_date возвращает True, если значение отформатировано как дата.
>>> ws['C4'].value = 10
>>> ws['C4'].is_date
# False

>>> import datetime
>>> now = datetime.datetime.now()
>>> ws['C4'].value = now
>>> ws['C4'].is_date
# True
Cell.offset(row=0, column=0):
Метод Cell.offset() возвращает объект ячейки, смещенный на кол-во строк row и столбцов column относительно этой ячейки.
Аргументы:
row— количество смещения строк.column— количество смещения столбцов.
>>> ws['C4'].offset(row=1, column=0)
# <Cell 'Sheet'.C5>
Cell.parent:
Свойство Cell.parent возвращает объект рабочего листа, на котором расположена эта ячейка.
>>> ws['C4'].parent
# <Worksheet "Sheet">
Cell.row:
Свойство Cell.row возвращает номер строки этой ячейки. Нумерация строк в модуле openpyxl начинается с 1, а не с 0 как в списке.
Cell.value:
Свойство Cell.value возвращает или устанавливает значение, хранящееся в ячейке.
Ячейка может хранить следующие значения: str, float, int или datetime.datetime.
>>> ws['C4'].value = 100500
>>> ws['C4'].value
# 100500
Cell.alignment:
Свойство Cell.alignment отвечает за выравнивание значения в ячейке. Значение должно быть объектом Alignment().
>>> from openpyxl import Workbook
>>> from openpyxl.styles import Alignment
>>> wb = Workbook()
>>> ws = wb.active
>>> ws['A1'].value = 1500
>>> ws['A2'].value = 1500
>>> ws['A3'].value = 1500
# выравниваем текст в ячейках стилями
>>> ws['A1'].alignment = Alignment(horizontal='left')
>>> ws['A2'].alignment = Alignment(horizontal='center')
>>> ws['A3'].alignment = Alignment(horizontal='right')
# сохраняем и смотрим что получилось
>>> wb.save('test.xlsx')
Cell.font:
Свойство Cell.font задает стиль шрифта в ячейке (имя, высота, цвет и т.д.). Значение должно быть объектом Font().
>>> from openpyxl import Workbook
>>> from openpyxl.styles import Font
>>> wb = Workbook()
>>> ws = wb.active
>>> a1 = ws['A1']
>>> a1.value = 'Ячейка `A1`'
>>> a1.font = Font(size=12)
# можно напрямую
>>> ws['A2'].value = 'Ячейка `A2`'
>>> ws['A2'].font = Font(name= 'Arial', size=12, bold=True, color='00FF00')
# сохраняем и смотрим что получилось
>>> wb.save('test.xlsx')
Cell.border:
Свойство Cell.border задает стиль оформления границ ячейки. Значение должно быть объектом Border().
Пример стилизации границ одной ячейки:
>>> from openpyxl import Workbook
>>> from openpyxl.styles import Border, Side
>>> wb = Workbook()
>>> ws = wb.active
>>> cell = ws['B2']
# установить высоту строки
>>> ws.row_dimensions[2].height = 30
# установить ширину столбца
>>> ws.column_dimensions['B'].width = 40
# определим стили сторон
>>> thins = Side(border_style="medium", color="0000ff")
>>> double = Side(border_style="dashDot", color="ff0000")
# рисуем границы
>>> cell.border = Border(top=double, bottom=double, left=thins, right=thins)
>>> wb.save("test.xlsx")
Cell.fill:
Свойство Cell.fill задает цвет заливки ячейки. Значение должно быть объектом PatternFill().
>>> from openpyxl import Workbook
>>> from openpyxl.styles import PatternFill
>>> wb = Workbook()
>>> ws = wb.active
>>> a1 = ws['A1']
>>> a1.value = 'Ячейка `A1`'
>>> a1.fill = PatternFill('solid', fgColor="ff0000")
>>> wb.save("test.xlsx")
Faced the same problem. Needed to read cell values whatever those cells are: scalars, formulae with precomputed values or formulae without them, with fail-tolerance preferred over correctness.
The strategy is pretty straightforward:
- if a cell doesn’t contain formula, return cell’s value;
- if it’s a formula, try to get its precomputed value;
- if couldn’t, try to evaluate it using
pycel; - if failed (due to
pycel‘s limited support of formulae or with some error), warn and return None.
I made a class which hides all this machinery and provides simple interface for reading cell values.
It’s easy to modify the class so that it will raise an exception on step 4, if correctness is preferred over fail-tolerance.
Hope it will help someone.
from traceback import format_exc
from pathlib import Path
from openpyxl import load_workbook
from pycel.excelcompiler import ExcelCompiler
import logging


class MESSAGES:
    CANT_EVALUATE_CELL = ("Couldn't evaluate cell {address}."
                          " Try to load and save xlsx file.")


class XLSXReader:
    """
    Provides (almost) universal interface to read xlsx file cell values.

    For formulae, tries to get their precomputed values or, if none,
    to evaluate them.
    """

    # Interface.

    def __init__(self, path: Path):
        self.__path = path
        self.__book = load_workbook(self.__path, data_only=False)

    def get_cell_value(self, address: str, sheet: str = None):
        # If no sheet given, work with active one.
        if sheet is None:
            sheet = self.__book.active.title

        # If cell doesn't contain a formula, return cell value.
        if not self.__cell_contains_formula(address, sheet):
            return self.__get_as_is(address, sheet)

        # If cell contains formula:
        # If there's precomputed value of the cell, return it.
        precomputed_value = self.__get_precomputed(address, sheet)
        if precomputed_value is not None:
            return precomputed_value

        # If not, try to compute its value from the formula and return it.
        # If failed, report an error and return empty value.
        try:
            computed_value = self.__compute(address, sheet)
        except:
            logging.warning(MESSAGES.CANT_EVALUATE_CELL
                            .format(address=address))
            logging.debug(format_exc())
            return None
        return computed_value

    # Private part.

    def __cell_contains_formula(self, address, sheet):
        cell = self.__book[sheet][address]
        return cell.data_type is cell.TYPE_FORMULA

    def __get_as_is(self, address, sheet):
        # Return cell value.
        return self.__book[sheet][address].value

    def __get_precomputed(self, address, sheet):
        # If the sheet is not loaded yet, load it.
        if not hasattr(self, '__book_with_precomputed_values'):
            self.__book_with_precomputed_values = load_workbook(
                self.__path, data_only=True)
        # Return precomputed value.
        return self.__book_with_precomputed_values[sheet][address].value

    def __compute(self, address, sheet):
        # If the computation engine is not created yet, create it.
        if not hasattr(self, '__formulae_calculator'):
            self.__formulae_calculator = ExcelCompiler(self.__path)
        # Compute cell value.
        computation_graph = self.__formulae_calculator.gen_graph(
            address, sheet=sheet)
        return computation_graph.evaluate(f"{sheet}!{address}")
Manage individual cells in a spreadsheet.
The Cell class is required to know its value and type, display options,
and any other features of an Excel cell. Utilities for referencing
cells using Excel’s ‘A1’ column/row nomenclature are also provided.
-
class
openpyxl.cell.cell.Cell(worksheet, row=None, column=None, value=None, style_array=None)[source]¶ -
Bases:
openpyxl.styles.styleable.StyleableObjectDescribes cell associated properties.
Properties of interest include style, type, value, and address.
-
base_date
-
check_error(value)[source]¶ -
Tries to convert Error” else N/A
-
check_string(value)[source]¶ -
Check string coding, length, and line break character
-
col_idx¶ -
The numerical index of the column
-
column¶ -
Column number of this cell (1-based)
-
column_letter
-
Returns the comment associated with this cell
Type: openpyxl.comments.Comment
-
coordinate¶ -
This cell’s coordinate (ex. ‘A5’)
-
data_type
-
encoding
-
hyperlink¶ -
Return the hyperlink target or an empty string
-
internal_value¶ -
Always returns the value for excel.
-
is_date¶ -
True if the value is formatted as a date
Type: bool
-
offset(row=0, column=0)[source]¶ -
Returns a cell location relative to this cell.
Parameters: - row (int) – number of rows to offset
- column (int) – number of columns to offset
Return type: openpyxl.cell.Cell
-
parent
-
row¶ -
Row number of this cell (1-based)
-
value¶ -
Get or set the value held in the cell.
Type: depends on the value (string, float, int or
datetime.datetime)
-
-
class
openpyxl.cell.cell.MergedCell(worksheet, row=None, column=None)[source]¶ -
Bases:
openpyxl.styles.styleable.StyleableObjectDescribes the properties of a cell in a merged cell and helps to
display the borders of the merged cell.The value of a MergedCell is always None.
-
column
-
coordinate¶ -
This cell’s coordinate (ex. ‘A5’)
-
data_type= ‘n’
-
hyperlink= None
-
row
-
value= None
-
-
openpyxl.cell.cell.WriteOnlyCell(ws=None, value=None)[source]
-
openpyxl.cell.cell.get_time_format(t)[source]
-
openpyxl.cell.cell.get_type(t, value)[source]
Introduction
In previous article, “Use openpyxl — create a new Worksheet, change sheet property in Python”, I introduced how to create a new Worksheet and change Worksheet properties.
In this article I show how to read and write Cell in Excel with Python.
Enter values to Cell
Worksheet object has a position of Cell as property. That is dictionary type and consists of row and column number.
Using them, access to Cell and edit the values. A sample code is as below.
 1from openpyxl import Workbook
 2from openpyxl.compat import range
 3from openpyxl.utils import get_column_letter
 4
 5wb = Workbook()
 6ws = wb.active
 7
 8# Enter `hogehogehoge` in column of `B` and row of `2`
 9ws['B2'] = 'hogehogehoge'
10# Enter `fugafugaufga` in column of `F` and row of `5`
11ws['F5'] = 'fugafugaufga'
12
13wb.save(filename = 'sample_book.xlsx')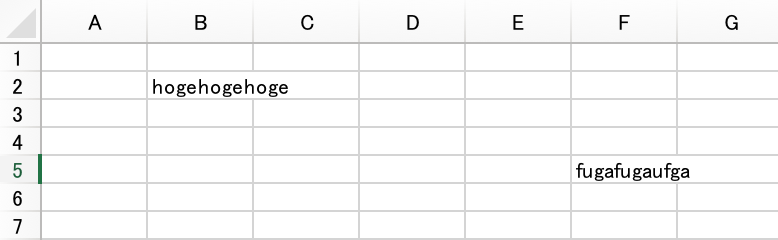
Or, using cell function can do the same. However, cell function must be given arguments column number and line number.
1ws.cell(row=2, column=2, value='hogehogehoge')
2ws.cell(row=5, column=6, value='fugafugaufga')
Read values in Cell
To read values in Cell, access to value property in Cell object.
Or, using cell function can do the same when reading.
1b2 = ws.cell(column=2, row=2).valueProcessing for each row
The iter_rows function can get instances for each row.
For specifying to range of extracting data, min_row, max_row, min_col and max_col options exist.
In addition, if max_row or max_col options are not given in arguments, it is the processing target up to the position where the data is entered.
Actually, it’s rarely to read datas from column A of the first row when handling files.
In the following example, processing in units of one line with the second line as the starting line.
1for row in ws.iter_rows(min_row=2):
2    for cell in row:
3        print(f"col {cell.col_idx}:{cell.value}")
4    print('------------------------------------------')
The output result is as follows.
 1col 1:None
 2col 2:hogehogehoge
 3col 3:None
 4col 4:None
 5col 5:None
 6col 6:None
 7------------------------------------------
 8col 1:None
 9col 2:None
10col 3:None
11col 4:None
12col 5:None
13col 6:None
14------------------------------------------
15col 1:None
16col 2:None
17col 3:None
18col 4:None
19col 5:None
20col 6:None
21------------------------------------------
22col 1:None
23col 2:None
24col 3:None
25col 4:None
26col 5:None
27col 6:fugafugaufga
28------------------------------------------
Processing for each column
The iter_cols function can get instances for each column.
Usage is similar to iter_rows function.
In the following example, processing in units of one column with the second column as the starting column.
1for col in ws.iter_cols(min_row=2):
2    for cell in col:
3        print(f"row {cell.row}:{cell.value}")
4    print('------------------------------------------')
The output result is as follows.
 1row 2:None
 2row 3:None
 3row 4:None
 4row 5:None
 5------------------------------------------
 6row 2:hogehogehoge
 7row 3:None
 8row 4:None
 9row 5:None
10------------------------------------------
11row 2:None
12row 3:None
13row 4:None
14row 5:None
15------------------------------------------
16row 2:None
17row 3:None
18row 4:None
19row 5:None
20------------------------------------------
21row 2:None
22row 3:None
23row 4:None
24row 5:None
25------------------------------------------
26row 2:None
27row 3:None
28row 4:None
29row 5:fugafugaufga
30------------------------------------------
Enter values for a row
The append function in Worksheet instance can enter data for one row.
By giving list type data as an argument, data goes into the sheet left-aligned.
 1wb = Workbook()
 2ws = wb.active
 3
 4data = [
 5        ['A', 100, 1.0],
 6        ['B', 200, 2.0],
 7        ['C', 300, 3.0],
 8        ['D', 400, 4.0],
 9]
10
11for row in data:
12    ws.append(row)
13
14wb.save(filename = 'sample_book.xlsx')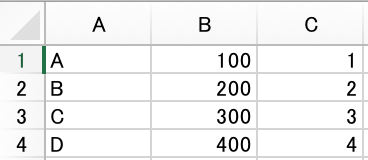
Conclusion
It is available to
- Enter or read values to
CellwithCellinstance property orcellfunction - Process data row by row or colum
- Enter a value for a row with
appendfunction
Время на прочтение
10 мин
Количество просмотров 290K
Первая часть статьи была опубликована тут.
Как читать и редактировать Excel файлы при помощи openpyxl
ПЕРЕВОД
Оригинал статьи — www.datacamp.com/community/tutorials/python-excel-tutorial
Автор — Karlijn Willems
Эта библиотека пригодится, если вы хотите читать и редактировать файлы .xlsx, xlsm, xltx и xltm.
Установите openpyxl using pip. Общие рекомендации по установке этой библиотеки — сделать это в виртуальной среде Python без системных библиотек. Вы можете использовать виртуальную среду для создания изолированных сред Python: она создает папку, содержащую все необходимые файлы, для использования библиотек, которые потребуются для Python.
Перейдите в директорию, в которой находится ваш проект, и повторно активируйте виртуальную среду venv. Затем перейдите к установке openpyxl с помощью pip, чтобы убедиться, что вы можете читать и записывать с ним файлы:
# Activate virtualenv
$ source activate venv

# Install `openpyxl` in `venv`
$ pip install openpyxl
Теперь, когда вы установили openpyxl, вы можете начать загрузку данных. Но что именно это за данные? Например, в книге с данными, которые вы пытаетесь получить на Python, есть следующие листы:
Функция load_workbook () принимает имя файла в качестве аргумента и возвращает объект рабочей книги, который представляет файл. Это можно проверить запуском type (wb). Не забудьте убедиться, что вы находитесь в правильной директории, где расположена электронная таблица. В противном случае вы получите сообщение об ошибке при импорте.
# Import `load_workbook` module from `openpyxl`
from openpyxl import load_workbook

# Load in the workbook
wb = load_workbook('./test.xlsx')

# Get sheet names
print(wb.get_sheet_names())
Помните, вы можете изменить рабочий каталог с помощью os.chdir (). Фрагмент кода выше возвращает имена листов книги, загруженной в Python. Вы можете использовать эту информацию для получения отдельных листов книги. Также вы можете проверить, какой лист активен в настоящий момент с помощью wb.active. В приведенном ниже коде, вы также можете использовать его для загрузки данных на другом листе книги:
# Get a sheet by name
sheet = wb.get_sheet_by_name('Sheet3')

# Print the sheet title
sheet.title

# Get currently active sheet
anotherSheet = wb.active

# Check `anotherSheet`
anotherSheet
На первый взгляд, с этими объектами Worksheet мало что можно сделать. Однако, можно извлекать значения из определенных ячеек на листе книги, используя квадратные скобки [], к которым нужно передавать точную ячейку, из которой вы хотите получить значение.
Обратите внимание, это похоже на выбор, получение и индексирование массивов NumPy и Pandas DataFrames, но это еще не все, что нужно сделать, чтобы получить значение. Нужно еще добавить значение атрибута:
# Retrieve the value of a certain cell
sheet['A1'].value

# Select element 'B2' of your sheet
c = sheet['B2']

# Retrieve the row number of your element
c.row

# Retrieve the column letter of your element
c.column

# Retrieve the coordinates of the cell
c.coordinate
Помимо value, есть и другие атрибуты, которые можно использовать для проверки ячейки, а именно row, column и coordinate:
Атрибут row вернет 2;
Добавление атрибута column к “С” даст вам «B»;
coordinate вернет «B2».
Вы также можете получить значения ячеек с помощью функции cell (). Передайте аргументы row и column, добавьте значения к этим аргументам, которые соответствуют значениям ячейки, которые вы хотите получить, и, конечно же, не забудьте добавить атрибут value:
# Retrieve cell value
sheet.cell(row=1, column=2).value

# Print out values in column 2
for i in range(1, 4):
     print(i, sheet.cell(row=i, column=2).value)
Обратите внимание: если вы не укажете значение атрибута value, вы получите <Cell Sheet3.B1>, который ничего не говорит о значении, которое содержится в этой конкретной ячейке.
Вы используете цикл с помощью функции range (), чтобы помочь вам вывести значения строк, которые имеют значения в столбце 2. Если эти конкретные ячейки пусты, вы получите None.
Более того, существуют специальные функции, которые вы можете вызвать, чтобы получить другие значения, например get_column_letter () и column_index_from_string.
В двух функциях уже более или менее указано, что вы можете получить, используя их. Но лучше всего сделать их явными: пока вы можете получить букву прежнего столбца, можно сделать обратное или получить индекс столбца, перебирая букву за буквой. Как это работает:
# Import relevant modules from `openpyxl.utils`
from openpyxl.utils import get_column_letter, column_index_from_string

# Return 'A'
get_column_letter(1)

# Return '1'
column_index_from_string('A')
Вы уже получили значения для строк, которые имеют значения в определенном столбце, но что нужно сделать, если нужно вывести строки файла, не сосредотачиваясь только на одном столбце?
Конечно, использовать другой цикл.
Например, вы хотите сосредоточиться на области, находящейся между «A1» и «C3», где первый указывает левый верхний угол, а второй — правый нижний угол области, на которой вы хотите сфокусироваться. Эта область будет так называемой cellObj, которую вы видите в первой строке кода ниже. Затем вы указываете, что для каждой ячейки, которая находится в этой области, вы хотите вывести координату и значение, которое содержится в этой ячейке. После окончания каждой строки вы хотите выводить сообщение-сигнал о том, что строка этой области cellObj была выведена.
# Print row per row
for cellObj in sheet['A1':'C3']:
      for cell in cellObj:
              print(cells.coordinate, cells.value)
      print('--- END ---')
Обратите внимание, что выбор области очень похож на выбор, получение и индексирование списка и элементы NumPy, где вы также используете квадратные скобки и двоеточие чтобы указать область, из которой вы хотите получить значения. Кроме того, вышеприведенный цикл также хорошо использует атрибуты ячейки!
Чтобы визуализировать описанное выше, возможно, вы захотите проверить результат, который вернет вам завершенный цикл:
('A1', u'M')
('B1', u'N')
('C1', u'O')
--- END ---
('A2', 10L)
('B2', 11L)
('C2', 12L)
--- END ---
('A3', 14L)
('B3', 15L)
('C3', 16L)
--- END ---
Наконец, есть некоторые атрибуты, которые вы можете использовать для проверки результата импорта, а именно max_row и max_column. Эти атрибуты, конечно, являются общими способами обеспечения правильной загрузки данных, но тем не менее в данном случае они могут и будут полезны.
# Retrieve the maximum amount of rows
sheet.max_row

# Retrieve the maximum amount of columns
sheet.max_column
Это все очень классно, но мы почти слышим, что вы сейчас думаете, что это ужасно трудный способ работать с файлами, особенно если нужно еще и управлять данными.
Должно быть что-то проще, не так ли? Всё так!
Openpyxl имеет поддержку Pandas DataFrames. И можно использовать функцию DataFrame () из пакета Pandas, чтобы поместить значения листа в DataFrame:
# Import `pandas`
import pandas as pd

# Convert Sheet to DataFrame
df = pd.DataFrame(sheet.values)
Если вы хотите указать заголовки и индексы, вам нужно добавить немного больше кода:
# Put the sheet values in `data`
data = sheet.values

# Indicate the columns in the sheet values
cols = next(data)[1:]

# Convert your data to a list
data = list(data)

# Read in the data at index 0 for the indices
idx = [r[0] for r in data]

# Slice the data at index 1
data = (islice(r, 1, None) for r in data)

# Make your DataFrame
df = pd.DataFrame(data, index=idx, columns=cols)
Затем вы можете начать управлять данными при помощи всех функций, которые есть в Pandas. Но помните, что вы находитесь в виртуальной среде, поэтому, если библиотека еще не подключена, вам нужно будет установить ее снова через pip.
Чтобы записать Pandas DataFrames обратно в файл Excel, можно использовать функцию dataframe_to_rows () из модуля utils:
# Import `dataframe_to_rows`
from openpyxl.utils.dataframe import dataframe_to_rows

# Initialize a workbook
wb = Workbook()

# Get the worksheet in the active workbook
ws = wb.active

# Append the rows of the DataFrame to your worksheet
for r in dataframe_to_rows(df, index=True, header=True):
    ws.append(r)
Но это определенно не все! Библиотека openpyxl предлагает вам высокую гибкость в отношении того, как вы записываете свои данные в файлы Excel, изменяете стили ячеек или используете режим только для записи. Это делает ее одной из тех библиотек, которую вам точно необходимо знать, если вы часто работаете с электронными таблицами.
И не забудьте деактивировать виртуальную среду, когда закончите работу с данными!
Теперь давайте рассмотрим некоторые другие библиотеки, которые вы можете использовать для получения данных в электронной таблице на Python.
Готовы узнать больше?
Чтение и форматирование Excel файлов xlrd
Эта библиотека идеальна, если вы хотите читать данные и форматировать данные в файлах с расширением .xls или .xlsx.
# Import `xlrd`
import xlrd

# Open a workbook
workbook = xlrd.open_workbook('example.xls')

# Loads only current sheets to memory
workbook = xlrd.open_workbook('example.xls', on_demand = True)
Если вы не хотите рассматривать всю книгу, можно использовать такие функции, как sheet_by_name () или sheet_by_index (), чтобы извлекать листы, которые необходимо использовать в анализе.
# Load a specific sheet by name
worksheet = workbook.sheet_by_name('Sheet1')

# Load a specific sheet by index
worksheet = workbook.sheet_by_index(0)

# Retrieve the value from cell at indices (0,0)
sheet.cell(0, 0).value
Наконец, можно получить значения по определенным координатам, обозначенным индексами.
О том, как xlwt и xlutils, соотносятся с xlrd расскажем дальше.
Запись данных в Excel файл при помощи xlrd
Если нужно создать электронные таблицы, в которых есть данные, кроме библиотеки XlsxWriter можно использовать библиотеки xlwt. Xlwt идеально подходит для записи и форматирования данных в файлы с расширением .xls.
Когда вы вручную хотите записать в файл, это будет выглядеть так:
# Import `xlwt`
import xlwt
# Initialize a workbook
book = xlwt.Workbook(encoding="utf-8")
# Add a sheet to the workbook
sheet1 = book.add_sheet("Python Sheet 1")
# Write to the sheet of the workbook
sheet1.write(0, 0, "This is the First Cell of the First Sheet")
# Save the workbook
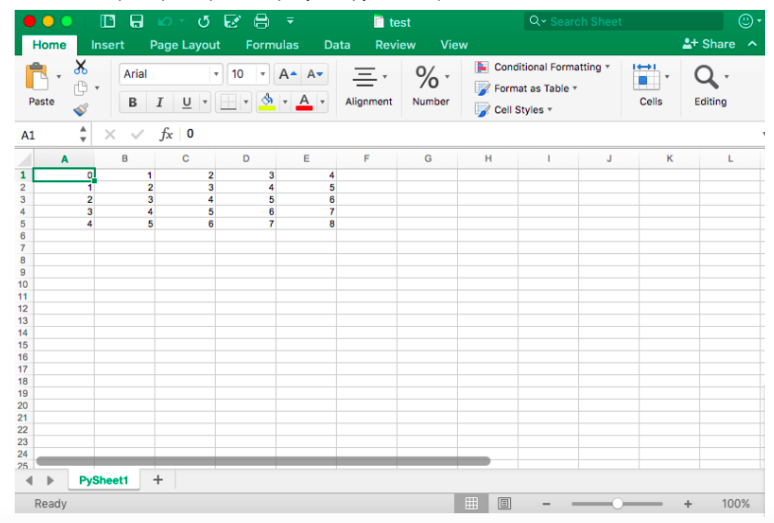
book.save("spreadsheet.xls")Если нужно записать данные в файл, то для минимизации ручного труда можно прибегнуть к циклу for. Это позволит немного автоматизировать процесс. Делаем скрипт, в котором создается книга, в которую добавляется лист. Далее указываем список со столбцами и со значениями, которые будут перенесены на рабочий лист.
Цикл for будет следить за тем, чтобы все значения попадали в файл: задаем, что с каждым элементом в диапазоне от 0 до 4 (5 не включено) мы собираемся производить действия. Будем заполнять значения строка за строкой. Для этого указываем row элемент, который будет “прыгать” в каждом цикле. А далее у нас следующий for цикл, который пройдется по столбцам листа. Задаем условие, что для каждой строки на листе смотрим на столбец и заполняем значение для каждого столбца в строке. Когда заполнили все столбцы строки значениями, переходим к следующей строке, пока не заполним все имеющиеся строки.
# Initialize a workbook
book = xlwt.Workbook()

# Add a sheet to the workbook
sheet1 = book.add_sheet("Sheet1")

# The data
cols = ["A", "B", "C", "D", "E"]
txt = [0,1,2,3,4]

# Loop over the rows and columns and fill in the values
for num in range(5):
      row = sheet1.row(num)
      for index, col in enumerate(cols):
          value = txt[index] + num
          row.write(index, value)

# Save the result
book.save("test.xls")
В качестве примера скриншот результирующего файла:
Теперь, когда вы видели, как xlrd и xlwt взаимодействуют вместе, пришло время посмотреть на библиотеку, которая тесно связана с этими двумя: xlutils.
Коллекция утилит xlutils
Эта библиотека в основном представляет собой набор утилит, для которых требуются как xlrd, так и xlwt. Включает в себя возможность копировать и изменять/фильтровать существующие файлы. Вообще говоря, оба этих случая подпадают теперь под openpyxl.
Использование pyexcel для чтения файлов .xls или .xlsx
Еще одна библиотека, которую можно использовать для чтения данных таблиц в Python — pyexcel. Это Python Wrapper, который предоставляет один API для чтения, обработки и записи данных в файлах .csv, .ods, .xls, .xlsx и .xlsm.
Чтобы получить данные в массиве, можно использовать функцию get_array (), которая содержится в пакете pyexcel:
# Import `pyexcel`
import pyexcel

# Get an array from the data
my_array = pyexcel.get_array(file_name="test.xls")

Также можно получить данные в упорядоченном словаре списков, используя функцию get_dict ():
# Import `OrderedDict` module
from pyexcel._compact import OrderedDict

# Get your data in an ordered dictionary of lists
my_dict = pyexcel.get_dict(file_name="test.xls", name_columns_by_row=0)

# Get your data in a dictionary of 2D arrays
book_dict = pyexcel.get_book_dict(file_name="test.xls")
Однако, если вы хотите вернуть в словарь двумерные массивы или, иными словами, получить все листы книги в одном словаре, стоит использовать функцию get_book_dict ().
Имейте в виду, что обе упомянутые структуры данных, массивы и словари вашей электронной таблицы, позволяют создавать DataFrames ваших данных с помощью pd.DataFrame (). Это упростит обработку ваших данных!
Наконец, вы можете просто получить записи с pyexcel благодаря функции get_records (). Просто передайте аргумент file_name функции и обратно получите список словарей:
# Retrieve the records of the file
records = pyexcel.get_records(file_name="test.xls")
Записи файлов при помощи pyexcel
Так же, как загрузить данные в массивы с помощью этого пакета, можно также легко экспортировать массивы обратно в электронную таблицу. Для этого используется функция save_as () с передачей массива и имени целевого файла в аргумент dest_file_name:
# Get the data
data = [[1, 2, 3], [4, 5, 6], [7, 8, 9]]

# Save the array to a file
pyexcel.save_as(array=data, dest_file_name="array_data.xls")
Обратите внимание: если указать разделитель, то можно добавить аргумент dest_delimiter и передать символ, который хотите использовать, в качестве разделителя между “”.
Однако, если у вас есть словарь, нужно будет использовать функцию save_book_as (). Передайте двумерный словарь в bookdict и укажите имя файла, и все ОК:
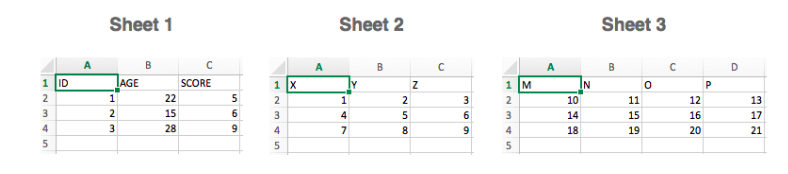
# The data
2d_array_dictionary = {'Sheet 1': [
                                   ['ID', 'AGE', 'SCORE']
                                   [1, 22, 5],
                                   [2, 15, 6],
                                   [3, 28, 9]
                                  ],
                       'Sheet 2': [
                                    ['X', 'Y', 'Z'],
                                    [1, 2, 3],
                                    [4, 5, 6]
                                    [7, 8, 9]
                                  ],
                       'Sheet 3': [
                                    ['M', 'N', 'O', 'P'],
                                    [10, 11, 12, 13],
                                    [14, 15, 16, 17]
                                    [18, 19, 20, 21]
                                   ]}

# Save the data to a file
pyexcel.save_book_as(bookdict=2d_array_dictionary, dest_file_name="2d_array_data.xls")
Помните, что когда используете код, который напечатан в фрагменте кода выше, порядок данных в словаре не будет сохранен!
Чтение и запись .csv файлов
Если вы все еще ищете библиотеки, которые позволяют загружать и записывать данные в CSV-файлы, кроме Pandas, рекомендуем библиотеку csv:
# import `csv`
import csv

# Read in csv file
for row in csv.reader(open('data.csv'), delimiter=','):
      print(row)

# Write csv file
data = [[1, 2, 3], [4, 5, 6], [7, 8, 9]]
outfile = open('data.csv', 'w')
writer = csv.writer(outfile, delimiter=';', quotechar='"')
writer.writerows(data)
outfile.close()
Обратите внимание, что NumPy имеет функцию genfromtxt (), которая позволяет загружать данные, содержащиеся в CSV-файлах в массивах, которые затем можно помещать в DataFrames.
Финальная проверка данных
Когда данные подготовлены, не забудьте последний шаг: проверьте правильность загрузки данных. Если вы поместили свои данные в DataFrame, вы можете легко и быстро проверить, был ли импорт успешным, выполнив следующие команды:
# Check the first entries of the DataFrame
df1.head()

# Check the last entries of the DataFrame
df1.tail()
Note: Используйте DataCamp Pandas Cheat Sheet, когда вы планируете загружать файлы в виде Pandas DataFrames.
Если данные в массиве, вы можете проверить его, используя следующие атрибуты массива: shape, ndim, dtype и т.д.:
# Inspect the shape
data.shape

# Inspect the number of dimensions
data.ndim

# Inspect the data type
data.dtype
Что дальше?
Поздравляем, теперь вы знаете, как читать файлы Excel в Python  Но импорт данных — это только начало рабочего процесса в области данных. Когда у вас есть данные из электронных таблиц в вашей среде, вы можете сосредоточиться на том, что действительно важно: на анализе данных.
Если вы хотите глубже погрузиться в тему — знакомьтесь с PyXll, которая позволяет записывать функции в Python и вызывать их в Excel.
Watch Now This tutorial has a related video course created by the Real Python team. Watch it together with the written tutorial to deepen your understanding: Editing Excel Spreadsheets in Python With openpyxl
Excel spreadsheets are one of those things you might have to deal with at some point. Either it’s because your boss loves them or because marketing needs them, you might have to learn how to work with spreadsheets, and that’s when knowing openpyxl comes in handy!
Spreadsheets are a very intuitive and user-friendly way to manipulate large datasets without any prior technical background. That’s why they’re still so commonly used today.
In this article, you’ll learn how to use openpyxl to:
- Manipulate Excel spreadsheets with confidence
- Extract information from spreadsheets
- Create simple or more complex spreadsheets, including adding styles, charts, and so on
This article is written for intermediate developers who have a pretty good knowledge of Python data structures, such as dicts and lists, but also feel comfortable around OOP and more intermediate level topics.
Before You Begin
If you ever get asked to extract some data from a database or log file into an Excel spreadsheet, or if you often have to convert an Excel spreadsheet into some more usable programmatic form, then this tutorial is perfect for you. Let’s jump into the openpyxl caravan!
Practical Use Cases
First things first, when would you need to use a package like openpyxl in a real-world scenario? You’ll see a few examples below, but really, there are hundreds of possible scenarios where this knowledge could come in handy.
Importing New Products Into a Database
You are responsible for tech in an online store company, and your boss doesn’t want to pay for a cool and expensive CMS system.
Every time they want to add new products to the online store, they come to you with an Excel spreadsheet with a few hundred rows and, for each of them, you have the product name, description, price, and so forth.
Now, to import the data, you’ll have to iterate over each spreadsheet row and add each product to the online store.
Exporting Database Data Into a Spreadsheet
Say you have a Database table where you record all your users’ information, including name, phone number, email address, and so forth.
Now, the Marketing team wants to contact all users to give them some discounted offer or promotion. However, they don’t have access to the Database, or they don’t know how to use SQL to extract that information easily.
What can you do to help? Well, you can make a quick script using openpyxl that iterates over every single User record and puts all the essential information into an Excel spreadsheet.
That’s gonna earn you an extra slice of cake at your company’s next birthday party!
Appending Information to an Existing Spreadsheet
You may also have to open a spreadsheet, read the information in it and, according to some business logic, append more data to it.
For example, using the online store scenario again, say you get an Excel spreadsheet with a list of users and you need to append to each row the total amount they’ve spent in your store.
This data is in the Database and, in order to do this, you have to read the spreadsheet, iterate through each row, fetch the total amount spent from the Database and then write back to the spreadsheet.
Not a problem for openpyxl!
Learning Some Basic Excel Terminology
Here’s a quick list of basic terms you’ll see when you’re working with Excel spreadsheets:
| Term | Explanation |
|---|---|
| Spreadsheet or Workbook | A Spreadsheet is the main file you are creating or working with. |
| Worksheet or Sheet | A Sheet is used to split different kinds of content within the same spreadsheet. A Spreadsheet can have one or more Sheets. |
| Column | A Column is a vertical line, and it’s represented by an uppercase letter: A. |
| Row | A Row is a horizontal line, and it’s represented by a number: 1. |
| Cell | A Cell is a combination of Column and Row, represented by both an uppercase letter and a number: A1. |
Getting Started With openpyxl
Now that you’re aware of the benefits of a tool like openpyxl, let’s get down to it and start by installing the package. For this tutorial, you should use Python 3.7 and openpyxl 2.6.2. To install the package, you can do the following:
After you install the package, you should be able to create a super simple spreadsheet with the following code:
from openpyxl import Workbook

workbook = Workbook()
sheet = workbook.active

sheet["A1"] = "hello"
sheet["B1"] = "world!"

workbook.save(filename="hello_world.xlsx")
The code above should create a file called hello_world.xlsx in the folder you are using to run the code. If you open that file with Excel you should see something like this:
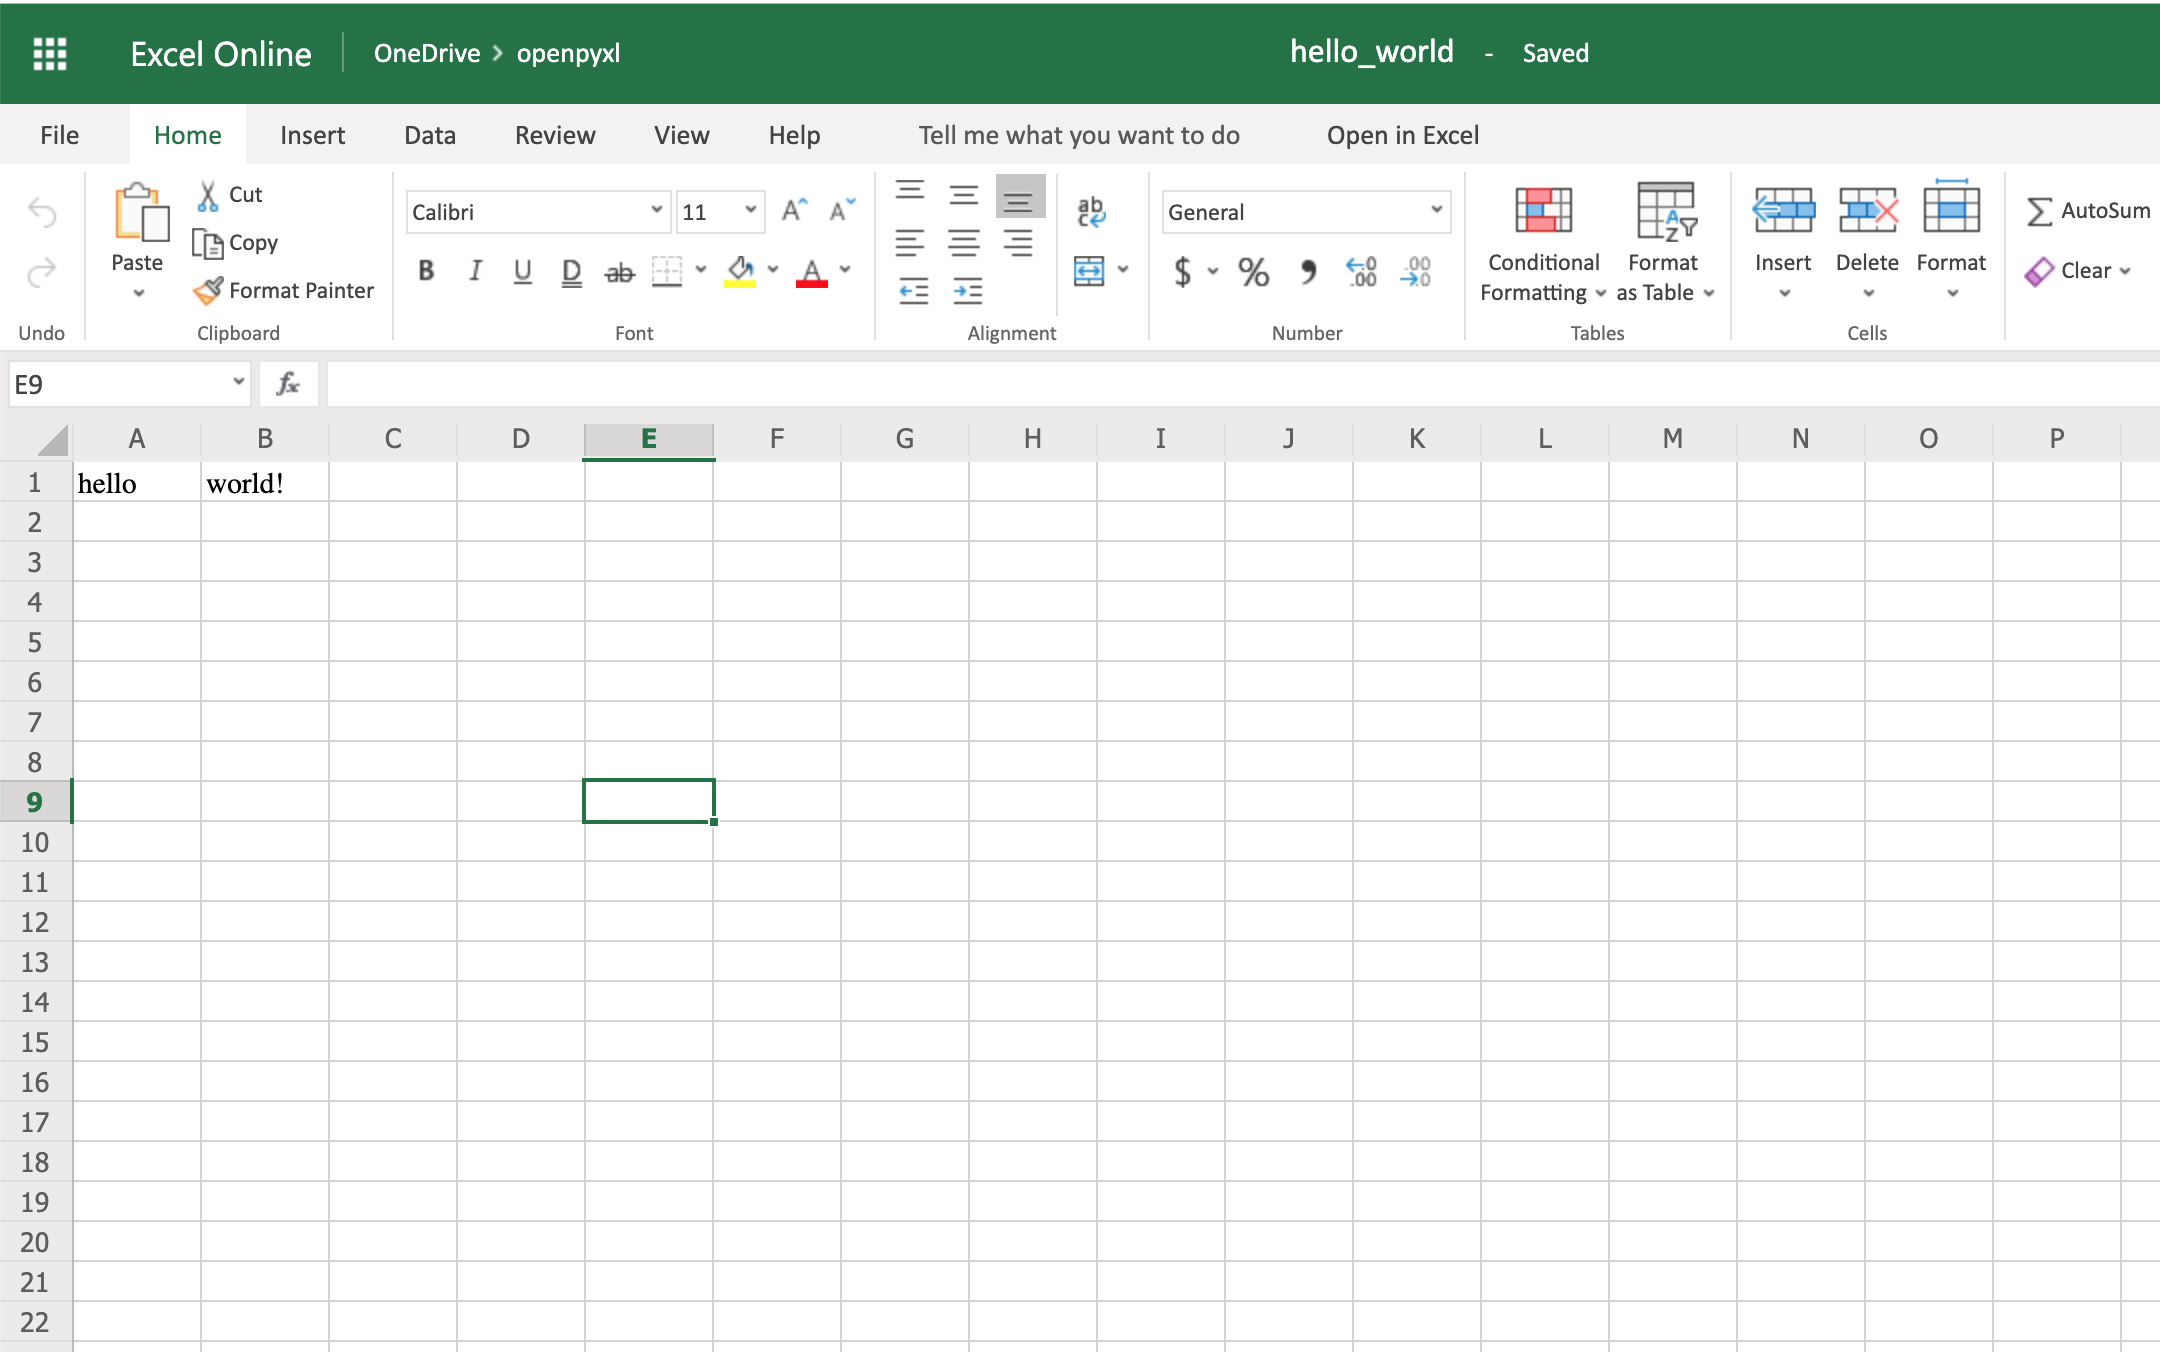
Woohoo, your first spreadsheet created!
Reading Excel Spreadsheets With openpyxl
Let’s start with the most essential thing one can do with a spreadsheet: read it.
You’ll go from a straightforward approach to reading a spreadsheet to more complex examples where you read the data and convert it into more useful Python structures.
Dataset for This Tutorial
Before you dive deep into some code examples, you should download this sample dataset and store it somewhere as sample.xlsx:
This is one of the datasets you’ll be using throughout this tutorial, and it’s a spreadsheet with a sample of real data from Amazon’s online product reviews. This dataset is only a tiny fraction of what Amazon provides, but for testing purposes, it’s more than enough.
A Simple Approach to Reading an Excel Spreadsheet
Finally, let’s start reading some spreadsheets! To begin with, open our sample spreadsheet:
>>>
>>> from openpyxl import load_workbook
>>> workbook = load_workbook(filename="sample.xlsx")
>>> workbook.sheetnames
['Sheet 1']

>>> sheet = workbook.active
>>> sheet
<Worksheet "Sheet 1">

>>> sheet.title
'Sheet 1'
In the code above, you first open the spreadsheet sample.xlsx using load_workbook(), and then you can use workbook.sheetnames to see all the sheets you have available to work with. After that, workbook.active selects the first available sheet and, in this case, you can see that it selects Sheet 1 automatically. Using these methods is the default way of opening a spreadsheet, and you’ll see it many times during this tutorial.
Now, after opening a spreadsheet, you can easily retrieve data from it like this:
>>>
>>> sheet["A1"]
<Cell 'Sheet 1'.A1>

>>> sheet["A1"].value
'marketplace'

>>> sheet["F10"].value
"G-Shock Men's Grey Sport Watch"
To return the actual value of a cell, you need to do .value. Otherwise, you’ll get the main Cell object. You can also use the method .cell() to retrieve a cell using index notation. Remember to add .value to get the actual value and not a Cell object:
>>>
>>> sheet.cell(row=10, column=6)
<Cell 'Sheet 1'.F10>

>>> sheet.cell(row=10, column=6).value
"G-Shock Men's Grey Sport Watch"
You can see that the results returned are the same, no matter which way you decide to go with. However, in this tutorial, you’ll be mostly using the first approach: ["A1"].
The above shows you the quickest way to open a spreadsheet. However, you can pass additional parameters to change the way a spreadsheet is loaded.
Additional Reading Options
There are a few arguments you can pass to load_workbook() that change the way a spreadsheet is loaded. The most important ones are the following two Booleans:
- read_only loads a spreadsheet in read-only mode allowing you to open very large Excel files.
- data_only ignores loading formulas and instead loads only the resulting values.
Importing Data From a Spreadsheet
Now that you’ve learned the basics about loading a spreadsheet, it’s about time you get to the fun part: the iteration and actual usage of the values within the spreadsheet.
This section is where you’ll learn all the different ways you can iterate through the data, but also how to convert that data into something usable and, more importantly, how to do it in a Pythonic way.
Iterating Through the Data
There are a few different ways you can iterate through the data depending on your needs.
You can slice the data with a combination of columns and rows:
>>>
>>> sheet["A1:C2"]
((<Cell 'Sheet 1'.A1>, <Cell 'Sheet 1'.B1>, <Cell 'Sheet 1'.C1>),
 (<Cell 'Sheet 1'.A2>, <Cell 'Sheet 1'.B2>, <Cell 'Sheet 1'.C2>))
You can get ranges of rows or columns:
>>>
>>> # Get all cells from column A
>>> sheet["A"]
(<Cell 'Sheet 1'.A1>,
 <Cell 'Sheet 1'.A2>,
 ...
 <Cell 'Sheet 1'.A99>,
 <Cell 'Sheet 1'.A100>)

>>> # Get all cells for a range of columns
>>> sheet["A:B"]
((<Cell 'Sheet 1'.A1>,
  <Cell 'Sheet 1'.A2>,
  ...
  <Cell 'Sheet 1'.A99>,
  <Cell 'Sheet 1'.A100>),
 (<Cell 'Sheet 1'.B1>,
  <Cell 'Sheet 1'.B2>,
  ...
  <Cell 'Sheet 1'.B99>,
  <Cell 'Sheet 1'.B100>))

>>> # Get all cells from row 5
>>> sheet[5]
(<Cell 'Sheet 1'.A5>,
 <Cell 'Sheet 1'.B5>,
 ...
 <Cell 'Sheet 1'.N5>,
 <Cell 'Sheet 1'.O5>)

>>> # Get all cells for a range of rows
>>> sheet[5:6]
((<Cell 'Sheet 1'.A5>,
  <Cell 'Sheet 1'.B5>,
  ...
  <Cell 'Sheet 1'.N5>,
  <Cell 'Sheet 1'.O5>),
 (<Cell 'Sheet 1'.A6>,
  <Cell 'Sheet 1'.B6>,
  ...
  <Cell 'Sheet 1'.N6>,
  <Cell 'Sheet 1'.O6>))
You’ll notice that all of the above examples return a tuple. If you want to refresh your memory on how to handle tuples in Python, check out the article on Lists and Tuples in Python.
There are also multiple ways of using normal Python generators to go through the data. The main methods you can use to achieve this are:
.iter_rows().iter_cols()
Both methods can receive the following arguments:
min_rowmax_rowmin_colmax_col
These arguments are used to set boundaries for the iteration:
>>>
>>> for row in sheet.iter_rows(min_row=1,
...                            max_row=2,
...                            min_col=1,
...                            max_col=3):
...     print(row)
(<Cell 'Sheet 1'.A1>, <Cell 'Sheet 1'.B1>, <Cell 'Sheet 1'.C1>)
(<Cell 'Sheet 1'.A2>, <Cell 'Sheet 1'.B2>, <Cell 'Sheet 1'.C2>)


>>> for column in sheet.iter_cols(min_row=1,
...                               max_row=2,
...                               min_col=1,
...                               max_col=3):
...     print(column)
(<Cell 'Sheet 1'.A1>, <Cell 'Sheet 1'.A2>)
(<Cell 'Sheet 1'.B1>, <Cell 'Sheet 1'.B2>)
(<Cell 'Sheet 1'.C1>, <Cell 'Sheet 1'.C2>)
You’ll notice that in the first example, when iterating through the rows using .iter_rows(), you get one tuple element per row selected. While when using .iter_cols() and iterating through columns, you’ll get one tuple per column instead.
One additional argument you can pass to both methods is the Boolean values_only. When it’s set to True, the values of the cell are returned, instead of the Cell object:
>>>
>>> for value in sheet.iter_rows(min_row=1,
...                              max_row=2,
...                              min_col=1,
...                              max_col=3,
...                              values_only=True):
...     print(value)
('marketplace', 'customer_id', 'review_id')
('US', 3653882, 'R3O9SGZBVQBV76')
If you want to iterate through the whole dataset, then you can also use the attributes .rows or .columns directly, which are shortcuts to using .iter_rows() and .iter_cols() without any arguments:
>>>
>>> for row in sheet.rows:
...     print(row)
(<Cell 'Sheet 1'.A1>, <Cell 'Sheet 1'.B1>, <Cell 'Sheet 1'.C1>
...
<Cell 'Sheet 1'.M100>, <Cell 'Sheet 1'.N100>, <Cell 'Sheet 1'.O100>)
These shortcuts are very useful when you’re iterating through the whole dataset.
Manipulate Data Using Python’s Default Data Structures
Now that you know the basics of iterating through the data in a workbook, let’s look at smart ways of converting that data into Python structures.
As you saw earlier, the result from all iterations comes in the form of tuples. However, since a tuple is nothing more than an immutable list, you can easily access its data and transform it into other structures.
For example, say you want to extract product information from the sample.xlsx spreadsheet and into a dictionary where each key is a product ID.
A straightforward way to do this is to iterate over all the rows, pick the columns you know are related to product information, and then store that in a dictionary. Let’s code this out!
First of all, have a look at the headers and see what information you care most about:
>>>
>>> for value in sheet.iter_rows(min_row=1,
...                              max_row=1,
...                              values_only=True):
...     print(value)
('marketplace', 'customer_id', 'review_id', 'product_id', ...)
This code returns a list of all the column names you have in the spreadsheet. To start, grab the columns with names:
product_idproduct_parentproduct_titleproduct_category
Lucky for you, the columns you need are all next to each other so you can use the min_column and max_column to easily get the data you want:
>>>
>>> for value in sheet.iter_rows(min_row=2,
...                              min_col=4,
...                              max_col=7,
...                              values_only=True):
...     print(value)
('B00FALQ1ZC', 937001370, 'Invicta Women's 15150 "Angel" 18k Yellow...)
('B00D3RGO20', 484010722, "Kenneth Cole New York Women's KC4944...)
...
Nice! Now that you know how to get all the important product information you need, let’s put that data into a dictionary:
import json
from openpyxl import load_workbook

workbook = load_workbook(filename="sample.xlsx")
sheet = workbook.active

products = {}

# Using the values_only because you want to return the cells' values
for row in sheet.iter_rows(min_row=2,
                           min_col=4,
                           max_col=7,
                           values_only=True):
    product_id = row[0]
    product = {
        "parent": row[1],
        "title": row[2],
        "category": row[3]
    }
    products[product_id] = product

# Using json here to be able to format the output for displaying later
print(json.dumps(products))
The code above returns a JSON similar to this:
{
  "B00FALQ1ZC": {
    "parent": 937001370,
    "title": "Invicta Women's 15150 ...",
    "category": "Watches"
  },
  "B00D3RGO20": {
    "parent": 484010722,
    "title": "Kenneth Cole New York ...",
    "category": "Watches"
  }
}
Here you can see that the output is trimmed to 2 products only, but if you run the script as it is, then you should get 98 products.
Convert Data Into Python Classes
To finalize the reading section of this tutorial, let’s dive into Python classes and see how you could improve on the example above and better structure the data.
For this, you’ll be using the new Python Data Classes that are available from Python 3.7. If you’re using an older version of Python, then you can use the default Classes instead.
So, first things first, let’s look at the data you have and decide what you want to store and how you want to store it.
As you saw right at the start, this data comes from Amazon, and it’s a list of product reviews. You can check the list of all the columns and their meaning on Amazon.
There are two significant elements you can extract from the data available:
- Products
- Reviews
A Product has:
- ID
- Title
- Parent
- Category
The Review has a few more fields:
- ID
- Customer ID
- Stars
- Headline
- Body
- Date
You can ignore a few of the review fields to make things a bit simpler.
So, a straightforward implementation of these two classes could be written in a separate file classes.py:
import datetime
from dataclasses import dataclass

@dataclass
class Product:
    id: str
    parent: str
    title: str
    category: str

@dataclass
class Review:
    id: str
    customer_id: str
    stars: int
    headline: str
    body: str
    date: datetime.datetime
After defining your data classes, you need to convert the data from the spreadsheet into these new structures.
Before doing the conversion, it’s worth looking at our header again and creating a mapping between columns and the fields you need:
>>>
>>> for value in sheet.iter_rows(min_row=1,
...                              max_row=1,
...                              values_only=True):
...     print(value)
('marketplace', 'customer_id', 'review_id', 'product_id', ...)

>>> # Or an alternative
>>> for cell in sheet[1]:
...     print(cell.value)
marketplace
customer_id
review_id
product_id
product_parent
...
Let’s create a file mapping.py where you have a list of all the field names and their column location (zero-indexed) on the spreadsheet:
# Product fields
PRODUCT_ID = 3
PRODUCT_PARENT = 4
PRODUCT_TITLE = 5
PRODUCT_CATEGORY = 6

# Review fields
REVIEW_ID = 2
REVIEW_CUSTOMER = 1
REVIEW_STARS = 7
REVIEW_HEADLINE = 12
REVIEW_BODY = 13
REVIEW_DATE = 14
You don’t necessarily have to do the mapping above. It’s more for readability when parsing the row data, so you don’t end up with a lot of magic numbers lying around.
Finally, let’s look at the code needed to parse the spreadsheet data into a list of product and review objects:
from datetime import datetime
from openpyxl import load_workbook
from classes import Product, Review
from mapping import PRODUCT_ID, PRODUCT_PARENT, PRODUCT_TITLE,
    PRODUCT_CATEGORY, REVIEW_DATE, REVIEW_ID, REVIEW_CUSTOMER,
    REVIEW_STARS, REVIEW_HEADLINE, REVIEW_BODY

# Using the read_only method since you're not gonna be editing the spreadsheet
workbook = load_workbook(filename="sample.xlsx", read_only=True)
sheet = workbook.active

products = []
reviews = []

# Using the values_only because you just want to return the cell value
for row in sheet.iter_rows(min_row=2, values_only=True):
    product = Product(id=row[PRODUCT_ID],
                      parent=row[PRODUCT_PARENT],
                      title=row[PRODUCT_TITLE],
                      category=row[PRODUCT_CATEGORY])
    products.append(product)

    # You need to parse the date from the spreadsheet into a datetime format
    spread_date = row[REVIEW_DATE]
    parsed_date = datetime.strptime(spread_date, "%Y-%m-%d")

    review = Review(id=row[REVIEW_ID],
                    customer_id=row[REVIEW_CUSTOMER],
                    stars=row[REVIEW_STARS],
                    headline=row[REVIEW_HEADLINE],
                    body=row[REVIEW_BODY],
                    date=parsed_date)
    reviews.append(review)

print(products[0])
print(reviews[0])
After you run the code above, you should get some output like this:
Product(id='B00FALQ1ZC', parent=937001370, ...)
Review(id='R3O9SGZBVQBV76', customer_id=3653882, ...)
That’s it! Now you should have the data in a very simple and digestible class format, and you can start thinking of storing this in a Database or any other type of data storage you like.
Using this kind of OOP strategy to parse spreadsheets makes handling the data much simpler later on.
Appending New Data
Before you start creating very complex spreadsheets, have a quick look at an example of how to append data to an existing spreadsheet.
Go back to the first example spreadsheet you created (hello_world.xlsx) and try opening it and appending some data to it, like this:
from openpyxl import load_workbook

# Start by opening the spreadsheet and selecting the main sheet
workbook = load_workbook(filename="hello_world.xlsx")
sheet = workbook.active

# Write what you want into a specific cell
sheet["C1"] = "writing ;)"

# Save the spreadsheet
workbook.save(filename="hello_world_append.xlsx")
Et voilà, if you open the new hello_world_append.xlsx spreadsheet, you’ll see the following change:
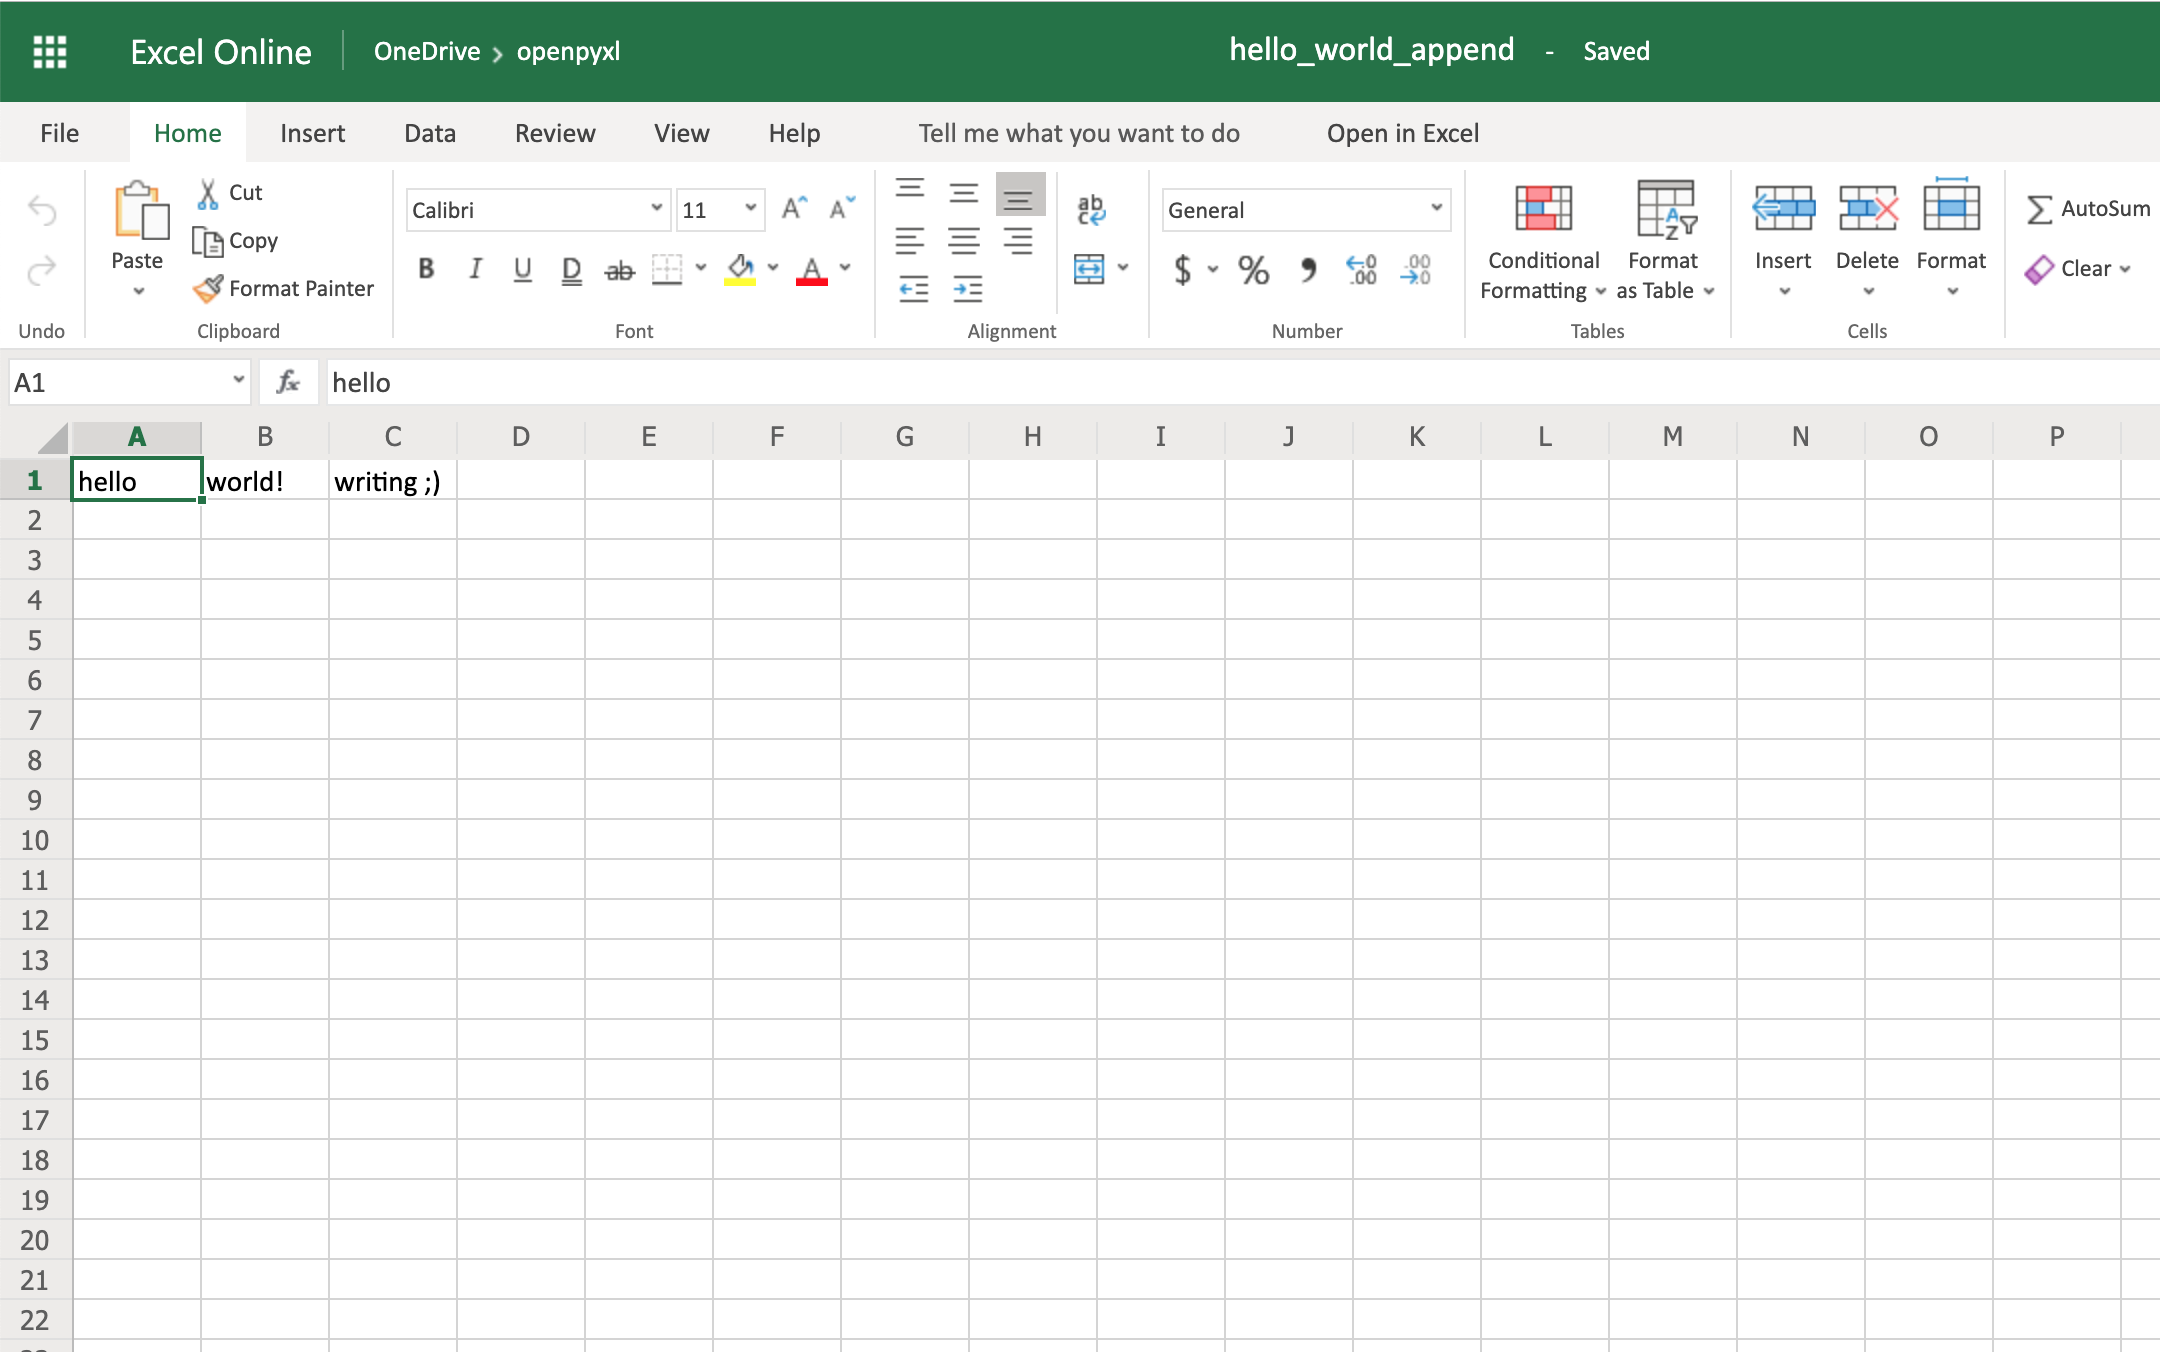
Notice the additional writing  on cell
 C1.
Writing Excel Spreadsheets With openpyxl
There are a lot of different things you can write to a spreadsheet, from simple text or number values to complex formulas, charts, or even images.
Let’s start creating some spreadsheets!
Creating a Simple Spreadsheet
Previously, you saw a very quick example of how to write “Hello world!” into a spreadsheet, so you can start with that:
 1from openpyxl import Workbook
 2
 3filename = "hello_world.xlsx"
 4
 5workbook = Workbook()
 6sheet = workbook.active
 7
 8sheet["A1"] = "hello"
 9sheet["B1"] = "world!"
10
11workbook.save(filename=filename)
The highlighted lines in the code above are the most important ones for writing. In the code, you can see that:
- Line 5 shows you how to create a new empty workbook.
- Lines 8 and 9 show you how to add data to specific cells.
- Line 11 shows you how to save the spreadsheet when you’re done.
Even though these lines above can be straightforward, it’s still good to know them well for when things get a bit more complicated.
One thing you can do to help with coming code examples is add the following method to your Python file or console:
>>>
>>> def print_rows():
...     for row in sheet.iter_rows(values_only=True):
...         print(row)
It makes it easier to print all of your spreadsheet values by just calling print_rows().
Basic Spreadsheet Operations
Before you get into the more advanced topics, it’s good for you to know how to manage the most simple elements of a spreadsheet.
Adding and Updating Cell Values
You already learned how to add values to a spreadsheet like this:
>>>
>>> sheet["A1"] = "value"
There’s another way you can do this, by first selecting a cell and then changing its value:
>>>
>>> cell = sheet["A1"]
>>> cell
<Cell 'Sheet'.A1>

>>> cell.value
'hello'

>>> cell.value = "hey"
>>> cell.value
'hey'
The new value is only stored into the spreadsheet once you call workbook.save().
The openpyxl creates a cell when adding a value, if that cell didn’t exist before:
>>>
>>> # Before, our spreadsheet has only 1 row
>>> print_rows()
('hello', 'world!')

>>> # Try adding a value to row 10
>>> sheet["B10"] = "test"
>>> print_rows()
('hello', 'world!')
(None, None)
(None, None)
(None, None)
(None, None)
(None, None)
(None, None)
(None, None)
(None, None)
(None, 'test')
As you can see, when trying to add a value to cell B10, you end up with a tuple with 10 rows, just so you can have that test value.
Managing Rows and Columns
One of the most common things you have to do when manipulating spreadsheets is adding or removing rows and columns. The openpyxl package allows you to do that in a very straightforward way by using the methods:
.insert_rows().delete_rows().insert_cols().delete_cols()
Every single one of those methods can receive two arguments:
idxamount
Using our basic hello_world.xlsx example again, let’s see how these methods work:
>>>
>>> print_rows()
('hello', 'world!')

>>> # Insert a column before the existing column 1 ("A")
>>> sheet.insert_cols(idx=1)
>>> print_rows()
(None, 'hello', 'world!')

>>> # Insert 5 columns between column 2 ("B") and 3 ("C")
>>> sheet.insert_cols(idx=3, amount=5)
>>> print_rows()
(None, 'hello', None, None, None, None, None, 'world!')

>>> # Delete the created columns
>>> sheet.delete_cols(idx=3, amount=5)
>>> sheet.delete_cols(idx=1)
>>> print_rows()
('hello', 'world!')

>>> # Insert a new row in the beginning
>>> sheet.insert_rows(idx=1)
>>> print_rows()
(None, None)
('hello', 'world!')

>>> # Insert 3 new rows in the beginning
>>> sheet.insert_rows(idx=1, amount=3)
>>> print_rows()
(None, None)
(None, None)
(None, None)
(None, None)
('hello', 'world!')

>>> # Delete the first 4 rows
>>> sheet.delete_rows(idx=1, amount=4)
>>> print_rows()
('hello', 'world!')
The only thing you need to remember is that when inserting new data (rows or columns), the insertion happens before the idx parameter.
So, if you do insert_rows(1), it inserts a new row before the existing first row.
It’s the same for columns: when you call insert_cols(2), it inserts a new column right before the already existing second column (B).
However, when deleting rows or columns, .delete_... deletes data starting from the index passed as an argument.
For example, when doing delete_rows(2) it deletes row 2, and when doing delete_cols(3) it deletes the third column (C).
Managing Sheets
Sheet management is also one of those things you might need to know, even though it might be something that you don’t use that often.
If you look back at the code examples from this tutorial, you’ll notice the following recurring piece of code:
This is the way to select the default sheet from a spreadsheet. However, if you’re opening a spreadsheet with multiple sheets, then you can always select a specific one like this:
>>>
>>> # Let's say you have two sheets: "Products" and "Company Sales"
>>> workbook.sheetnames
['Products', 'Company Sales']

>>> # You can select a sheet using its title
>>> products_sheet = workbook["Products"]
>>> sales_sheet = workbook["Company Sales"]
You can also change a sheet title very easily:
>>>
>>> workbook.sheetnames
['Products', 'Company Sales']

>>> products_sheet = workbook["Products"]
>>> products_sheet.title = "New Products"

>>> workbook.sheetnames
['New Products', 'Company Sales']
If you want to create or delete sheets, then you can also do that with .create_sheet() and .remove():
>>>
>>> workbook.sheetnames
['Products', 'Company Sales']

>>> operations_sheet = workbook.create_sheet("Operations")
>>> workbook.sheetnames
['Products', 'Company Sales', 'Operations']

>>> # You can also define the position to create the sheet at
>>> hr_sheet = workbook.create_sheet("HR", 0)
>>> workbook.sheetnames
['HR', 'Products', 'Company Sales', 'Operations']

>>> # To remove them, just pass the sheet as an argument to the .remove()
>>> workbook.remove(operations_sheet)
>>> workbook.sheetnames
['HR', 'Products', 'Company Sales']

>>> workbook.remove(hr_sheet)
>>> workbook.sheetnames
['Products', 'Company Sales']
One other thing you can do is make duplicates of a sheet using copy_worksheet():
>>>
>>> workbook.sheetnames
['Products', 'Company Sales']

>>> products_sheet = workbook["Products"]
>>> workbook.copy_worksheet(products_sheet)
<Worksheet "Products Copy">

>>> workbook.sheetnames
['Products', 'Company Sales', 'Products Copy']
If you open your spreadsheet after saving the above code, you’ll notice that the sheet Products Copy is a duplicate of the sheet Products.
Freezing Rows and Columns
Something that you might want to do when working with big spreadsheets is to freeze a few rows or columns, so they remain visible when you scroll right or down.
Freezing data allows you to keep an eye on important rows or columns, regardless of where you scroll in the spreadsheet.
Again, openpyxl also has a way to accomplish this by using the worksheet freeze_panes attribute. For this example, go back to our sample.xlsx spreadsheet and try doing the following:
>>>
>>> workbook = load_workbook(filename="sample.xlsx")
>>> sheet = workbook.active
>>> sheet.freeze_panes = "C2"
>>> workbook.save("sample_frozen.xlsx")
If you open the sample_frozen.xlsx spreadsheet in your favorite spreadsheet editor, you’ll notice that row 1 and columns A and B are frozen and are always visible no matter where you navigate within the spreadsheet.
This feature is handy, for example, to keep headers within sight, so you always know what each column represents.
Here’s how it looks in the editor:
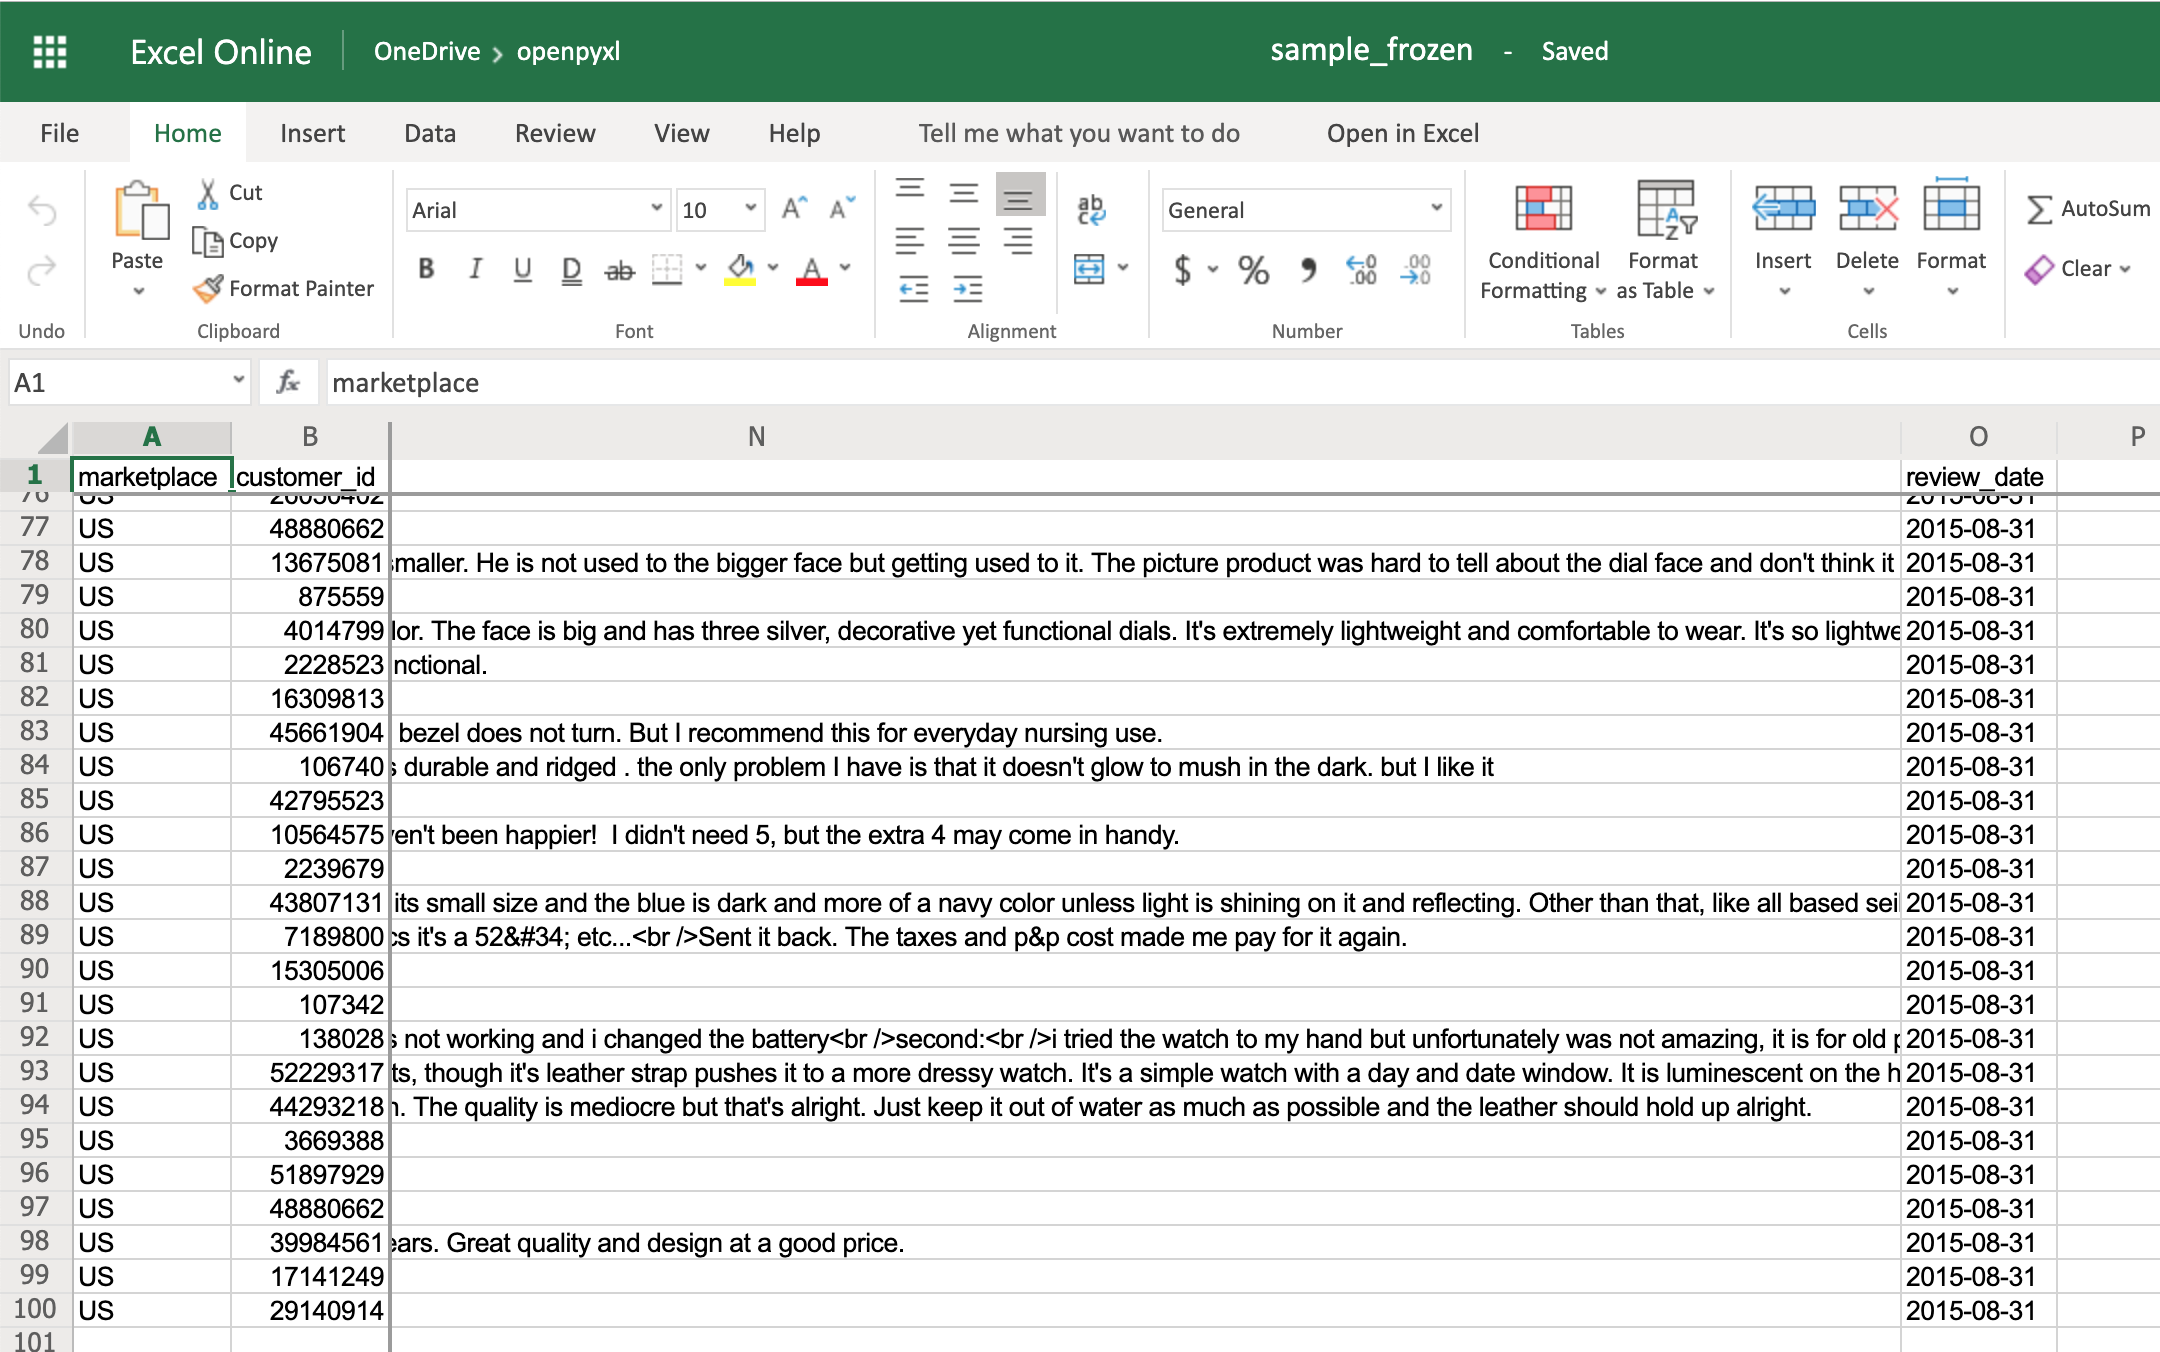
Notice how you’re at the end of the spreadsheet, and yet, you can see both row 1 and columns A and B.
Adding Filters
You can use openpyxl to add filters and sorts to your spreadsheet. However, when you open the spreadsheet, the data won’t be rearranged according to these sorts and filters.
At first, this might seem like a pretty useless feature, but when you’re programmatically creating a spreadsheet that is going to be sent and used by somebody else, it’s still nice to at least create the filters and allow people to use it afterward.
The code below is an example of how you would add some filters to our existing sample.xlsx spreadsheet:
>>>
>>> # Check the used spreadsheet space using the attribute "dimensions"
>>> sheet.dimensions
'A1:O100'

>>> sheet.auto_filter.ref = "A1:O100"
>>> workbook.save(filename="sample_with_filters.xlsx")
You should now see the filters created when opening the spreadsheet in your editor:
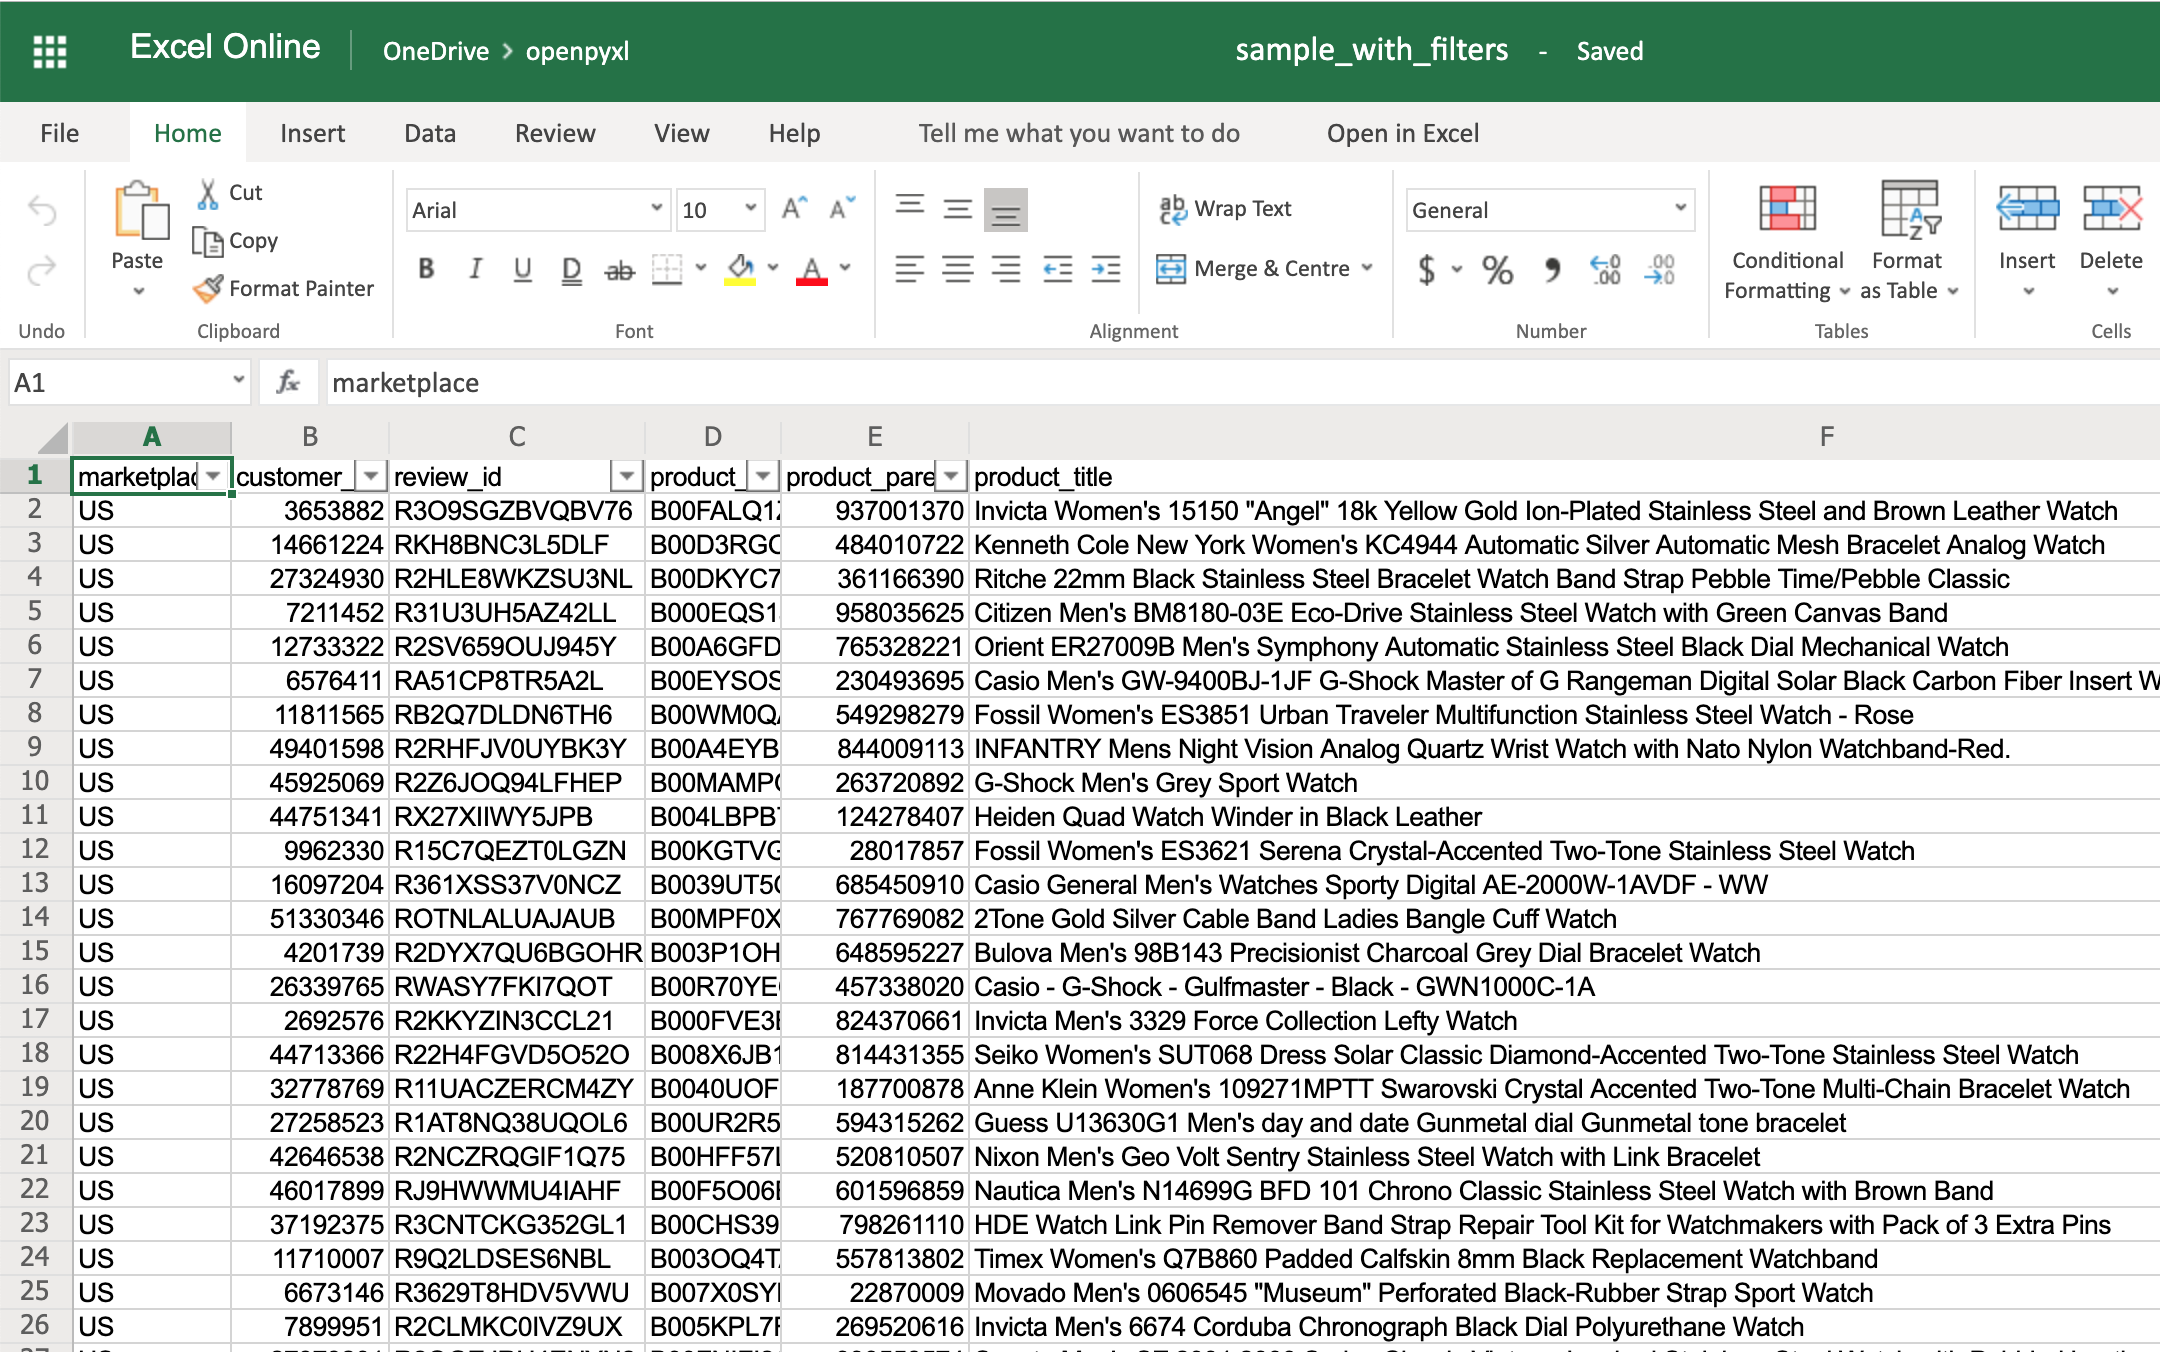
You don’t have to use sheet.dimensions if you know precisely which part of the spreadsheet you want to apply filters to.
Adding Formulas
Formulas (or formulae) are one of the most powerful features of spreadsheets.
They gives you the power to apply specific mathematical equations to a range of cells. Using formulas with openpyxl is as simple as editing the value of a cell.
You can see the list of formulas supported by openpyxl:
>>>
>>> from openpyxl.utils import FORMULAE
>>> FORMULAE
frozenset({'ABS',
           'ACCRINT',
           'ACCRINTM',
           'ACOS',
           'ACOSH',
           'AMORDEGRC',
           'AMORLINC',
           'AND',
           ...
           'YEARFRAC',
           'YIELD',
           'YIELDDISC',
           'YIELDMAT',
           'ZTEST'})
Let’s add some formulas to our sample.xlsx spreadsheet.
Starting with something easy, let’s check the average star rating for the 99 reviews within the spreadsheet:
>>>
>>> # Star rating is column "H"
>>> sheet["P2"] = "=AVERAGE(H2:H100)"
>>> workbook.save(filename="sample_formulas.xlsx")
If you open the spreadsheet now and go to cell P2, you should see that its value is: 4.18181818181818. Have a look in the editor:

You can use the same methodology to add any formulas to your spreadsheet. For example, let’s count the number of reviews that had helpful votes:
>>>
>>> # The helpful votes are counted on column "I"
>>> sheet["P3"] = '=COUNTIF(I2:I100, ">0")'
>>> workbook.save(filename="sample_formulas.xlsx")
You should get the number 21 on your P3 spreadsheet cell like so:
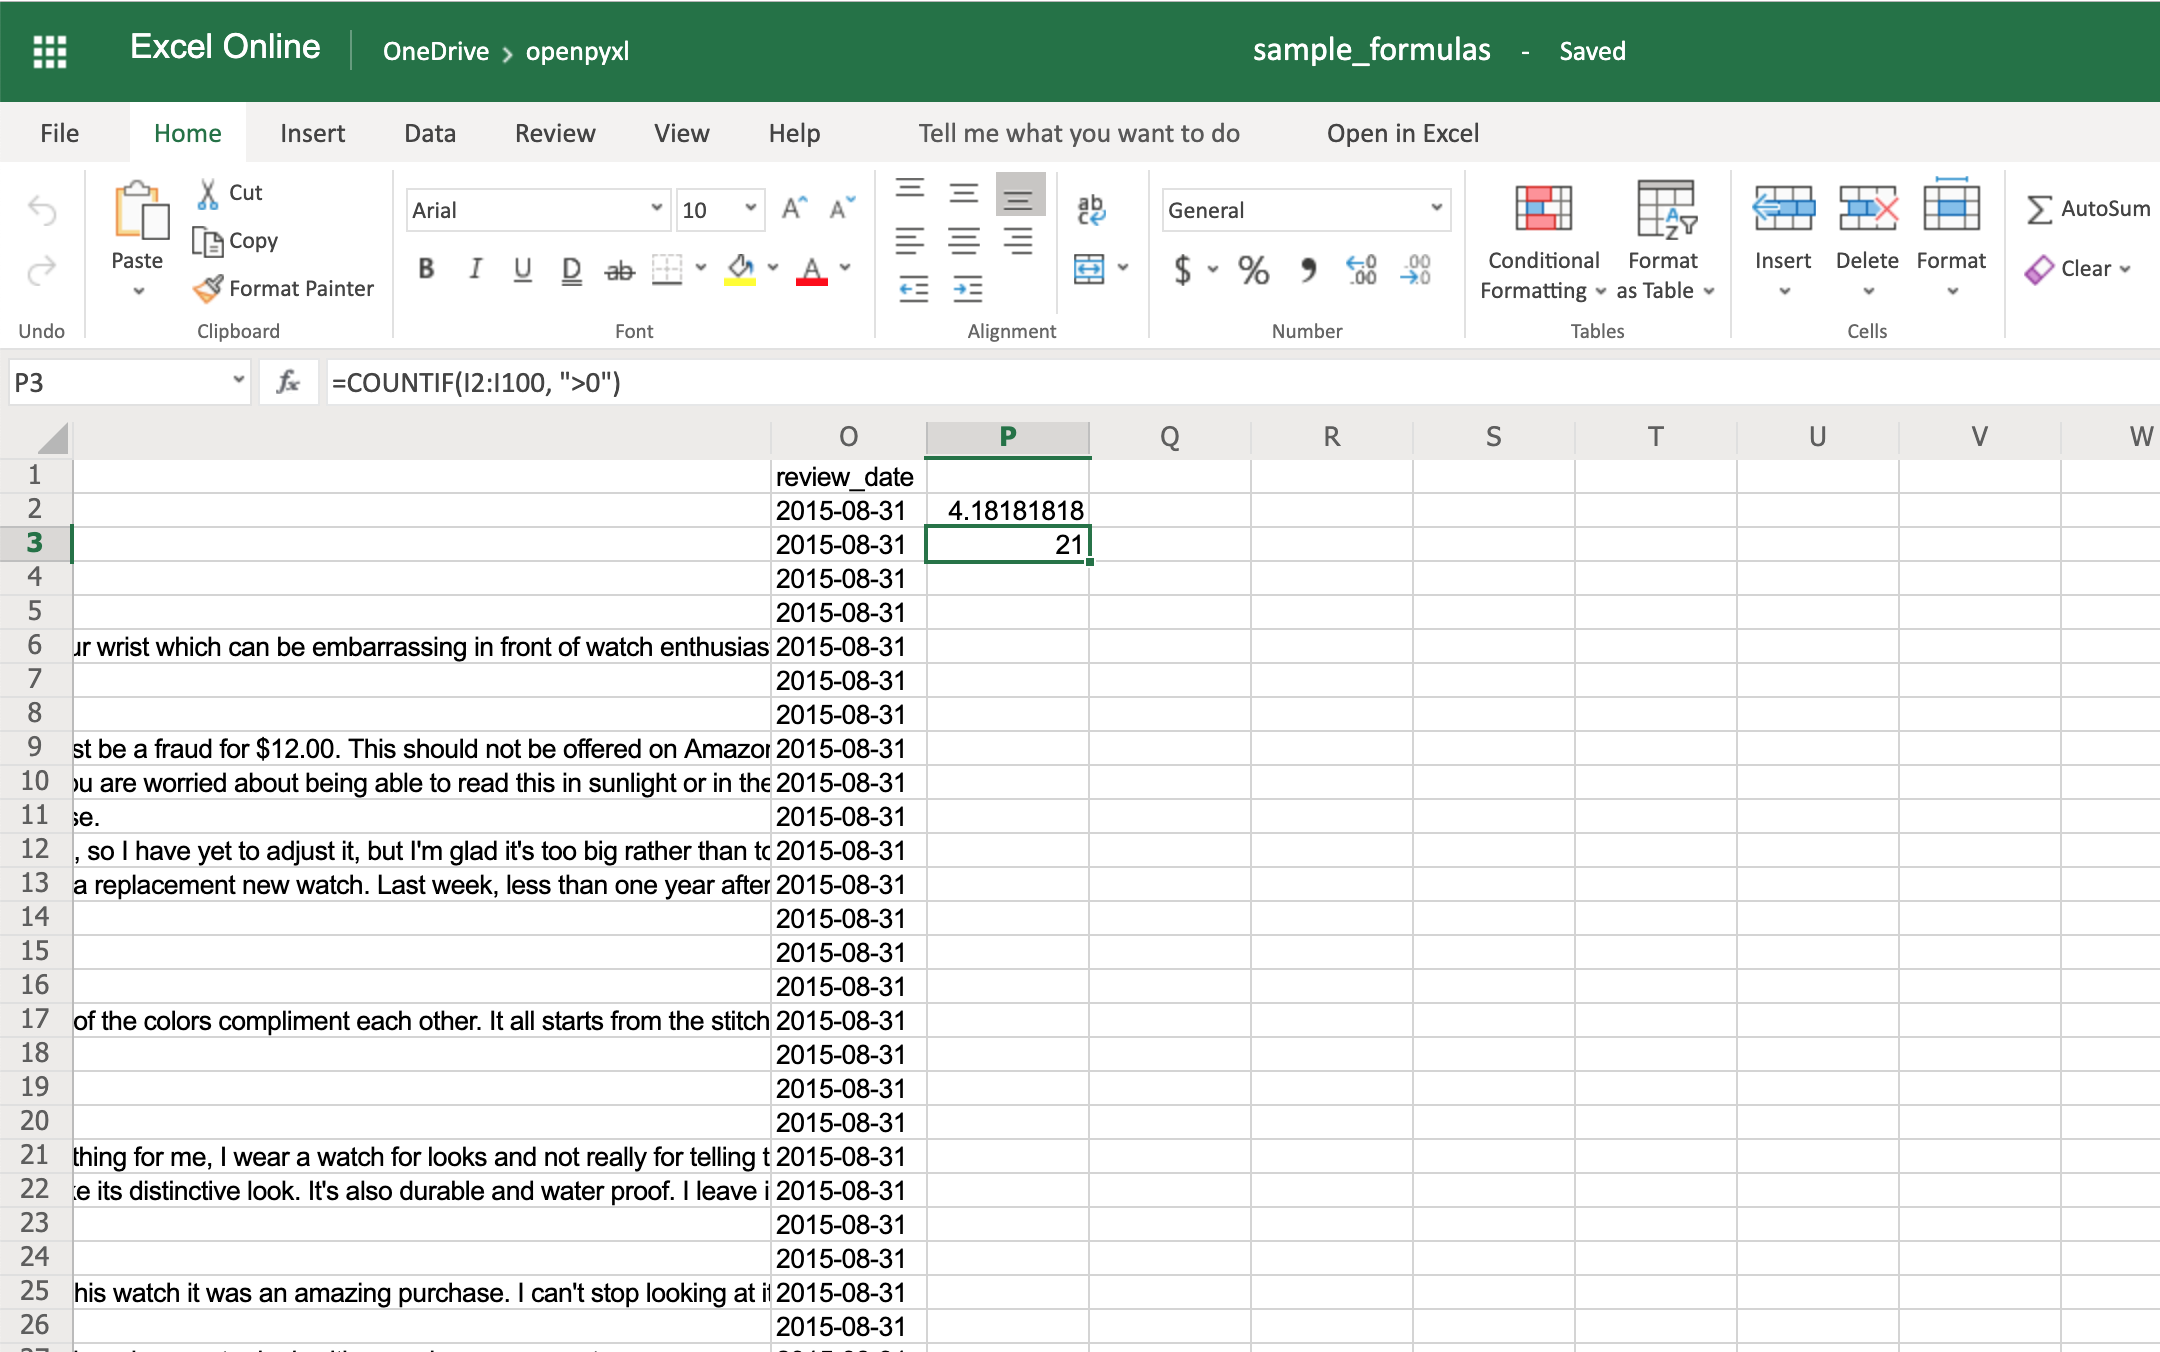
You’ll have to make sure that the strings within a formula are always in double quotes, so you either have to use single quotes around the formula like in the example above or you’ll have to escape the double quotes inside the formula: "=COUNTIF(I2:I100, ">0")".
There are a ton of other formulas you can add to your spreadsheet using the same procedure you tried above. Give it a go yourself!
Adding Styles
Even though styling a spreadsheet might not be something you would do every day, it’s still good to know how to do it.
Using openpyxl, you can apply multiple styling options to your spreadsheet, including fonts, borders, colors, and so on. Have a look at the openpyxl documentation to learn more.
You can also choose to either apply a style directly to a cell or create a template and reuse it to apply styles to multiple cells.
Let’s start by having a look at simple cell styling, using our sample.xlsx again as the base spreadsheet:
>>>
>>> # Import necessary style classes
>>> from openpyxl.styles import Font, Color, Alignment, Border, Side

>>> # Create a few styles
>>> bold_font = Font(bold=True)
>>> big_red_text = Font(color="00FF0000", size=20)
>>> center_aligned_text = Alignment(horizontal="center")
>>> double_border_side = Side(border_style="double")
>>> square_border = Border(top=double_border_side,
...                        right=double_border_side,
...                        bottom=double_border_side,
...                        left=double_border_side)

>>> # Style some cells!
>>> sheet["A2"].font = bold_font
>>> sheet["A3"].font = big_red_text
>>> sheet["A4"].alignment = center_aligned_text
>>> sheet["A5"].border = square_border
>>> workbook.save(filename="sample_styles.xlsx")
If you open your spreadsheet now, you should see quite a few different styles on the first 5 cells of column A:
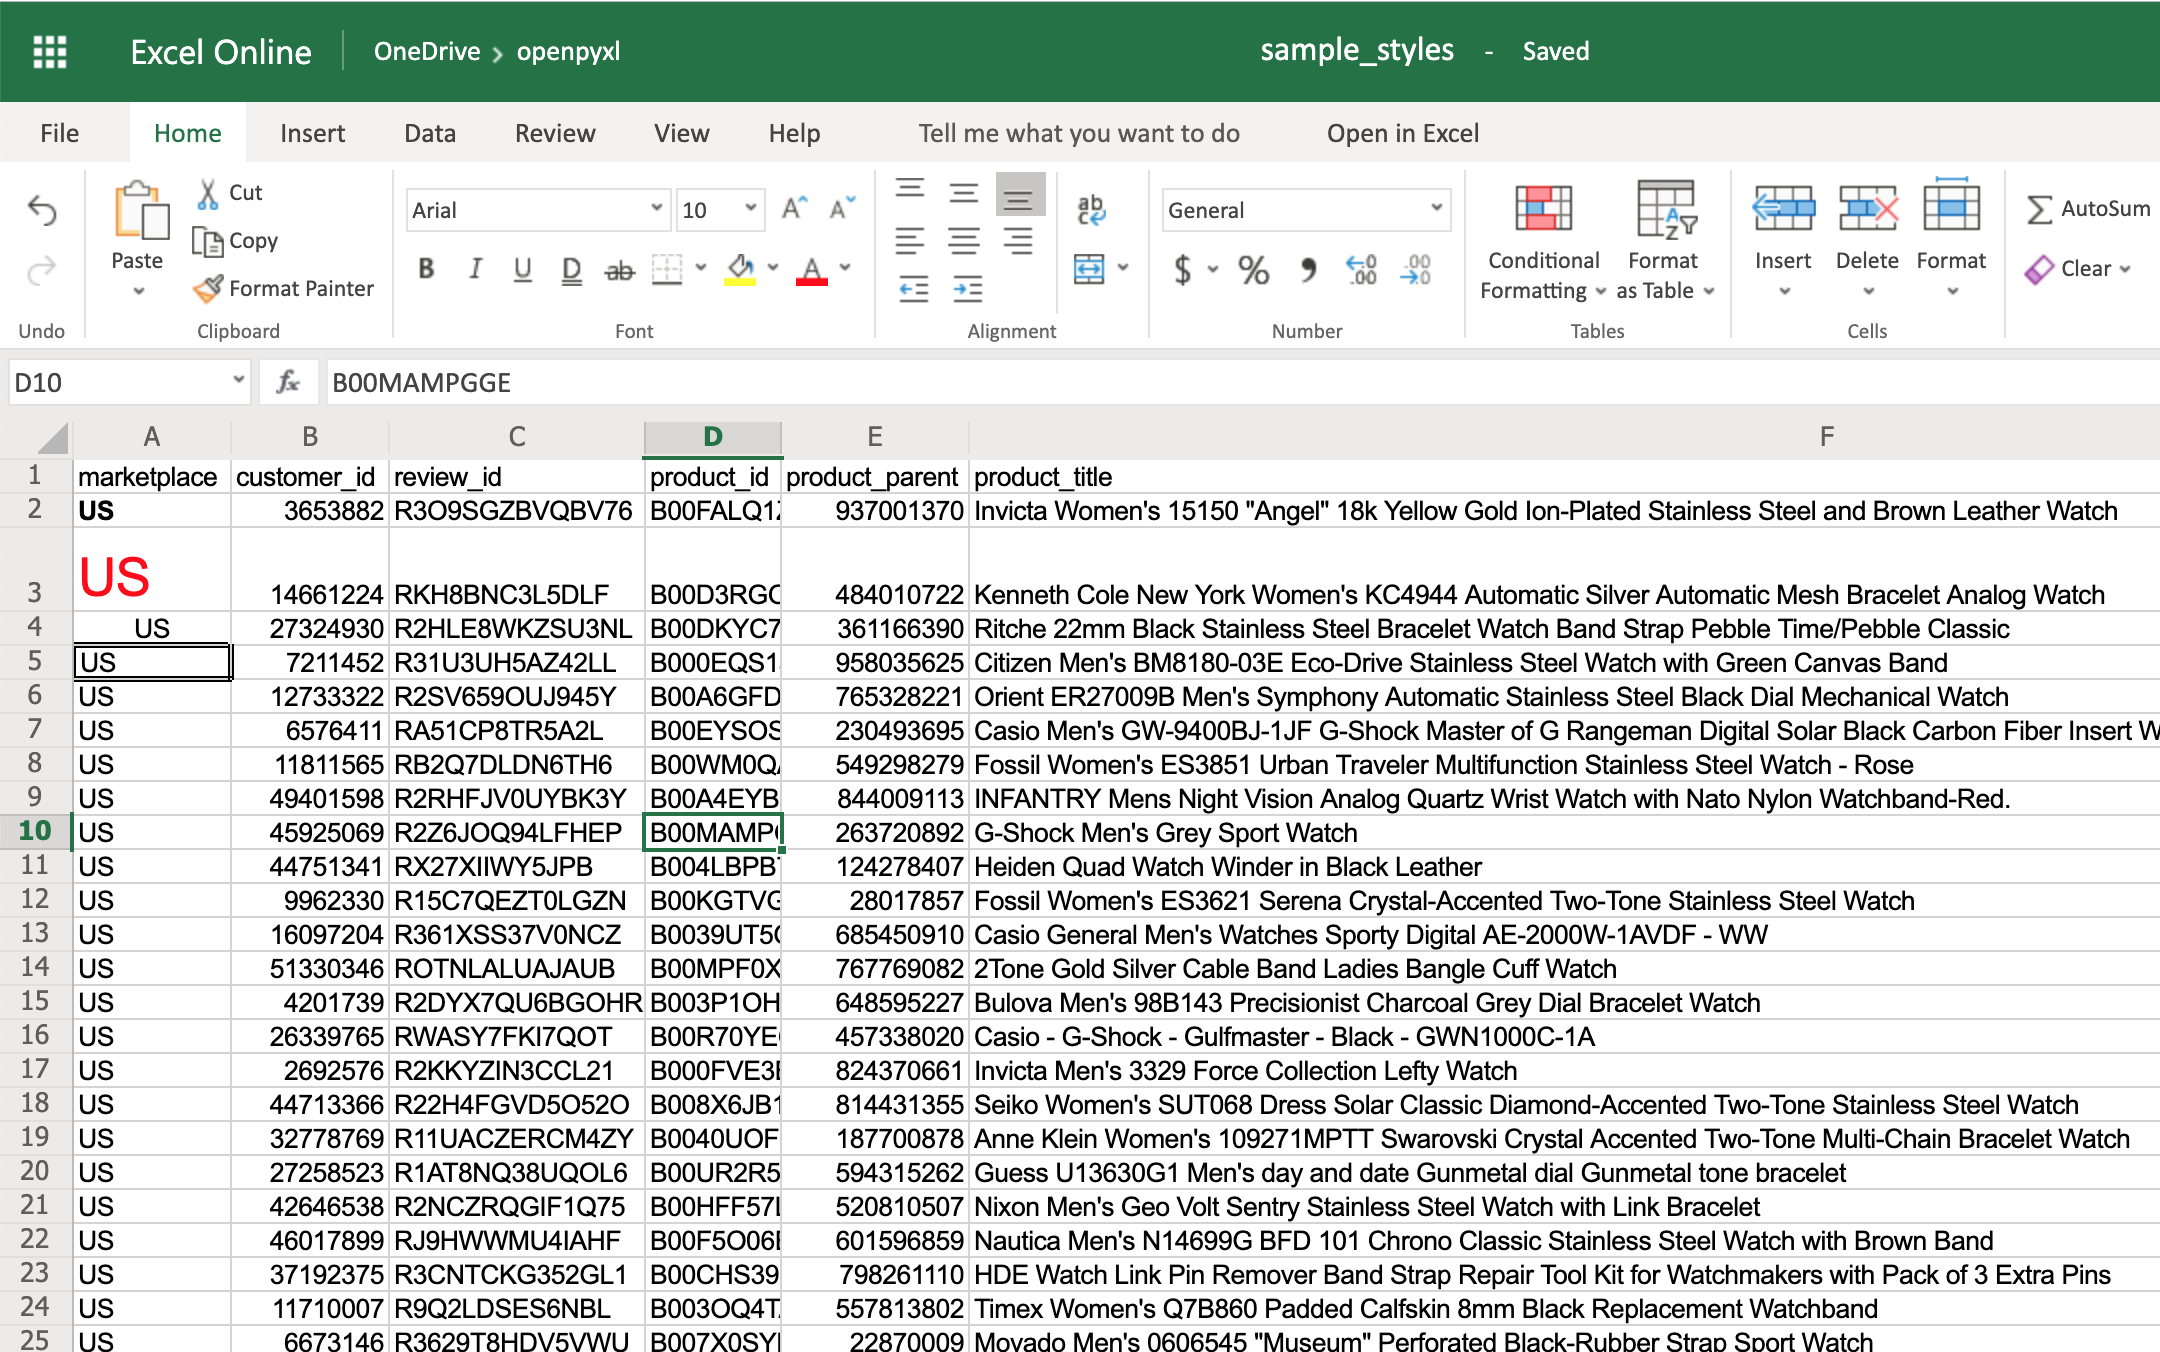
There you go. You got:
- A2 with the text in bold
- A3 with the text in red and bigger font size
- A4 with the text centered
- A5 with a square border around the text
You can also combine styles by simply adding them to the cell at the same time:
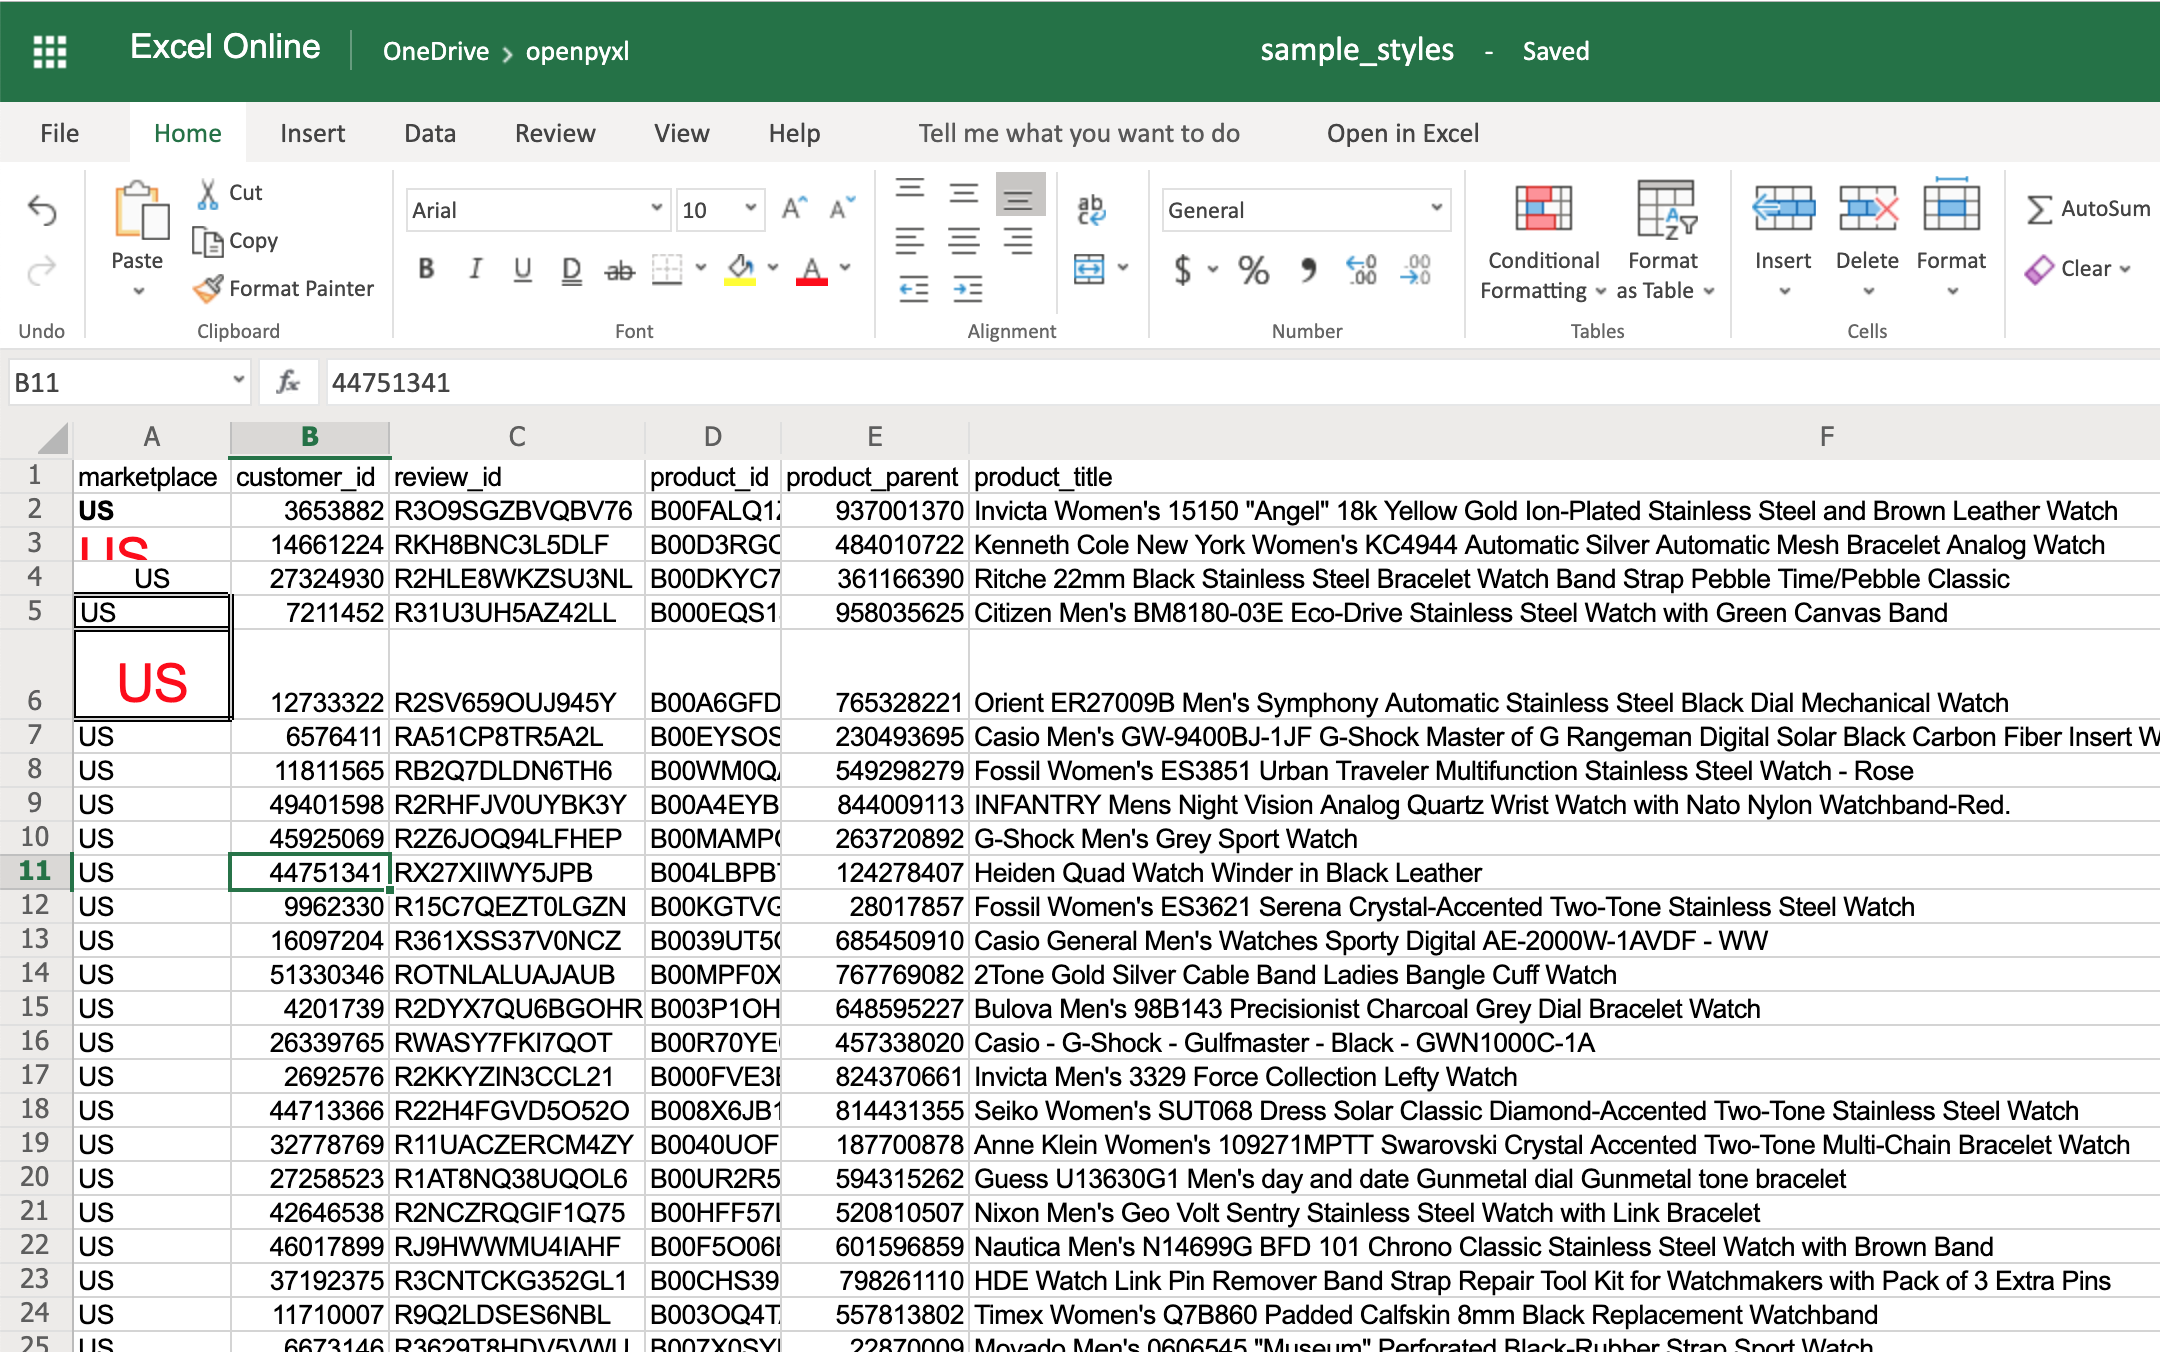
>>>
>>> # Reusing the same styles from the example above
>>> sheet["A6"].alignment = center_aligned_text
>>> sheet["A6"].font = big_red_text
>>> sheet["A6"].border = square_border
>>> workbook.save(filename="sample_styles.xlsx")
Have a look at cell A6 here:
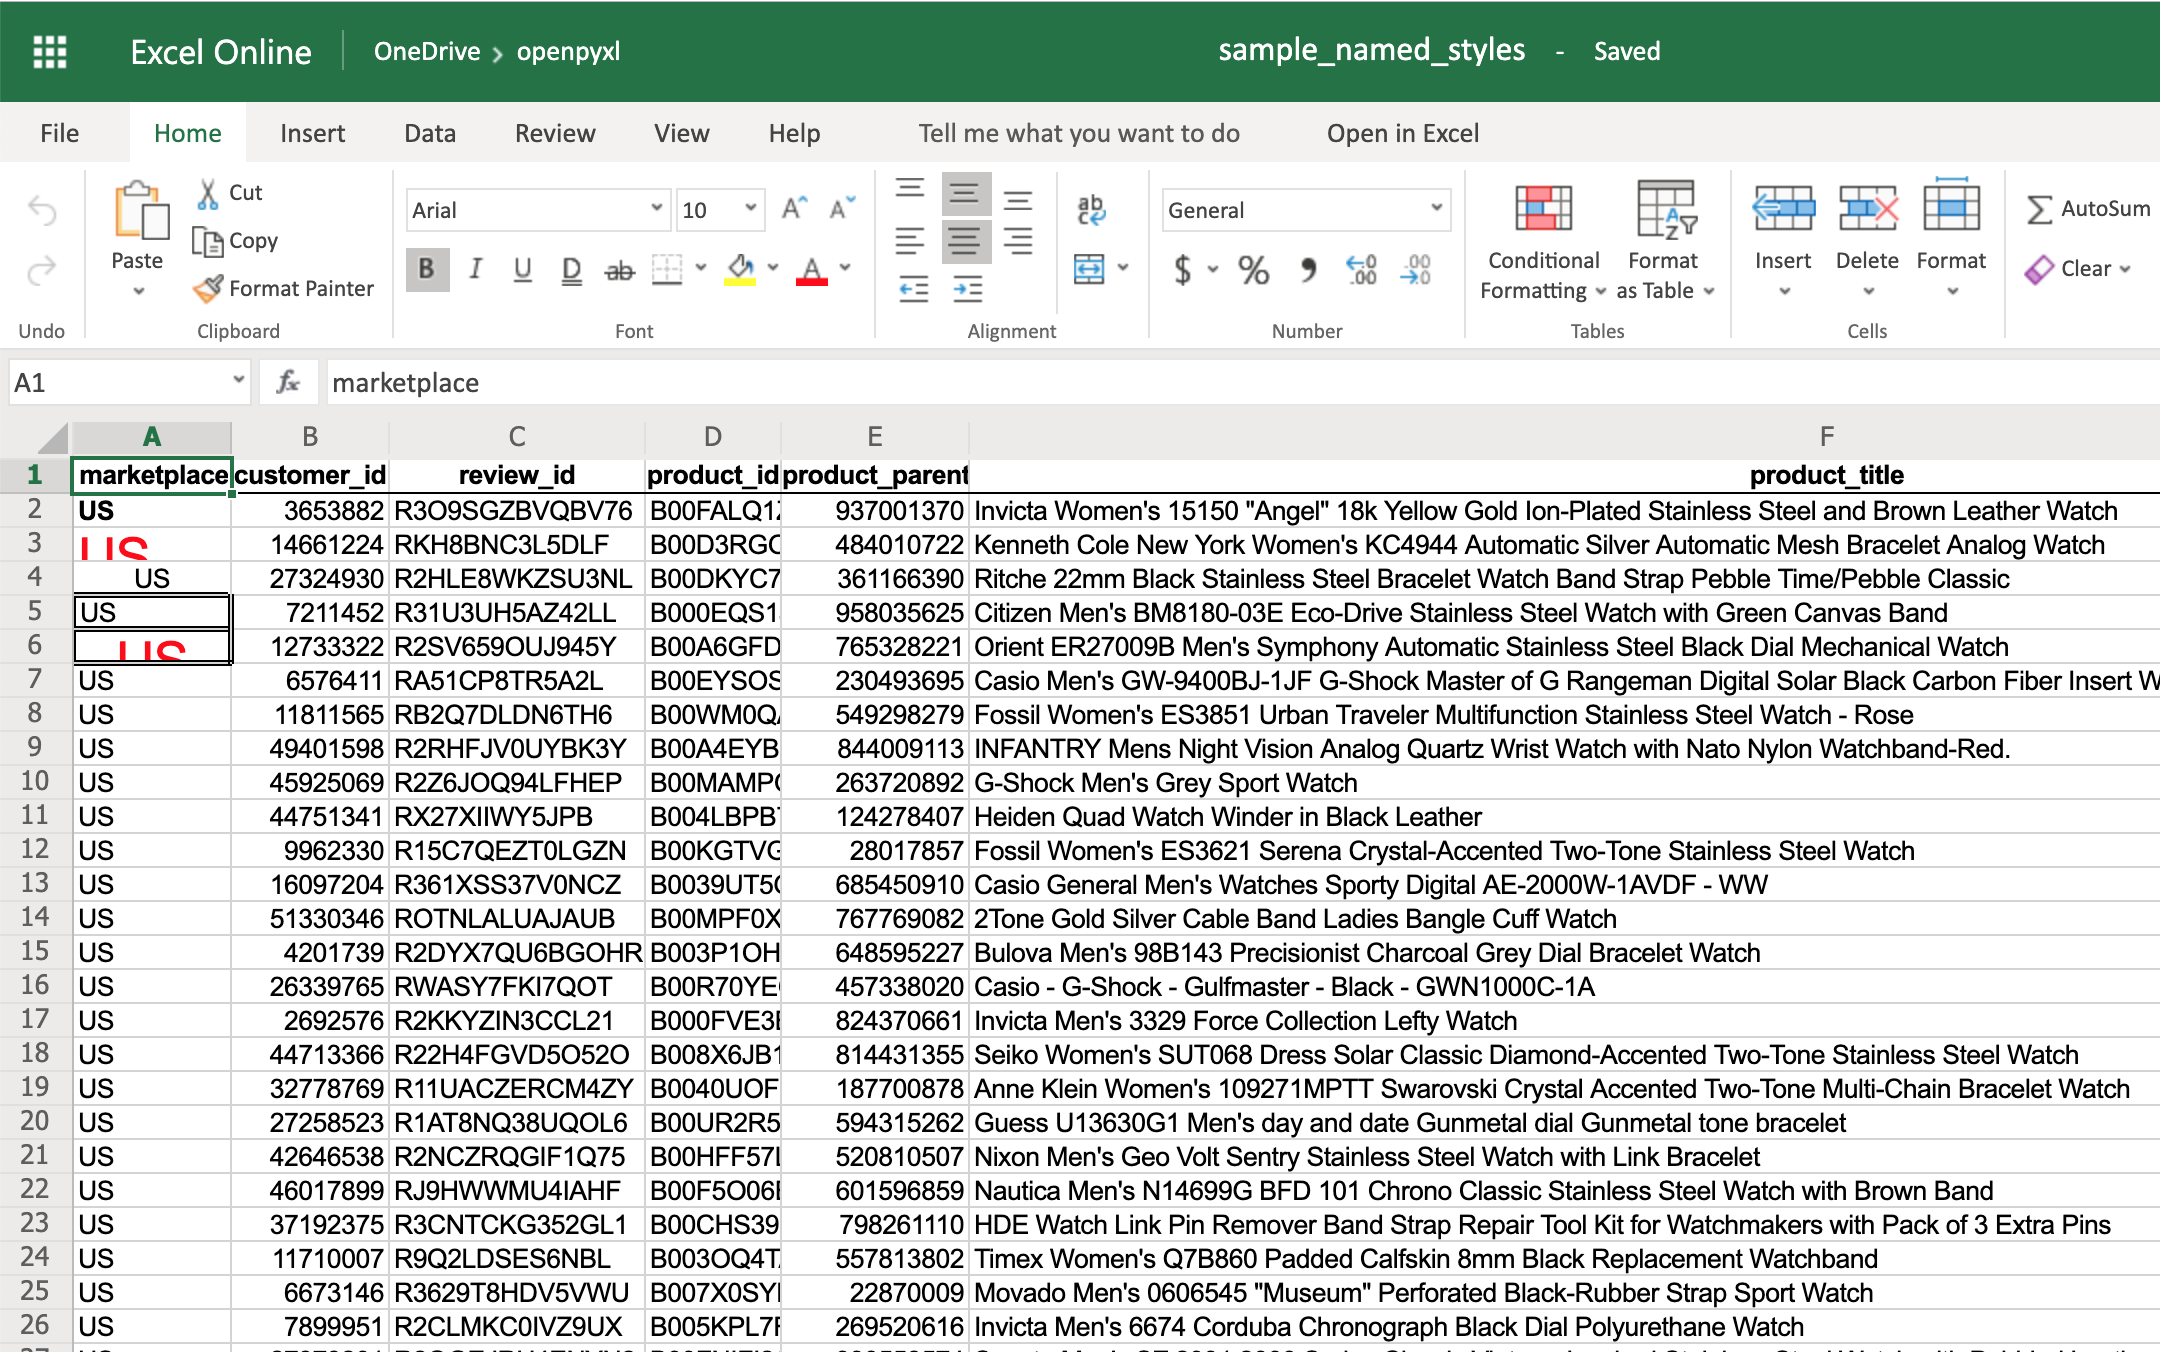
When you want to apply multiple styles to one or several cells, you can use a NamedStyle class instead, which is like a style template that you can use over and over again. Have a look at the example below:
>>>
>>> from openpyxl.styles import NamedStyle

>>> # Let's create a style template for the header row
>>> header = NamedStyle(name="header")
>>> header.font = Font(bold=True)
>>> header.border = Border(bottom=Side(border_style="thin"))
>>> header.alignment = Alignment(horizontal="center", vertical="center")

>>> # Now let's apply this to all first row (header) cells
>>> header_row = sheet[1]
>>> for cell in header_row:
...     cell.style = header

>>> workbook.save(filename="sample_styles.xlsx")
If you open the spreadsheet now, you should see that its first row is bold, the text is aligned to the center, and there’s a small bottom border! Have a look below:
As you saw above, there are many options when it comes to styling, and it depends on the use case, so feel free to check openpyxl documentation and see what other things you can do.
Conditional Formatting
This feature is one of my personal favorites when it comes to adding styles to a spreadsheet.
It’s a much more powerful approach to styling because it dynamically applies styles according to how the data in the spreadsheet changes.
In a nutshell, conditional formatting allows you to specify a list of styles to apply to a cell (or cell range) according to specific conditions.
For example, a widespread use case is to have a balance sheet where all the negative totals are in red, and the positive ones are in green. This formatting makes it much more efficient to spot good vs bad periods.
Without further ado, let’s pick our favorite spreadsheet—sample.xlsx—and add some conditional formatting.
You can start by adding a simple one that adds a red background to all reviews with less than 3 stars:
>>>
>>> from openpyxl.styles import PatternFill
>>> from openpyxl.styles.differential import DifferentialStyle
>>> from openpyxl.formatting.rule import Rule

>>> red_background = PatternFill(fgColor="00FF0000")
>>> diff_style = DifferentialStyle(fill=red_background)
>>> rule = Rule(type="expression", dxf=diff_style)
>>> rule.formula = ["$H1<3"]
>>> sheet.conditional_formatting.add("A1:O100", rule)
>>> workbook.save("sample_conditional_formatting.xlsx")
Now you’ll see all the reviews with a star rating below 3 marked with a red background:

Code-wise, the only things that are new here are the objects DifferentialStyle and Rule:
DifferentialStyleis quite similar toNamedStyle, which you already saw above, and it’s used to aggregate multiple styles such as fonts, borders, alignment, and so forth.Ruleis responsible for selecting the cells and applying the styles if the cells match the rule’s logic.
Using a Rule object, you can create numerous conditional formatting scenarios.
However, for simplicity sake, the openpyxl package offers 3 built-in formats that make it easier to create a few common conditional formatting patterns. These built-ins are:
ColorScaleIconSetDataBar
The ColorScale gives you the ability to create color gradients:
>>>
>>> from openpyxl.formatting.rule import ColorScaleRule
>>> color_scale_rule = ColorScaleRule(start_type="min",
...                                   start_color="00FF0000",  # Red
...                                   end_type="max",
...                                   end_color="0000FF00")  # Green

>>> # Again, let's add this gradient to the star ratings, column "H"
>>> sheet.conditional_formatting.add("H2:H100", color_scale_rule)
>>> workbook.save(filename="sample_conditional_formatting_color_scale.xlsx")
Now you should see a color gradient on column H, from red to green, according to the star rating:

You can also add a third color and make two gradients instead:
>>>
>>> from openpyxl.formatting.rule import ColorScaleRule
>>> color_scale_rule = ColorScaleRule(start_type="num",
...                                   start_value=1,
...                                   start_color="00FF0000",  # Red
...                                   mid_type="num",
...                                   mid_value=3,
...                                   mid_color="00FFFF00",  # Yellow
...                                   end_type="num",
...                                   end_value=5,
...                                   end_color="0000FF00")  # Green

>>> # Again, let's add this gradient to the star ratings, column "H"
>>> sheet.conditional_formatting.add("H2:H100", color_scale_rule)
>>> workbook.save(filename="sample_conditional_formatting_color_scale_3.xlsx")
This time, you’ll notice that star ratings between 1 and 3 have a gradient from red to yellow, and star ratings between 3 and 5 have a gradient from yellow to green:

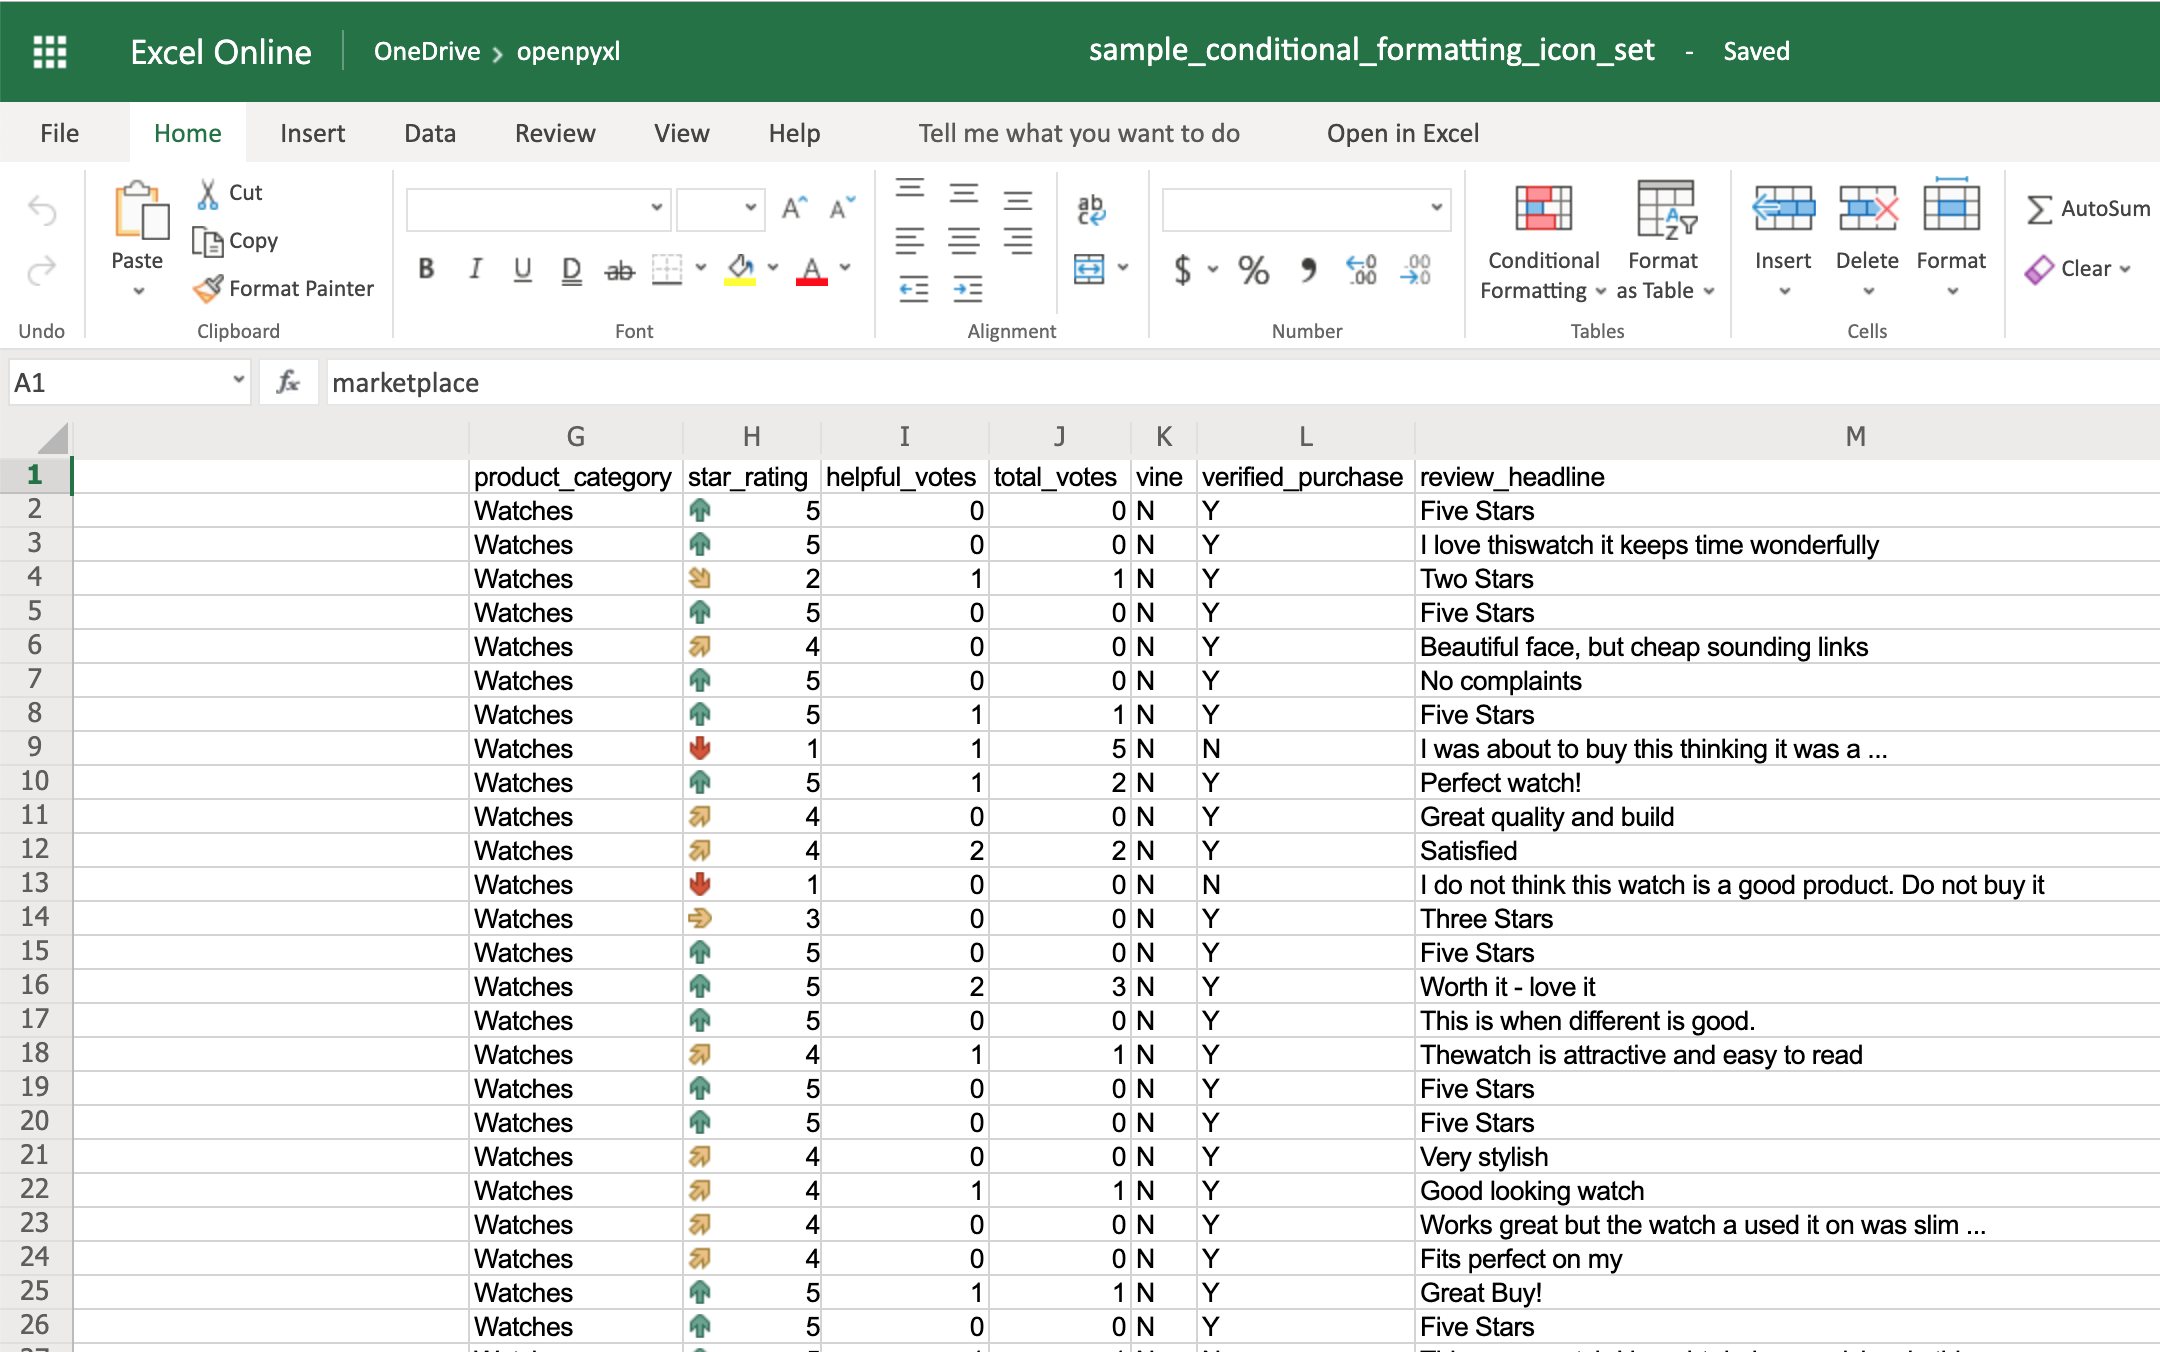
The IconSet allows you to add an icon to the cell according to its value:
>>>
>>> from openpyxl.formatting.rule import IconSetRule

>>> icon_set_rule = IconSetRule("5Arrows", "num", [1, 2, 3, 4, 5])
>>> sheet.conditional_formatting.add("H2:H100", icon_set_rule)
>>> workbook.save("sample_conditional_formatting_icon_set.xlsx")
You’ll see a colored arrow next to the star rating. This arrow is red and points down when the value of the cell is 1 and, as the rating gets better, the arrow starts pointing up and becomes green:
The openpyxl package has a full list of other icons you can use, besides the arrow.
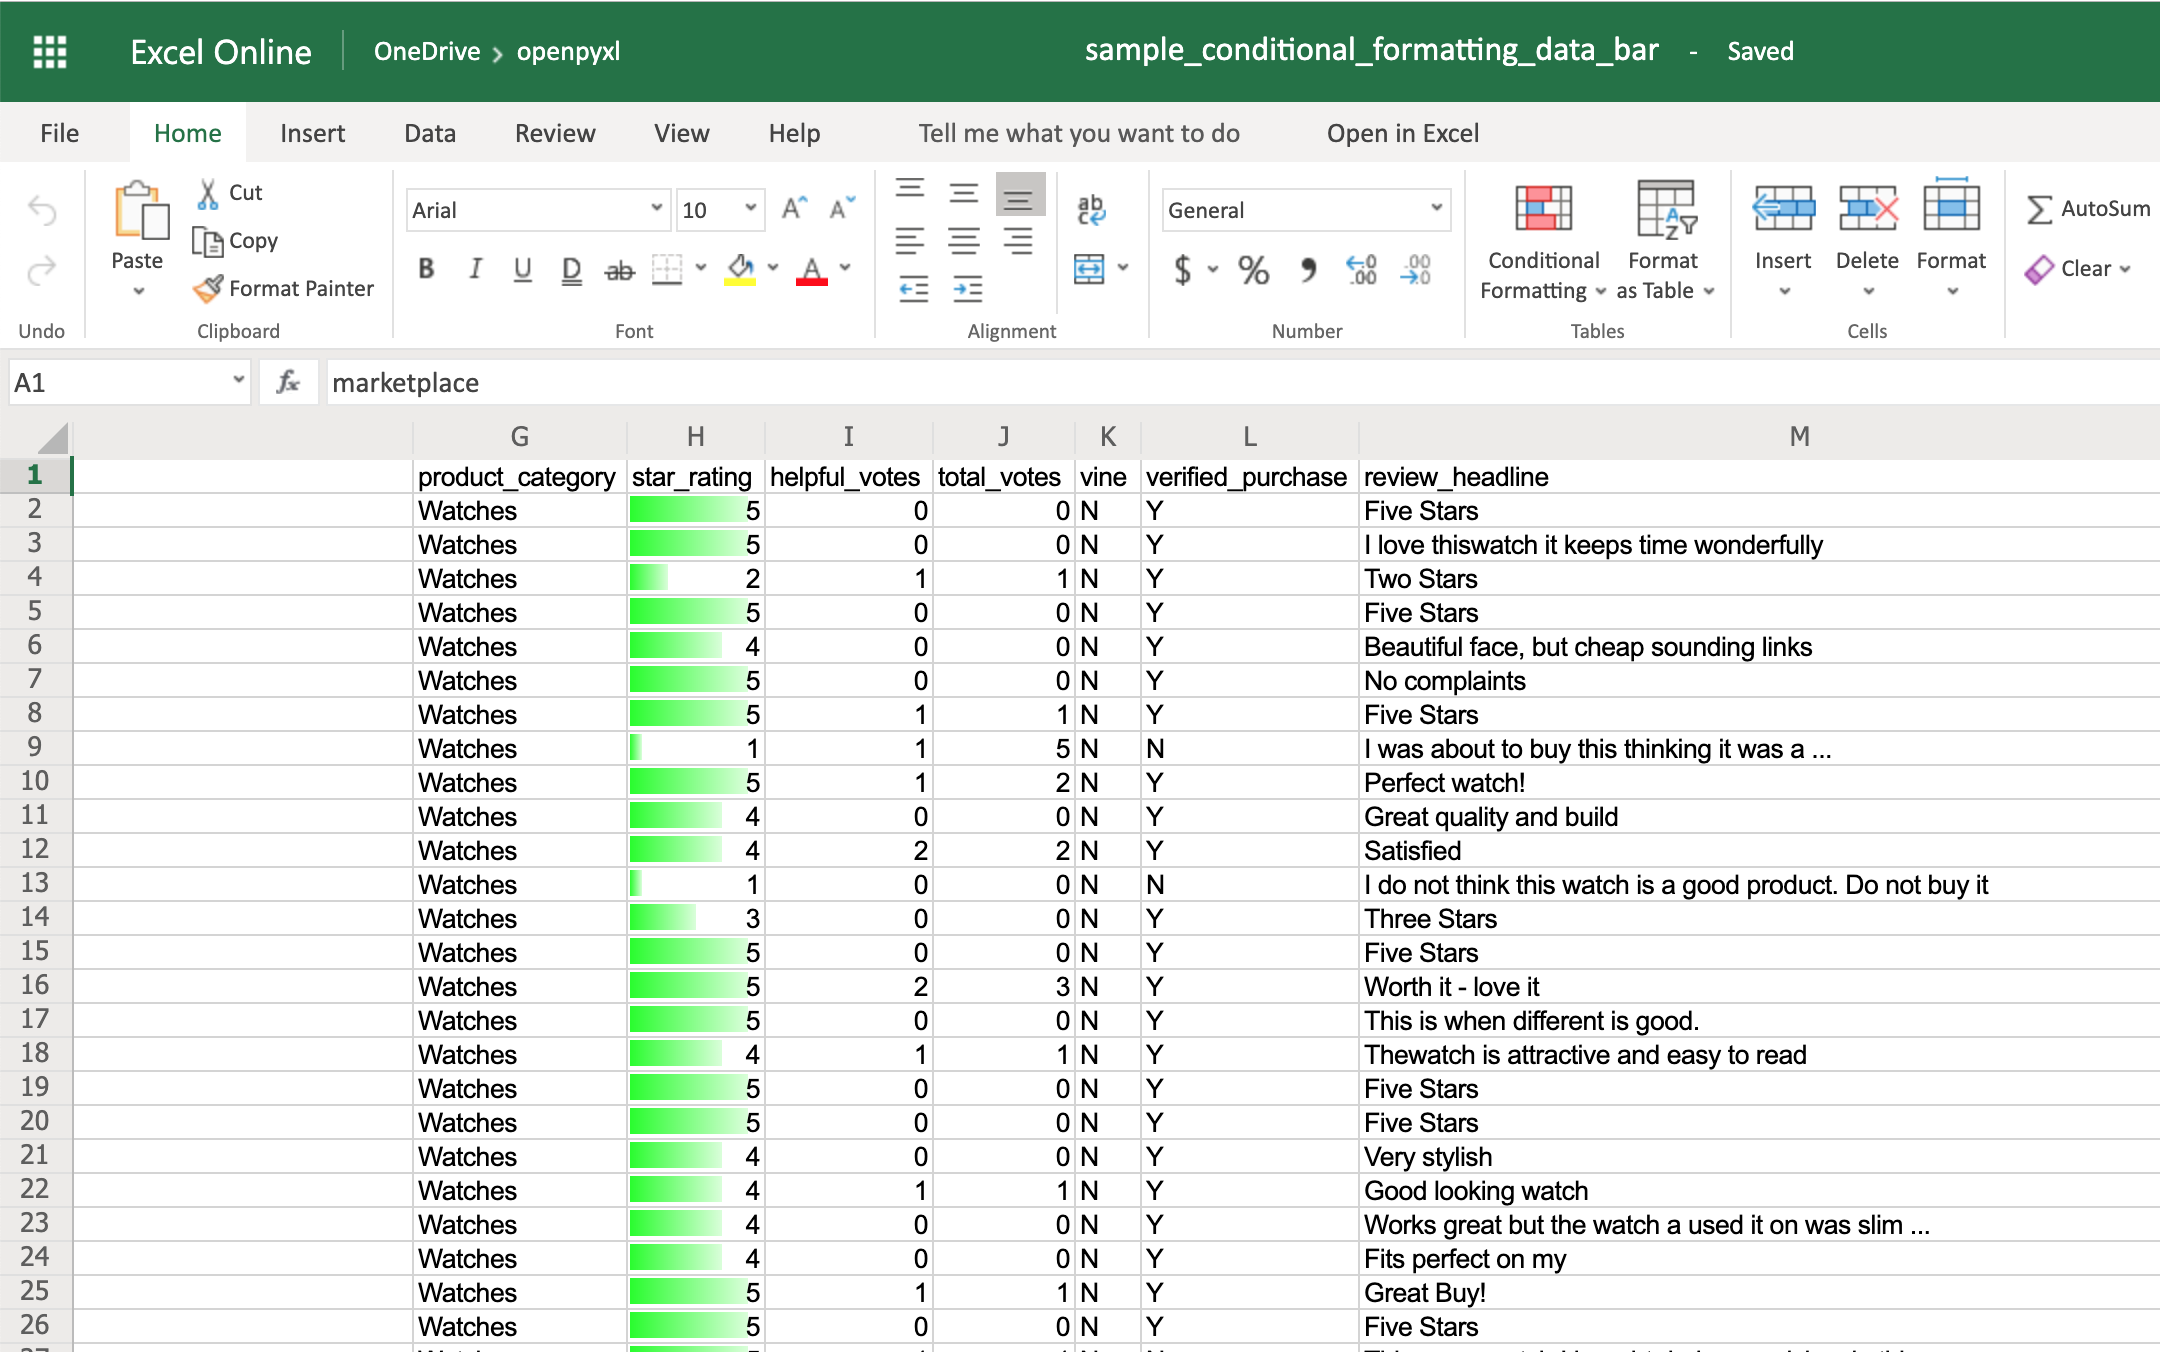
Finally, the DataBar allows you to create progress bars:
>>>
>>> from openpyxl.formatting.rule import DataBarRule

>>> data_bar_rule = DataBarRule(start_type="num",
...                             start_value=1,
...                             end_type="num",
...                             end_value="5",
...                             color="0000FF00")  # Green
>>> sheet.conditional_formatting.add("H2:H100", data_bar_rule)
>>> workbook.save("sample_conditional_formatting_data_bar.xlsx")
You’ll now see a green progress bar that gets fuller the closer the star rating is to the number 5:
As you can see, there are a lot of cool things you can do with conditional formatting.
Here, you saw only a few examples of what you can achieve with it, but check the openpyxl documentation to see a bunch of other options.
Adding Images
Even though images are not something that you’ll often see in a spreadsheet, it’s quite cool to be able to add them. Maybe you can use it for branding purposes or to make spreadsheets more personal.
To be able to load images to a spreadsheet using openpyxl, you’ll have to install Pillow:
Apart from that, you’ll also need an image. For this example, you can grab the Real Python logo below and convert it from .webp to .png using an online converter such as cloudconvert.com, save the final file as logo.png, and copy it to the root folder where you’re running your examples:
![]()
Afterward, this is the code you need to import that image into the hello_word.xlsx spreadsheet:
from openpyxl import load_workbook
from openpyxl.drawing.image import Image

# Let's use the hello_world spreadsheet since it has less data
workbook = load_workbook(filename="hello_world.xlsx")
sheet = workbook.active

logo = Image("logo.png")

# A bit of resizing to not fill the whole spreadsheet with the logo
logo.height = 150
logo.width = 150

sheet.add_image(logo, "A3")
workbook.save(filename="hello_world_logo.xlsx")
You have an image on your spreadsheet! Here it is:
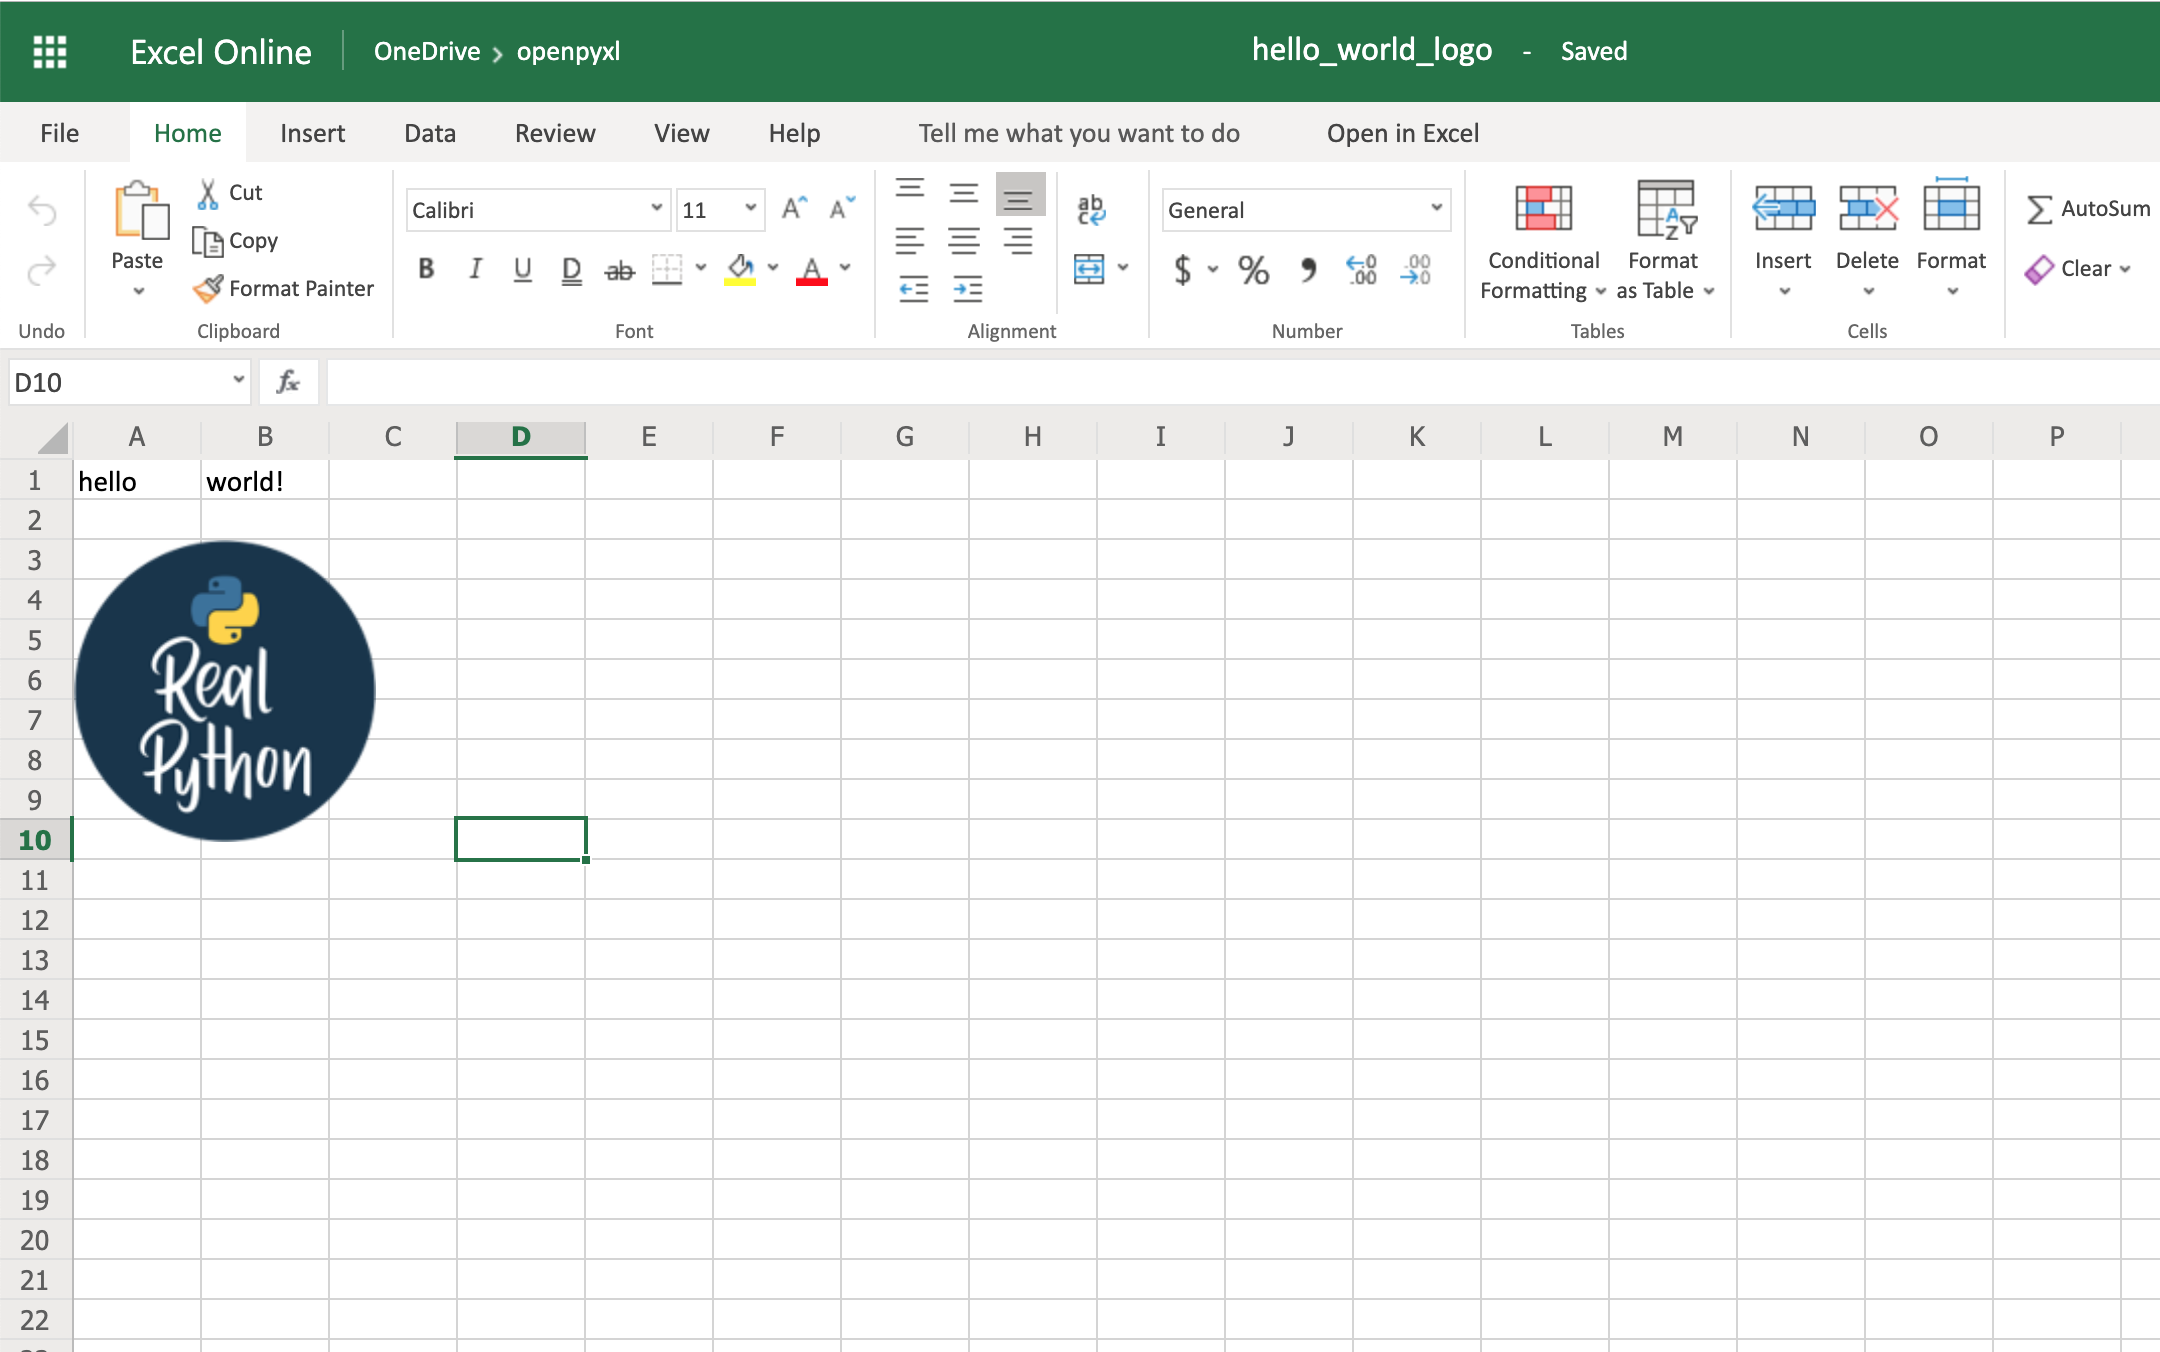
The image’s left top corner is on the cell you chose, in this case, A3.
Adding Pretty Charts
Another powerful thing you can do with spreadsheets is create an incredible variety of charts.
Charts are a great way to visualize and understand loads of data quickly. There are a lot of different chart types: bar chart, pie chart, line chart, and so on. openpyxl has support for a lot of them.
Here, you’ll see only a couple of examples of charts because the theory behind it is the same for every single chart type:
For any chart you want to build, you’ll need to define the chart type: BarChart, LineChart, and so forth, plus the data to be used for the chart, which is called Reference.
Before you can build your chart, you need to define what data you want to see represented in it. Sometimes, you can use the dataset as is, but other times you need to massage the data a bit to get additional information.
Let’s start by building a new workbook with some sample data:
 1from openpyxl import Workbook
 2from openpyxl.chart import BarChart, Reference
 3
 4workbook = Workbook()
 5sheet = workbook.active
 6
 7# Let's create some sample sales data
 8rows = [
 9    ["Product", "Online", "Store"],
10    [1, 30, 45],
11    [2, 40, 30],
12    [3, 40, 25],
13    [4, 50, 30],
14    [5, 30, 25],
15    [6, 25, 35],
16    [7, 20, 40],
17]
18
19for row in rows:
20    sheet.append(row)
Now you’re going to start by creating a bar chart that displays the total number of sales per product:
22chart = BarChart()
23data = Reference(worksheet=sheet,
24                 min_row=1,
25                 max_row=8,
26                 min_col=2,
27                 max_col=3)
28
29chart.add_data(data, titles_from_data=True)
30sheet.add_chart(chart, "E2")
31
32workbook.save("chart.xlsx")
There you have it. Below, you can see a very straightforward bar chart showing the difference between online product sales online and in-store product sales:
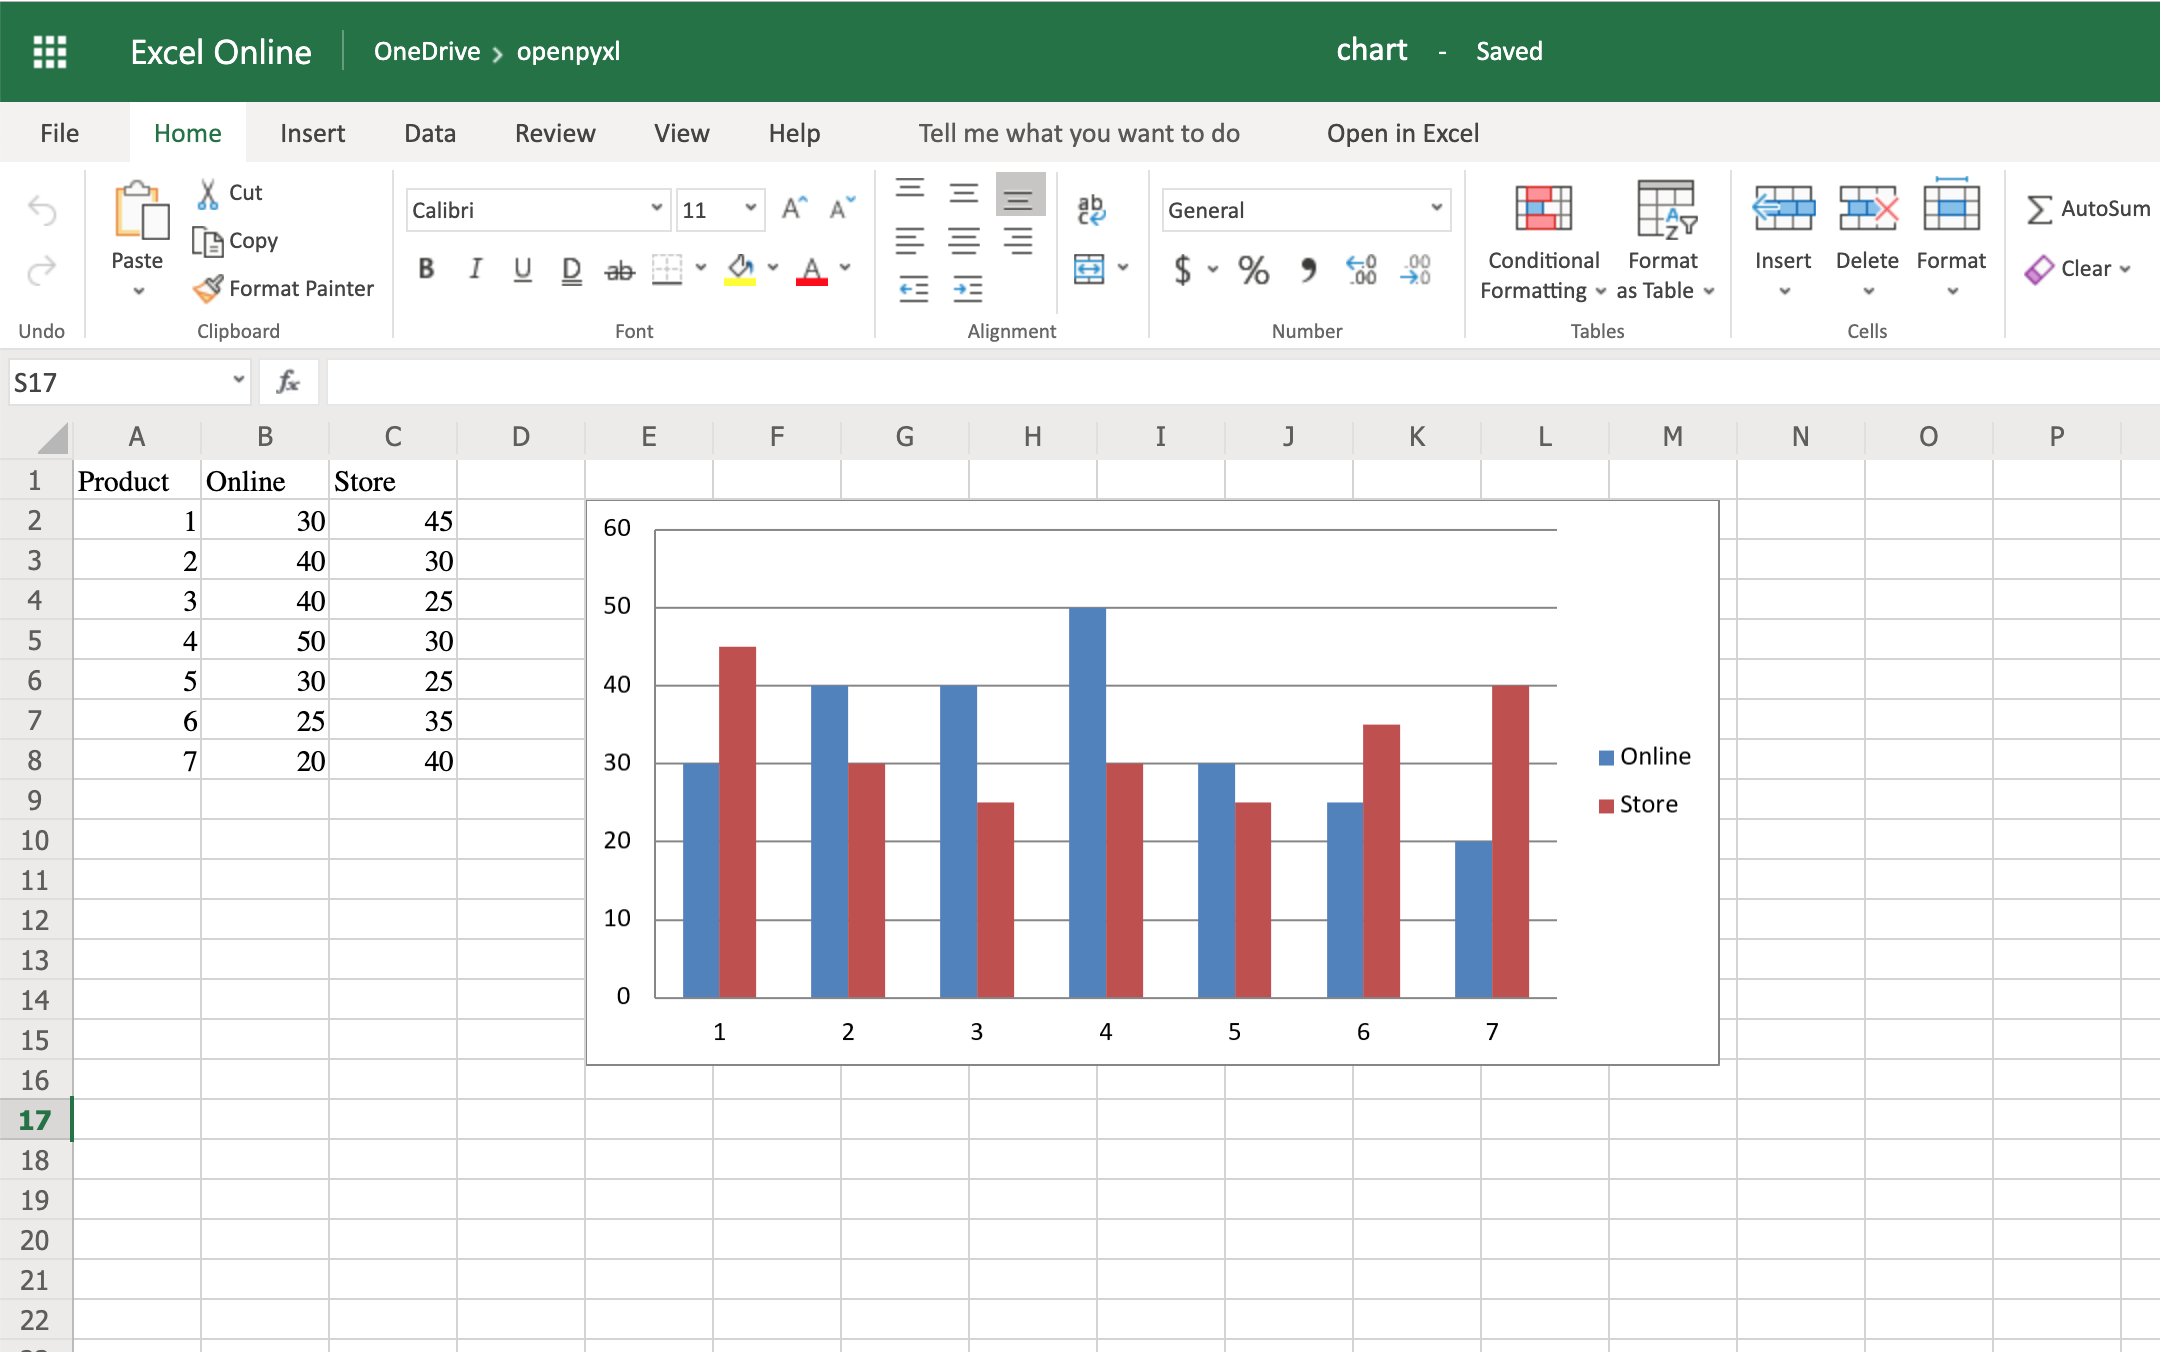
Like with images, the top left corner of the chart is on the cell you added the chart to. In your case, it was on cell E2.
Try creating a line chart instead, changing the data a bit:
 1import random
 2from openpyxl import Workbook
 3from openpyxl.chart import LineChart, Reference
 4
 5workbook = Workbook()
 6sheet = workbook.active
 7
 8# Let's create some sample sales data
 9rows = [
10    ["", "January", "February", "March", "April",
11    "May", "June", "July", "August", "September",
12     "October", "November", "December"],
13    [1, ],
14    [2, ],
15    [3, ],
16]
17
18for row in rows:
19    sheet.append(row)
20
21for row in sheet.iter_rows(min_row=2,
22                           max_row=4,
23                           min_col=2,
24                           max_col=13):
25    for cell in row:
26        cell.value = random.randrange(5, 100)
With the above code, you’ll be able to generate some random data regarding the sales of 3 different products across a whole year.
Once that’s done, you can very easily create a line chart with the following code:
28chart = LineChart()
29data = Reference(worksheet=sheet,
30                 min_row=2,
31                 max_row=4,
32                 min_col=1,
33                 max_col=13)
34
35chart.add_data(data, from_rows=True, titles_from_data=True)
36sheet.add_chart(chart, "C6")
37
38workbook.save("line_chart.xlsx")
Here’s the outcome of the above piece of code:

One thing to keep in mind here is the fact that you’re using from_rows=True when adding the data. This argument makes the chart plot row by row instead of column by column.
In your sample data, you see that each product has a row with 12 values (1 column per month). That’s why you use from_rows. If you don’t pass that argument, by default, the chart tries to plot by column, and you’ll get a month-by-month comparison of sales.
Another difference that has to do with the above argument change is the fact that our Reference now starts from the first column, min_col=1, instead of the second one. This change is needed because the chart now expects the first column to have the titles.
There are a couple of other things you can also change regarding the style of the chart. For example, you can add specific categories to the chart:
cats = Reference(worksheet=sheet,
                 min_row=1,
                 max_row=1,
                 min_col=2,
                 max_col=13)
chart.set_categories(cats)
Add this piece of code before saving the workbook, and you should see the month names appearing instead of numbers:
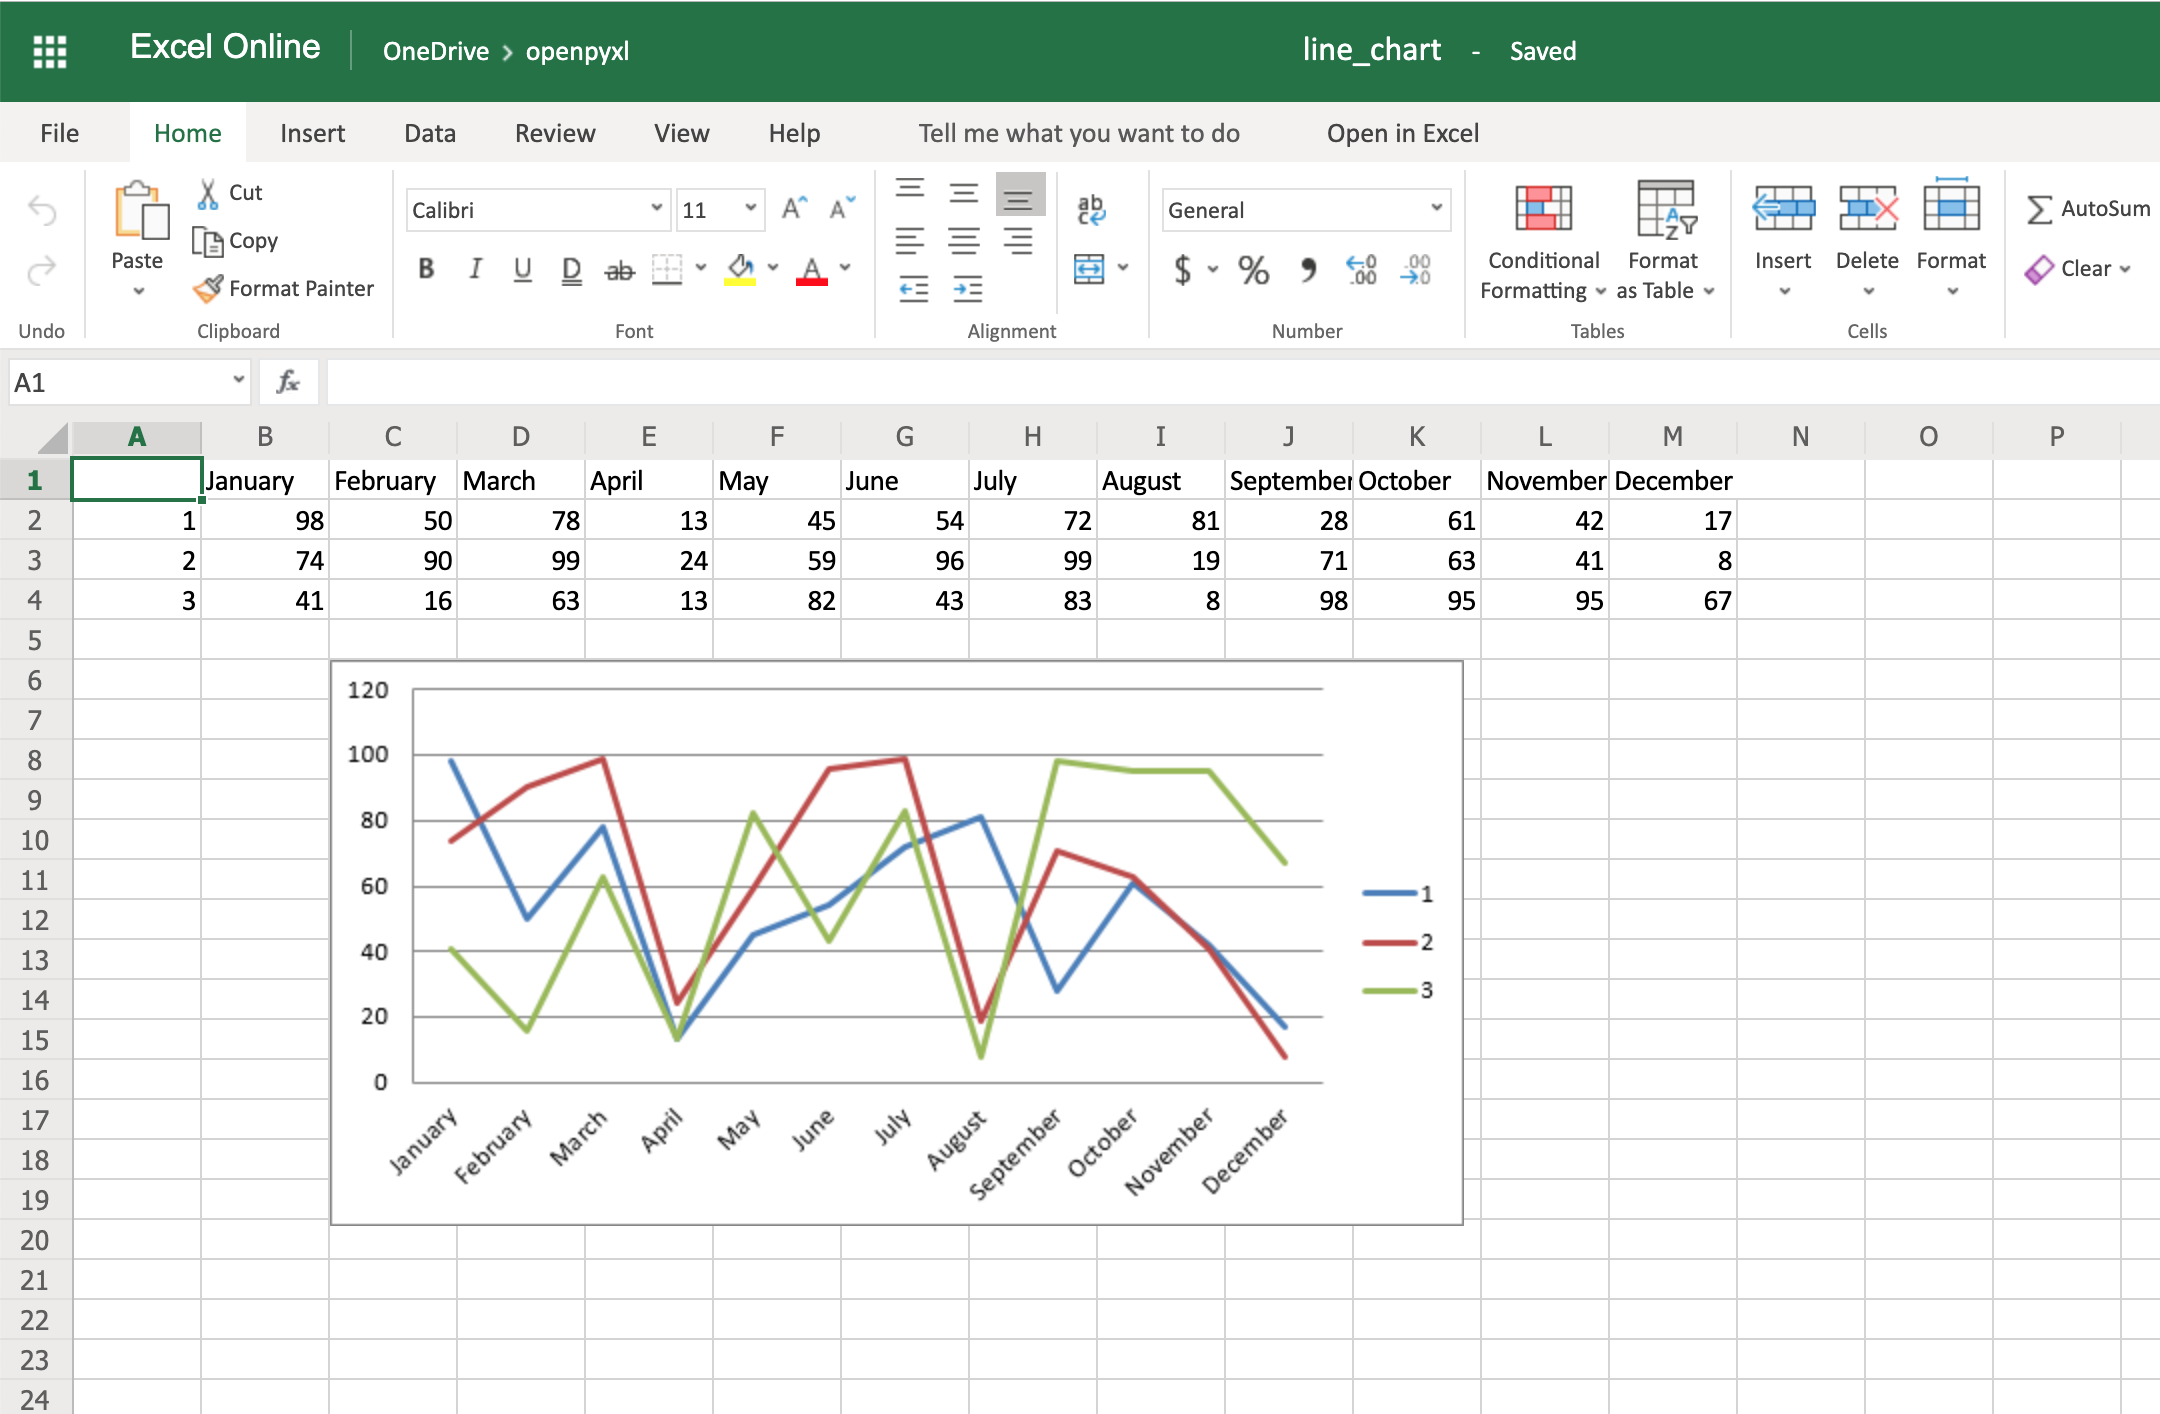
Code-wise, this is a minimal change. But in terms of the readability of the spreadsheet, this makes it much easier for someone to open the spreadsheet and understand the chart straight away.
Another thing you can do to improve the chart readability is to add an axis. You can do it using the attributes x_axis and y_axis:
chart.x_axis.title = "Months"
chart.y_axis.title = "Sales (per unit)"
This will generate a spreadsheet like the below one:
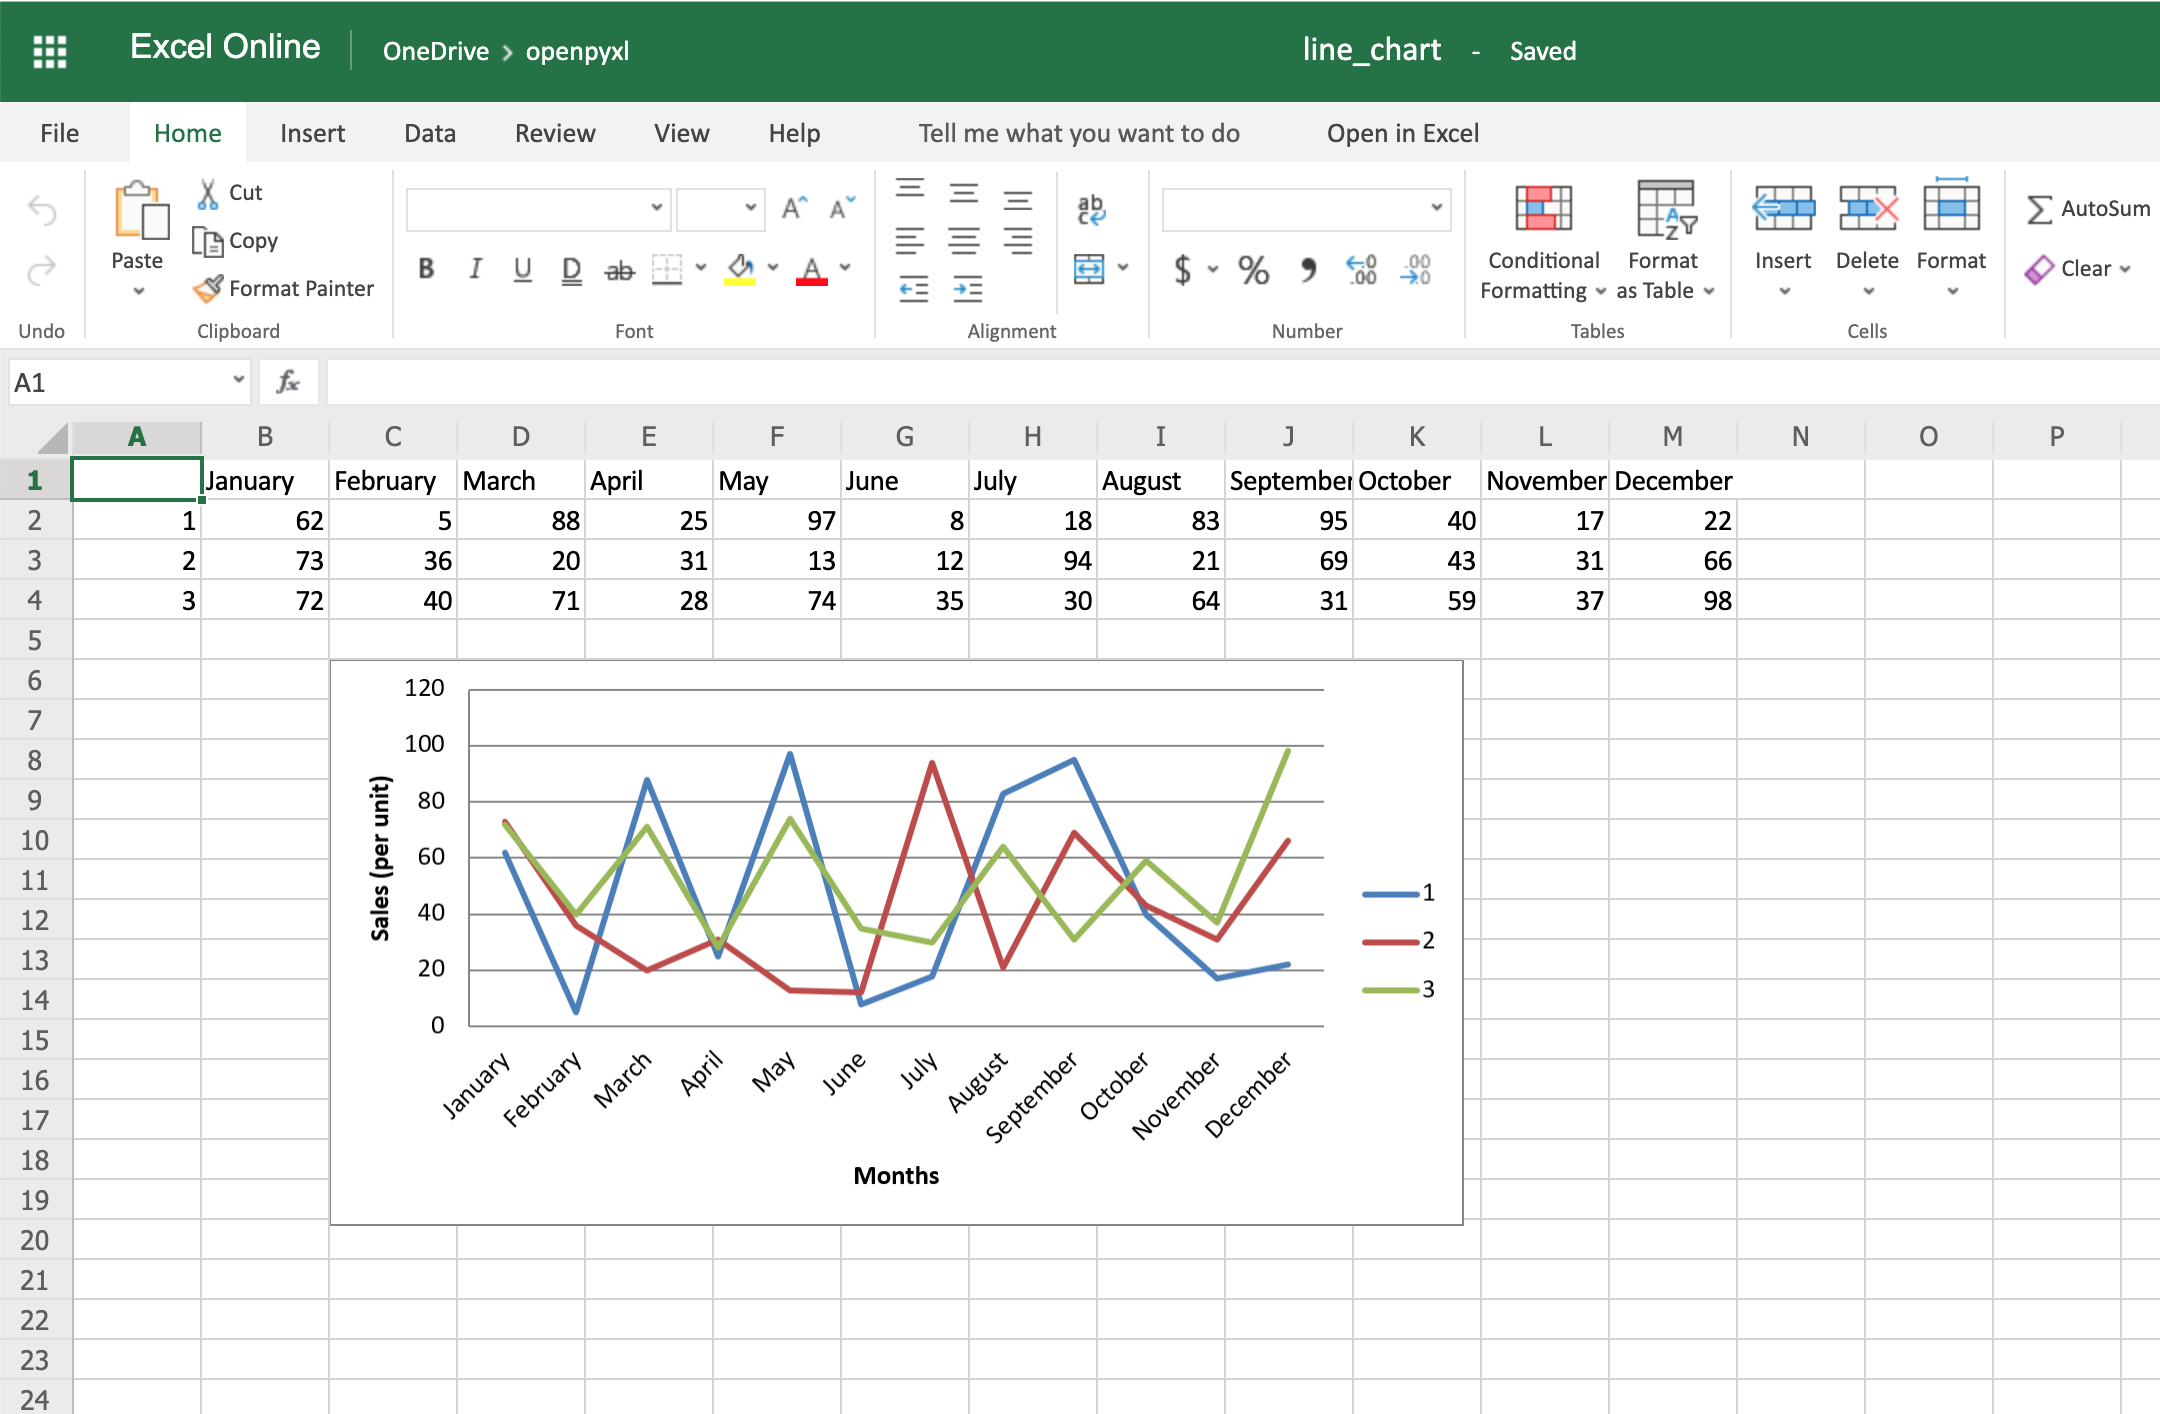
As you can see, small changes like the above make reading your chart a much easier and quicker task.
There is also a way to style your chart by using Excel’s default ChartStyle property. In this case, you have to choose a number between 1 and 48. Depending on your choice, the colors of your chart change as well:
# You can play with this by choosing any number between 1 and 48
chart.style = 24
With the style selected above, all lines have some shade of orange:

There is no clear documentation on what each style number looks like, but this spreadsheet has a few examples of the styles available.
Here’s the full code used to generate the line chart with categories, axis titles, and style:
import random
from openpyxl import Workbook
from openpyxl.chart import LineChart, Reference

workbook = Workbook()
sheet = workbook.active

# Let's create some sample sales data
rows = [
    ["", "January", "February", "March", "April",
    "May", "June", "July", "August", "September",
     "October", "November", "December"],
    [1, ],
    [2, ],
    [3, ],
]

for row in rows:
    sheet.append(row)

for row in sheet.iter_rows(min_row=2,
                           max_row=4,
                           min_col=2,
                           max_col=13):
    for cell in row:
        cell.value = random.randrange(5, 100)

# Create a LineChart and add the main data
chart = LineChart()
data = Reference(worksheet=sheet,
                           min_row=2,
                           max_row=4,
                           min_col=1,
                           max_col=13)
chart.add_data(data, titles_from_data=True, from_rows=True)

# Add categories to the chart
cats = Reference(worksheet=sheet,
                 min_row=1,
                 max_row=1,
                 min_col=2,
                 max_col=13)
chart.set_categories(cats)

# Rename the X and Y Axis
chart.x_axis.title = "Months"
chart.y_axis.title = "Sales (per unit)"

# Apply a specific Style
chart.style = 24

# Save!
sheet.add_chart(chart, "C6")
workbook.save("line_chart.xlsx")
There are a lot more chart types and customization you can apply, so be sure to check out the package documentation on this if you need some specific formatting.
Convert Python Classes to Excel Spreadsheet
You already saw how to convert an Excel spreadsheet’s data into Python classes, but now let’s do the opposite.
Let’s imagine you have a database and are using some Object-Relational Mapping (ORM) to map DB objects into Python classes. Now, you want to export those same objects into a spreadsheet.
Let’s assume the following data classes to represent the data coming from your database regarding product sales:
from dataclasses import dataclass
from typing import List

@dataclass
class Sale:
    quantity: int

@dataclass
class Product:
    id: str
    name: str
    sales: List[Sale]
Now, let’s generate some random data, assuming the above classes are stored in a db_classes.py file:
 1import random
 2
 3# Ignore these for now. You'll use them in a sec ;)
 4from openpyxl import Workbook
 5from openpyxl.chart import LineChart, Reference
 6
 7from db_classes import Product, Sale
 8
 9products = []
10
11# Let's create 5 products
12for idx in range(1, 6):
13    sales = []
14
15    # Create 5 months of sales
16    for _ in range(5):
17        sale = Sale(quantity=random.randrange(5, 100))
18        sales.append(sale)
19
20    product = Product(id=str(idx),
21                      name="Product %s" % idx,
22                      sales=sales)
23    products.append(product)
By running this piece of code, you should get 5 products with 5 months of sales with a random quantity of sales for each month.
Now, to convert this into a spreadsheet, you need to iterate over the data and append it to the spreadsheet:
25workbook = Workbook()
26sheet = workbook.active
27
28# Append column names first
29sheet.append(["Product ID", "Product Name", "Month 1",
30              "Month 2", "Month 3", "Month 4", "Month 5"])
31
32# Append the data
33for product in products:
34    data = [product.id, product.name]
35    for sale in product.sales:
36        data.append(sale.quantity)
37    sheet.append(data)
That’s it. That should allow you to create a spreadsheet with some data coming from your database.
However, why not use some of that cool knowledge you gained recently to add a chart as well to display that data more visually?
All right, then you could probably do something like this:
38chart = LineChart()
39data = Reference(worksheet=sheet,
40                 min_row=2,
41                 max_row=6,
42                 min_col=2,
43                 max_col=7)
44
45chart.add_data(data, titles_from_data=True, from_rows=True)
46sheet.add_chart(chart, "B8")
47
48cats = Reference(worksheet=sheet,
49                 min_row=1,
50                 max_row=1,
51                 min_col=3,
52                 max_col=7)
53chart.set_categories(cats)
54
55chart.x_axis.title = "Months"
56chart.y_axis.title = "Sales (per unit)"
57
58workbook.save(filename="oop_sample.xlsx")
Now we’re talking! Here’s a spreadsheet generated from database objects and with a chart and everything:

That’s a great way for you to wrap up your new knowledge of charts!
Bonus: Working With Pandas
Even though you can use Pandas to handle Excel files, there are few things that you either can’t accomplish with Pandas or that you’d be better off just using openpyxl directly.
For example, some of the advantages of using openpyxl are the ability to easily customize your spreadsheet with styles, conditional formatting, and such.
But guess what, you don’t have to worry about picking. In fact, openpyxl has support for both converting data from a Pandas DataFrame into a workbook or the opposite, converting an openpyxl workbook into a Pandas DataFrame.
First things first, remember to install the pandas package:
Then, let’s create a sample DataFrame:
 1import pandas as pd
 2
 3data = {
 4    "Product Name": ["Product 1", "Product 2"],
 5    "Sales Month 1": [10, 20],
 6    "Sales Month 2": [5, 35],
 7}
 8df = pd.DataFrame(data)
Now that you have some data, you can use .dataframe_to_rows() to convert it from a DataFrame into a worksheet:
10from openpyxl import Workbook
11from openpyxl.utils.dataframe import dataframe_to_rows
12
13workbook = Workbook()
14sheet = workbook.active
15
16for row in dataframe_to_rows(df, index=False, header=True):
17    sheet.append(row)
18
19workbook.save("pandas.xlsx")
You should see a spreadsheet that looks like this:
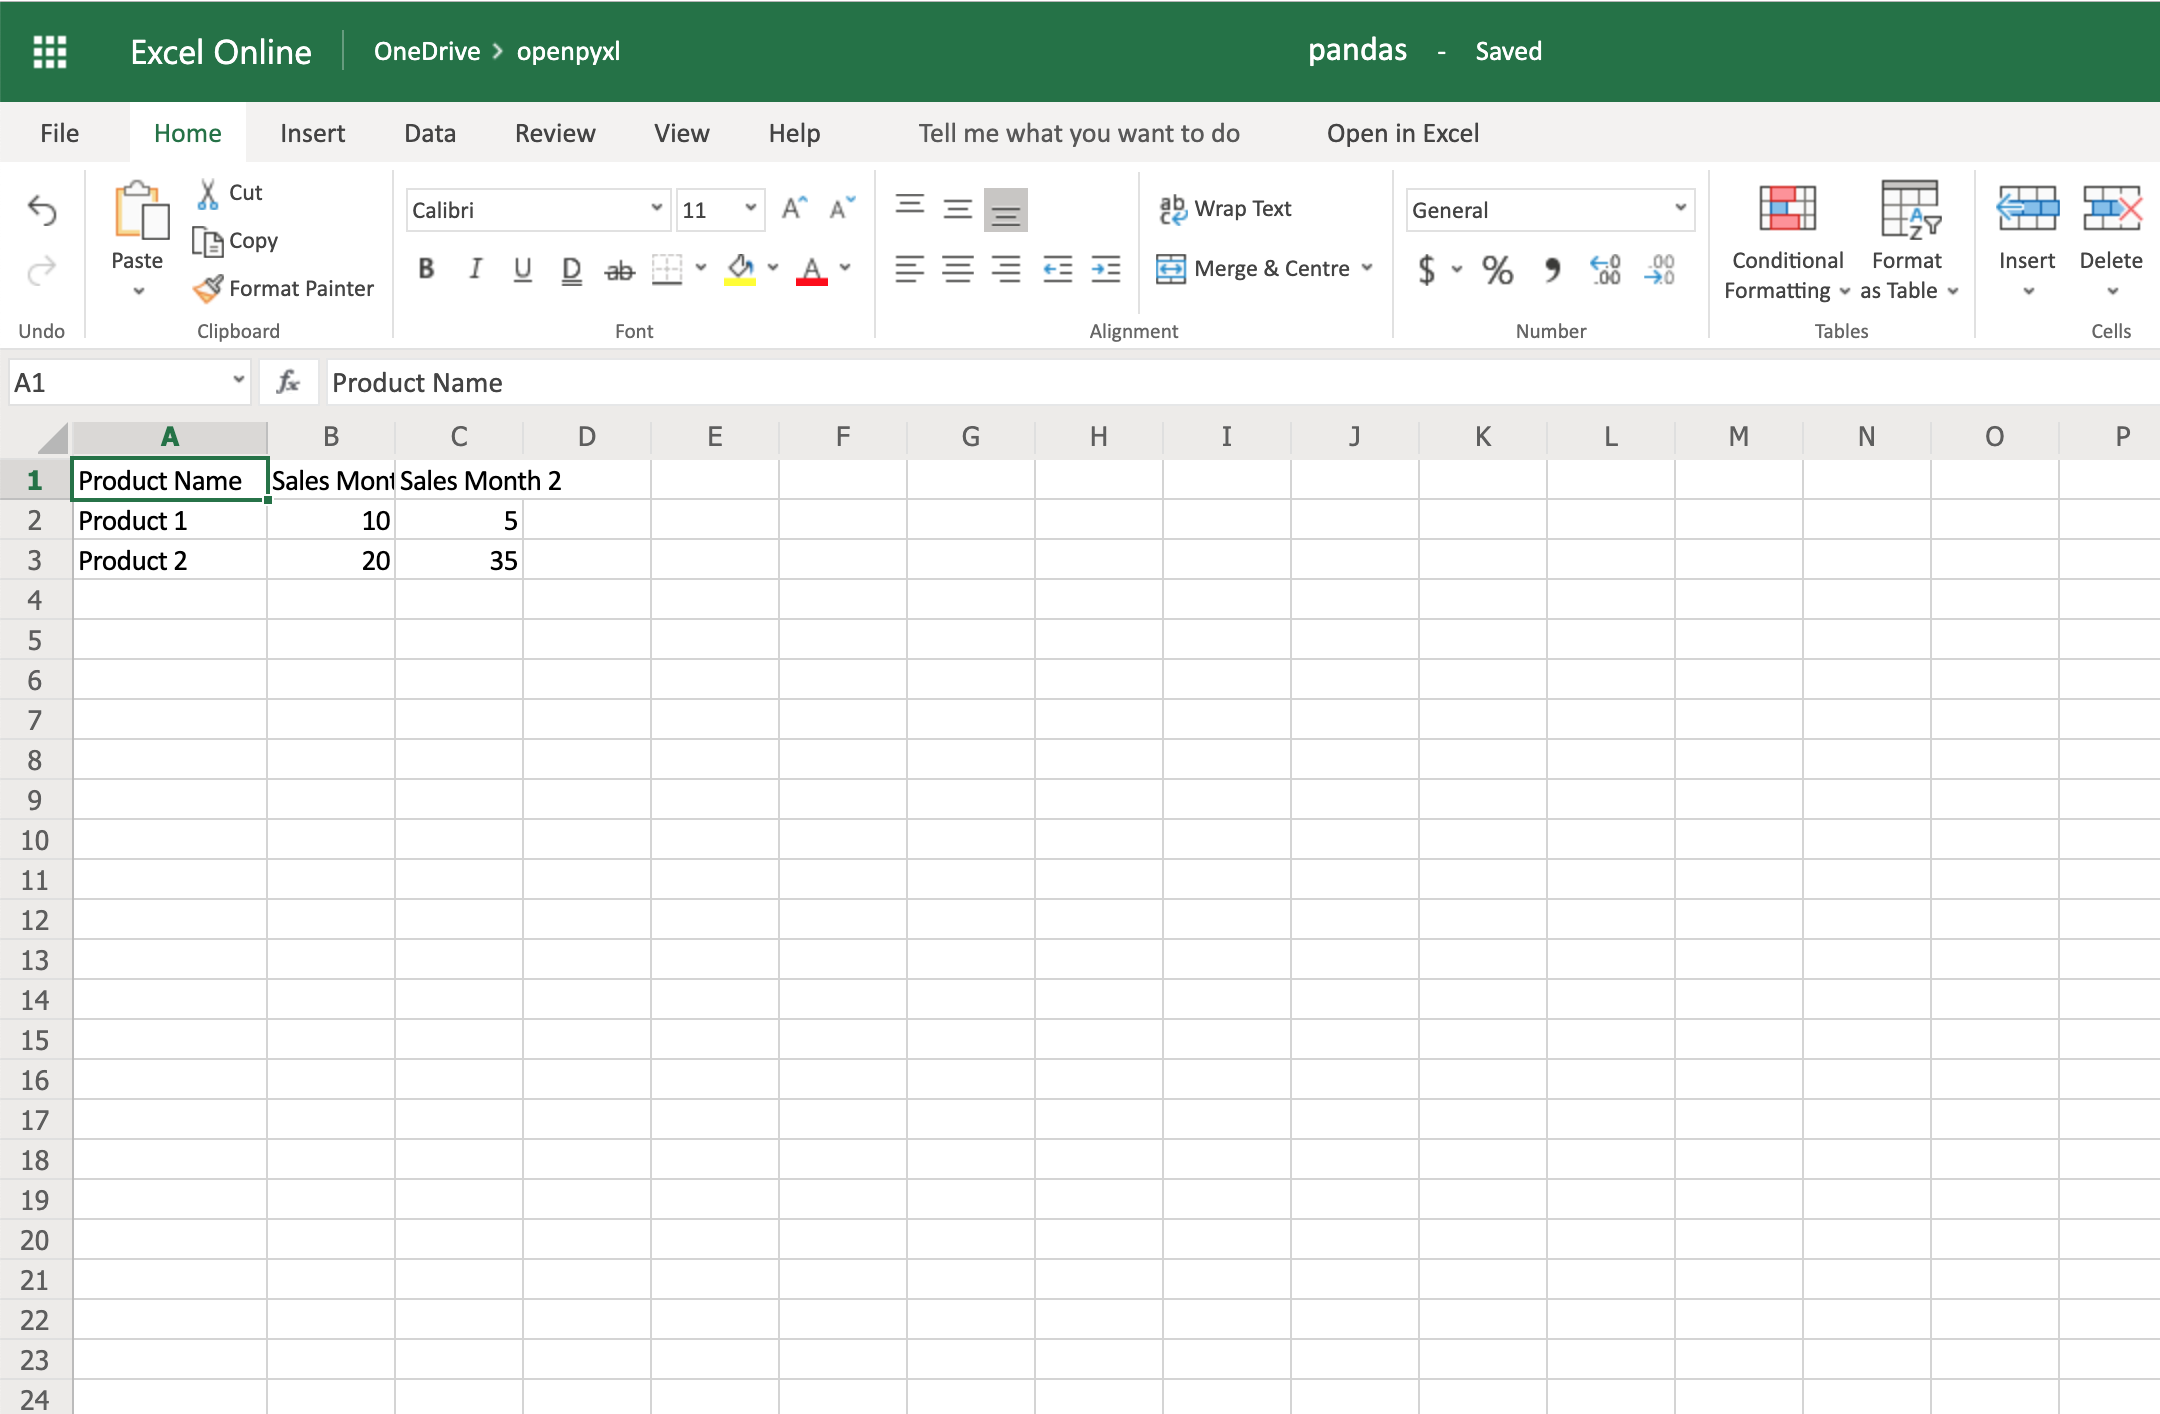
If you want to add the DataFrame’s index, you can change index=True, and it adds each row’s index into your spreadsheet.
On the other hand, if you want to convert a spreadsheet into a DataFrame, you can also do it in a very straightforward way like so:
import pandas as pd
from openpyxl import load_workbook

workbook = load_workbook(filename="sample.xlsx")
sheet = workbook.active

values = sheet.values
df = pd.DataFrame(values)
Alternatively, if you want to add the correct headers and use the review ID as the index, for example, then you can also do it like this instead:
import pandas as pd
from openpyxl import load_workbook
from mapping import REVIEW_ID

workbook = load_workbook(filename="sample.xlsx")
sheet = workbook.active

data = sheet.values

# Set the first row as the columns for the DataFrame
cols = next(data)
data = list(data)

# Set the field "review_id" as the indexes for each row
idx = [row[REVIEW_ID] for row in data]

df = pd.DataFrame(data, index=idx, columns=cols)
Using indexes and columns allows you to access data from your DataFrame easily:
>>>
>>> df.columns
Index(['marketplace', 'customer_id', 'review_id', 'product_id',
       'product_parent', 'product_title', 'product_category', 'star_rating',
       'helpful_votes', 'total_votes', 'vine', 'verified_purchase',
       'review_headline', 'review_body', 'review_date'],
      dtype='object')

>>> # Get first 10 reviews' star rating
>>> df["star_rating"][:10]
R3O9SGZBVQBV76    5
RKH8BNC3L5DLF     5
R2HLE8WKZSU3NL    2
R31U3UH5AZ42LL    5
R2SV659OUJ945Y    4
RA51CP8TR5A2L     5
RB2Q7DLDN6TH6     5
R2RHFJV0UYBK3Y    1
R2Z6JOQ94LFHEP    5
RX27XIIWY5JPB     4
Name: star_rating, dtype: int64

>>> # Grab review with id "R2EQL1V1L6E0C9", using the index
>>> df.loc["R2EQL1V1L6E0C9"]
marketplace               US
customer_id         15305006
review_id     R2EQL1V1L6E0C9
product_id        B004LURNO6
product_parent     892860326
review_headline   Five Stars
review_body          Love it
review_date       2015-08-31
Name: R2EQL1V1L6E0C9, dtype: object
There you go, whether you want to use openpyxl to prettify your Pandas dataset or use Pandas to do some hardcore algebra, you now know how to switch between both packages.
Conclusion
Phew, after that long read, you now know how to work with spreadsheets in Python! You can rely on openpyxl, your trustworthy companion, to:
- Extract valuable information from spreadsheets in a Pythonic manner
- Create your own spreadsheets, no matter the complexity level
- Add cool features such as conditional formatting or charts to your spreadsheets
There are a few other things you can do with openpyxl that might not have been covered in this tutorial, but you can always check the package’s official documentation website to learn more about it. You can even venture into checking its source code and improving the package further.
Feel free to leave any comments below if you have any questions, or if there’s any section you’d love to hear more about.
Watch Now This tutorial has a related video course created by the Real Python team. Watch it together with the written tutorial to deepen your understanding: Editing Excel Spreadsheets in Python With openpyxl
There are a couple of fundamental actions that you will do with Microsoft Excel documents. One of the most basic is the act of reading data from an Excel file. You will be learning how to get data from your Excel spreadsheets.
Editor’s note: This article is based on a chapter from the book: Automating Excel with Python. You can order a copy on Gumroad or Kickstarter.
Before you dive into automating Excel with Python, you should understand some of the common terminologies:
- Spreadsheet or Workbook – The file itself (.xls or .xlsx).
- Worksheet or Sheet – A single sheet of content within a Workbook. Spreadsheets can contain multiple Worksheets.
- Column – A vertical line of data labeled with letters, starting with “A”.
- Row – A horizontal line of data labeled with numbers, starting with 1.
- Cell – A combination of Column and Row, like “A1”.
Now that you have some basic understanding of the vocabulary, you can move on.
In this chapter, you will learn how to do the following tasks:
- Open a spreadsheet
- Read specific cells
- Read cells from a specific row
- Read cells from a specific column
- Read cells from multiple rows or columns
- Read cells from a range
- Read all cells in all sheets
You can get started by learning how to open a workbook in the next section!
Open a Spreadsheet
The first item that you need is a Microsoft Excel file. You can use the file that is in this GitHub code repository. There is a file in the chapter 2 folder called books.xlsx that you will use here.
It has two sheets in it. Here is a screenshot of the first sheet:
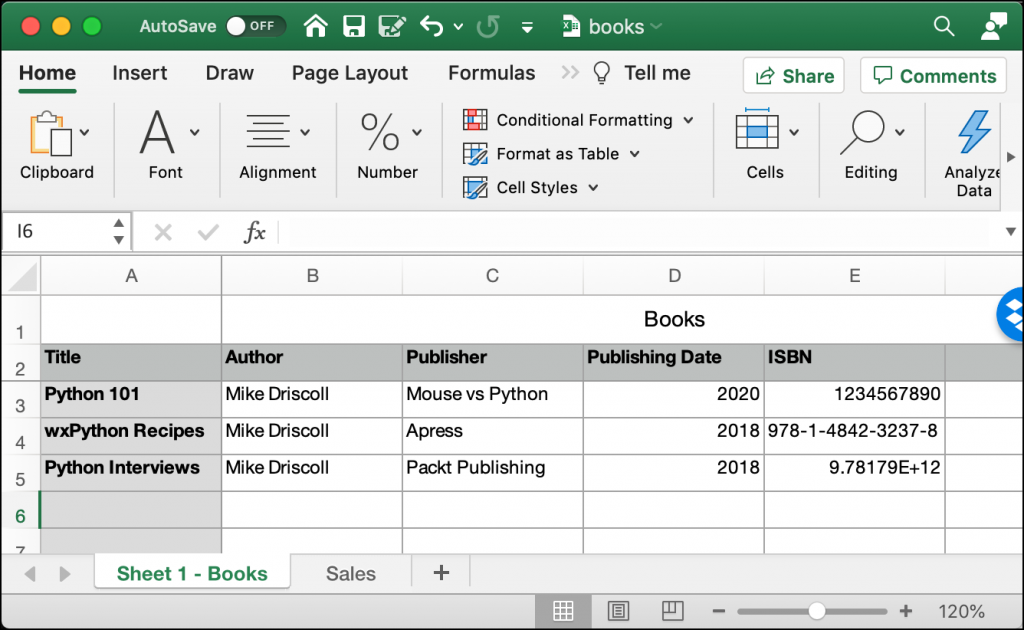
For completeness, here is a screenshot of the second sheet:
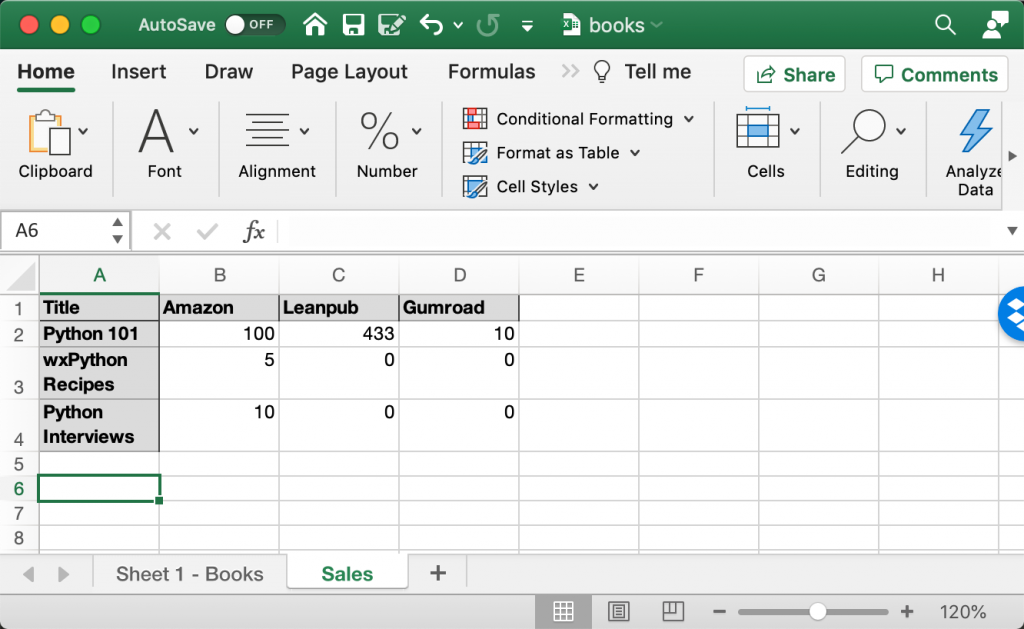
Note: The data in these sheets are inaccurate, but they help learn how to use OpenPyXL.
Now you’re ready to start coding! Open up your favorite Python editor and create a new file named open_workbook.py. Then add the following code to your file:
# open_workbook.py

from openpyxl import load_workbook


def open_workbook(path):
    workbook = load_workbook(filename=path)
    print(f"Worksheet names: {workbook.sheetnames}")
    sheet = workbook.active
    print(sheet)
    print(f"The title of the Worksheet is: {sheet.title}")


if __name__ == "__main__":
    open_workbook("books.xlsx")
The first step in this code is to import load_workbook() from the openpyxl package. The load_workbook() function will load up your Excel file and return it as a Python object. You can then interact with that Python object like you would any other object in Python.
You can get a list of the worksheets in the Excel file by accessing the sheetnames attribute. This list contains the titles of the worksheets from left to right in your Excel file. Your code will print out this list.
Next, you grab the currently active sheet. If your workbook only has one worksheet, then that sheet will be the active one. If your workbook has multiple worksheets, as this one does, then the last worksheet will be the active one.
The last two lines of your function print out the Worksheet object and the title of the active worksheet.
What if you want to select a specific worksheet to work on, though? To learn how to accomplish that, create a new file and name it read_specific_sheet.py.
Then enter the following code:
# read_specific_sheet.py

from openpyxl import load_workbook


def open_workbook(path, sheet_name):
    workbook = load_workbook(filename=path)
    if sheet_name in workbook.sheetnames:
        sheet = workbook[sheet_name]
        print(f"The title of the Worksheet is: {sheet.title}")
        print(f"Cells that contain data: {sheet.calculate_dimension()}")


if __name__ == "__main__":
    open_workbook("books.xlsx", sheet_name="Sales")
Your function, open_workbook() now accepts a sheet_name. sheet_name is a string that matches the title of the worksheet that you want to read. You check to see if the sheet_name is in the workbook.sheetnames in your code. If it is, you select that sheet by accessing it using workbook[sheet_name].
Then you print out the sheet’s title to verify that you have the right sheet. You also call something new: calculate_dimension(). That method returns the cells that contain data in the worksheet. In this case, it will print out that “A1:D4” has data in them.
Now you are ready to move on and learn how to read data from the cells themselves.
Read Specific Cells
There are a lot of different ways to read cells using OpenPyXL. To start things off, you will learn how to read the contents of specific cells.
Create a new file in your Python editor and name it reading_specific_cells.py. Then enter the following code:
# reading_specific_cells.py

from openpyxl import load_workbook


def get_cell_info(path):
    workbook = load_workbook(filename=path)
    sheet = workbook.active
    print(sheet)
    print(f'The title of the Worksheet is: {sheet.title}')
    print(f'The value of A2 is {sheet["A2"].value}')
    print(f'The value of A3 is {sheet["A3"].value}')
    cell = sheet['B3']
    print(f'The variable "cell" is {cell.value}')

if __name__ == '__main__':
    get_cell_info('books.xlsx')
In this example, there are three hard-coded cells: A2, A3 and B3. You can access their values by using dictionary-like access: sheet["A2"].value. Alternatively, you can assign sheet["A2"] to a variable and then do something like cell.value to get the cell’s value.
You can see both of these methods demonstrated in your code above.
When you run this code, you should see the following output:
<Worksheet "Sales">
The title of the Worksheet is: Sales
The value of A2 is 'Python 101'
The value of A3 is 'wxPython Recipes'
The variable "cell" is 5
This output shows how you can easily extract specific cell values from Excel using Python.
Now you’re ready to learn how you can read the data from a specific row of cells!
Read Cells From Specific Row
In most cases, you will want to read more than a single cell in a worksheet at a time. OpenPyXL provides a way to get an entire row at once, too.
Go ahead and create a new file. You can name it reading_row_cells.py. Then add the following code to your program:
# reading_row_cells.py

from openpyxl import load_workbook


def iterating_row(path, sheet_name, row):
    workbook = load_workbook(filename=path)
    if sheet_name not in workbook.sheetnames:
        print(f"'{sheet_name}' not found. Quitting.")
        return

    sheet = workbook[sheet_name]
    for cell in sheet[row]:
        print(f"{cell.column_letter}{cell.row} = {cell.value}")


if __name__ == "__main__":
    iterating_row("books.xlsx", sheet_name="Sheet 1 - Books",
                  row=2)
In this example, you pass in the row number 2. You can iterate over the values in the row like this:
for cell in sheet[row]:
    ...
That makes grabbing the values from a row pretty straightforward. When you run this code, you’ll get the following output:
A2 = Title
B2 = Author
C2 = Publisher
D2 = Publishing Date
E2 = ISBN
F2 = None
G2 = None
Those last two values are both None. If you don’t want to get values that are None, you should add some extra processing to check if the value is None before printing it out. You can try to figure that out yourself as an exercise.
You are now ready to learn how to get cells from a specific column!
Read Cells From Specific Column
Reading the data from a specific column is also a frequent use case that you should know how to accomplish. For example, you might have a column that contains only totals, and you need to extract only that specific column.
To see how you can do that, create a new file and name it reading_column_cells.py. Then enter this code:
# reading_column_cells.py

from openpyxl import load_workbook


def iterating_column(path, sheet_name, col):
    workbook = load_workbook(filename=path)
    if sheet_name not in workbook.sheetnames:
        print(f"'{sheet_name}' not found. Quitting.")
        return

    sheet = workbook[sheet_name]
    for cell in sheet[col]:
        print(f"{cell.column_letter}{cell.row} = {cell.value}")


if __name__ == "__main__":
    iterating_column("books.xlsx", sheet_name="Sheet 1 - Books",
                    col="A")
This code is very similar to the code in the previous section. The difference here is that you are replacing sheet[row] with sheet[col] and iterating on that instead.
In this example, you set the column to “A”. When you run this code, you will get the following output:
A1 = Books
A2 = Title
A3 = Python 101
A4 = wxPython Recipes
A5 = Python Interviews
A6 = None
A7 = None
A8 = None
A9 = None
A10 = None
A11 = None
A12 = None
A13 = None
A14 = None
A15 = None
A16 = None
A17 = None
A18 = None
A19 = None
A20 = None
A21 = None
A22 = None
A23 = None
Once again, some columns have no data (i.e., “None”). You can edit this code to ignore empty cells and only process cells that have contents.
Now let’s discover how to iterate over multiple columns or rows!
Read Cells from Multiple Rows or Columns
There are two methods that OpenPyXL’s worksheet objects give you for iterating over rows and columns. These are the two methods:
iter_rows()iter_cols()
These methods are documented fairly well in OpenPyXL’s documentation. Both methods take the following parameters:
min_col(int) – smallest column index (1-based index)min_row(int) – smallest row index (1-based index)max_col(int) – largest column index (1-based index)max_row(int) – largest row index (1-based index)values_only(bool) – whether only cell values should be returned
You use the min and max rows and column parameters to tell OpenPyXL which rows and columns to iterate over. You can have OpenPyXL return the data from the cells by setting values_only to True. If you set it to False, iter_rows() and iter_cols() will return cell objects instead.
It’s always good to see how this works with actual code. With that in mind, create a new file named iterating_over_cells_in_rows.py and add this code to it:
# iterating_over_cells_in_rows.py

from openpyxl import load_workbook


def iterating_over_values(path, sheet_name):
    workbook = load_workbook(filename=path)
    if sheet_name not in workbook.sheetnames:
        print(f"'{sheet_name}' not found. Quitting.")
        return

    sheet = workbook[sheet_name]
    for value in sheet.iter_rows(
        min_row=1, max_row=3, min_col=1, max_col=3,
        values_only=True):
        print(value)


if __name__ == "__main__":
    iterating_over_values("books.xlsx", sheet_name="Sheet 1 - Books")
Here you load up the workbook as you have in the previous examples. You get the sheet name that you want to extract data from and then use iter_rows() to get the rows of data. In this example, you set the minimum row to 1 and the maximum row to 3. That means that you will grab the first three rows in the Excel sheet you have specified.
Then you also set the columns to be 1 (minimum) to 3 (maximum). Finally, you set values_only to True.
When you run this code, you will get the following output:
('Books', None, None)
('Title', 'Author', 'Publisher')
('Python 101', 'Mike Driscoll', 'Mouse vs Python')
Your program will print out the first three columns of the first three rows in your Excel spreadsheet. Your program prints the rows as tuples with three items in them. You are using iter_rows() as a quick way to iterate over rows and columns in an Excel spreadsheet using Python.
Now you’re ready to learn how to read cells in a specific range.
Read Cells from a Range
Excel lets you specify a range of cells using the following format: (col)(row):(col)(row). In other words, you can say that you want to start in column A, row 1, using A1. If you wanted to specify a range, you would use something like this: A1:B6. That tells Excel that you are selecting the cells starting at A1 and going to B6.
Go ahead and create a new file named read_cells_from_range.py. Then add this code to it:
# read_cells_from_range.py

import openpyxl
from openpyxl import load_workbook


def iterating_over_values(path, sheet_name, cell_range):
    workbook = load_workbook(filename=path)
    if sheet_name not in workbook.sheetnames:
        print(f"'{sheet_name}' not found. Quitting.")
        return

    sheet = workbook[sheet_name]
    for column in sheet[cell_range]:
        for cell in column:
            if isinstance(cell, openpyxl.cell.cell.MergedCell):
                # Skip this cell
                continue
            print(f"{cell.column_letter}{cell.row} = {cell.value}")


if __name__ == "__main__":
    iterating_over_values("books.xlsx", sheet_name="Sheet 1 - Books",
                          cell_range="A1:B6")
Here you pass in your cell_range and iterate over that range using the following nested for loop:
for column in sheet[cell_range]:
    for cell in column:
You check to see if the cell that you are extracting is a MergedCell. If it is, you skip it. Otherwise, you print out the cell name and its value.
When you run this code, you should see the following output:
A1 = Books
A2 = Title
B2 = Author
A3 = Python 101
B3 = Mike Driscoll
A4 = wxPython Recipes
B4 = Mike Driscoll
A5 = Python Interviews
B5 = Mike Driscoll
A6 = None
B6 = None
That worked quite well. You should take a moment and try out a few other range variations to see how it changes the output.
Note: while the image of “Sheet 1 – Books” looks like cell A1 is distinct from the merged cell B1-G1, A1 is actually part of that merged cell.
The last code example that you’ll create will read all the data in your Excel document!
Read All Cells in All Sheets
Microsoft Excel isn’t as simple to read as a CSV file, or a regular text file. That is because Excel needs to store each cell’s data, which includes its location, formatting, and value, and that value could be a number, a date, an image, a link, etc. Consequently, reading an Excel file is a lot more work! openpyxl does all that hard work for us, though.
The natural way to iterate through an Excel file is to read the sheets from left to right, and within each sheet, you would read it row by row, from top to bottom. That is what you will learn how to do in this section.
You will take what you have learned in the previous sections and apply it here. Create a new file and name it read_all_data.py. Then enter the following code:
# read_all_data.py

import openpyxl
from openpyxl import load_workbook


def read_all_data(path):
    workbook = load_workbook(filename=path)
    for sheet_name in workbook.sheetnames:
        sheet = workbook[sheet_name]
        print(f"Title = {sheet.title}")
        for row in sheet.rows:
            for cell in row:
                if isinstance(cell, openpyxl.cell.cell.MergedCell):
                    # Skip this cell
                    continue

                print(f"{cell.column_letter}{cell.row} = {cell.value}")


if __name__ == "__main__":
    read_all_data("books.xlsx")
Here you load up the workbook as before, but this time you loop over the sheetnames. You print out each sheet name as you select it. You use a nested for loop to loop over the rows and cells to extract the data from your spreadsheet.
Once again, you skip MergedCells because their value is None — the actual value is in the normal cell that the MergedCell is merged with. If you run this code, you will see that it prints out all the data from the two worksheets.
You can simplify this code a bit by using iter_rows(). Open up a new file and name it read_all_data_values.py. Then enter the following:
# read_all_data_values.py

import openpyxl
from openpyxl import load_workbook


def read_all_data(path):
    workbook = load_workbook(filename=path)
    for sheet_name in workbook.sheetnames:
        sheet = workbook[sheet_name]
        print(f"Title = {sheet.title}")
        for value in sheet.iter_rows(values_only=True):
            print(value)


if __name__ == "__main__":
    read_all_data("books.xlsx")
In this code, you once again loop over the sheet names in the Excel document. However, rather than looping over the rows and columns, you use iter_rows() to loop over only the rows. You set values_only to True which will return a tuple of values for each row. You also do not set the minimum and maximum rows or columns for iter_rows() because you want to get all the data.
When you run this code, you will see it print out the name of each sheet, then all the data in that sheet, row-by-row. Give it a try on your own Excel worksheets and see what this code can do!
Wrapping Up
OpenPyXL lets you read an Excel Worksheet and its data in many different ways. You can extract values from your spreadsheets quickly with a minimal amount of code.
In this chapter, you learned how to do the following:
- Open a spreadsheet
- Read specific cells
- Read cells from a specific row
- Read cells from a specific column
- Read cells from multiple rows or columns
- Read cells from a range
- Read all cells in all sheets
Now you are ready to learn how to create an Excel spreadsheet using OpenPyXL. That is the subject of the next article in this series!
Introduction
Excel is ubiquitous. Many software projects originate from some company or process overgrowing the Excel spreadsheets that were being employed to manage it. As application developers, more than once we’ve had to reverse-engineer Excel files and translate them into a software application. Exploring working with Excel in Python is the goal of this article.
Excel is also quite common as an export format for data, and sometimes also as an input format. And while Excel is not by any means a domain-specific language, we can sometimes consider it as part of the “notation” that some domain experts use to formalize their problems. Thus, software that can “speak” Excel is often closer to its users. Even when the long-term objective is to convert them to an application or to a domain-specific language (DSL), it’s often a good idea to provide an automated migration path from Excel, as well as borrowing notation from Excel.
For example, an application could consume existing Excel files that people use to exchange among themselves as part of the project, effectively gaining the ability to “speak the same language” as the users. Or, it could produce a spreadsheet as the output of some query or calculation, because some users may want to further expand on it to compile a report with additional charts and formulas.
In this tutorial, we’ll explore working with Excel spreadsheets in Python, using the openpyxl library and other tools. In particular, we’ll learn how to:
- Process Excel files as input, with various methods to access the data in them;
- Evaluate formulas;
- Write Excel files as output.
Note: here, we’re talking about “modern” (2010) XML-based Excel files only, that have a .xlsx extension. Openpyxl does not support legacy binary Excel files (.xls). There are other solutions for that that we won’t explore in this tutorial.
All the sample code shown in this tutorial is available in our GitHub repository.
Setup
In the following, we assume a UNIX-like environment – Linux, OSX, or WSL, the Windows Substrate for Linux. As the first step, we’ll create a directory to hold our project:
mkdir python-excel
cd python-excel
Alternatively, if we plan to push our code on GitHub, we may create a repository on GitHub first, and clone it on our local machine:
git clone <repo-url> python-excel
cd python-excel
This will give us the option to have GitHub generate a .gitignore file for Python, a README file, and a license file for us.
After we’ve created the project root directory, we can use pip to install openpyxl. We may want to set a virtual environment up so that we don’t pollute our system’s Python installation:
python -m venv .venv
source .venv/bin/activate
Having activated the environment, we should see it reflected in our shell prompt, like this:
(.venv) python-excel (main*) »
We’ll then write a requirements.txt file that lists our dependencies:
echo openpyxl > requirements.txt
Even if we only have a single dependency right now, explicitly listing it in a file that can be interpreted by the machine will make it easier for other developers to work on our project – including a future version of ourselves that has long forgotten about it.
Then, we’ll install the required dependencies with pip:
python -m pip install -r requirements.txt
We can also easily automate these steps in our CI pipeline, such as GitHub actions.
Loading an Excel File
In Openpyxl, an Excel file is called a “workbook” and is represented by an instance of the class openpyxl.workbook.Workbook. Opening one is super easy:
wb = load_workbook(path)

Openpyxl opens workbooks for reading and for writing at the same time unless we specify that we want a read-only workbook with read_only=True as an argument to load_workbook.
When we finish working with an Excel file, we have to close it:
wb.close()
Unfortunately, a Workbook is not a “context manager”, so we cannot use Python’s with statement to automatically close it when we’re done. Instead, we have to manually arrange to close it even in case of exceptions:
wb = load_workbook(path)
try:
    # Use wb...
finally:
    wb.close()
Processing an Excel File – Common Cases
In general, workbooks may contain multiple sheets, so in order to access the data in an Excel file, we first need to choose a sheet to work on.
Later on, we’ll see how to process multiple worksheets, but for now, we’ll assume that the data that we’re interested in is in the active sheet – the one that the user will see when they open the file in their spreadsheet application:
sheet = wb.active
This is quite often the only sheet in the document, actually.
Now that we have a sheet, we can access the data in its cells in several ways.
Iterating over rows. We can process the data one row at a time, using a Pythonic generator:
for row in sheet.rows():
    # Do something with the row
The rows that rows() yields are themselves generators, and we can iterate through them:
for row in sheet.rows():
    for cell in row:
        # Do something with the cell
Or we can access them by index:
for row in sheet.rows():
    header = row[2]
Actually, the sheet itself is iterable in row order, so we can omit rows altogether:
for row in sheet:
    pass
Iterating over columns. Similarly, we can iterate by column using the cols method:
for col in sheet.cols():
    # Use the column
Columns work the same as rows: they are themselves iterable and addressable by index.
Accessing cells by address. If we need a piece of data that is in one specific cell, we don’t need to iterate through the whole sheet until we encounter it; we can use Excel-style coordinates to access the cell:
cell = sheet['C5']
We can also obtain a generator for a row, column, or a range of cells; we’ll show that in a later section.
Processing Cells
In any case, to process the data in a spreadsheet we have to deal with individual cells. In Openpyxl, a cell has a value and a bunch of other information that is mostly interesting only for writing, such as style information.
Conveniently, we work with cell values as Python objects (numbers, dates, strings, and so on) as Openpyxl will translate them to Excel types and back appropriately. So, cell contents are not restricted to be strings. Here, for example, we read the contents of a cell as a number:
tax_percentage = sheet['H16'].value
tax_amount = taxable_amount * tax_percentage
However, we have no guarantee that the user actually put a number in that cell; if it contains the string “bug”, in the lucky case, we’ll get a runtime error when we run the code above:
TypeError: can't multiply sequence by non-int of type 'float'
However, in the not-so-lucky case, i.e. when taxable_amount is an integer – as it should be, since we’re dealing with money in the example – we’ll get a long string of “bug” repeated taxable_amount times. That’s because Python overloads the * operator for strings and integers to mean “repeat the string n times”. This will potentially result in further type errors down the line, or in a memory error when Python cannot allocate such a big string.
Therefore, we should always validate the input to our program, including Excel files. In this particular case, we can check the type of the value of a cell with Python’s isinstance function:
if isinstance(cell.value, numbers.Number):
    # Use the value
Or we can ask the cell for which type of data it contains:
if cell.data_type == TYPE_NUMERIC:
    # Use the numeric value
Advanced Addressing of Cells
So far, we’ve explored the simplest, most straightforward ways of accessing cells. However, that doesn’t cover all the use cases that we may encounter; let’s have a look at more complex access schemes.
Sheets other than the active one. We can obtain sheets by access them by name from the workbook:
sheet = wb['2020 Report']
Then we can access cells in the sheet as we’ve seen earlier.
Ranges of cells. We’re not limited to addressing cells one by one – we can also obtain cell ranges:
sheet['D']is a whole row (D in this case)sheet[7]is a whole column (7 in this case)sheet['B:F']represents a range of rowssheet['4:10']represents a range of columnssheet['C3:H5']is the most versatile option, representing an arbitrary range of cells.
In any of the above cases, the result is an iterable of all the cells, in row order (except when the range represents one or more columns, in which case, cells are arranged in column order):
for cell in sheet['B2:F10']:
    # B2, B3, ..., F1, F2, ..., F10
for cell in sheet['4:10']:
    # A4, B4, ..., A10, B10, ...
![]()
for cell in sheet['B2:F10']![]()
for cell in sheet['4:10']
Cell Iterators
If the above addressing schemes don’t suit our problem, we can resort to the lower-level methods iter_rows and iter_columns, that return generators – respectively by row and by column – over a range of cells.
In particular, both methods take 5 named parameters:
- min_row – the number of the starting row (1 is A, 2 is B, etc.)
- min_col – the starting column
- max_row – the number of the last row
- max_col – the last column
- values_only – if true, the generator will yield only the value of each cell, rather than the entire cell object. So, we won’t have to spell
cell.value, justvalue. On the other hand, we won’t have access to the other properties of the cell, such as its data_type.
So, for example, if we want to iterate over the range B2:F10 by column we’ll write:
for cell in sheet.iter_columns(min_row=2, min_col=2, max_row=6, max_col=10):
    # Use the cell
Writing an Excel File
To write an Excel file, we just call the save method on our workbook:
wb.save('someFile.xlsx')
There’s not much to say about that. It’s more interesting to know how to modify a workbook before saving it. This can be a workbook that has been loaded from a file or a brand new workbook created in Python with the new operator.
Modifying Individual Cells
We can alter the value of a cell simply by assigning to it:
cell.value = 42
Note that this will automatically update the cell’s data type to reflect the new value. Besides the obvious primitive types (integer, float, string), the available types include various classes in the datetime module, as well as NumPy numeric types if NumPy is installed.
Not just values and types, we can set other properties of cells, notably style information (font, color, …), which is useful if we’re set on producing a good-looking report. The documentation of Openpyxl contains a thorough explanation of working with styles so we’ll just refer to that.
Adding and Removing Sheets
So far we’ve seen that we can address some objects – particularly workbooks and worksheets – as if they were dictionaries, to access their components: worksheets, rows, columns, individual cells, cell ranges. We’ll now see how we can add new information to the dictionaries and how to replace existing information. We’ll start with sheets.
To create a worksheet, we use the create_sheet method on a workbook:
new_sheet = wb.create_sheet()
This will add a new sheet to the workbook, after the other sheets, and will return it. We can also give it a title:
new_sheet = wb.create_sheet(title = 'My new sheet')
If we want to place the sheet at another position in the list, we can specify its index (which is zero-based, zero being the first):
# The new sheet will be inserted as the third sheet
new_sheet = wb.create_sheet(index = 2)
To delete a sheet, instead, we have two options. We can delete it by name in accordance with the dictionary abstraction:
del wb['My sheet']
We can check if a sheet with a given name is present in the workbook using the in operator:
name = 'My sheet'
if name in workbook:
    del workbook[name]
Alternatively, we can call the remove method with the sheet as the argument:
wb.remove(sheet)
Adding and Removing Rows, Columns, and Cells
Similarly, we have methods for adding or removing rows, columns, or individual cells in a worksheet. Let’s see some examples.
First and foremost, by simply accessing a cell, we cause the creation of all rows and columns needed to make room for it:
wb = Workbook()
# Initially, an empty worksheet has a single row and column, A and 1
self.assertEqual(wb.active.max_row, 1)
self.assertEqual(wb.active.max_column, 1)
# We set the value of the cell at C3;
# openpyxl creates rows B, C and columns 2, 3 automatically
wb.active['C3'].value = 12
# Now the sheet has 3 rows and columns
self.assertEqual(wb.active.max_row, 3)
self.assertEqual(wb.active.max_column, 3)
wb.close()
Additionally, we can use the insert_rows and insert_cols methods to add rows or columns in the middle of the sheet. Existing cells are automatically moved after the newly inserted rows/columns:
wb = Workbook()
self.assertEqual(wb.active.max_row, 1)
wb.active['A1'].value = 11
# Insert 3 rows, starting at index 0 (i.e. row 1)
wb.active.insert_rows(0, 3)
self.assertEqual(wb.active.max_row, 4)
# Note how the cell, A1, has automatically moved by 3 rows to A4
self.assertEqual(wb.active['A4'].value, 11)
We have the corresponding delete_rows and delete_cols to remove rows/columns instead:
# Delete 2 columns, starting from index 1, i.e. column B
sheet.delete_columns(1, 2)
Working With Formulas
Spreadsheets are powerful because they support formulas to compute cell values. Calculated cells automatically update their value when other cells change. Let’s see how we can work with formulas in Openpyxl.
First of all, we can ignore formulas altogether if we just want to read an Excel file. In that case, opening it in “data only” mode will hide formulas, presenting all cells with a concrete value – as computed the last time Excel opened the file:
wb = load_workbook(filename, data_only=True)
Only when modifying an Excel file we may want to recalculate formulas. While openpyxl has some support for parsing formulas, that we could use to analyze them (e.g., to check if they’re only calling known functions), it doesn’t know how to evaluate formulas by itself. So, we have to resort to a third-party library if we want to compute formulas.
Enter the library called, well, “formulas”. Let’s add it to our requirements.txt file and install it:
$ cat requirements.txt
openpyxl
formulas
pip install -r requirements.txt
With the formulas library, we have two options:
- calculating the values of all the formulas in a workbook, recursively following dependencies, the way Excel does it;
- compiling individual formulas to Python functions that we can then invoke with different arguments.
Calculating the Values of All Formulas
The first use case is not the most interesting in the context of this tutorial because it overlaps with the data_only approach we’ve seen earlier. In fact, in that mode, we cannot load a workbook, modify it, and then recompute the formulas in it. We’d have to:
- save the modified workbook to a file;
- have formulas load the file again;
- calculate formula values with an API call;
- save the file with the calculated values;
- open the file with openpyxl in data_only mode and finally see the computed values.
Not really efficient use of developer and computer time!
That said, this feature of the formulas library does have its value, because it supports some advanced use cases:
- Calculating formulas across multiple workbooks. In Excel, it’s possible to have a formula refer to another file. formulas can load multiple workbooks as part of the same set so as to resolve these cross-file references, which is a pretty rarely used feature of Excel that, e.g., Apple’s Numbers doesn’t support.
- Compiling an entire Excel workbook into a Python function. We can define certain cells as input cells, others as output cells, and obtain a function that, given the inputs, computes the formulas in the workbook and returns the values it finds in the output cells after the calculation.
However, to keep it simple, we’ll leave those out of this tutorial.
Compiling Individual Formulas as Python Functions
Let’s concentrate on individual formulas, that we can better integrate with our work based on openpyxl. As per formulas’ documentation, the incantation for compiling an Excel formula into a Python function is the following:
func = formulas.Parser().ast(value)[1].compile()
Note the [1] there – for some reason, the ast method returns a tuple of two objects of which the second, the builder, is the most useful. Even though this is documented, apparently it’s a piece of internal API that would need to be wrapped in a more user-friendly interface.
Anyway, when we evaluate the code above, the resulting func will be a function with as many arguments as the inputs of the formula:
func = formulas.Parser().ast('=A1+B1')[1].compile()
func(1, 2) == 3 # True
Handling Dependencies of Formulas
So, we can compile the formula of a single cell into a function. However, what happens when the formula depends on other cells that contain formulas themselves? The formulas library doesn’t help us in that regard; we have to compute all the inputs recursively if they are themselves formulas. Let’s see how we might do that.
First of all, how do we distinguish between a cell with a formula and a cell with a regular value? Openpyxl doesn’t offer a method to do that, so we have to check if the value of the cell starts with an equal character:
def has_formula(cell: Cell)
   return isinstance(cell.value, str) and cell.value.startswith('=')
Therefore, we know how to compute the values of cells that don’t contain formulas:
def compute_cell_value(cell: Cell):
   if not has_formula(cell):
       return cell.value
Now, the interesting thing is how to compute the value when the cell does contain a formula:
func = formulas.Parser().ast(cell.value)[1].compile()
args = []
# TODO: compute function arguments
return func(*args)
We compile the formula into a Python function and then we invoke it on its inputs. Since the inputs are references to cells, we recursively invoke compute_cell_value in order to get their values:
sheet = cell.parent
for key in func.inputs.keys():
   args.append(compute_cell_value(sheet[key]))
We leverage the fact that every cell keeps a reference to its parent, i.e., the sheet that contains it. We also make use of introspection information retained by formulas, that allows us to inspect the inputs of a function – a dictionary of cell references.
Note that this doesn’t support references across sheets or, for that matter, files.
Computing Formulas Over Cell Ranges
So far, our compute_cell_value function successfully computes the values of cells without formulas and with formulas that may depend on other cells. However, what about formulas that depend, not on individual cells, but on cell ranges?
Well, in that case, the input of a function is a range expression, such as A1:Z1 in =SUM(A1:Z1). When we call compute_cell_value recursively, we pass it the following:
sheet[key]
When the key is the address of a single cell, we obtain a cell object; but when it refers to a range of cells, we obtain a tuple with one entry per cell. Our compute_cell_value doesn’t know how to deal with such input, so we have to modify it to handle that case:
if isinstance(input, Tuple):
   return tuple(map(compute_cell_value, input))
Then, the complete version of the function becomes:
def compute_cell_value(input: Union[Cell, Tuple]):
   if isinstance(input, Tuple):
       return tuple(map(compute_cell_value, input))
   if not has_formula(input):
       return input.value
   func = formulas.Parser().ast(input.value)[1].compile()
   args = []
   sheet = input.parent
   for key in func.inputs.keys():
       args.append(compute_cell_value(sheet[key]))
   return func(*args)
Adding New Formula Functions
formulas supports many built-in Excel functions, but not all of them. And of course it doesn’t know about user-defined functions in VBA. However, we can register new Python functions with it so that they can be called in formulas:
def is_number(number):
   ... # This is actually defined in formulas, but strangely not exposed as the Excel function

FUNCTIONS = formulas.get_functions()
FUNCTIONS['ISNUMBER'] = is_number
Simple as that. The inputs to the function are its actual arguments as native Python values, so strings, numbers, dates, etc. – not instances of the Cell class.
Also, compared to a regular Python function, we have to guard against XlError, which represents errors in calculations such as #DIV/0! or #REF! (we typically see those in Excel when we’ve made some mistake in writing a formula):
def is_number(number):
    if isinstance(number, XlError):
        return False
    ...
Conclusions
We can work productively with Excel in Python with the aid of two mature open-source libraries, openpyxl and formulas. Consuming and producing complex Excel files is a valuable capability in applications whose users routinely work with Excel.
In this tutorial, we’ve learned how to read and write Excel files that may contain formulas. We didn’t talk about styling, charts, merging cells, and other possibilities you may want to read about.
All the sample code shown in this tutorial is available in our GitHub repository.
Read more:
To discover more about how to write a python parser, you can read Parsing In Python: Tools And Libraries
The Best Programming Languages

Get the guide to the best programming languages to use in each situation delivered to your email and read it when you want on the device you want
In this openpyxl tutorial, we will learn how we can read the data from the cell of an Excel Sheet in Python.
The values that are stored in the cells of an Excel Sheet can be accessed easily using the openpyxl library. To read the cell values, we can use two methods, firstly the value can be accessed by its cell name, and secondly, we can access it by using the cell() function.
Program to read cell value using openpyxl Library in Python
Let’s understand it with an example:
Here, we took an Excel file having some values in its cells. We will access and read these values in our Python program using the openpyxl library.

Step1: Import the openpyxl library to the Python program.
import openpyxl
Step2: Load/Connect the Excel workbook to the program.
wb = openpyxl.load_workbook('filename.xlsx') #give the full path of the file here
Step3: Get the title of the default first worksheet of the Workbook.
sh = wb.active
Step4: Create variables and initialize them with the cell names.
c1 = sh['A1']
c2 = sh['B2']
Or
We can also read the cell value by using the cell() function. The cell() function takes rows and columns as the parameter for the position of the cell.
c3 = sh.cell(row=2,column=1)
Step5: Finally, print the values of the cell to the screen.
print("Value of the Cell 1:",c1.value)
print("Value of the Cell 2:",c2.value)
print("Value of the Cell 3:",c3.value)
Here is the complete program:
import openpyxl

wb = openpyxl.load_workbook("//home//codespeedy//Documents//Book2.xlsx")
sh = wb.active

c1 = sh['A2']
c2 = sh['B2']

#Using cell() function
c3 = sh.cell(row=3,column=3)

print("Value of the Cell 1:",c1.value)
print("Value of the Cell 2:",c2.value)
print("Value of the Cell 3:",c3.value)
Output:
Value of the Cell 1: Sanam
Value of the Cell 2: 21
Value of the Cell 3: 56000
Hope you have enjoyed this article and learned how to read the value of a cell of an Excel Workbook in Python.
You can also read, How to add color to Excel cells using Python