
i had this problem and I did a lot of searching
at last i found a proper and good solution in :
source of solution
it work very good!
just add this class to your project and set excel colors :
class ColorMatcher(object):
"""
the source is in : http://www.archivum.info/python-excel@googlegroups.com/2012-09/00014/Re-(pyxl)-Re-Background-with-any-rgb-value.html

Prior to Excel 2007, Excel only had color
indexes, and that's all that xlwt supports.  Maybe this will help,
though.  It use a ColorMatcher that takes an RGB input and tries to
return the closest matching Excel color index:
"""

def __init__(self):
    self.reset()

def reset(self):
    self.unused_colors = set(self.xlwt_colors)
    # Never use black.
    self.unused_colors.discard((0, 0, 0))

#Culled from a table at http://www.mvps.org/dmcritchie/excel/colors.htm
xlwt_colors=[
    (0,0,0), (255,255,255), (255,0,0), (0,255,0), (0,0,255), (255,255,0),
    (255,0,255), (0,255,255), (0,0,0), (255,255,255), (255,0,0), (0,255,0),
    (0,0,255), (255,255,0), (255,0,255), (0,255,255), (128,0,0), (0,128,0),
    (0,0,128), (128,128,0), (128,0,128), (0,128,128), (192,192,192),
    (128,128,128), (153,153,255), (153,51,102), (255,255,204),
    (204,255,255), (102,0,102), (255,128,128), (0,102,204), (204,204,255),
    (0,0,128), (255,0,255), (255,255,0), (0,255,255), (128,0,128),
    (128,0,0), (0,128,128), (0,0,255), (0,204,255), (204,255,255),
    (204,255,204), (255,255,153), (153,204,255), (255,153,204),
    (204,153,255), (255,204,153), (51,102,255), (51,204,204), (153,204,0),
    (255,204,0), (255,153,0), (255,102,0), (102,102,153), (150,150,150),
    (0,51,102), (51,153,102), (0,51,0), (51,51,0), (153,51,0), (153,51,102),
    (51,51,153), (51,51,51)
]

@staticmethod
def color_distance(rgb1, rgb2):
    # Adapted from Colour metric by Thiadmer Riemersma,
    # http://www.compuphase.com/cmetric.htm
    rmean = (rgb1[0] + rgb2[0]) / 2
    r = rgb1[0] - rgb2[0]
    g = rgb1[1] - rgb2[1]
    b = rgb1[2] - rgb2[2]
    return (((512 + rmean) * r * r) / 256) + 4 * g * g
    + (((767 - rmean) * b * b) / 256)

def match_color_index(self, color):
    """Takes an "R,G,B" string or wx.Color and returns a matching xlwt
    color.
    """
    if isinstance(color, int):
        return color
    if color:
        if isinstance(color, basestring):
            rgb = map(int, color.split(','))
        else:
            rgb = color.Get()
        distances = [self.color_distance(rgb, x) for x in self.xlwt_colors]
        result = distances.index(min(distances))
        self.unused_colors.discard(self.xlwt_colors[result])
        return result

def get_unused_color(self):
    """Returns an xlwt color index that has not been previously returned by
    this instance.  Attempts to maximize the distance between the color and
    all previously used colors.
    """
    if not self.unused_colors:
        # If we somehow run out of colors, reset the color matcher.
        self.reset()
    used_colors = [c for c in self.xlwt_colors if c not in
                                                  self.unused_colors]
    result_color = max(self.unused_colors,
        key=lambda c: min(self.color_distance(c, c2)
        for c2 in used_colors))
    result_index = self.xlwt_colors.index(result_color)
    self.unused_colors.discard(result_color)
    return result_index
the source of this code is :
http://www.archivum.info/python-excel@googlegroups.com/2012-09/00014/Re-%28pyxl%29-Re-Background-with-any-rgb-value.htmle
OpenPyXL gives you the ability to style your cells in many different ways. Styling cells will give your spreadsheets pizazz! Your spreadsheets can have some pop and zing to them that will help differentiate them from others. However, don’t go overboard! If every cell had a different font and color, your spreadsheet would look like a mess.
You should use the skills that you learn in this article sparingly. You’ll still have beautiful spreadsheets that you can share with your colleagues. If you would like to learn more about what styles OpenPyXL supports, you should check out their documentation.
In this article, you will learn about the following:
- Working with fonts
- Setting the alignment
- Adding a border
- Changing the cell background-color
- Inserting images into cells
- Styling merged cells
- Using a built-in style
- Creating a custom named style
Now that you know what you’re going to learn, it’s time to get started by discovering how to work with fonts using OpenPyXL!
Working with Fonts
You use fonts to style your text on a computer. A font controls the size, weight, color, and style of the text you see on-screen or in print. There are thousands of fonts that your computer can use. Microsoft includes many fonts with its Office products.
When you want to set a font with OpenPyXL, you will need to import the Font class from openpyxl.styles. Here is how you would do the import:
from openpyxl.styles import Font
The Font class takes many parameters. Here is the Font class’s full list of parameters according to OpenPyXL’s documentation:
class openpyxl.styles.fonts.Font(name=None, sz=None, b=None, i=None, charset=None, u=None,
    strike=None, color=None, scheme=None, family=None, size=None, bold=None, italic=None,
    strikethrough=None, underline=None, vertAlign=None, outline=None, shadow=None,
    condense=None, extend=None)
The following list shows the parameters you are most likely to use and their defaults:
- name=’Calibri’
- size=11
- bold=False
- italic=False
- vertAlign=None
- underline=’none’
- strike=False
- color=’FF000000′
These settings allow you to set most of the things you’ll need to make your text look nice. Note that the color names in OpenPyXL use hexadecimal values to represent RGB (red, green, blue) color values. You can set whether or not the text should be bold, italic, underlined, or struck-through.
To see how you can use fonts in OpenPyXL, create a new file named font_sizes.py and add the following code to it:
# font_sizes.py

import openpyxl
from openpyxl.styles import Font


def font_demo(path):
    workbook = openpyxl.Workbook()
    sheet = workbook.active
    cell = sheet["A1"]
    cell.font = Font(size=12)
    cell.value = "Hello"

    cell2 = sheet["A2"]
    cell2.font = Font(name="Arial", size=14, color="00FF0000")
    sheet["A2"] = "from"

    cell2 = sheet["A3"]
    cell2.font = Font(name="Tahoma", size=16, color="00339966")
    sheet["A3"] = "OpenPyXL"

    workbook.save(path)


if __name__ == "__main__":
    font_demo("font_demo.xlsx")
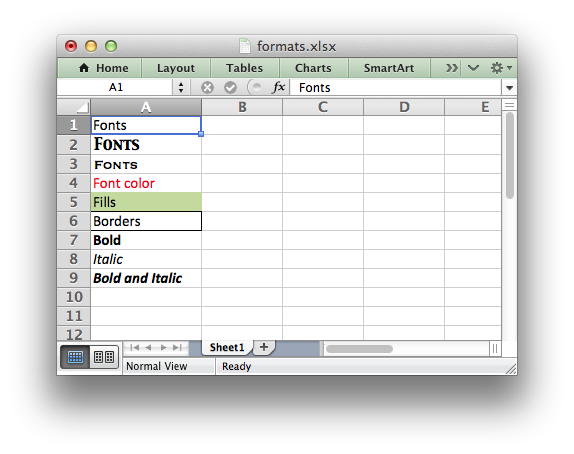
This code uses three different fonts in three different cells. In A1, you use the default, which is Calibri. Then in A2, you set the font size to Arial and increase the size to 14 points. Finally, in A3, you change the font to Tahoma and the font size to 16 points.
For the second and third fonts, you also change the text color. In A2, you set the color to red, and in A3, you set the color to green.
When you run this code, your output will look like this:

Try changing the code to use other fonts or colors. If you want to get adventurous, you should try to make your text bold or italicized.
Now you’re ready to learn about text alignment.
Setting the Alignment
You can set alignment in OpenPyXL by using openpyxl.styles.Alignment. You use this class to rotate the text, set text wrapping, and for indentation.
Here are the defaults that the Alignment class uses:
- horizontal=’general’
- vertical=’bottom’
- text_rotation=0
- wrap_text=False
- shrink_to_fit=False
- indent=0
It’s time for you to get some practice in. Open up your Python editor and create a new file named alignment.py. Then add this code to it:
# alignment.py

from openpyxl import Workbook
from openpyxl.styles import Alignment


def center_text(path, horizontal="center", vertical="center"):
    workbook = Workbook()
    sheet = workbook.active
    sheet["A1"] = "Hello"
    sheet["A1"].alignment = Alignment(horizontal=horizontal,
                                      vertical=vertical)
    sheet["A2"] = "from"
    sheet["A3"] = "OpenPyXL"
    sheet["A3"].alignment = Alignment(text_rotation=90)
    workbook.save(path)


if __name__ == "__main__":
    center_text("alignment.xlsx")
You will center the string both horizontally and vertically in A1 when you run this code. Then you use the defaults for A2. Finally, for A3, you rotate the text 90 degrees.
Try running this code, and you will see something like the following:

That looks nice! It would be best if you took the time to try out different text_rotation values. Then try changing the horizontal and vertical parameters with different values. Pretty soon, you will be able to align your text like a pro!
Now you’re ready to learn about adding borders to your cells!
Adding a Border
OpenPyXL gives you the ability to style the borders on your cell. You can specify a different border style for each of the four sides of a cell.
You can use any of the following border styles:
- ‘dashDot’
- ‘dashDotDot’
- ‘dashed’
- ‘dotted’
- ‘double’
- ‘hair’
- ‘medium’
- ‘mediumDashDot’
- ‘mediumDashDotDot’,
- ‘mediumDashed’
- ‘slantDashDot’
- ‘thick’
- ‘thin’
Open your Python editor and create a new file named border.py. Then enter the following code in your file:
# border.py

from openpyxl import Workbook
from openpyxl.styles import Border, Side


def border(path):
    pink = "00FF00FF"
    green = "00008000"
    thin = Side(border_style="thin", color=pink)
    double = Side(border_style="double", color=green)

    workbook = Workbook()
    sheet = workbook.active

    sheet["A1"] = "Hello"
    sheet["A1"].border = Border(top=double, left=thin, right=thin, bottom=double)
    sheet["A2"] = "from"
    sheet["A3"] = "OpenPyXL"
    sheet["A3"].border = Border(top=thin, left=double, right=double, bottom=thin)
    workbook.save(path)


if __name__ == "__main__":
    border("border.xlsx")
This code will add a border to cell A1 and A3. The top and bottom of A1 use a “double” border style and are green, while the cell sides are using a “thin” border style and are colored pink.
Cell A3 uses the same borders but swaps them so that the sides are now green and the top and bottom are pink.
You get this effect by creating Side objects in the border_style and the color to be used. Then you pass those Side objects to a Border class, which allows you to set each of the four sides of a cell individually. To apply the Border to a cell, you must set the cell’s border attribute.
When you run this code, you will see the following result:

This image is zoomed in a lot so that you can easily see the borders of the cells. It would be best if you tried modifying this code with some of the other border styles mentioned at the beginning of this section so that you can see what else you can do.
Changing the Cell Background Color
You can highlight a cell or a range of cells by changing its background color. Highlighting a cell is more eye-catching than changing the text’s font or color in most cases. OpenPyXL gives you a class called PatternFill that you can use to change a cell’s background color.
The PatternFill class takes in the following arguments (defaults included below):
- patternType=None
- fgColor=Color()
- bgColor=Color()
- fill_type=None
- start_color=None
- end_color=None
There are several different fill types you can use. Here is a list of currently supported fill types:
- ‘none’
- ‘solid’
- ‘darkDown’
- ‘darkGray’
- ‘darkGrid’
- ‘darkHorizontal’
- ‘darkTrellis’
- ‘darkUp’
- ‘darkVertical’
- ‘gray0625’
- ‘gray125’
- ‘lightDown’
- ‘lightGray’
- ‘lightGrid’
- ‘lightHorizontal’
- ‘lightTrellis’
- ‘lightUp’
- ‘lightVertical’
- ‘mediumGray’
Now you have enough information to try setting the background color of a cell using OpenPyXL. Open up a new file in your Python editor and name it background_colors.py. Then add this code to your new file:
# background_colors.py

from openpyxl import Workbook
from openpyxl.styles import PatternFill


def background_colors(path):
    workbook = Workbook()
    sheet = workbook.active
    yellow = "00FFFF00"
    for rows in sheet.iter_rows(min_row=1, max_row=10, min_col=1, max_col=12):
        for cell in rows:
            if cell.row % 2:
                cell.fill = PatternFill(start_color=yellow, end_color=yellow,
                                        fill_type = "solid")
    workbook.save(path)


if __name__ == "__main__":
    background_colors("bg.xlsx")
This example will iterate over nine rows and 12 columns. It will set every cell’s background color to yellow if that cell is in an odd-numbered row. The cells with their background color changes will be from column A through column L.
When you want to set the cell’s background color, you set the cell’s fill attribute to an instance of PatternFill. In this example, you specify a start_color and an end_color. You also set the fill_type to “solid”. OpenPyXL also supports using a GradientFill for the background.
Try running this code. After it runs, you will have a new Excel document that looks like this:

Here are some ideas that you can try out with this code:
- Change the number of rows or columns that are affected
- Change the color that you are changing to
- Update the code to color the even rows with a different color
- Try out other fill types
Once you are done experimenting with background colors, you can learn about inserting images in your cells!
Inserting Images into Cells
OpenPyXL makes inserting an image into your Excel spreadsheets nice and straightforward. To make this magic happen, you use the Worksheet object’s add_image() method. This method takes in two arguments:
img– The path to the image file that you are insertinganchor– Provide a cell as a top-left anchor of the image (optional)
For this example, you will be using the Mouse vs. Python logo:
![]()
The GitHub repository for this book has the image for you to use.
Once you have the image downloaded, create a new Python file and name it insert_image.py. Then add the following:
# insert_image.py

from openpyxl import Workbook
from openpyxl.drawing.image import Image


def insert_image(path, image_path):
    workbook = Workbook()
    sheet = workbook.active
    img = Image("logo.png")
    sheet.add_image(img, "B1")
    workbook.save(path)


if __name__ == "__main__":
    insert_image("logo.xlsx", "logo.png")
Here you pass in the path to the image that you wish to insert. To insert the image, you call add_image(). In this example, you are hard-coding to use cell B1 as the anchor cell. Then you save your Excel spreadsheet.
If you open up your spreadsheet, you will see that it looks like this:
![]()
You probably won’t need to insert an image into an Excel spreadsheet all that often, but it’s an excellent skill to have.
Styling Merged Cells
Merged cells are cells where you have two or more adjacent cells merged into one. If you want to set the value of a merged cell with OpenPyXL, you must use the top left-most cell of the merged cells.
You also must use this particular cell to set the style for the merged cell as a whole. You can use all the styles and font settings you used on an individual cell with the merged cell. However, you must apply the style to the top-left cell for it to apply to the entire merged cell.
You will understand how this works if you see some code. Go ahead and create a new file named style_merged_cell.py. Now enter this code in your file:
# style_merged_cell.py

from openpyxl import Workbook
from openpyxl.styles import Font, Border, Side, GradientFill, Alignment


def merge_style(path):
    workbook = Workbook()
    sheet = workbook.active
    sheet.merge_cells("A2:G4")
    top_left_cell = sheet["A2"]

    light_purple = "00CC99FF"
    green = "00008000"
    thin = Side(border_style="thin", color=light_purple)
    double = Side(border_style="double", color=green)

    top_left_cell.value = "Hello from PyOpenXL"
    top_left_cell.border = Border(top=double, left=thin, right=thin,
                                  bottom=double)
    top_left_cell.fill = GradientFill(stop=("000000", "FFFFFF"))
    top_left_cell.font = Font(b=True, color="FF0000", size=16)
    top_left_cell.alignment = Alignment(horizontal="center",
                                        vertical="center")
    workbook.save(path)


if __name__ == "__main__":
    merge_style("merged_style.xlsx")
Here you create a merged cell that starts at A2 (the top-left cell) through G4. Then you set the cell’s value, border, fill, font and alignment.
When you run this code, your new spreadsheet will look like this:

Doesn’t that look nice? You should take some time and try out some different styles on your merged cell. Maybe come up with a better gradient than the gray one used here, for example.
Now you’re ready to learn about OpenPyXL’s built-in styles!
Using a Built-in Style
OpenPyXL comes with multiple built-in styles that you can use as well. Rather than reproducing the entire list of built-in styles in this book, you should go to the official documentation as it will be the most up-to-date source for the style names.
However, it is worth noting some of the styles. For example, here are the number format styles you can use:
- ‘Comma’
- ‘Comma [0]’
- ‘Currency’
- ‘Currency [0]’
- ‘Percent’
You can also apply text styles. Here is a listing of those styles:
- ‘Title’
- ‘Headline 1’
- ‘Headline 2’
- ‘Headline 3’
- ‘Headline 4’
- ‘Hyperlink’
- ‘Followed Hyperlink’
- ‘Linked Cell’
OpenPyXL has several other built-in style groups. You should check out the documentation to learn about all the different styles that are supported.
Now that you know about some of the built-in styles you can use, it’s time to write some code! Create a new file and name it builtin_styls.py. Then enter the following code:
# builtin_styles.py

from openpyxl import Workbook


def builtin_styles(path):
    workbook = Workbook()
    sheet = workbook.active
    sheet["A1"].value = "Hello"
    sheet["A1"].style = "Title"

    sheet["A2"].value = "from"
    sheet["A2"].style = "Headline 1"

    sheet["A3"].value = "OpenPyXL"
    sheet["A3"].style = "Headline 2"

    workbook.save(path)


if __name__ == "__main__":
    builtin_styles("builtin_styles.xlsx")
Here you apply three different styles to three different cells. You use “Title”, “Headline 1” and “Headline 2”, specifically.
When you run this code, you will end up having a spreadsheet that looks like this:

As always, you should try out some of the other built-in styles. Trying them out is the only way to determine what they do and if they will work for you.
But wait! What if you wanted to create your style? That’s what you will cover in the next section!
Creating a Custom Named Style
You can create custom styles of your design using OpenPyXL as well. To create your style, you must use the NamedStyle class.
The NamedStyle class takes the following arguments (defaults are included too):
- name=”Normal”
- font=Font()
- fill=PatternFill()
- border=Border()
- alignment=Alignment()
- number_format=None
- protection=Protection()
- builtinId=None
- hidden=False
- xfId=None
You should always provide your own name to your NamedStyle to keep it unique. Go ahead and create a new file and call it named_style.py. Then add this code to it:
# named_style.py

from openpyxl import Workbook
from openpyxl.styles import Font, Border, Side, NamedStyle


def named_style(path):
    workbook = Workbook()
    sheet = workbook.active

    red = "00FF0000"
    font = Font(bold=True, size=22)
    thick = Side(style="thick", color=red)
    border = Border(left=thick, right=thick, top=thick, bottom=thick)
    named_style = NamedStyle(name="highlight", font=font, border=border)

    sheet["A1"].value = "Hello"
    sheet["A1"].style = named_style

    sheet["A2"].value = "from"
    sheet["A3"].value = "OpenPyXL"

    workbook.save(path)


if __name__ == "__main__":
    named_style("named_style.xlsx")
Here you create a Font(), Side(), and Border() instance to pass to your NamedStyle(). Once you have your custom style created, you can apply it to a cell by setting the cell’s style attribute. Applying a custom style is done in the same way as you applied built-in styles!
You applied the custom style to the cell, A1.
When you run this code, you will get a spreadsheet that looks like this:

Now it’s your turn! Edit the code to use a Side style, which will change your border. Or create multiple Side instances so you can make each side of the cell unique. Play around with different fonts or add a custom background color!
Wrapping Up
You can do a lot of different things with cells using OpenPyXL. The information in this article gives you the ability to format your data in beautiful ways.
In this article, you learned about the following topics:
- Working with fonts
- Setting the alignment
- Adding a border
- Changing the cell background-color
- Inserting images into cells
- Styling merged cells
- Using a built-in style
- Creating a custom named style
You can take the information that you learned in this article to make beautiful spreadsheets. You can highlight exciting data by changing the cell’s background color or font. You can also change the cell’s format by using a built-in style. Go ahead and give it a try.
Experiment with the code in this article and see how powerful and valuable OpenPyXL is when working with cells.
Related Reading
- Reading Spreadsheets with OpenPyXL and Python
- Creating Spreadsheets with OpenPyXL and Python
- Automating Excel with Python (book)
The openpyxl Python library provides various different modules to read and modify Excel files. Using this module, we can work on the Excel workbooks very easily and efficiently. In this section, we will discuss how we can add the background color to Excel cells in Python using the openpyxl library.
Program to add color to Excel cells in Python
Note: Before starting programming, create an Excel file with some data, or you can choose any of your existing Excel files.
Example:

Step1: Import the openpyxl Library and modules to the Python program for adding color to the cell.
import openpyxl
from openpyxl.styles import PatternFill
Note: openpyxl.styles provides various different functions that style your cells in many different ways, like changing the color, font, alignment, border, etc.
Step2: Connect/Link your Excel workbook file and corresponding workbook’s working Sheet with the Python Program.
wb = openpyxl.load_workbook("//home//codespeedy//Documents//MyWorkBook.xlsx") #path to the Excel file
ws = wb['Sheet1'] #Name of the working sheet
Step3: Call the PaternFill() function with the Pattern type and foreground color parameters of your choice.
fill_cell = PatternFill(patternType='solid',
                            fgColor='C64747') #You can give the hex code for different color
Step4: Lastly, fill the cell with color by using the name of the particular cell of the working sheet, and save the changes to the workbook.
ws['B2'].fill = fill_cell # B2 is the name of the cell to be fill with color
wb.save("//home//codespeedy//Documents//MyWorkBook.xlsx")
Here is the complete Python Program:
import openpyxl
from openpyxl.styles import PatternFill

wb = openpyxl.load_workbook("//home//codespeedy//Documents//MyWorkBook.xlsx")
ws = wb['Sheet1'] #Name of the working sheet

fill_cell1 = PatternFill(patternType='solid',
                           fgColor='FC2C03')
fill_cell2 = PatternFill(patternType='solid',
                           fgColor='03FCF4')
fill_cell3 = PatternFill(patternType='solid',
                           fgColor='35FC03')
fill_cell4 = PatternFill(patternType='solid',
                           fgColor='FCBA03')

ws['B2'].fill = fill_cell1
ws['B3'].fill = fill_cell2
ws['B4'].fill = fill_cell3
ws['B5'].fill = fill_cell4

wb.save("//home//sanamsahoo0876//Documents//MyWorkBook.xlsx")
Now, close the Excel application and reopen it to see the changes.
Output:

Hope this article has helped you understand adding color to the Excel cells using Python easily.
You can also read, Python Program to Merge Excel Cells using openpyxl
Модуль openpyxl обеспечивает довольно гибкое управление стилями, относительно простую работу с ними. Стили в электронных таблицах XLSX используются для изменения внешнего вида данных при отображении на экране. Они также используются для определения форматирования чисел.
Содержание:
- Аспекты применения стилей модулем
openpyxl. - Cтили ячеек электронной таблицы.
- Создания нового стиля на основе другого.
- Цвета для шрифтов, фона, границ.
- Применение стилей.
- Горизонтальное и вертикальное выравнивание текста.
- Оформление границ ячеек.
- Заливка ячеек цветом и цвет текста.
- Именованные стили
NamedStyle.- Создание именованного стиля.
- Встроенные в Excel стили.
Аспекты применения стилей модулем openpyxl.
Стили могут быть применены к следующим аспектам:
font: устанавливает размер шрифта, цвет, стиль подчеркивания и т. д.fill: устанавливает шаблон или градиент цвета заливки ячейки.border: устанавливает стиль границы ячейки.alignment: устанавливает выравнивание ячейки.
Ниже приведены значения по умолчанию установленные модулем openpyxl:
from openpyxl.styles import (
                        PatternFill, Border, Side,
                        Alignment, Font, GradientFill
                        )

# СТИЛЬ ШРИФТА
font = Font(
        name='Calibri',
        size=11,
        bold=False,
        italic=False,
        vertAlign=None,
        underline='none',
        strike=False,
        color='FF000000'
            )

# ЗАЛИВКА ЯЧЕЕК
fill = PatternFill(fill_type=None, fgColor='FFFFFFFF')

# ГРАНИЦЫ ЯЧЕЕК
border = Border(
            left=Side(border_style=None, color='FF000000'),
            right=Side(border_style=None, color='FF000000'),
            top=Side(border_style=None, color='FF000000'),
            bottom=Side(border_style=None, color='FF000000'),
            diagonal=Side(border_style=None, color='FF000000'),
            diagonal_direction=0,
            outline=Side(border_style=None, color='FF000000'),
            vertical=Side(border_style=None, color='FF000000'),
            horizontal=Side(border_style=None, color='FF000000')
               )

# ВЫРАВНИВАНИЕ В ЯЧЕЙКАХ
alignment=Alignment(
                horizontal='general',
                vertical='bottom',
                text_rotation=0,
                wrap_text=False,
                shrink_to_fit=False,
                indent=0
                   )
Cтили ячеек электронной таблицы.
Существует два типа стилей: стили ячеек и именованные стили, также известные как шаблоны стилей.
Стили ячеек являются общими для объектов, и после того, как они были назначены, их нельзя изменить. Это предотвращает нежелательные побочные эффекты, такие как изменение стиля для большого количества ячеек при изменении только одной.
Например:
>>> from openpyxl.styles import colors
>>> from openpyxl.styles import Font, Color
>>> from openpyxl import Workbook
>>> wb = Workbook()
>>> ws = wb.active
>>> ws['A1'].value = 'Ячейка `A1`'
>>> ws['D4'].value = 'Ячейка `D4`'
# задаем стиль шрифта текста - цвет  ячейке
>>> ft = Font(color="FF0000")
# применяем стиль к ячейкам
>>> ws['A1'].font = ft
>>> ws['D4'].font = ft
# это изменение не сработает
>>> ws['D4'].font.italic = True
# Если необходимо изменить шрифт,
# то его необходимо переназначить новым стилем
ws['A1'].font = Font(color="FF0000", italic=True)
>>> wb.save('test.xlsx')
Создания нового стиля на основе другого.
Модуль openpyxl поддерживает копирование стилей.
Пример создания нового стиля на основе другого:
>>> from openpyxl.styles import Font
>>> from copy import copy
# задаем стиль
>>> ft1 = Font(name='Arial', size=14)
# копируем стиль
>>> ft2 = copy(ft1)
# а вот теперь на основе скопированного стиля
# можно создать новый, изменив атрибуты
>>> ft2.name = "Tahoma"
# имя шрифта первого стиля
>>> ft1.name
# 'Arial'

# имя шрифта нового стиля
>>> ft2.name
# 'Tahoma'

# размер остался как у первого
>>> ft2.size # copied from the
# 14.0
Цвета для шрифтов, фона, границ.
Цвета для шрифтов, фона, границ и т.д. Можно задать тремя способами: индексированный, aRGB или тема. Индексированные цвета являются устаревшей реализацией, и сами цвета зависят от индекса, предоставленного в рабочей книге или в приложении по умолчанию. Цвета темы полезны для дополнительных оттенков цветов, но также зависят от темы, присутствующей в рабочей книге. Поэтому рекомендуется использовать цвета aRGB.
Цвета aRGB.
Цвета RGB устанавливаются с использованием шестнадцатеричных значений красного, зеленого и синего.
>>> from openpyxl.styles import Font
>>> font = Font(color="FF0000")
Альфа-значение теоретически относится к прозрачности цвета, но это не относится к стилям ячеек. Значение по умолчанию 00 будет добавлено к любому простому значению RGB:
>>> from openpyxl.styles import Font
>>> font = Font(color="00FF00")
>>> font.color.rgb
# '0000FF00'
Применение стилей.
Стили применяются непосредственно к ячейкам.
>>> from openpyxl import Workbook
>>> from openpyxl.styles import Font, PatternFill
>>> wb = Workbook()
>>> ws = wb.active
>>> c = ws['A1']
>>> c.value = 'Ячейка `A1`'
>>> c.font = Font(size=12)
# можно напрямую
>>> ws['A2'].value = 'Ячейка `A2`'
>>> ws['A2'].font = Font(size=12, bold=True)
>>> wb.save('test.xlsx')
Стили также могут применяться к столбцам и строкам, но обратите внимание, что это относится только к ячейкам, созданным (в Excel) после закрытия файла. Если необходимо применить стили ко всем строкам и столбцам, то нужно применить стиль к каждой ячейке самостоятельно.
Это ограничение формата файла:
>>> col = ws.column_dimensions['A']
>>> col.font = Font(bold=True)
>>> row = ws.row_dimensions[1]
>>> row.font = Font(underline="single")
Горизонтальное и вертикальное выравнивание текста.
Горизонтальное и вертикальное выравнивание в ячейках выставляется атрибутом ячейки .alignment и классом Alignment().
Пример горизонтального выравнивания текста:
>>> from openpyxl import Workbook
>>> from openpyxl.styles import Alignment
>>> wb = Workbook()
>>> ws = wb.active
>>> ws['A1'].value = 1500
>>> ws['A2'].value = 1500
>>> ws['A3'].value = 1500
# выравниваем текст в ячейках стилями
>>> ws['A1'].alignment = Alignment(horizontal='left')
>>> ws['A2'].alignment = Alignment(horizontal='center')
>>> ws['A3'].alignment = Alignment(horizontal='right')
# сохраняем и смотрим что получилось
>>> wb.save('test.xlsx')
Вертикальное выравнивание в основном применяется когда изменена высота строки или были объединены несколько ячеек.
Пример вертикального выравнивания данных в ячейке:
>>> from openpyxl import Workbook
>>> from openpyxl.styles import Alignment
>>> wb = Workbook()
>>> ws = wb.active
# объединим ячейки в диапазоне `B2:E2`
>>> ws.merge_cells('B2:E2')
# в данном случае крайняя верхняя-левая ячейка это `B2`
>>> megre_cell = ws['B2']
# запишем в нее текст
>>> megre_cell.value = 'Объединенные ячейки `B2 : E2`'
# установить высоту строки
>>> ws.row_dimensions[2].height = 30
# установить ширину столбца
>>> ws.column_dimensions['B'].width = 40
# выравнивание текста
>>> megre_cell.alignment = Alignment(horizontal="center", vertical="center")
# сохраняем и смотрим что получилось
>>> wb.save("test.xlsx")
Оформление границ ячеек.
Цвет и стиль границ/бордюров ячеек выставляется атрибутом ячейки .border и классом Border() совместно с классом Side().
При этом аргумент стиля границ ячеек border_style может принимать ОДИН из следующих значений: ‘dashDotDot’, ‘medium’, ‘dotted’, ‘slantDashDot’, ‘thin’, ‘hair’, ‘mediumDashDotDot’, ‘dashDot’, ‘double’, ‘mediumDashed’, ‘dashed’, ‘mediumDashDot’ и ‘thick’.
Пример стилизации границ одной ячейки:
>>> from openpyxl import Workbook
>>> from openpyxl.styles import Border, Side
>>> wb = Workbook()
>>> ws = wb.active
>>> cell = ws['B2']
# установить высоту строки
>>> ws.row_dimensions[2].height = 30
# установить ширину столбца
>>> ws.column_dimensions['B'].width = 40
# определим стили сторон
>>> thins = Side(border_style="medium", color="0000ff")
>>> double = Side(border_style="dashDot", color="ff0000")
# рисуем границы
>>> cell.border = Border(top=double, bottom=double, left=thins, right=thins)
>>> wb.save("styled_border.xlsx")
Пример стилизации границ нескольких ячеек:
from openpyxl import Workbook
from openpyxl.styles import Border, Side

wb = Workbook()
ws = wb.active

# определим стили сторон
thins = Side(border_style="thin", color="0000ff")
double = Side(border_style="double", color="ff0000")

# начинаем заполнение области ячеек 10x10 данными
# при этом будем стилизировать границы области
for r, row in enumerate(range(5, 15), start=1):
    for c, col in enumerate(range(5, 15), start=1):
        # это значение, которое будем записывать в ячейку
        val_cell = r*c
        # левая верхняя ячейка
        if r == 1 and c == 1:
            ws.cell(row=row, column=col, value=val_cell).border = Border(top=double, left=thins)
        # правая верхняя ячейка
        elif r == 1 and c == 10:
            ws.cell(row=row, column=col, value=val_cell).border = Border(top=double, right=thins)
        # верхние ячейки
        if r == 1 and c != 1 and c != 10:
            ws.cell(row=row, column=col, value=val_cell).border = Border(top=double)
        # левая нижняя ячейка
        elif r == 10 and c == 1:
            ws.cell(row=row, column=col, value=val_cell).border = Border(bottom=double, left=thins)
        # правая нижняя ячейка
        elif r == 10 and c == 10:
            ws.cell(row=row, column=col, value=val_cell).border = Border(bottom=double, right=thins)
        # нижние ячейки
        elif r == 10 and c != 1 and c != 10:
            ws.cell(row=row, column=col, value=val_cell).border = Border(bottom=double)
        # левые ячейки
        elif c == 1 and r != 1 and r != 10:
            ws.cell(row=row, column=col, value=val_cell).border = Border(left=thins)
        # правые ячейки
        elif c == 10 and r != 1 and r != 10:
            ws.cell(row=row, column=col, value=val_cell).border = Border(right=thins)
        else:
            # здесь ячейки просто заполняются данными
            ws.cell(row=row, column=col, value=val_cell)

# сохраняем и смотрим что получилось
wb.save("styled_border.xlsx")
Заливка ячеек цветом и цвет текста.
Цвет заливки ячеек выставляется атрибутом ячейки .fill и классом PatternFill().
Обязательный аргумент fill_type (по умолчанию равен None) класса PatternFill() может принимать значения:
- если
fill_type='solid', то нужно обязательно указывать аргумент цвета заливкиfgColor. - следующие значения аргумента
fill_typeприменяются самостоятельно (без аргументаfgColor) и представляют собой предустановленные цвета заливки :‘darkHorizontal’,‘lightDown’,‘lightGray’,‘darkDown’,‘darkGrid’,‘darkUp’,‘darkGray’,‘darkVertical’,‘darkTrellis’,‘mediumGray’,‘lightVertical’,‘lightTrellis’,‘lightGrid’,‘lightHorizontal’,‘gray0625’,‘lightUp’,‘gray125’.
Внимание: если аргумент fill_type не указан, то fgColor не будет иметь никакого эффекта!
Пример заливки одной ячейки:
>>> from openpyxl import Workbook
>>> from openpyxl.styles import PatternFill, Font, Alignment
>>> wb = Workbook()
>>> ws = wb.active
# объединим ячейки в диапазоне `B2:E2`
>>> ws.merge_cells('B2:E2')
>>> megre_cell = ws['B2']
# запишем в нее текст
>>> megre_cell.value = 'Объединенные ячейки `B2 : E2`'
# установить высоту строки
>>> ws.row_dimensions[2].height = 30
# установить ширину столбца
>>> ws.column_dimensions['B'].width = 40
# заливка ячейки цветом
>>> megre_cell.fill = PatternFill('solid', fgColor="DDDDDD")
# шрифт и цвет текста ячейки
>>> megre_cell.font = Font(bold=True, color='FF0000', name='Arial', size=14)
# ну и для красоты выровним текст
>>> megre_cell.alignment = Alignment(horizontal='center', vertical='center')
# сохраняем и смотрим что получилось
>>> wb.save("cell_color.xlsx")
Именованные стили NamedStyle.
В отличие от простых стилей ячеек, именованные стили изменяемы и используется для объединения в себе нескольких стилей, таких как шрифты, границы, выравнивание и т. д. Они имеют смысл, когда необходимо применить форматирование к множеству разных ячеек одновременно. Об именованных стилях можно думать как о классах CSS при оформлении HTML-разметки. Именованные стили регистрируются в рабочей книге.
Примечание. После назначения ячейке именованного стиля, дальнейшие/дополнительные изменения этого стиля не повлияют на стиль ячейки.
Как только именованный стиль зарегистрирован в рабочей книге, на него можно ссылаться просто по имени.
Создание именованного стиля.
>>> from openpyxl.styles import NamedStyle, Font, Border, Side
# создание переменной именованного стиля
>>> name_style = NamedStyle(name="highlight")
# применение стилей к созданной переменной
>>> name_style.font = Font(bold=True, size=20)
>>> bd = Side(style='thick', color="000000")
>>> name_style.border = Border(left=bd, top=bd, right=bd, bottom=bd)
После создания именованного стиля его нужно зарегистрировать в рабочей книге:
>>> wb.add_named_style(name_style)
Именованные стили также будут автоматически зарегистрированы при первом назначении их ячейке:
>>> ws['A1'].style = name_style
После регистрации стиля в рабочей книге, применять его можно только по имени:
>>> ws['D5'].style = 'highlight'
Встроенные стили в Excel.
Спецификация включает в себя некоторые встроенные стили, которые также могут быть использованы. К сожалению, имена для этих стилей хранятся в их локализованных формах. OpenPyxl узнает только английские имена и только так, как они записаны в официальной документации.
Использование встроенных в Excel стилей здесь не рассматривается, так как при их применении могу возникать существенные искажения.
If you want to add color to Excel cells and make data more visually appealing, you need to know the way to manipulate Excel files using Python code.
There are several Python libraries, where you can achieve this, but we are going to focus on two of them: Openpyxl and XlsxWriter.
Installing Required Libraries
Now, it’s time to install the required libraries. You can install both using the PIP installer.
|
pip install openpyxl pip install xlsxwriter |
Color Formatting with XlsxWriter
XlsxWriter is another Python library used for creating Excel files. It also provides functionality for formatting cells, including adding color.
XlsxWriter also creates a file, so there is no need to create it manually.
Here are the steps to add color to Excel cells using XlsxWriter:
- Import the xlsxwriter module:
- Create a workbook:
|
wb = xlsxwriter.Workbook(‘example.xlsx’) |
- Create a worksheet:
- Create a cell format:
|
greenFormat = wb.add_format({‘bg_color’: ‘#00FF00’}) |
- Select the cell to add the format:
|
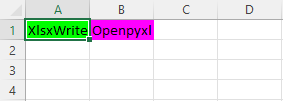
cell = ws.write(‘A1’, ‘XlsxWriter’, greenFormat) |
- Save the workbook:
Full code:
|
import xlsxwriter wb = xlsxwriter.Workbook(‘example.xlsx’) ws = wb.add_worksheet() greenFormat = wb.add_format({‘bg_color’: ‘#00FF00’}) cell = ws.write(‘A1’, ‘XlsxWriter’, greenFormat) wb.close() |
Color Formatting with Openpyxl
Openpyxl is a Python library that allows users to read and modify Excel files. It also provides functionality for formatting cells, including adding color.
Openpyxl doesn’t create a file, so you have to create it manually or run the previous XlsxWriter code.
Here are the steps to add color to Excel cells using Openpyxl:
- Import the openpyxl module and the necessary styles module:
|
import openpyxl from openpyxl.styles import PatternFill |
- Load the Excel workbook:
|
wb = openpyxl.load_workbook(‘example.xlsx’) |
- Select the worksheet:
- Create a pattern fill:
|
greenFill = PatternFill(start_color=‘FF00FF’, end_color=‘FF00FF’, fill_type=‘solid’) |
- Select the cell to add the fill:
- Add text to a cell:
- Apply the fill to the cell:
- Save the workbook:
This is the full code you can copy:
|
import openpyxl from openpyxl.styles import PatternFill wb = openpyxl.load_workbook(‘example.xlsx’) ws = wb.active greenFill = PatternFill(start_color=‘FF00FF’, end_color=‘FF00FF’, fill_type=‘solid’) cell = ws[‘B1’] cell.value = ‘Openpyxl’ cell.fill = greenFill wb.save(‘example.xlsx’) |
Result
If you open the Excel file, you can see that both cells are filled by different Python libraries:
Conclusion
As you can see, you can easily manipulate Excel using Python. I showed you both ways to do it, but XlsxWriter is the better way as the code is shorter and it can create Excel files, and not only read them.
Last Updated on July 14, 2022 by
This tutorial will show you how to use the Python openpyxl library to customize Excel formatting such as cell color, alignment, borderlines, etc. We’ll continue with the previous example to make our monthly budget spreadsheet look prettier.
Library
The only library required is openpyxl, type the following in the command prompt window to install the library:
pip install openpyxlIn openpyxl, each Cell object has a bunch of attributes we can use for formatting:
| Attribute | Usage |
| Cell.font | font style, size, color, etc |
| Cell.number_format | number formats |
| Cell.fill | cell color and pattern |
| Cell.border | cell border |
| Cell.alignment | text alignment |
Collectively, these attributes are called styles but I still prefer calling them just formats. One thing to note is that we can apply styles to only one cell at a time. So we’ll need to do a loop in order to format a range of cells.
Color – Pattern (solid) Fill
There are two types of cell color formatting: Pattern Fill and Gradient Fill.
We use Pattern Fill to make a solid color or a pattern for the cell. A Pattern Fill refers to the following formatting in Excel:

The below code changes cells B11:C11 to a light gray background and changes cells B19:C19 to a dotted background known as 6.25% Gray (found in the Pattern Style dropbox). To make the formatting easier to see, we’ll hide all gridlines in Excel by setting ws.sheet_view.showGridLines to False.
from openpyxl.styles import PatternFill, GradientFill
ws.sheet_view.showGridLines = False

for c in ws['B11:C11'][0]:
    c.fill = PatternFill('solid', fgColor = 'F2F2F2')

for c in ws['B19:C19'][0]:
    c.fill = PatternFill('gray0625')
Color – Gradient Fill
A Gradient Fill usually takes two colors and interpolates colors between them and fills the cell background. The following code takes a cyan color (’85E4F7′) and a light blue color (‘4617F1’) for the gradient fill. You can change the two RGB hex code inside the stop argument to any color to create your own gradient fill.
ws['E7'].fill = GradientFill('linear', stop = ('85E4F7','4617F1'))
ws['E9'].fill = GradientFill('linear', stop = ('85E4F7','4617F1'))
ws['E11'].fill = GradientFill('linear', stop = ('85E4F7','4617F1'))
ws['E13'].fill = GradientFill('linear', stop = ('85E4F7','4617F1'))
Borderlines
Borderlines refer to the four sides of a cell. With openpyxl, we can control the style (solid vs dash, etc), thickness, color, and position of the borderlines. We need two objects to model a cell’s borderline: Border and Side.
A Border can contain one or multiple Sides. Then we assign the cell.border attribute to a Border object to create the borderlines.
from openpyxl.styles import Border, Side

double = Side(border_style="double", color="4617F1")
thin = Side(border_style="thin", color="4617F1")
regular = Side(border_style="medium", color="000000")

## For the title cells B2 to F2
for c in ws['B2:F2'][0]:
    c.border = Border(bottom=double, top=thin)


no_left_side = Border(top = regular,bottom=regular,right=regular)
no_right_side = Border(top = regular,bottom=regular, left=regular)
box = Border(top = regular,bottom=regular, left=regular,right=regular)

## For the "table-like" cells
for c in ws['B8:B11']+ws['B15:B19']:
    c[0].border = no_left_side

for c in ws['C8:C11']+ws['C15:C19']:
    c[0].border = no_right_side
Text Alignment
We use the Alignment object to model text/number alignment within a cell, then assign the cell.alignment attribute to the object.
from openpyxl.styles import Alignment

center_align = Alignment(horizontal='center', vertical='center')

for c in ws['C8:C11']+ws['C15:C19']:
    c[0].border = no_right_side
    c[0].alignment = center_align

for c in ws['F7:F14']:
    c[0].alignment = center_align
Additional Resources
Python & Excel – Number Format
Python openpyxl – How to Insert Rows, Columns in Excel
Adjust Excel Fonts using Python openpyxl
Write Data to Excel using Python
What will we cover in this tutorial?
We will learn how you can dynamically format the cells in Excel to have a specific color based on the value of a function – all done from Python.
As an example we will color the cells of two columns depending on which is larger.

In this concrete example we will collect historical stock prices and calculate the Moving Averages of 50 and 200 days on the closing price. In a crossover way to utilize moving averages, you would send a buy-signal when the 50-day moving average crosses above the 200-day moving average and a sell-signal if the other way around.
Step 1: Collect the data from Yahoo! Finance using Pandas-datareader
A great library to use to collect financial data is the Pandas-datareader.
We will collect data from Yahoo! Finance. As an example we will use General Motors historical stock data.
This can be done as follows.
import pandas_datareader as pdr
import datetime as dt

start = dt.datetime(2019, 1, 1)
ticker = pdr.get_data_yahoo("GM", start)
This will result in a Pandas DataFrame with data similar to this.
                 High        Low       Open      Close      Volume  Adj Close
Date
2019-01-02  33.810001  32.410000  32.849998  33.639999   7662300.0  31.893360
2019-01-03  33.680000  32.200001  33.340000  32.250000  11618300.0  30.575533
2019-01-04  33.570000  32.430000  32.799999  33.330002  10784000.0  31.599455
2019-01-07  34.970001  33.480000  33.709999  34.360001  10722300.0  32.575977
2019-01-08  35.680000  34.490002  35.000000  34.810001  10532900.0  33.002617
Step 2: Calculate the Moving Averages
The moving average can be calculated by applying the rolling() and mean() methods on the DataFrame.
The rolling() creates a window size which is the number of observations used for calculating the statistic.
To calculate the Moving Average of window size 50 will use the last 50 data points to calculate the mean. To be consistent with Yahoo! Finance way of calculate the value, they use the Close price.
import pandas_datareader as pdr
import datetime as dt
import xlsxwriter
import pandas as pd

start = dt.datetime(2019, 1, 1)
ticker = pdr.get_data_yahoo("GM", start)
ticker['MA50'] = ticker['Close'].rolling(50).mean()
ticker['MA200'] = ticker['Close'].rolling(200).mean()
Which will give a tail similar to this output.
                 High        Low       Open  ...  Adj Close     MA50     MA200
Date                                         ...
2020-12-14  42.540001  41.419998  42.490002  ...  41.619999  38.5632  29.03155
2020-12-15  42.160000  41.310001  41.990002  ...  41.660000  38.7772  29.08725
2020-12-16  41.869999  40.810001  41.790001  ...  41.419998  38.9976  29.13670
2020-12-17  42.029999  41.430000  41.709999  ...  42.029999  39.2058  29.19635
2020-12-18  42.042801  41.139999  42.020000  ...  41.389999  39.3894  29.25985
Where the Moving Averages are added to the DataFrame.
Step 3: Exporting to Excel using XlsxWriter
We will use the powerful XlsxWriter to create our Excel sheet.
You can write the DataFrame directly by using to_excel(…), but we want to do more than that. Hence, we use the XlsxWriter directly.
import pandas_datareader as pdr
import datetime as dt
import pandas as pd

start = dt.datetime(2019, 1, 1)
ticker = pdr.get_data_yahoo("GM", start)
ticker['MA50'] = ticker['Close'].rolling(50).mean()
ticker['MA200'] = ticker['Close'].rolling(200).mean()
# We only want the index as a date and not datetime object
ticker.index = ticker.index.date
# We skip the first 200 entries, as it they do not have the MA200
ticker = ticker.iloc[200:]
# We reverse the DataFrame to have newest first
ticker = ticker.iloc[::-1]
# Create a Pandas Excel writer using XlsxWriter as the engine.
writer = pd.ExcelWriter('moving_average.xlsx', engine='xlsxwriter')
# Convert the dataframe to an XlsxWriter Excel object.
ticker.to_excel(writer, sheet_name='Moving Averages')
# Remember to close the writer to write the Excel sheet
writer.close()
This will create an Excel sheet similar to this one.

Step 4: Adding formatting to the cells
This is a bit more complex as we need to do the magic here.
We first need to create a reference to the sheet (worksheet) we work on to access the functionality.
The first thing we do is to resize column A, such that it opens in the correct size to see the date. This is done by using set_column(…).
Then we create a format, which can be applied on Excel cells. This is how we color them. Hence, we create one for green cells and later one for red cells.
We insert them by using conditional_format(…), which a range of cells. This can be applied in different ways, we use the A1 notation.
The options parameter in conditional_format(…) must be a dictionary containing the parameters that describe the type and style of the conditional format. To see details of the format please refer to the manual.
import pandas_datareader as pdr
import datetime as dt
import pandas as pd

start = dt.datetime(2019, 1, 1)
ticker = pdr.get_data_yahoo("GM", start)
ticker['MA50'] = ticker['Close'].rolling(50).mean()
ticker['MA200'] = ticker['Close'].rolling(200).mean()
# We only want the index as a date and not datetime object
ticker.index = ticker.index.date
# We skip the first 200 entries, as it they do not have the MA200
ticker = ticker.iloc[200:]
# We reverse the DataFrame to have newest first
ticker = ticker.iloc[::-1]
# Create a Pandas Excel writer using XlsxWriter as the engine.
writer = pd.ExcelWriter('moving_average.xlsx', engine='xlsxwriter')
# Convert the dataframe to an XlsxWriter Excel object.
ticker.to_excel(writer, sheet_name='Moving Averages')
# Get the xlsxwriter objects from the dataframe writer object.
workbook = writer.book
worksheet = writer.sheets['Moving Averages']
# Resize the column A
worksheet.set_column("A:A", 12)
# Calculate the last row number (we insert first DataFrame row in row 2)
last_row = len(ticker) + 1
# Create a format for a green cell
cell_format_green = workbook.add_format()
cell_format_green.set_bg_color('green')
# Create a conditional formatted of type formula
worksheet.conditional_format('H2:I{}'.format(last_row), {'type':     'formula',
                                                         'criteria': '=$H2>=$I2',
                                                         'format':   cell_format_green})
# Create a format for a red cell
cell_format_red = workbook.add_format()
cell_format_red.set_bg_color('red')
# Create a conditional formatted of type formula
worksheet.conditional_format('H2:I{}'.format(last_row), {'type':     'formula',
                                                         'criteria': '=$H2<$I2',
                                                         'format':   cell_format_red})
# Remember to close the writer
writer.close()
This will result in the expected Excel sheet.

Step 5: Validating it works as expected
Now for the final test.
The colors should be updated dynamically. Let’s try to change the value and see what happens.


It does. If we change the value of H2 to 10, it turns the cells to red.
Python Circle
Do you know what the 5 key success factors every programmer must have?
How is it possible that some people become programmer so fast?
While others struggle for years and still fail.
Not only do they learn python 10 times faster they solve complex problems with ease.
What separates them from the rest?
I identified these 5 success factors that every programmer must have to succeed:
- Collaboration: sharing your work with others and receiving help with any questions or challenges you may have.
- Networking: the ability to connect with the right people and leverage their knowledge, experience, and resources.
- Support: receive feedback on your work and ask questions without feeling intimidated or judged.
- Accountability: stay motivated and accountable to your learning goals by surrounding yourself with others who are also committed to learning Python.
- Feedback from the instructor: receiving feedback and support from an instructor with years of experience in the field.
I know how important these success factors are for growth and progress in mastering Python.
That is why I want to make them available to anyone struggling to learn or who just wants to improve faster.
With the Python Circle community, you can take advantage of 5 key success factors every programmer must have.

Be part of something bigger and join the Python Circle community.
This section describes the methods and properties that are available for
formatting cells in Excel.
The properties of a cell that can be formatted include: fonts, colors,
patterns, borders, alignment and number formatting.
Creating and using a Format object
Cell formatting is defined through a Format object. Format objects are created
by calling the workbook add_format() method as follows:
cell_format1 = workbook.add_format()       # Set properties later.
cell_format2 = workbook.add_format(props)  # Set properties at creation.
There are two ways of setting Format properties: by using the object interface
or by setting the property as a dictionary of key/value pairs in the
constructor. For example, a typical use of the object interface would be as
follows:
cell_format = workbook.add_format()
cell_format.set_bold()
cell_format.set_font_color('red')
By comparison the properties can be set by passing a dictionary of properties
to the add_format() constructor:
cell_format = workbook.add_format({'bold': True, 'font_color': 'red'})
In general the key/value interface is more flexible and clearer than the
object method and is the recommended method for setting format
properties. However, both methods produce the same result.
Once a Format object has been constructed and its properties have been set it
can be passed as an argument to the worksheet write() methods as
follows:
worksheet.write       (0, 0, 'Foo', cell_format)
worksheet.write_string(1, 0, 'Bar', cell_format)
worksheet.write_number(2, 0, 3,     cell_format)
worksheet.write_blank (3, 0, '',    cell_format)
Formats can also be passed to the worksheet set_row() and
set_column() methods to define the default formatting properties for a
row or column:
worksheet.set_row(0, 18, cell_format)
worksheet.set_column('A:D', 20, cell_format)
Format Defaults
The default Excel 2007+ cell format is Calibri 11 with all other properties off.
In general a format method call without an argument will turn a property on,
for example:
cell_format = workbook.add_format()

cell_format.set_bold()      # Turns bold on.
cell_format.set_bold(True)  # Also turns bold on.
Since most properties are already off by default it isn’t generally required to
turn them off. However, it is possible if required:
cell_format.set_bold(False) # Turns bold off.
Modifying Formats
Each unique cell format in an XlsxWriter spreadsheet must have a corresponding
Format object. It isn’t possible to use a Format with a write() method
and then redefine it for use at a later stage. This is because a Format is
applied to a cell not in its current state but in its final state. Consider
the following example:
cell_format = workbook.add_format({'bold': True, 'font_color': 'red'})
worksheet.write('A1', 'Cell A1', cell_format)

# Later...
cell_format.set_font_color('green')
worksheet.write('B1', 'Cell B1', cell_format)
Cell A1 is assigned a format which initially has the font set to the color
red. However, the color is subsequently set to green. When Excel displays
Cell A1 it will display the final state of the Format which in this case will
be the color green.
Number Format Categories
The set_num_format() method, shown below, is used to set the number
format for numbers:
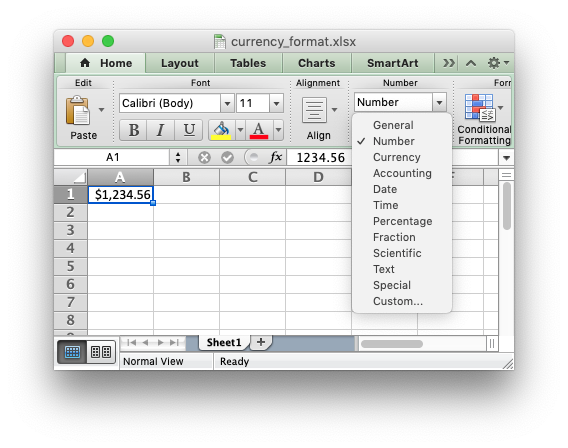
import xlsxwriter

workbook = xlsxwriter.Workbook('currency_format.xlsx')
worksheet = workbook.add_worksheet()

currency_format = workbook.add_format({'num_format': '$#,##0.00'})
worksheet.write('A1', 1234.56, currency_format)

workbook.close()
If the number format you use is the same as one of Excel’s built in number
formats then it will have a number category such as General, Number, Currency,
Accounting, Date, Time, Percentage, Fraction, Scientific, Text, Special or
Custom. In the case of the example above the formatted output shows up as a
Number category:
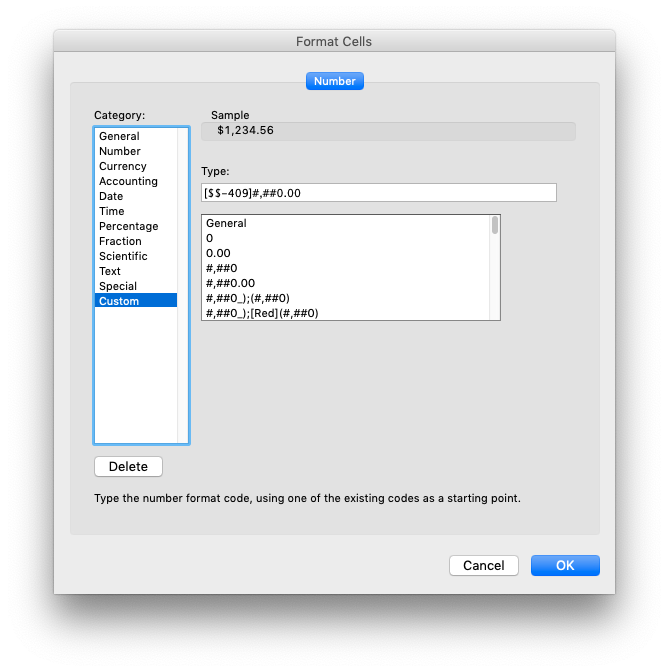
If we wanted it to have a different category, such as Currency, then
we would have to match the number format string with the number format used by
Excel. The easiest way to do this is to open the Number Formatting dialog in
Excel and set the format that you want:
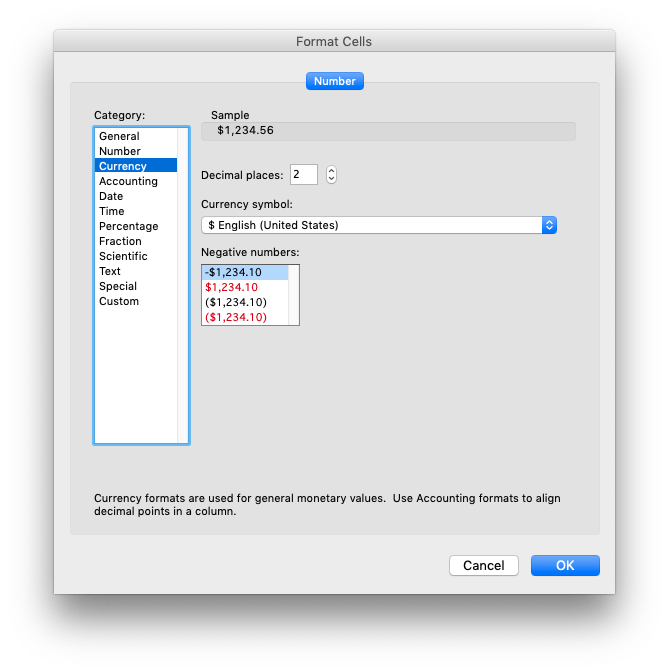
Then, while still in the dialog, change to Custom. The format displayed is the
format used by Excel.
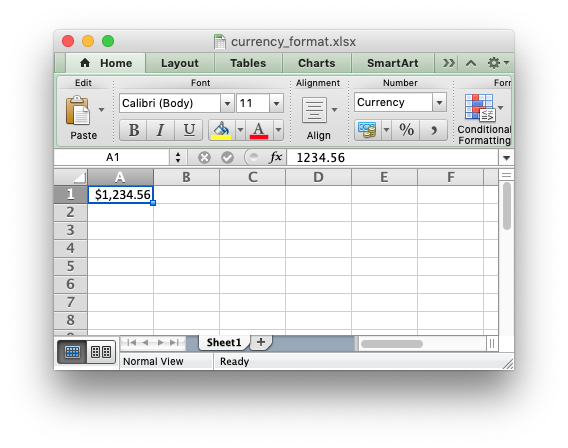
If we put the format that we found ('[$$-409]#,##0.00') into our previous
example and rerun it we will get a number format in the Currency category:
import xlsxwriter

workbook = xlsxwriter.Workbook('currency_format.xlsx')
worksheet = workbook.add_worksheet()

currency_format = workbook.add_format({'num_format': '[$$-409]#,##0.00'})
worksheet.write('A1', 1234.56, currency_format)

workbook.close()
Here is the output:
The same process can be used to find format strings for Date or Accountancy
formats. However, you also need to be aware of the OS settings Excel uses for
number separators such as the “grouping/thousands” separator and the “decimal”
point. See the next section for details.
Number Formats in different locales
As shown in the previous section the set_num_format() method is used to
set the number format for Xlsxwriter formats. A common use case is to set a
number format with a “grouping/thousands” separator and a “decimal” point:
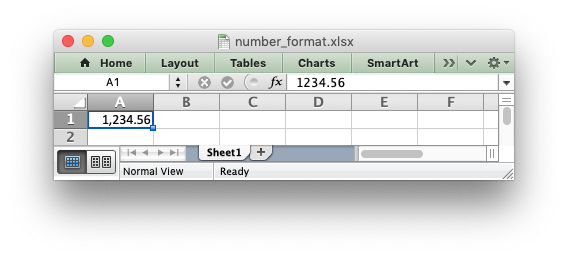
import xlsxwriter

workbook = xlsxwriter.Workbook('number_format.xlsx')
worksheet = workbook.add_worksheet()

number_format = workbook.add_format({'num_format': '#,##0.00'})
worksheet.write('A1', 1234.56, number_format)

workbook.close()
In the US locale (and some others) where the number “grouping/thousands”
separator is “,” and the “decimal” point is “.” this would be shown in Excel
as:
In other locales these values may be reversed or different. They are generally
set in the “Region” settings of Windows or Mac OS. Excel handles this by
storing the number format in the file format in the US locale, in this case
#,##0.00, but renders it according to the regional settings of the host
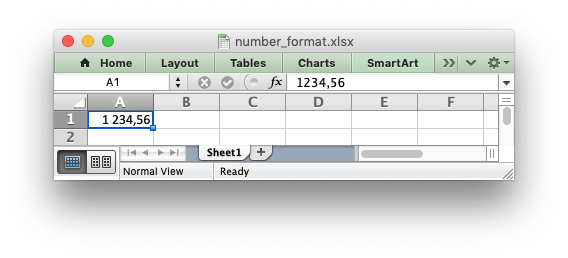
OS. For example, here is the same, unmodified, output file shown above in a
German locale:

And here is the same file in a Russian locale. Note the use of a space as the
“grouping/thousands” separator:
In order to replicate Excel’s behavior all XlsxWriter programs should use US
locale formatting which will then be rendered in the settings of your host OS.
Format methods and Format properties
The following table shows the Excel format categories, the formatting
properties that can be applied and the equivalent object method:
| Category | Description | Property | Method Name |
|---|---|---|---|
| Font | Font type | 'font_name' |
set_font_name() |
| Font size | 'font_size' |
set_font_size() |
|
| Font color | 'font_color' |
set_font_color() |
|
| Bold | 'bold' |
set_bold() |
|
| Italic | 'italic' |
set_italic() |
|
| Underline | 'underline' |
set_underline() |
|
| Strikeout | 'font_strikeout' |
set_font_strikeout() |
|
| Super/Subscript | 'font_script' |
set_font_script() |
|
| Number | Numeric format | 'num_format' |
set_num_format() |
| Protection | Lock cells | 'locked' |
set_locked() |
| Hide formulas | 'hidden' |
set_hidden() |
|
| Alignment | Horizontal align | 'align' |
set_align() |
| Vertical align | 'valign' |
set_align() |
|
| Rotation | 'rotation' |
set_rotation() |
|
| Text wrap | 'text_wrap' |
set_text_wrap() |
|
| Reading order | 'reading_order' |
set_reading_order() |
|
| Justify last | 'text_justlast' |
set_text_justlast() |
|
| Center across | 'center_across' |
set_center_across() |
|
| Indentation | 'indent' |
set_indent() |
|
| Shrink to fit | 'shrink' |
set_shrink() |
|
| Pattern | Cell pattern | 'pattern' |
set_pattern() |
| Background color | 'bg_color' |
set_bg_color() |
|
| Foreground color | 'fg_color' |
set_fg_color() |
|
| Border | Cell border | 'border' |
set_border() |
| Bottom border | 'bottom' |
set_bottom() |
|
| Top border | 'top' |
set_top() |
|
| Left border | 'left' |
set_left() |
|
| Right border | 'right' |
set_right() |
|
| Border color | 'border_color' |
set_border_color() |
|
| Bottom color | 'bottom_color' |
set_bottom_color() |
|
| Top color | 'top_color' |
set_top_color() |
|
| Left color | 'left_color' |
set_left_color() |
|
| Right color | 'right_color' |
set_right_color() |
The format properties and methods are explained in the following sections.
format.set_font_name()
-
set_font_name(fontname) -
Set the font used in the cell.
Parameters: fontname (string) – Cell font.
Specify the font used used in the cell format:
cell_format.set_font_name('Times New Roman')
Excel can only display fonts that are installed on the system that it is
running on. Therefore it is best to use the fonts that come as standard such
as ‘Calibri’, ‘Times New Roman’ and ‘Courier New’.
The default font for an unformatted cell in Excel 2007+ is ‘Calibri’.
format.set_font_size()
-
set_font_size(size) -
Set the size of the font used in the cell.
Parameters: size (int) – The cell font size.
Set the font size of the cell format:
cell_format = workbook.add_format()
cell_format.set_font_size(30)
Excel adjusts the height of a row to accommodate the largest font size in the
row. You can also explicitly specify the height of a row using the
set_row() worksheet method.
format.set_font_color()
-
set_font_color(color) -
Set the color of the font used in the cell.
Parameters: color (string) – The cell font color.
Set the font color:
cell_format = workbook.add_format()

cell_format.set_font_color('red')

worksheet.write(0, 0, 'Wheelbarrow', cell_format)
The color can be a Html style #RRGGBB string or a limited number of named
colors, see Working with Colors.
Note: The set_font_color() method is used to set the color of the font
in a cell. To set the color of a cell use the set_bg_color() and
set_pattern() methods.
format.set_bold()
-
set_bold() -
Turn on bold for the format font.
Set the bold property of the font:
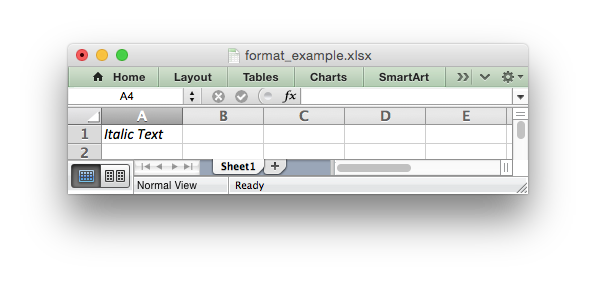
format.set_italic()
-
set_italic() -
Turn on italic for the format font.
Set the italic property of the font:
format.set_underline()
-
set_underline() -
Turn on underline for the format.
Parameters: style (int) – Underline style.
Set the underline property of the format:
cell_format.set_underline()

The available underline styles are:
- 1 = Single underline (the default)
- 2 = Double underline
- 33 = Single accounting underline
- 34 = Double accounting underline
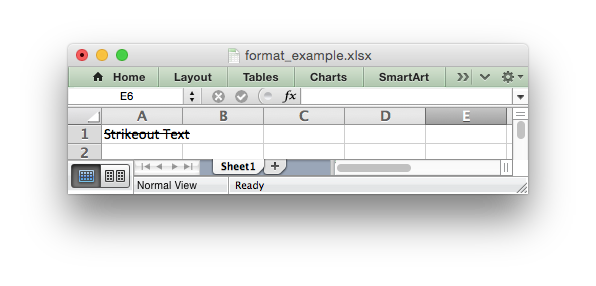
format.set_font_strikeout()
-
set_font_strikeout() -
Set the strikeout property of the font.
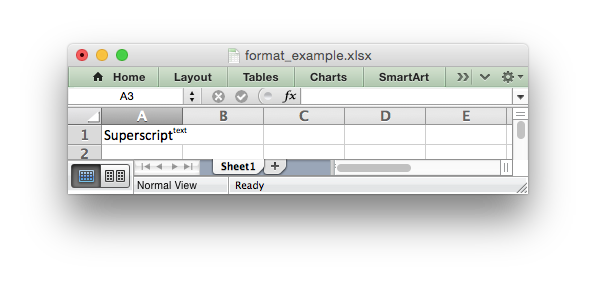
format.set_font_script()
-
set_font_script() -
Set the superscript/subscript property of the font.
The available options are:
- 1 = Superscript
- 2 = Subscript
This property is generally only useful when used in conjunction with
write_rich_string().
format.set_num_format()
-
set_num_format(format_string) -
Set the number format for a cell.
Parameters: format_string (string) – The cell number format.
This method is used to define the numerical format of a number in Excel. It
controls whether a number is displayed as an integer, a floating point number,
a date, a currency value or some other user defined format.
The numerical format of a cell can be specified by using a format string or an
index to one of Excel’s built-in formats:
cell_format1 = workbook.add_format()
cell_format2 = workbook.add_format()

cell_format1.set_num_format('d mmm yyyy')  # Format string.
cell_format2.set_num_format(0x0F)          # Format index.
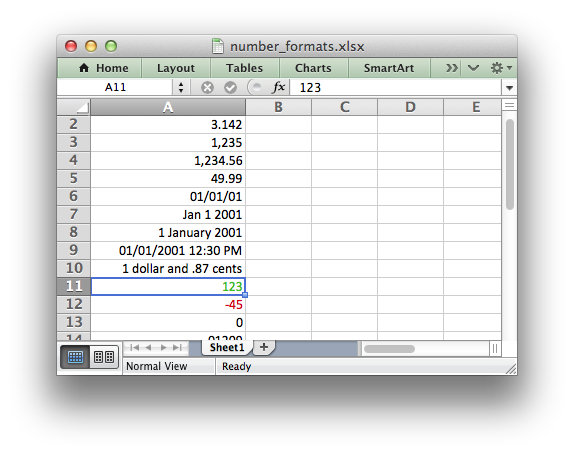
Format strings can control any aspect of number formatting allowed by Excel:
cell_format01.set_num_format('0.000')
worksheet.write(1, 0, 3.1415926, cell_format01)       # -> 3.142

cell_format02.set_num_format('#,##0')
worksheet.write(2, 0, 1234.56, cell_format02)         # -> 1,235

cell_format03.set_num_format('#,##0.00')
worksheet.write(3, 0, 1234.56, cell_format03)         # -> 1,234.56

cell_format04.set_num_format('0.00')
worksheet.write(4, 0, 49.99, cell_format04)           # -> 49.99

cell_format05.set_num_format('mm/dd/yy')
worksheet.write(5, 0, 36892.521, cell_format05)       # -> 01/01/01

cell_format06.set_num_format('mmm d yyyy')
worksheet.write(6, 0, 36892.521, cell_format06)       # -> Jan 1 2001

cell_format07.set_num_format('d mmmm yyyy')
worksheet.write(7, 0, 36892.521, cell_format07)       # -> 1 January 2001

cell_format08.set_num_format('dd/mm/yyyy hh:mm AM/PM')
worksheet.write(8, 0, 36892.521, cell_format08)       # -> 01/01/2001 12:30 AM

cell_format09.set_num_format('0 "dollar and" .00 "cents"')
worksheet.write(9, 0, 1.87, cell_format09)            # -> 1 dollar and .87 cents

# Conditional numerical formatting.
cell_format10.set_num_format('[Green]General;[Red]-General;General')
worksheet.write(10, 0, 123, cell_format10)  # > 0 Green
worksheet.write(11, 0, -45, cell_format10)  # < 0 Red
worksheet.write(12, 0,   0, cell_format10)  # = 0 Default color

# Zip code.
cell_format11.set_num_format('00000')
worksheet.write(13, 0, 1209, cell_format11)
The number system used for dates is described in
Working with Dates and Time.
The color format should have one of the following values:
[Black] [Blue] [Cyan] [Green] [Magenta] [Red] [White] [Yellow]
For more information refer to the Microsoft documentation on cell formats.
For information on how to get a number format to show up as one of the number
format categories such as Currency, Accounting, Date, Time, Percentage,
Fraction, Scientific or Text, see Number Format Categories, above.
For backwards compatibility XlsxWriter also supports Excel’s built-in formats
which are set via an index number, rather than a string:
cell_format.set_num_format(3) # Same as #,##0
The format indexes and the equivalent strings are shown in the following
table:
| Index | Format String |
|---|---|
| 0 | General |
| 1 | 0 |
| 2 | 0.00 |
| 3 | #,##0 |
| 4 | #,##0.00 |
| 5 | ($#,##0_);($#,##0) |
| 6 | ($#,##0_);[Red]($#,##0) |
| 7 | ($#,##0.00_);($#,##0.00) |
| 8 | ($#,##0.00_);[Red]($#,##0.00) |
| 9 | 0% |
| 10 | 0.00% |
| 11 | 0.00E+00 |
| 12 | # ?/? |
| 13 | # ??/?? |
| 14 | m/d/yy |
| 15 | d-mmm-yy |
| 16 | d-mmm |
| 17 | mmm-yy |
| 18 | h:mm AM/PM |
| 19 | h:mm:ss AM/PM |
| 20 | h:mm |
| 21 | h:mm:ss |
| 22 | m/d/yy h:mm |
| … | … |
| 37 | (#,##0_);(#,##0) |
| 38 | (#,##0_);[Red](#,##0) |
| 39 | (#,##0.00_);(#,##0.00) |
| 40 | (#,##0.00_);[Red](#,##0.00) |
| 41 | _(* #,##0_);_(* (#,##0);_(* "-"_);_(@_) |
| 42 | _($* #,##0_);_($* (#,##0);_($* "-"_);_(@_) |
| 43 | _(* #,##0.00_);_(* (#,##0.00);_(* "-"??_);_(@_) |
| 44 | _($* #,##0.00_);_($* (#,##0.00);_($* "-"??_);_(@_) |
| 45 | mm:ss |
| 46 | [h]:mm:ss |
| 47 | mm:ss.0 |
| 48 | ##0.0E+0 |
| 49 | @ |
Numeric formats 23 to 36 are not documented by Microsoft and may differ in
international versions. The listed date and currency formats may also vary
depending on system settings.
The dollar sign in the above format usually appears as the defined local
currency symbol. To get more locale specific formatting see see
Number Format Categories, above.
format.set_locked()
-
set_locked(state) -
Set the cell locked state.
Parameters: state (bool) – Turn cell locking on or off. Defaults to True.
This property can be used to prevent modification of a cell’s contents.
Following Excel’s convention, cell locking is turned on by default. However,
it only has an effect if the worksheet has been protected using the worksheet
protect() method:
locked = workbook.add_format()
locked.set_locked(True)

unlocked = workbook.add_format()
unlocked.set_locked(False)

# Enable worksheet protection
worksheet.protect()

# This cell cannot be edited.
worksheet.write('A1', '=1+2', locked)

# This cell can be edited.
worksheet.write('A2', '=1+2', unlocked)
format.set_align()
-
set_align(alignment) -
Set the alignment for data in the cell.
Parameters: alignment (string) – The vertical and or horizontal alignment direction.
This method is used to set the horizontal and vertical text alignment within a
cell. The following are the available horizontal alignments:
| Horizontal alignment |
|---|
| left |
| center |
| right |
| fill |
| justify |
| center_across |
| distributed |
The following are the available vertical alignments:
| Vertical alignment |
|---|
| top |
| vcenter |
| bottom |
| vjustify |
| vdistributed |
As in Excel, vertical and horizontal alignments can be combined:
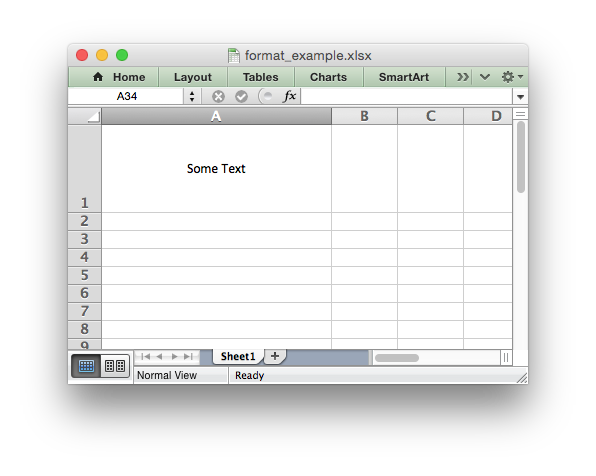
cell_format = workbook.add_format()

cell_format.set_align('center')
cell_format.set_align('vcenter')

worksheet.set_row(0, 70)
worksheet.set_column('A:A', 30)

worksheet.write(0, 0, 'Some Text', cell_format)
Text can be aligned across two or more adjacent cells using the
'center_across' property. However, for genuine merged cells it is better
to use the merge_range() worksheet method.
The 'vjustify' (vertical justify) option can be used to provide automatic
text wrapping in a cell. The height of the cell will be adjusted to
accommodate the wrapped text. To specify where the text wraps use the
set_text_wrap() method.
format.set_center_across()
-
set_center_across() -
Center text across adjacent cells.
Text can be aligned across two or more adjacent cells using the
set_center_across() method. This is an alias for the
set_align('center_across') method call.
Only the leftmost cell should contain the text. The other cells in the range
should be blank but should include the formatting:
cell_format = workbook.add_format()
cell_format.set_center_across()

worksheet.write(1, 1, 'Center across selection', cell_format)
worksheet.write_blank(1, 2, '', cell_format)
For actual merged cells it is better to use the merge_range() worksheet
method.
format.set_text_wrap()
-
set_text_wrap() -
Wrap text in a cell.
Turn text wrapping on for text in a cell:
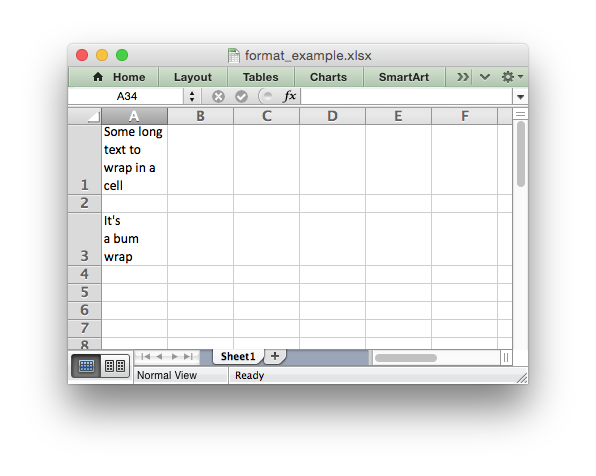
cell_format = workbook.add_format()
cell_format.set_text_wrap()

worksheet.write(0, 0, "Some long text to wrap in a cell", cell_format)
If you wish to control where the text is wrapped you can add newline characters
to the string:
worksheet.write(2, 0, "It'sna bumnwrap", cell_format)
Excel will adjust the height of the row to accommodate the wrapped text, as
shown in the image above. This can be useful but it can also have unwanted
side-effects:
- Objects such as images or charts that cross the automatically adjusted cells
will not be scaled correctly. See Object scaling due to automatic row height adjustment. - You may not want the row height to change. In that case you should set the
row height to a non-default value such as 15.001.
format.set_rotation()
-
set_rotation(angle) -
Set the rotation of the text in a cell.
Parameters: angle (int) – Rotation angle in the range -90 to 90 and 270.
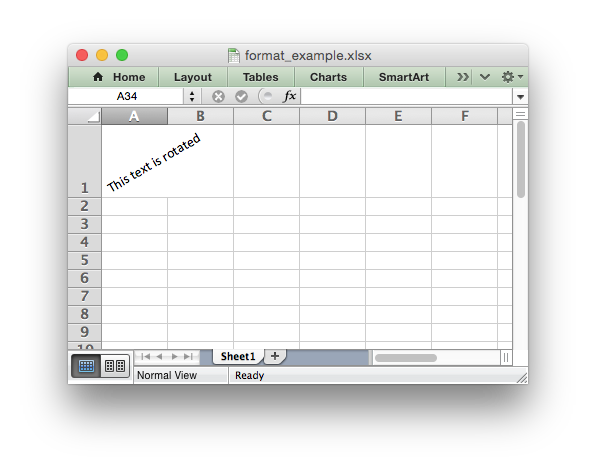
Set the rotation of the text in a cell. The rotation can be any angle in the
range -90 to 90 degrees:
cell_format = workbook.add_format()
cell_format.set_rotation(30)

worksheet.write(0, 0, 'This text is rotated', cell_format)
The angle 270 is also supported. This indicates text where the letters run from
top to bottom.
format.set_reading_order()
-
set_reading_order(direction) -
Set the reading order for the text in a cell.
Parameters: direction (int) – Reading order direction.
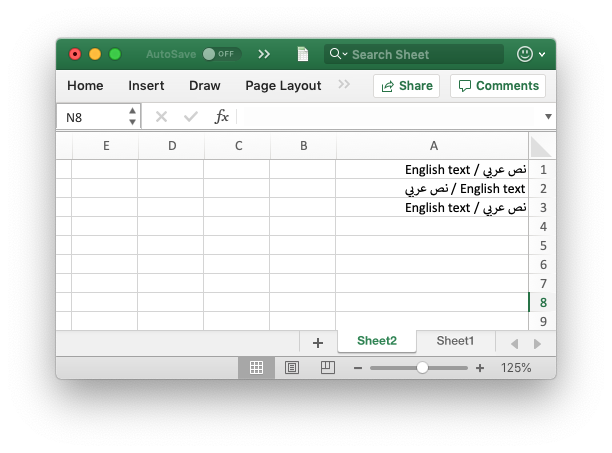
Set the text reading direction. This is useful when creating Arabic, Hebrew or
other near or far eastern worksheets. It can be used in conjunction with the
Worksheet right_to_left() method to also change the direction of the
worksheet.
format_left_to_right = workbook.add_format()
format_left_to_right.set_reading_order(1)

format_right_to_left = workbook.add_format()
format_right_to_left.set_reading_order(2)

worksheet.right_to_left()

worksheet.write('A1', u'نص عربي / English text')  # Default direction.
worksheet.write('A2', u'نص عربي / English text', format_left_to_right)
worksheet.write('A3', u'نص عربي / English text', format_right_to_left)
format.set_indent()
-
set_indent(level) -
Set the cell text indentation level.
Parameters: level (int) – Indentation level.
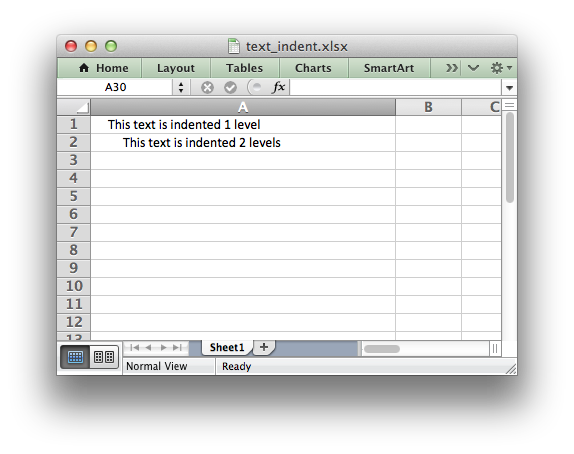
This method can be used to indent text in a cell. The argument, which should be
an integer, is taken as the level of indentation:
cell_format1 = workbook.add_format()
cell_format2 = workbook.add_format()

cell_format1.set_indent(1)
cell_format2.set_indent(2)

worksheet.write('A1', 'This text is indented 1 level',  cell_format1)
worksheet.write('A2', 'This text is indented 2 levels', cell_format2)
Indentation is a horizontal alignment property. It will override any other
horizontal properties but it can be used in conjunction with vertical
properties.
format.set_shrink()
-
set_shrink() -
Turn on the text “shrink to fit” for a cell.
This method can be used to shrink text so that it fits in a cell:
cell_format = workbook.add_format()
cell_format.set_shrink()

worksheet.write(0, 0, 'Honey, I shrunk the text!', cell_format)
format.set_text_justlast()
-
set_text_justlast() -
Turn on the justify last text property.
Only applies to Far Eastern versions of Excel.
format.set_pattern()
-
set_pattern(index) -
Parameters: index (int) – Pattern index. 0 — 18.
Set the background pattern of a cell.
The most common pattern is 1 which is a solid fill of the background color.
format.set_bg_color()
-
set_bg_color(color) -
Set the color of the background pattern in a cell.
Parameters: color (string) – The cell font color.
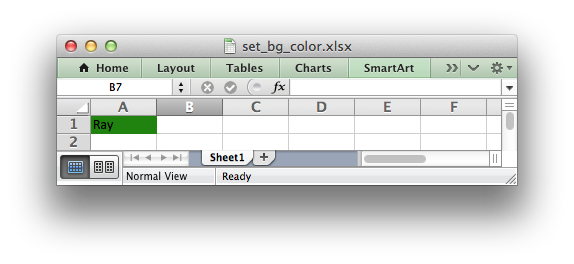
The set_bg_color() method can be used to set the background color of a
pattern. Patterns are defined via the set_pattern() method. If a pattern
hasn’t been defined then a solid fill pattern is used as the default.
Here is an example of how to set up a solid fill in a cell:
cell_format = workbook.add_format()

cell_format.set_pattern(1)  # This is optional when using a solid fill.
cell_format.set_bg_color('green')

worksheet.write('A1', 'Ray', cell_format)
The color can be a Html style #RRGGBB string or a limited number of named
colors, see Working with Colors.
format.set_fg_color()
-
set_fg_color(color) -
Set the color of the foreground pattern in a cell.
Parameters: color (string) – The cell font color.
The set_fg_color() method can be used to set the foreground color of a
pattern.
The color can be a Html style #RRGGBB string or a limited number of named
colors, see Working with Colors.
format.set_border()
-
set_border(style) -
Set the cell border style.
Parameters: style (int) – Border style index. Default is 1.
Individual border elements can be configured using the following methods with
the same parameters:
set_bottom()set_top()set_left()set_right()
A cell border is comprised of a border on the bottom, top, left and right.
These can be set to the same value using set_border() or individually
using the relevant method calls shown above.
The following shows the border styles sorted by XlsxWriter index number:
| Index | Name | Weight | Style |
|---|---|---|---|
| 0 | None | 0 | |
| 1 | Continuous | 1 | ----------- |
| 2 | Continuous | 2 | ----------- |
| 3 | Dash | 1 | - - - - - - |
| 4 | Dot | 1 | . . . . . . |
| 5 | Continuous | 3 | ----------- |
| 6 | Double | 3 | =========== |
| 7 | Continuous | 0 | ----------- |
| 8 | Dash | 2 | - - - - - - |
| 9 | Dash Dot | 1 | - . - . - . |
| 10 | Dash Dot | 2 | - . - . - . |
| 11 | Dash Dot Dot | 1 | - . . - . . |
| 12 | Dash Dot Dot | 2 | - . . - . . |
| 13 | SlantDash Dot | 2 | / - . / - . |
The following shows the borders in the order shown in the Excel Dialog:
| Index | Style | Index | Style |
|---|---|---|---|
| 0 | None | 12 | - . . - . . |
| 7 | ----------- |
13 | / - . / - . |
| 4 | . . . . . . |
10 | - . - . - . |
| 11 | - . . - . . |
8 | - - - - - - |
| 9 | - . - . - . |
2 | ----------- |
| 3 | - - - - - - |
5 | ----------- |
| 1 | ----------- |
6 | =========== |
format.set_bottom()
-
set_bottom(style) -
Set the cell bottom border style.
Parameters: style (int) – Border style index. Default is 1.
Set the cell bottom border style. See set_border() for details on the
border styles.
format.set_top()
-
set_top(style) -
Set the cell top border style.
Parameters: style (int) – Border style index. Default is 1.
Set the cell top border style. See set_border() for details on the
border styles.
format.set_left()
-
set_left(style) -
Set the cell left border style.
Parameters: style (int) – Border style index. Default is 1.
Set the cell left border style. See set_border() for details on the
border styles.
format.set_right()
-
set_right(style) -
Set the cell right border style.
Parameters: style (int) – Border style index. Default is 1.
Set the cell right border style. See set_border() for details on the
border styles.
format.set_border_color()
-
set_border_color(color) -
Set the color of the cell border.
Parameters: color (string) – The cell border color.
Individual border elements can be configured using the following methods with
the same parameters:
set_bottom_color()set_top_color()set_left_color()set_right_color()
Set the color of the cell borders. A cell border is comprised of a border on
the bottom, top, left and right. These can be set to the same color using
set_border_color() or individually using the relevant method calls shown
above.
The color can be a Html style #RRGGBB string or a limited number of named
colors, see Working with Colors.
format.set_bottom_color()
-
set_bottom_color(color) -
Set the color of the bottom cell border.
Parameters: color (string) – The cell border color.
See set_border_color() for details on the border colors.
format.set_top_color()
-
set_top_color(color) -
Set the color of the top cell border.
Parameters: color (string) – The cell border color.
See set_border_color() for details on the border colors.
format.set_left_color()
-
set_left_color(color) -
Set the color of the left cell border.
Parameters: color (string) – The cell border color.
See set_border_color() for details on the border colors.
format.set_right_color()
-
set_right_color(color) -
Set the color of the right cell border.
Parameters: color (string) – The cell border color.
See set_border_color() for details on the border colors.
format.set_diag_border()
-
set_diag_border(style) -
Set the diagonal cell border style.
Parameters: style (int) – Border style index. Default is 1.
Set the style for a diagonal border. The style is the same as those used in
set_border().
See Example: Diagonal borders in cells.
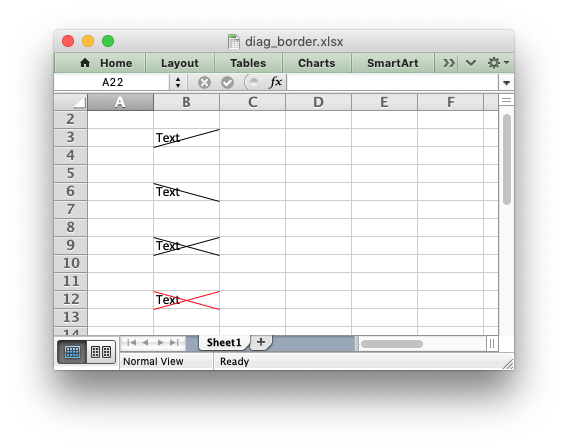
format.set_diag_type()
-
set_diag_type(style) -
Set the diagonal cell border type.
Parameters: style (int) – Border type, 1-3. No default.
Set the type of the diagonal border. The style should be one of the
following values:
- From bottom left to top right.
- From top left to bottom right.
- Same as type 1 and 2 combined.
format.set_diag_color()
-
set_diag_color(color) -
Set the color of the diagonal cell border.
Parameters: color (string) – The cell border color.
See set_border_color() for details on the border colors.
format.set_quote_prefix()
-
set_quote_prefix() -
Turn on quote prefix for the format.
Set the quote prefix property of a format to ensure a string is treated as a
string after editing. This is the same as prefixing the string with a single
quote in Excel. You don’t need to add the quote to the string but you do need
to add the format.
During the work we need to automate some reports frequently, including
manipulating excel workbook. In this blog I will introduce some basic
manipulations on excel workbook by openpyxl package.
In the following, I will create a workbook, write values into one worksheet, and
some handling like merging cells, set font size/color/type, set background color,
set borders, etc.
Before coding, I’ll import all packages we need.
import openpyxl
from openpyxl.styles import Alignment
from openpyxl.styles import Font
from openpyxl.styles import PatternFill
from openpyxl.styles.borders import Border, Side
from openpyxl.workbook import Workbook
import string
Now, let’s start!
# Create a workbook
wb = Workbook()
dest_filename = 'test.xlsx'

ws_test = wb.active
ws_test.title = 'test_wksht'
Workbook() helps us to create a workbook, use active module to assign actual
worksheet and use title module to name it.
Write values
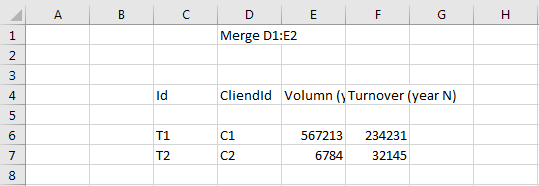
VAL_POS_MAP = {'Merge D1:E2': 'D1',
               'Id': 'C4',
               'T1': 'C6',
               'T2': 'C7',
               'CliendId': 'D4',
               'C1': 'D6',
               'C2': 'D7',
               'Volumn (year N)': 'E4',
               567213: 'E6',
               6784: 'E7',
               'Turnover (year N)': 'F4',
               234231: 'F6',
               32145: 'F7'}

for value, pos in VAL_POS_MAP.items():
    ws_test[pos] = value
We can write values into specified cells with pattern worksheet[cells] = value.
Here I iterate a map, who contains values and cells’ positions, to write values
iteratively.
Font (size, type, bold, italic)
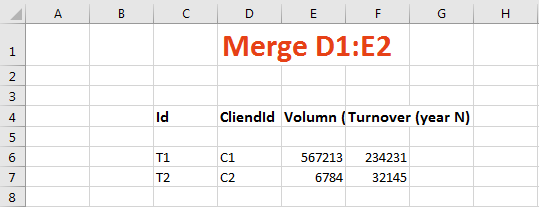
GLOBAL_TITLE_FONT = Font(name='Calibri',
                         size=24,
                         bold=True,
                         italic=False,
                         vertAlign=None,
                         underline='none',
                         strike=False,
                         color='e64117')

SUBTITLE_FONT = Font(name='Calibri',
                     size=12,
                     bold=True,
                     italic=False,
                     vertAlign=None,
                     underline='none',
                     strike=False,
                     color='000000')

SZ14_FONT = Font(name='Calibri',
                 size=11,
                 bold=False,
                 italic=False,
                 vertAlign=None,
                 underline='none',
                 strike=False,
                 color='000000')

BG_YELLOW_LIST = ['C4', 'D4', 'E4', 'F4']
CONTENT_LIST = ['C6', 'C7', 'D6', 'D7', 'E6', 'E7', 'F6', 'F7']

ws_test['D1'].font = GLOBAL_TITLE_FONT

for pos in BG_YELLOW_LIST:
    ws_test[pos].font = SUBTITLE_FONT

for pos in CONTENT_LIST:
    ws_test[pos].font = SZ14_FONT
According to openpyxl, we can set font styles(size/color/type) by different
arguments of Font(). Then assign worksheet[cells].font equals to Font()
setting.
Cut and paste values from C4:F4 to C5:F5
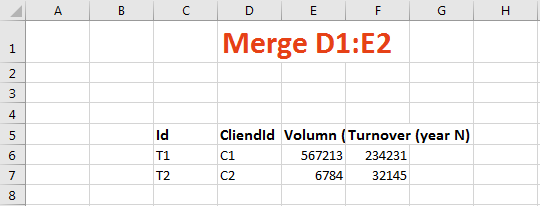
for col in string.ascii_uppercase[2:6]:
    new_pos = col + '5'
    old_pos = col + '4'

    ws_test[new_pos].value = ws_test[old_pos].value
    if ws_test[old_pos].has_style:
        ws_test[new_pos]._style = ws_test[old_pos]._style
    ws_test[old_pos].value = None
Here I use string.ascii_uppercase to generate automatically from letter C to
letter F, and copy values from row 4 to row 5. But if we only copy value, font
style will be lost, so I also copied cell’s style with ._style for the one
who .has_style==True.
Remove row 4
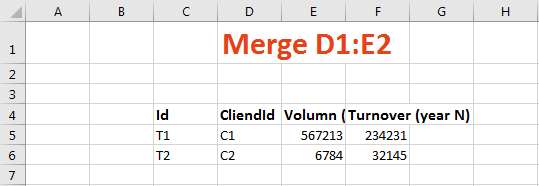
ws_test.delete_rows(idx=4)Since we don’t need the fourth row any more, I removed it by delete_rows().
Merge C1:D2 and set number format
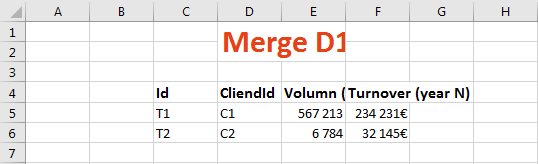
ws_test.merge_cells('D1:E2')

EURO_LIST = ['F5', 'F6']
SEP_K_LIST = ['E5', 'E6']
for pos in EURO_LIST:
    ws_test[pos].number_format = '#,##0€'
for pos in SEP_K_LIST:
    ws_test[pos].number_format = '#,##0'
Then I merge cells from D1 to E2 with worksheet.merge_cells. If you want to
set numbers’ format, like currency or display a thousands separator, you can
specify module number_format’s value.
Set cells’ background colors and center characters
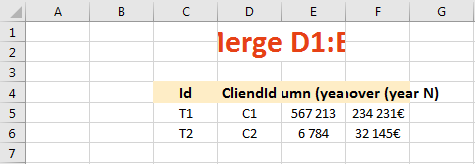
# background colors
for pos in BG_YELLOW_LIST:
    ws_test[pos].fill = PatternFill(start_color="feedc6",
                                    end_color="feedc6",
                                    fill_type="solid")

# center characters
for row_cells in ws_test.iter_rows():
    for cell in row_cells:
        cell.alignment = Alignment(horizontal='center',
                                   vertical='center')
When we want to highlight header, adding the background color might be a good
idea. Then we can assign worksheet[cell].fill to PatternFill(), with RBG
colors. Moreover, I wanted to center horizontal and vertical alignment for all
cells. So I iterated all cells, and set their alignment module as center.
Wrap text in cells
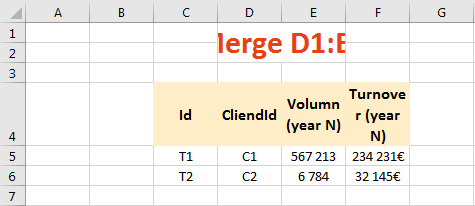
SUBTITLE_ALIGN = Alignment(wrap_text=True, horizontal='center', vertical='center')
for row in ['4:4']:
    for cell in ws_test[row]:
        cell.alignment = SUBTITLE_ALIGN
Since characters in each cell of row 4 are a little bit more, we can wrap them
with wrap_text=True of Alignment() for each cell in row 4.
Reset columns’ width
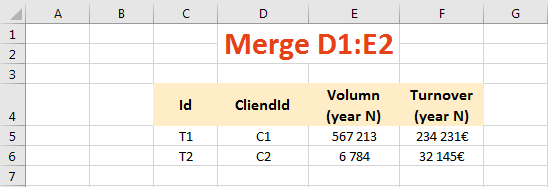
for col in ['D', 'E']:
    ws_test.column_dimensions[col].width = 13
ws_test.column_dimensions['F'].width = 12
Sometimes, a cell contains lots of characters and cannot be displayed by default.
In this case, if you want to display all, you can set cell’s width, with pattern
worksheet.column_dimensions[column].width.
Set borders
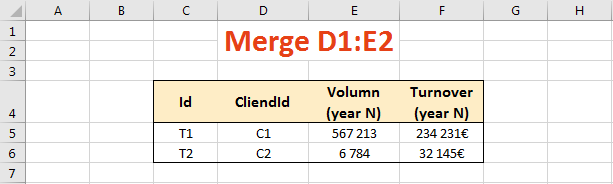
BORDER_LIST = ['C4:F4', 'C5:F6']

def set_border(ws, cell_range):
    rows = ws[cell_range]
    side = Side(border_style='thin', color="FF000000")

    rows = list(rows)
    max_y = len(rows) - 1  # index of the last row
    for pos_y, cells in enumerate(rows):
        max_x = len(cells) - 1  # index of the last cell
        for pos_x, cell in enumerate(cells):
            border = Border(
                left=cell.border.left,
                right=cell.border.right,
                top=cell.border.top,
                bottom=cell.border.bottom
            )
            if pos_x == 0:
                border.left = side
            if pos_x == max_x:
                border.right = side
            if pos_y == 0:
                border.top = side
            if pos_y == max_y:
                border.bottom = side

            # set new border only if it's one of the edge cells
            if pos_x == 0 or pos_x == max_x or pos_y == 0 or pos_y == max_y:
                cell.border = border

# border
for pos in BORDER_LIST:
    set_border(ws_test, pos)
Next, I used a function set_border() that found on stackoverflow.
In this function, it used Side() and Border() to set outside borders for
given cells.
Hide grid and set zoom scale
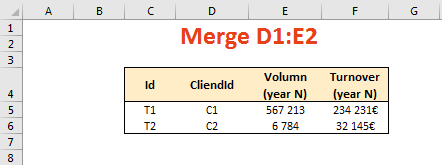
ws_test.sheet_view.showGridLines = False
ws_test.sheet_view.zoomScale = 80
Furthermore, if you want to hide all grid lines or set zoom scale, you can use
worksheet.sheet_view.showGridLines or worksheet.sheet_view.zoomScale.
Create named range
wb.create_named_range('ZoneId', ws_test, '$C$4:$C$6')workbook.create_named_range() create named ranges from C4 to C6, in ws_test
worksheet, named ‘ZoneId’.
Save
wb.save(dest_filename)Finally, save the workbook to given path with workbook.save().
Voila, result as follows:

Reference
- “0*eSQte3e-rJeH7bu8”, miro.medium.com. [Online].
Available: https://miro.medium.com/max/1400/0*eSQte3e-rJeH7bu8.jpg