
Contents
- Introduction
- Creating a working environment
- How to serve a file for download
- How to create an Excel file
- How to add title and headers
- How to write data
- How to resize rows and columns
- How to add formulas
- How to add charts
- Line charts
- Column charts
- Pie charts
- Conclusions

Web Developer at ASSIST
The computing scientist’s main challenge is not to get confused by the complexities of his own making. — E. W. Dijkstra
Introduction
When creating a web management application, many clients require pages which display statistics. Usually this feature comes along with the option to download the data in an Excel and/or PDF format. Therefore, this tutorial will show you how to create an Excel document and make it available for download in a Python/Django application.
Creating a working environment
First of all, when working with Django applications it is advised to create an environment (with virualenv) and install all the modules in that environment. This practice is very useful when you’re working on different websites that don’t use the same versions.
Speaking of modules, in this example we will be using:
- Python 2.7
- Django 1.8.2
- XlsxWriter 0.7.3
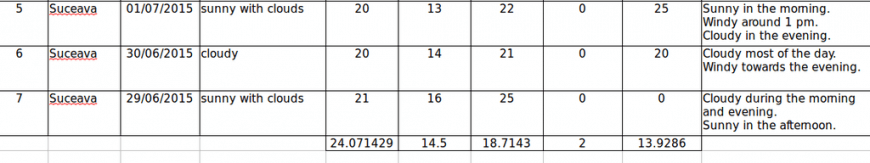
In order to expose the features brought by the XlsxWriter module, we created a simple Python/Django application, which is available for download on Github. It consists of saving weather data for multiple towns. The user can add towns and weather information through the Django Admin interface, which is generated automatically. The front page for this website displays the current weather for the available towns. Moreover, the site contains a page that presents the weather history data:
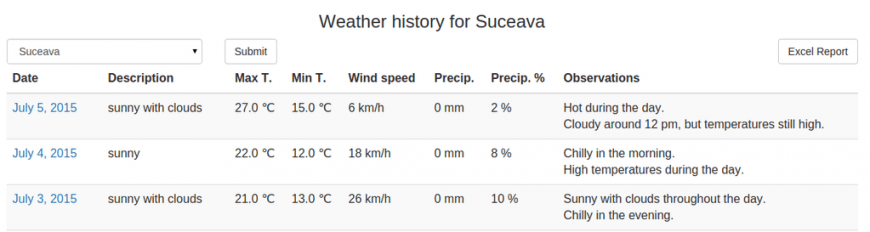
The user can filter the data by town, like in the above image, or select the default option which shows the history for all the towns. You can notice that there is an “Excel Report” button, hence, that is the button that will trigger the Excel file download.
How to serve a file for download
To begin with, in the HTML file there is a form that contains the “Excel Report” button. Therefore, in the corresponding Django view we receive the request to download ‘excel’. Thus, we have to send the file to the user and we can do this through the following code. The result is that the user receives a file named “Report.xlsx”:
if 'excel' in request.POST:
    response = HttpResponse(content_type='application/vnd.ms-excel')
    response['Content-Disposition'] = 'attachment; filename=Report.xlsx'
    xlsx_data = WriteToExcel(weather_period, town)
    response.write(xlsx_data)
    return response
The “WriteToExcel” function is responsible for creating the Excel file. It has two parameters:
- weather_period, that represents the data after the filtering, we will utilize it for writing information in the file;
- town, its default value is None and is used in case the user selects a town for filtering.
There are two options for writing the excel logic: either in the view or, like in this example, in a different file (named “excel_utils.py”). The second option offers a more clean and modular code.
How to create an Excel file
The next step is to add code to the “WriteToExcel” function and we will be doing that by using the XlsxWriter module. The following code will create a blank Excel file.
import StringIO
import xlsxwriter

def WriteToExcel(weather_data, town=None):
    output = StringIO.StringIO()
    workbook = xlsxwriter.Workbook(output)

    # Here we will adding the code to add data

    workbook.close()
    xlsx_data = output.getvalue()
    # xlsx_data contains the Excel file
    return xlsx_data
How to add title and headers
Before adding any actual data to the file, we can create a table in the Excel, which includes a title and some headers. The code associated with this implementation consists of:
- Adding a working Sheet:
worksheet_s = workbook.add_worksheet("Summary")
- Creating styles which can be used later when we will be adding the data. For example, we may want a bigger font size for the title, to make it to bold or we can add a color background for the headers:
title = workbook.add_format({
    'bold': True,
    'font_size': 14,
    'align': 'center',
    'valign': 'vcenter'
})
header = workbook.add_format({
    'bg_color': '#F7F7F7',
    'color': 'black',
    'align': 'center',
    'valign': 'top',
    'border': 1
})
- Adding a title that is written along more columns. In order to implement this you can use the merge_range function, along with serving the columns, the text and the title style already defined:
title_text = u"{0} {1}".format(ugettext("Weather History for"), town_text)
worksheet_s.merge_range('B2:H2', title_text, title)
- Adding the headers which actually means writing text to some cells:
worksheet_s.write(4, 0, ugettext("No"), header)
worksheet_s.write(4, 1, ugettext("Town"), header)
worksheet_s.write(4, 3, ugettext(u"Max T. (℃)"), header)
# the rest of the headers from the HTML file
Please note that the code in this article will use ugettext function when defining the texts. This is useful if you will add internationalization to the application. Moreover, keep in mind if you want to use unicode characters (such as “℃” or diacritical marks) you have to add u before the string and also define the encoding at the beginning of the file:
#!/usr/bin/python
# -*- coding: utf-8 -*-
The result for the code added up till now is:
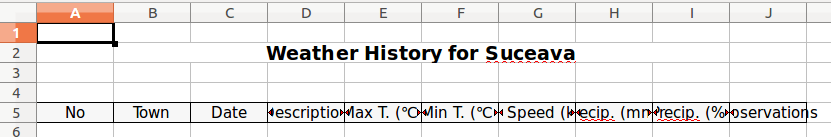
But there is a problem, some texts do not fit the columns, thus are not completely visible. The article will tackle this issue in the “How to resize rows and columns” section.
How to write data
After adding a new style for the cells, the data can be added through a simple loop which will write it to the corresponding columns:
for idx, data in enumerate(weather_data):
    row = 5 + idx
    worksheet_s.write_number(row, 0, idx + 1, cell_center)
    worksheet_s.write_string(row, 1, data.town.name, cell)
    worksheet_s.write(row, 2, data.date.strftime('%d/%m/%Y'), cell_center)
    # the rest of the data
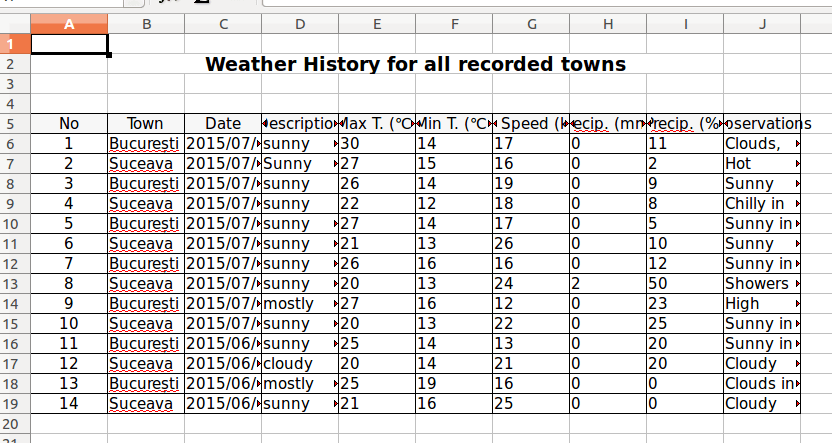
In order to avoid creating an additional variable that would be incremented on each loop, we can use the python enumerate feature which automatically returns the index and the object from the list. You can observe that the idx variable is used for writing the value in the Number column. Furthermore, it is used to define a row variable, which along with a column value, determines where the data is written in the Excel file.
Following these modifications the file looks like:
How to resize rows and columns
In previous sections, there was an issue with the width of the rows. This problem can have multiple solutions, depending on the desired results:
1. The columns can have a constant width. Suitable examples for this case are Date, Temperature, Wind and Precipitation columns. Thus, the code from below displays the change for Wind column. This line can be added after or even before the loop that adds the data.
worksheet_s.set_column('G:G', 10)
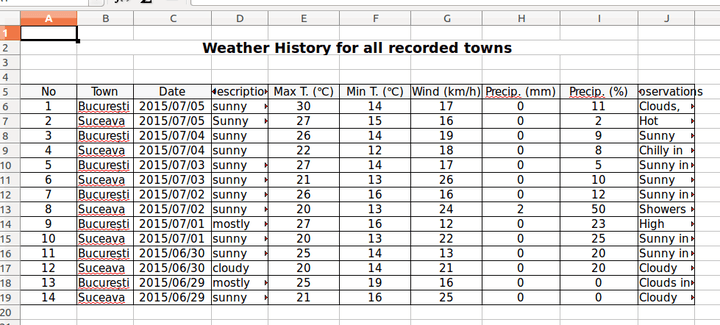
Adding this setting to all the columns that suit this solution, modifies the Excel file as follows:
2. The columns can adapt their width according to the data that they contain, in this instance: Town and Description. These values have a maximum length constraint in the database. Therefore, we can set a column width according to the biggest length of all the data:
description_col_width = 10
# ...
for idx, data in enumerate(weather_data):
    # ...
    worksheet_s.write_string(row, 3, data.description, cell)
    if len(data.description) > description_col_width:
        description_col_width = len(data.description)
    # ...
worksheet_s.set_column('D:D', description_col_width)
In this situation it is paramount to set the column options after the loop. Below is an image depicting how the Excel file changed:

3. The column can have a constant width, but the row height can vary. The last column, Observations, is where we can apply this condition. In this exercise, the width will be 25, meaning that we will consider that one row cannot have more than 25 characters:
observations_col_width = 25
# ...
for idx, data in enumerate(weather_data):
    # ...
    observations = data.observations.replace('r', '')
    worksheet_s.write_string(row, 9, observations, cell)
    observations_rows = compute_rows(observations, observations_col_width)
    worksheet_s.set_row(row, 15 * observations_rows)
# ...
worksheet_s.set_column('J:J', observations_col_width)
You can notice that the number of rows is computed using a function, named “compute_rows” (its parameters are the text and the column width):
def compute_rows(text, width):
    if len(text) < width:
        return 1
    phrases = text.replace('r', '').split('n')

    rows = 0
    for phrase in phrases:
        if len(phrase) < width:
            rows = rows + 1
        else:
            words = phrase.split(' ')
            temp = ''
            for idx, word in enumerate(words):
                temp = temp + word + ' '
                # check if column width exceeded
                if len(temp) > width:
                    rows = rows + 1
                    temp = '' + word + ' '
                # check if it is not the last word
                if idx == len(words) - 1 and len(temp) > 0:
                    rows = rows + 1
    return rows
Now, the Excel file looks like:

As you can observe, there are cells that have extra rows. This happens due to the fact that the letters do not have the same width; so even though the number of characters exceeds the set maximum, the text fits in less than the expected space. This solution only simulates an Auto Fit option. As a result, some extra rows may appear when the text has a large number of characters.
How to add formulas
Formulas are very useful when presenting statistical data. For instance, in this example, we could compute averages or sums for the suitable columns. The following code implements the average for Max temperatures:
from django.db.models import Avg, Sum

def WriteToExcel(weather_data, town=None):
    # ...
    max_temp_avg = Weather.objects.all().aggregate(Avg('max_temperature'))
    worksheet_s.write_formula(
        row, 4, '=average({0}{1}:{0}{2})'.format('E', 6, row),
        cell_center, max_temp_avg['max_temperature__avg'])
The formula is added using the write_formula functions which has 5 parameters, three of them are mandatory: row, column, a string defining the formula and the other two are optional: cell style and the computed value (it is useful to add this because when opening the file with an Excel Viewer it will display 0 instead of the expected result).
The file now has another row of data at the end of the table:
How to add charts
Prior to adding code regarding to the charts, we are going to add 2 new working sheets: one for the charts and one where we will be adding the data used for them:
worksheet_c = workbook.add_worksheet("Charts")
worksheet_d = workbook.add_worksheet("Chart Data")
Secondly, we require a purpose for each one of the charts.
Line charts
In this case, we could use a line chart in order to show temperature data for the towns along a certain amount of time.
First step is to add a chart object:
line_chart = workbook.add_chart({'type': 'line'})
Afterwards we have to add the data on the “Charts Data” sheet and read it in order to add series to the chart:
line_chart.add_series({
    'categories': '=Chart Data!$A1:$A${0}'.format(len(dates)),
    'values': '=Chart Data!${0}${1}:${0}${2}'
    .format(letter_max_t, 1, len(data)),
    'marker': {'type': 'square'},
    'name': u"{0} {1}".format(ugettext("Max T."), t.name)
})
The code from above can be written in a loop which would add this line for all the towns. Also, you can notice the fact that the values for categories and values will be read from the “Chart Data” sheet.
Further steps include:
- setting a title
line_chart.set_title({'name': ugettext("Maximum and Minimum Temperatures")})
- adding options for the x axis, for instance, the labels can contain strings instead of numbers:
line_chart.set_x_axis({
    'text_axis': True,
    'date_axis': False
})
- adding options for the y axis, for example, we can add measuring units for the temperature values:
line_chart.set_y_axis({
    'num_format': u'## ℃'
})
- including the chart on the “Charts” Sheet, where we have the option to change the scale. This can be considered as the last step.
worksheet_c.insert_chart('B2', line_chart, {'x_scale': 2, 'y_scale': 1})
The visible changes in the Excel files:
- a new sheet containing the chart

- a new sheet containing data

Column charts
In order to expose the usability of the column charts we are going to display the maximum and minimum value for wind speed for each of the available towns.
The workflow is identical to the previous chart, however, when creating the new chart object we have to change its type:
bar_chart = workbook.add_chart({'type': 'column'})
Next step is to make aggregations on the data, add it onto the data sheet and then create the series. For example the series for the maximum values is:
bar_chart.add_series({
    'name': 'Max Speed',
    'values': '=Chart Data!${0}${1}:${0}${2}'
    .format(chr(ord('A') + cell_index + 1), 1, len(towns)),
    'categories': '=Chart Data!${0}${1}:${0}${2}'
    .format(chr(ord('A') + cell_index), 1, len(towns)),
    'data_labels': {'value': True, 'num_format': u'#0 "km/h"'}
})
You can notice that we added some formatting to the data labels as well. After adding the title and inserting it into the charts sheet, we can observe the result:

Pie charts
This time, we will create a pie chart object, which present the percentage of hot, warm and cold days:
pie_chart = workbook.add_chart({'type': 'pie'})
Like in the previous examples, we have to aggregate the data, write it in the Excel and add the corresponding series:
pie_chart.add_series({
    'name': ugettext('Temperature statistics'),
    'values': '=Chart Data!${0}${1}:${0}${2}'
    .format(chr(ord('A') + cell_index), 1, 3),
    'categories': '=Chart Data!${0}${1}:${0}${2}'
    .format(chr(ord('A') + cell_index + 1), 1, 3),
    'data_labels': {'percentage': True}
})
The main difference from the other charts is that the values are automatically calculated as percentages.
After inserting the chart on the worksheet we have the following result:

Conclusions
In conclusion, when creating a Python/Django application that requires to export Excel files, XlsxWriter is a very useful module. You can access the official docs for this module where you will find further features and options to add.
Moreover, you can access the whole code for this application on Github. Hopefully it will help many developers learn how to export Excel files in a Python/Django properly.
In this article, the main subject was creating an Excel file in a Python/Django application. In a future article the attention will be drawn to PDF, another way to export data.
* The Excel files from the screenshots were opened with LibreOffice
UPDATE: In this article, the main subject was creating an Excel file in a Python/Django application. If you want to export PDF files check this article written by our colleague Petru.
Pandas можно использовать для чтения и записи файлов Excel с помощью Python. Это работает по аналогии с другими форматами. В этом материале рассмотрим, как это делается с помощью DataFrame.
Помимо чтения и записи рассмотрим, как записывать несколько DataFrame в Excel-файл, как считывать определенные строки и колонки из таблицы и как задавать имена для одной или нескольких таблиц в файле.
Установка Pandas
Для начала Pandas нужно установить. Проще всего это сделать с помощью pip.
Если у вас Windows, Linux или macOS:
pip install pandas # или pip3В процессе можно столкнуться с ошибками ModuleNotFoundError или ImportError при попытке запустить этот код. Например:
ModuleNotFoundError: No module named 'openpyxl'В таком случае нужно установить недостающие модули:
pip install openpyxl xlsxwriter xlrd # или pip3Будем хранить информацию, которую нужно записать в файл Excel, в DataFrame. А с помощью встроенной функции to_excel() ее можно будет записать в Excel.
Сначала импортируем модуль pandas. Потом используем словарь для заполнения DataFrame:
import pandas as pd

df = pd.DataFrame({'Name': ['Manchester City', 'Real Madrid', 'Liverpool',

                            'FC Bayern München', 'FC Barcelona', 'Juventus'],

                   'League': ['English Premier League (1)', 'Spain Primera Division (1)',

                              'English Premier League (1)', 'German 1. Bundesliga (1)',

                              'Spain Primera Division (1)', 'Italian Serie A (1)'],

                   'TransferBudget': [176000000, 188500000, 90000000,

                                      100000000, 180500000, 105000000]})
Ключи в словаре — это названия колонок. А значения станут строками с информацией.
Теперь можно использовать функцию to_excel() для записи содержимого в файл. Единственный аргумент — это путь к файлу:
df.to_excel('./teams.xlsx')
А вот и созданный файл Excel:

Стоит обратить внимание на то, что в этом примере не использовались параметры. Таким образом название листа в файле останется по умолчанию — «Sheet1». В файле может быть и дополнительная колонка с числами. Эти числа представляют собой индексы, которые взяты напрямую из DataFrame.
Поменять название листа можно, добавив параметр sheet_name в вызов to_excel():
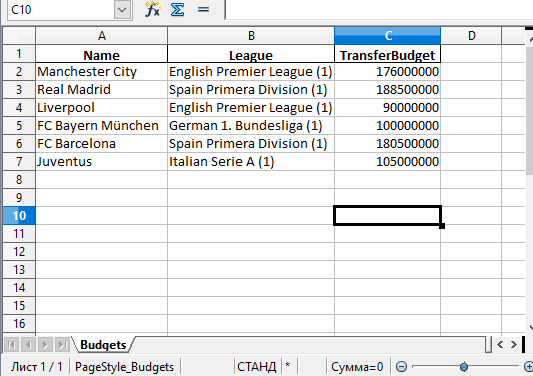
df.to_excel('./teams.xlsx', sheet_name='Budgets', index=False)
Также можно добавили параметр index со значением False, чтобы избавиться от колонки с индексами. Теперь файл Excel будет выглядеть следующим образом:
Запись нескольких DataFrame в файл Excel
Также есть возможность записать несколько DataFrame в файл Excel. Для этого можно указать отдельный лист для каждого объекта:
salaries1 = pd.DataFrame({'Name': ['L. Messi', 'Cristiano Ronaldo', 'J. Oblak'],

                                        'Salary': [560000, 220000, 125000]})

salaries2 = pd.DataFrame({'Name': ['K. De Bruyne', 'Neymar Jr', 'R. Lewandowski'],

                                        'Salary': [370000, 270000, 240000]})

salaries3 = pd.DataFrame({'Name': ['Alisson', 'M. ter Stegen', 'M. Salah'],

                                        'Salary': [160000, 260000, 250000]})

salary_sheets = {'Group1': salaries1, 'Group2': salaries2, 'Group3': salaries3}

writer = pd.ExcelWriter('./salaries.xlsx', engine='xlsxwriter')

for sheet_name in salary_sheets.keys():

    salary_sheets[sheet_name].to_excel(writer, sheet_name=sheet_name, index=False)

writer.save()
Здесь создаются 3 разных DataFrame с разными названиями, которые включают имена сотрудников, а также размер их зарплаты. Каждый объект заполняется соответствующим словарем.
Объединим все три в переменной salary_sheets, где каждый ключ будет названием листа, а значение — объектом DataFrame.
Дальше используем движок xlsxwriter для создания объекта writer. Он и передается функции to_excel().
Перед записью пройдемся по ключам salary_sheets и для каждого ключа запишем содержимое в лист с соответствующим именем. Вот сгенерированный файл:
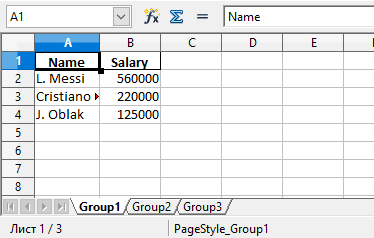
Можно увидеть, что в этом файле Excel есть три листа: Group1, Group2 и Group3. Каждый из этих листов содержит имена сотрудников и их зарплаты в соответствии с данными в трех DataFrame из кода.
Параметр движка в функции to_excel() используется для определения модуля, который задействуется библиотекой Pandas для создания файла Excel. В этом случае использовался xslswriter, который нужен для работы с классом ExcelWriter. Разные движка можно определять в соответствии с их функциями.
В зависимости от установленных в системе модулей Python другими параметрами для движка могут быть openpyxl (для xlsx или xlsm) и xlwt (для xls). Подробности о модуле xlswriter можно найти в официальной документации.
Наконец, в коде была строка writer.save(), которая нужна для сохранения файла на диске.
Чтение файлов Excel с python
По аналогии с записью объектов DataFrame в файл Excel, эти файлы можно и читать, сохраняя данные в объект DataFrame. Для этого достаточно воспользоваться функцией read_excel():
top_players = pd.read_excel('./top_players.xlsx')

top_players.head()
Содержимое финального объекта можно посмотреть с помощью функции head().
Примечание:
Этот способ самый простой, но он и способен прочесть лишь содержимое первого листа.
Посмотрим на вывод функции head():
| Name | Age | Overall | Potential | Positions | Club | |
|---|---|---|---|---|---|---|
| 0 | L. Messi | 33 | 93 | 93 | RW,ST,CF | FC Barcelona |
| 1 | Cristiano Ronaldo | 35 | 92 | 92 | ST,LW | Juventus |
| 2 | J. Oblak | 27 | 91 | 93 | GK | Atlético Madrid |
| 3 | K. De Bruyne | 29 | 91 | 91 | CAM,CM | Manchester City |
| 4 | Neymar Jr | 28 | 91 | 91 | LW,CAM | Paris Saint-Germain |
Pandas присваивает метку строки или числовой индекс объекту DataFrame по умолчанию при использовании функции read_excel().
Это поведение можно переписать, передав одну из колонок из файла в качестве параметра index_col:
top_players = pd.read_excel('./top_players.xlsx', index_col='Name')

top_players.head()
Результат будет следующим:
| Name | Age | Overall | Potential | Positions | Club |
|---|---|---|---|---|---|
| L. Messi | 33 | 93 | 93 | RW,ST,CF | FC Barcelona |
| Cristiano Ronaldo | 35 | 92 | 92 | ST,LW | Juventus |
| J. Oblak | 27 | 91 | 93 | GK | Atlético Madrid |
| K. De Bruyne | 29 | 91 | 91 | CAM,CM | Manchester City |
| Neymar Jr | 28 | 91 | 91 | LW,CAM | Paris Saint-Germain |
В этом примере индекс по умолчанию был заменен на колонку «Name» из файла. Однако этот способ стоит использовать только при наличии колонки со значениями, которые могут стать заменой для индексов.
Чтение определенных колонок из файла Excel
Иногда удобно прочитать содержимое файла целиком, но бывают случаи, когда требуется получить доступ к определенному элементу. Например, нужно считать значение элемента и присвоить его полю объекта.
Это делается с помощью функции read_excel() и параметра usecols. Например, можно ограничить функцию, чтобы она читала только определенные колонки. Добавим параметр, чтобы он читал колонки, которые соответствуют значениям «Name», «Overall» и «Potential».
Для этого укажем числовой индекс каждой колонки:
cols = [0, 2, 3]

top_players = pd.read_excel('./top_players.xlsx', usecols=cols)

top_players.head()
Вот что выдаст этот код:
| Name | Overall | Potential | |
|---|---|---|---|
| 0 | L. Messi | 93 | 93 |
| 1 | Cristiano Ronaldo | 92 | 92 |
| 2 | J. Oblak | 91 | 93 |
| 3 | K. De Bruyne | 91 | 91 |
| 4 | Neymar Jr | 91 | 91 |
Таким образом возвращаются лишь колонки из списка cols.
В DataFrame много встроенных возможностей. Легко изменять, добавлять и агрегировать данные. Даже можно строить сводные таблицы. И все это сохраняется в Excel одной строкой кода.
Рекомендую изучить DataFrame в моих уроках по Pandas.
Выводы
В этом материале были рассмотрены функции read_excel() и to_excel() из библиотеки Pandas. С их помощью можно считывать данные из файлов Excel и выполнять запись в них. С помощью различных параметров есть возможность менять поведение функций, создавая нужные файлы, не просто копируя содержимое из объекта DataFrame.
Узнайте, как читать и импортировать файлы Excel в Python, как записывать данные в эти таблицы и какие библиотеки лучше всего подходят для этого.
Известный вам инструмент для организации, анализа и хранения ваших данных в таблицах — Excel — применяется и в data science. В какой-то момент вам придется иметь дело с этими таблицами, но работать именно с ними вы будете не всегда. Вот почему разработчики Python реализовали способы чтения, записи и управления не только этими файлами, но и многими другими типами файлов.
Из этого учебника узнаете, как можете работать с Excel и Python. Внутри найдете обзор библиотек, которые вы можете использовать для загрузки и записи этих таблиц в файлы с помощью Python. Вы узнаете, как работать с такими библиотеками, как pandas, openpyxl, xlrd, xlutils и pyexcel.
Данные как ваша отправная точка
Когда вы начинаете проект по data science, вам придется работать с данными, которые вы собрали по всему интернету, и с наборами данных, которые вы загрузили из других мест — Kaggle, Quandl и тд
Но чаще всего вы также найдете данные в Google или в репозиториях, которые используются другими пользователями. Эти данные могут быть в файле Excel или сохранены в файл с расширением .csv … Возможности могут иногда казаться бесконечными, но когда у вас есть данные, в первую очередь вы должны убедиться, что они качественные.
В случае с электронной таблицей вы можете не только проверить, могут ли эти данные ответить на вопрос исследования, который вы имеете в виду, но также и можете ли вы доверять данным, которые хранятся в электронной таблице.
Проверяем качество таблицы
- Представляет ли электронная таблица статические данные?
- Смешивает ли она данные, расчеты и отчетность?
- Являются ли данные в вашей электронной таблице полными и последовательными?
- Имеет ли ваша таблица систематизированную структуру рабочего листа?
- Проверяли ли вы действительные формулы в электронной таблице?
Этот список вопросов поможет убедиться, что ваша таблица не грешит против лучших практик, принятых в отрасли. Конечно, этот список не исчерпывающий, но позволит провести базовую проверку таблицы.
Лучшие практики для данных электронных таблиц
Прежде чем приступить к чтению вашей электронной таблицы на Python, вы также должны подумать о том, чтобы настроить свой файл в соответствии с некоторыми основными принципами, такими как:
- Первая строка таблицы обычно зарезервирована для заголовка, а первый столбец используется для идентификации единицы выборки;
- Избегайте имен, значений или полей с пробелами. В противном случае каждое слово будет интерпретироваться как отдельная переменная, что приведет к ошибкам, связанным с количеством элементов на строку в вашем наборе данных. По возможности, используйте:
- подчеркивания,
- тире,
- горбатый регистр, где первая буква каждого слова пишется с большой буквы
- объединяющие слова
- Короткие имена предпочтительнее длинных имен;
- старайтесь не использовать имена, которые содержат символы ?, $,%, ^, &, *, (,), -, #,? ,,, <,>, /, |, , [,], {, и };
- Удалите все комментарии, которые вы сделали в вашем файле, чтобы избежать добавления в ваш файл лишних столбцов или NA;
- Убедитесь, что все пропущенные значения в вашем наборе данных обозначены как NA.
Затем, после того, как вы внесли необходимые изменения или тщательно изучили свои данные, убедитесь, что вы сохранили внесенные изменения. Сделав это, вы можете вернуться к данным позже, чтобы отредактировать их, добавить дополнительные данные или изменить их, сохранив формулы, которые вы, возможно, использовали для расчета данных и т.д.
Если вы работаете с Microsoft Excel, вы можете сохранить файл в разных форматах: помимо расширения по умолчанию .xls или .xlsx, вы можете перейти на вкладку «Файл», нажать «Сохранить как» и выбрать одно из расширений, которые указаны в качестве параметров «Сохранить как тип». Наиболее часто используемые расширения для сохранения наборов данных в data science — это .csv и .txt (в виде текстового файла с разделителями табуляции). В зависимости от выбранного варианта сохранения поля вашего набора данных разделяются вкладками или запятыми, которые образуют символы-разделители полей вашего набора данных.
Теперь, когда вы проверили и сохранили ваши данные, вы можете начать с подготовки вашего рабочего окружения.
Готовим рабочее окружение
Как убедиться, что вы все делаете хорошо? Проверить рабочее окружение!
Когда вы работаете в терминале, вы можете сначала перейти в каталог, в котором находится ваш файл, а затем запустить Python. Убедитесь, что файл лежит именно в том каталоге, к которому вы обратились.
Возможно, вы уже начали сеанс Python и у вас нет подсказок о каталоге, в котором вы работаете. Тогда можно выполнить следующие команды:
# Import `os`
import os

# Retrieve current working directory (`cwd`)
cwd = os.getcwd()
cwd

# Change directory
os.chdir("/path/to/your/folder")

# List all files and directories in current directory
os.listdir('.')
Круто, да?
Вы увидите, что эти команды очень важны не только для загрузки ваших данных, но и для дальнейшего анализа. А пока давайте продолжим: вы прошли все проверки, вы сохранили свои данные и подготовили рабочее окружение.
Можете ли вы начать с чтения данных в Python?
Установите библиотеки для чтения и записи файлов Excel
Даже если вы еще не знаете, какие библиотеки вам понадобятся для импорта ваших данных, вы должны убедиться, что у вас есть все, что нужно для установки этих библиотек, когда придет время.
Подготовка к дополнительной рабочей области: pip
Вот почему вам нужно установить pip и setuptools. Если у вас установлен Python2 ⩾ 2.7.9 или Python3 ⩾ 3.4, то можно не беспокоиться — просто убедитесь, что вы обновились до последней версии.
Для этого выполните следующую команду в своем терминале:
# Для Linux/OS X
pip install -U pip setuptools

# Для Windows
python -m pip install -U pip setuptools
Если вы еще не установили pip, запустите скрипт python get-pip.py, который вы можете найти здесь. Следуйте инструкциям по установке.
Установка Anaconda
Другой вариант для работы в data science — установить дистрибутив Anaconda Python. Сделав это, вы получите простой и быстрый способ начать заниматься data science, потому что вам не нужно беспокоиться об установке отдельных библиотек, необходимых для работы.
Это особенно удобно, если вы новичок, но даже для более опытных разработчиков это способ быстро протестировать некоторые вещи без необходимости устанавливать каждую библиотеку отдельно.
Anaconda включает в себя 100 самых популярных библиотек Python, R и Scala для науки о данных и несколько сред разработки с открытым исходным кодом, таких как Jupyter и Spyder.
Установить Anaconda можно здесь. Следуйте инструкциям по установке, и вы готовы начать!
Загрузить файлы Excel в виде фреймов Pandas
Все, среда настроена, вы готовы начать импорт ваших файлов.
Один из способов, который вы часто используете для импорта ваших файлов для обработки данных, — с помощью библиотеки Pandas. Она основана на NumPy и предоставляет простые в использовании структуры данных и инструменты анализа данных Python.
Эта мощная и гибкая библиотека очень часто используется дата-инженерами для передачи своих данных в структуры данных, очень выразительных для их анализа.
Если у вас уже есть Pandas, доступные через Anaconda, вы можете просто загрузить свои файлы в Pandas DataFrames с помощью pd.Excelfile():
# импорт библиотеки pandas
import pandas as pd

# Загружаем ваш файл в переменную `file` / вместо 'example' укажите название свого файла из текущей директории
file = 'example.xlsx'

# Загружаем spreadsheet в объект pandas
xl = pd.ExcelFile(file)

# Печатаем название листов в данном файле
print(xl.sheet_names)

# Загрузить лист в DataFrame по его имени: df1
df1 = xl.parse('Sheet1')
Если вы не установили Anaconda, просто выполните pip install pandas, чтобы установить библиотеку Pandas в вашей среде, а затем выполните команды, которые включены в фрагмент кода выше.
Проще простого, да?
Для чтения в файлах .csv у вас есть аналогичная функция для загрузки данных в DataFrame: read_csv(). Вот пример того, как вы можете использовать эту функцию:
# Импорт библиотеки pandas
import pandas as pd

# Загрузить csv файл
df = pd.read_csv("example.csv")
Разделитель, который будет учитывать эта функция, по умолчанию является запятой, но вы можете указать альтернативный разделитель, если хотите. Перейдите к документации, чтобы узнать, какие другие аргументы вы можете указать для успешного импорта!
Обратите внимание, что есть также функции read_table() и read_fwf() для чтения файлов и таблиц с фиксированной шириной в формате DataFrames с общим разделителем. Для первой функции разделителем по умолчанию является вкладка, но вы можете снова переопределить это, а также указать альтернативный символ-разделитель. Более того, есть и другие функции, которые вы можете использовать для получения данных в DataFrames: вы можете найти их здесь.
Как записать Pandas DataFrames в файлы Excel
Допустим, что после анализа данных вы хотите записать данные обратно в новый файл. Есть также способ записать ваши Pandas DataFrames обратно в файлы с помощью функции to_excel().
Но, прежде чем использовать эту функцию, убедитесь, что у вас установлен XlsxWriter, если вы хотите записать свои данные в несколько листов в файле .xlsx:
# Установим `XlsxWriter`
pip install XlsxWriter

# Указать writer библиотеки
writer = pd.ExcelWriter('example.xlsx', engine='xlsxwriter')

# Записать ваш DataFrame в файл
yourData.to_excel(writer, 'Sheet1')

# Сохраним результат
writer.save()
Обратите внимание, что в приведенном выше фрагменте кода вы используете объект ExcelWriter для вывода DataFrame.
Иными словами, вы передаете переменную Writer в функцию to_excel() и также указываете имя листа. Таким образом, вы добавляете лист с данными в существующую рабочую книгу: вы можете использовать ExcelWriter для сохранения нескольких (немного) разных DataFrames в одной рабочей книге.
Все это означает, что если вы просто хотите сохранить один DataFrame в файл, вы также можете обойтись без установки пакета XlsxWriter. Затем вы просто не указываете аргумент движка, который вы передаете в функцию pd.ExcelWriter(). Остальные шаги остаются прежними.
Аналогично функциям, которые вы использовали для чтения в файлах .csv, у вас также есть функция to_csv() для записи результатов обратно в файл, разделенный запятыми. Он снова работает так же, как когда вы использовали его для чтения в файле:
# Запишите DataFrame в csv
df.to_csv("example.csv")
Если вы хотите иметь файл, разделенный табуляцией, вы также можете передать t аргументу sep. Обратите внимание, что есть другие функции, которые вы можете использовать для вывода ваших файлов. Вы можете найти их все здесь.
Пакеты для разбора файлов Excel и обратной записи с помощью Python
Помимо библиотеки Pandas, который вы будете использовать очень часто для загрузки своих данных, вы также можете использовать другие библиотеки для получения ваших данных в Python. Наш обзор основан на этой странице со списком доступных библиотек, которые вы можете использовать для работы с файлами Excel в Python.
Далее вы увидите, как использовать эти библиотеки с помощью некоторых реальных, но упрощенных примеров.
Использование виртуальных сред
Общий совет для установки — делать это в Python virtualenv без системных пакетов. Вы можете использовать virtualenv для создания изолированных сред Python: он создает папку, содержащую все необходимые исполняемые файлы для использования пакетов, которые потребуются проекту Python.
Чтобы начать работать с virtualenv, вам сначала нужно установить его. Затем перейдите в каталог, в который вы хотите поместить свой проект. Создайте virtualenv в этой папке и загрузите в определенную версию Python, если вам это нужно. Затем вы активируете виртуальную среду. После этого вы можете начать загрузку в другие библиотеки, начать работать с ними и т. д.
Совет: не забудьте деактивировать среду, когда закончите!
# Install virtualenv
$ pip install virtualenv

# Go to the folder of your project
$ cd my_folder

# Create a virtual environment `venv`
$ virtualenv venv

# Indicate the Python interpreter to use for `venv`
$ virtualenv -p /usr/bin/python2.7 venv

# Activate `venv`
$ source venv/bin/activate

# Deactivate `venv`
$ deactivate
Обратите внимание, что виртуальная среда может показаться немного проблемной на первый взгляд, когда вы только начинаете работать с данными с Python. И, особенно если у вас есть только один проект, вы можете не понять, зачем вам вообще нужна виртуальная среда.
С ней будет гораздо легче, когда у вас одновременно запущено несколько проектов, и вы не хотите, чтобы они использовали одну и ту же установку Python. Или когда ваши проекты имеют противоречащие друг другу требования, виртуальная среда пригодится!
Теперь вы можете, наконец, начать установку и импорт библиотек, о которых вы читали, и загрузить их в таблицу.
Как читать и записывать файлы Excel с openpyxl
Этот пакет обычно рекомендуется, если вы хотите читать и записывать файлы .xlsx, xlsm, xltx и xltm.
Установите openpyxl с помощью pip: вы видели, как это сделать в предыдущем разделе.
Общий совет для установки этой библиотеки — делать это в виртуальной среде Python без системных библиотек. Вы можете использовать виртуальную среду для создания изолированных сред Python: она создает папку, которая содержит все необходимые исполняемые файлы для использования библиотек, которые потребуются проекту Python.
Перейдите в каталог, в котором находится ваш проект, и повторно активируйте виртуальную среду venv. Затем продолжите установку openpyxl с pip, чтобы убедиться, что вы можете читать и записывать файлы с ним:
# Активируйте virtualenv
$ source activate venv

# Установим `openpyxl` в `venv`
$ pip install openpyxl
Теперь, когда вы установили openpyxl, вы можете загружать данные. Но что это за данные?
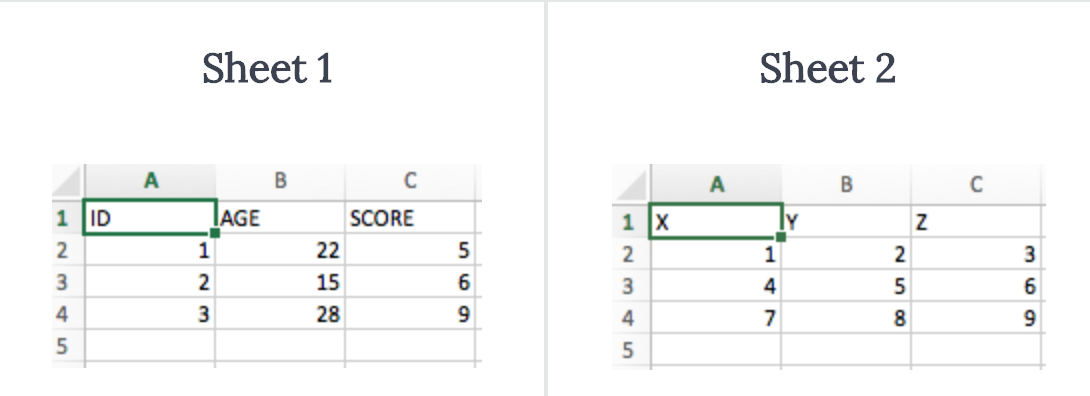
Доспутим Excel с данными, которые вы пытаетесь загрузить в Python, содержит следующие листы:
Функция load_workbook() принимает имя файла в качестве аргумента и возвращает объект рабочей книги, который представляет файл. Вы можете проверить это, запустив type (wb). Убедитесь, что вы находитесь в том каталоге, где находится ваша таблица, иначе вы получите error при импорте.
# Import `load_workbook` module from `openpyxl`
from openpyxl import load_workbook

# Load in the workbook
wb = load_workbook('./test.xlsx')

# Get sheet names
print(wb.get_sheet_names())
Помните, что вы можете изменить рабочий каталог с помощью os.chdir().
Вы видите, что фрагмент кода выше возвращает имена листов книги, загруженной в Python.Можете использовать эту информацию, чтобы также получить отдельные листы рабочей книги.
Вы также можете проверить, какой лист в настоящее время активен с wb.active. Как видно из кода ниже, вы можете использовать его для загрузки другого листа из вашей книги:
# Get a sheet by name
sheet = wb.get_sheet_by_name('Sheet3')

# Print the sheet title
sheet.title

# Get currently active sheet
anotherSheet = wb.active

# Check `anotherSheet`
anotherSheet
На первый взгляд, с этими объектами рабочего листа вы не сможете многое сделать.. Однако вы можете извлечь значения из определенных ячеек на листе вашей книги, используя квадратные скобки [], в которые вы передаете точную ячейку, из которой вы хотите получить значение.
Обратите внимание, что это похоже на выбор, получение и индексирование массивов NumPy и Pandas DataFrames, но это не все, что вам нужно сделать, чтобы получить значение. Вам нужно добавить атрибут value:
# Retrieve the value of a certain cell
sheet['A1'].value

# Select element 'B2' of your sheet
c = sheet['B2']

# Retrieve the row number of your element
c.row

# Retrieve the column letter of your element
c.column

# Retrieve the coordinates of the cell
c.coordinate
Как вы можете видеть, помимо значения, есть и другие атрибуты, которые вы можете использовать для проверки вашей ячейки, а именно: row, column и coordinate.
Атрибут row вернет 2;
Добавление атрибута column к c даст вам ‘B’
coordinate вернет ‘B2’.
Вы также можете получить значения ячеек с помощью функции cell(). Передайте row и column, добавьте к этим аргументам значения, соответствующие значениям ячейки, которую вы хотите получить, и, конечно же, не забудьте добавить атрибут value:
# Retrieve cell value
sheet.cell(row=1, column=2).value

# Print out values in column 2
for i in range(1, 4):
     print(i, sheet.cell(row=i, column=2).value)
Обратите внимание, что если вы не укажете атрибут value, вы получите <Cell Sheet3.B1>, который ничего не говорит о значении, которое содержится в этой конкретной ячейке.
Вы видите, что вы используете цикл for с помощью функции range(), чтобы помочь вам распечатать значения строк, имеющих значения в столбце 2. Если эти конкретные ячейки пусты, вы просто вернете None. Если вы хотите узнать больше о циклах for, пройдите наш курс Intermediate Python для Data Science.
Есть специальные функции, которые вы можете вызывать для получения некоторых других значений, например, get_column_letter() и column_index_from_string.
Две функции указывают примерно то, что вы можете получить, используя их, но лучше сделать их четче: хотя вы можете извлечь букву столбца с предшествующего, вы можете сделать обратное или получить адрес столбца, когда вы задаёте букву последнему. Вы можете увидеть, как это работает ниже:
# Импорт необходимых модулей из  `openpyxl.utils`
from openpyxl.utils import get_column_letter, column_index_from_string

# Вывод 'A'
get_column_letter(1)

# Return '1'
column_index_from_string('A')
Вы уже получили значения для строк, которые имеют значения в определенном столбце, но что вам нужно сделать, если вы хотите распечатать строки вашего файла, не сосредотачиваясь только на одном столбце? Использовать другой цикл, конечно!
Например, вы говорите, что хотите сфокусироваться на области между «А1» и «С3», где первая указывает на левый верхний угол, а вторая — на правый нижний угол области, на которой вы хотите сфокусироваться. ,
Эта область будет так называемым cellObj, который вы видите в первой строке кода ниже. Затем вы говорите, что для каждой ячейки, которая находится в этой области, вы печатаете координату и значение, которое содержится в этой ячейке. После конца каждой строки вы печатаете сообщение, которое указывает, что строка этой области cellObj напечатана.
# Напечатать строчку за строчкой
for cellObj in sheet['A1':'C3']:
      for cell in cellObj:
              print(cells.coordinate, cells.value)
      print('--- END ---')
Еще раз обратите внимание, что выбор области очень похож на выбор, получение и индексирование списка и элементов массива NumPy, где вы также используете [] и : для указания области, значения которой вы хотите получить. Кроме того, вышеприведенный цикл также хорошо использует атрибуты ячейки!
Чтобы сделать вышеприведенное объяснение и код наглядным, вы можете проверить результат, который вы получите после завершения цикла:
('A1', u'M')
('B1', u'N')
('C1', u'O')
--- END ---
('A2', 10L)
('B2', 11L)
('C2', 12L)
--- END ---
('A3', 14L)
('B3', 15L)
('C3', 16L)
--- END ---
Наконец, есть некоторые атрибуты, которые вы можете использовать для проверки результата вашего импорта, а именно max_row и max_column. Эти атрибуты, конечно, и так — общие способы проверки правильности загрузки данных, но они все равно полезны.
# Вывести максимальное количество строк
sheet.max_row

# Вывести максимальное количество колонок
sheet.max_column
Наверное, вы думаете, что такой способ работы с этими файлами сложноват, особенно если вы еще хотите манипулировать данными.
Должно быть что-то попроще, верно? Так и есть!
openpyxl поддерживает Pandas DataFrames! Вы можете использовать функцию DataFrame() из библиотеки Pandas, чтобы поместить значения листа в DataFrame:
# Import `pandas`
import pandas as pd

# конвертировать Лист в DataFrame
df = pd.DataFrame(sheet.values)
Если вы хотите указать заголовки и индексы, вам нужно добавить немного больше кода:
# Put the sheet values in `data`
data = sheet.values

# Indicate the columns in the sheet values
cols = next(data)[1:]

# Convert your data to a list
data = list(data)

# Read in the data at index 0 for the indices
idx = [r[0] for r in data]

# Slice the data at index 1
data = (islice(r, 1, None) for r in data)

# Make your DataFrame
df = pd.DataFrame(data, index=idx, columns=cols)
Затем вы можете начать манипулировать данными со всеми функциями, которые предлагает библиотека Pandas. Но помните, что вы находитесь в виртуальной среде, поэтому, если библиотека еще не представлена, вам нужно будет установить ее снова через pip.
Чтобы записать ваши Pandas DataFrames обратно в файл Excel, вы можете легко использовать функцию dataframe_to_rows() из модуля utils:
# Import `dataframe_to_rows`
from openpyxl.utils.dataframe import dataframe_to_rows

# Initialize a workbook
wb = Workbook()

# Get the worksheet in the active workbook
ws = wb.active

# Append the rows of the DataFrame to your worksheet
for r in dataframe_to_rows(df, index=True, header=True):
    ws.append(r)
Но это точно не все! Библиотека openpyxl предлагает вам высокую гибкость при записи ваших данных обратно в файлы Excel, изменении стилей ячеек или использовании режима write-only. Эту библиотеку обязательно нужно знать, когда вы часто работаете с электронными таблицами ,
Совет: читайте больше о том, как вы можете изменить стили ячеек, перейти в режим write-only или как библиотека работает с NumPy здесь.
Теперь давайте также рассмотрим некоторые другие библиотеки, которые вы можете использовать для получения данных вашей электронной таблицы в Python.
Прежде чем закрыть этот раздел, не забудьте отключить виртуальную среду, когда закончите!
Чтение и форматирование Excel-файлов: xlrd
Эта библиотека идеально подходит для чтения и форматирования данных из Excel с расширением xls или xlsx.
# Import `xlrd`
import xlrd

# Open a workbook
workbook = xlrd.open_workbook('example.xls')

# Loads only current sheets to memory
workbook = xlrd.open_workbook('example.xls', on_demand = True)
Когда вам не нужны данные из всей Excel-книги, вы можете использовать функции sheet_by_name() или sheet_by_index() для получения листов, которые вы хотите получить в своём анализе
# Load a specific sheet by name
worksheet = workbook.sheet_by_name('Sheet1')

# Load a specific sheet by index
worksheet = workbook.sheet_by_index(0)

# Retrieve the value from cell at indices (0,0)
sheet.cell(0, 0).value
Также можно получить значение в определённых ячейках с вашего листа.
Перейдите к xlwt и xlutils, чтобы узнать больше о том, как они относятся к библиотеке xlrd.
Запись данных в Excel-файлы с xlwt
Если вы хотите создать таблицу со своими данными, вы можете использовать не только библиотеку XlsWriter, но и xlwt. xlwt идеально подходит для записи данных и форматирования информации в файлах с расширением .xls
Когда вы вручную создаёте файл:
# Import `xlwt`
import xlwt

# Initialize a workbook
book = xlwt.Workbook(encoding="utf-8")

# Add a sheet to the workbook
sheet1 = book.add_sheet("Python Sheet 1")

# Write to the sheet of the workbook
sheet1.write(0, 0, "This is the First Cell of the First Sheet")

# Save the workbook
book.save("spreadsheet.xls")
Если вы хотите записать данные в файл, но не хотите делать все самостоятельно, вы всегда можете прибегнуть к циклу for, чтобы автоматизировать весь процесс. Составьте сценарий, в котором вы создаёте книгу и в которую добавляете лист. Укажите список со столбцами и один со значениями, которые будут заполнены на листе.
Далее у вас есть цикл for, который гарантирует, что все значения попадают в файл: вы говорите, что для каждого элемента в диапазоне от 0 до 4 (5 не включительно) вы собираетесь что-то делать. Вы будете заполнять значения построчно. Для этого вы указываете элемент строки, который появляется в каждом цикле. Далее у вас есть еще один цикл for, который будет проходить по столбцам вашего листа. Вы говорите, что для каждой строки на листе, вы будете смотреть на столбцы, которые идут с ним, и вы будете заполнять значение для каждого столбца в строке. Заполнив все столбцы строки значениями, вы перейдете к следующей строке, пока не останется строк.
# Initialize a workbook
book = xlwt.Workbook()
# Add a sheet to the workbook
sheet1 = book.add_sheet("Sheet1")
# The data
cols = ["A", "B", "C", "D", "E"]
txt = [0,1,2,3,4]
# Loop over the rows and columns and fill in the values
for num in range(5):
row = sheet1.row(num)
for index, col in enumerate(cols):
value = txt[index] + num
row.write(index, value)
# Save the result
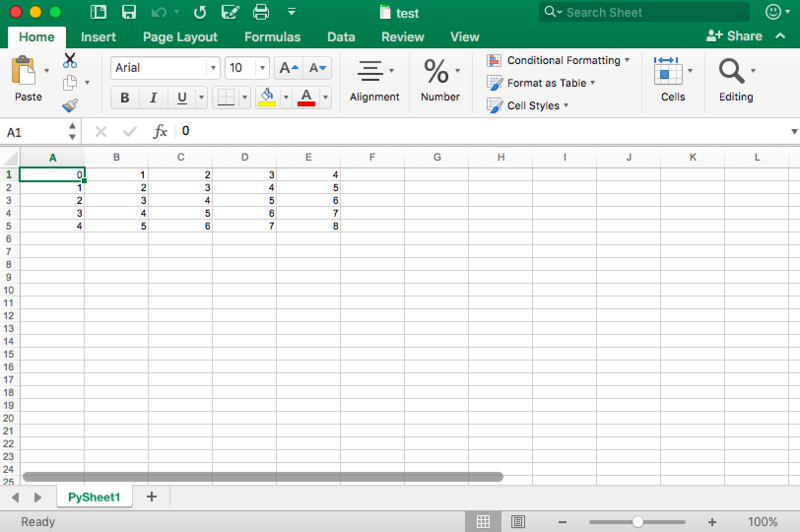
book.save("test.xls")На скриншоте ниже представлен результат выполнения этого кода:
Теперь, когда вы увидели, как xlrd и xlwt работают друг с другом, пришло время взглянуть на библиотеку, которая тесно связана с этими двумя: xlutils.
Сборник утилит: xlutils
Эта библиотека — сборник утилит, для которого требуются и xlrd и xlwt, и которая может копировать, изменять и фильтровать существующие данные. О том, как пользоваться этими командами рассказано в разделе по openpyxl.
Вернитесь в раздел openpyxl, чтобы получить больше информации о том, как использовать этот пакет для получения данных в Python.
Использование pyexcel для чтения .xls или .xlsx файлов
Еще одна библиотека, которую можно использовать для чтения данных электронных таблиц в Python — это pyexcel; Python Wrapper, который предоставляет один API для чтения, записи и работы с данными в файлах .csv, .ods, .xls, .xlsx и .xlsm. Конечно, для этого урока вы просто сосредоточитесь на файлах .xls и .xls.
Чтобы получить ваши данные в массиве, вы можете использовать функцию get_array(), которая содержится в пакете pyexcel:
# Import `pyexcel`
import pyexcel

# Get an array from the data
my_array = pyexcel.get_array(file_name="test.xls")
Вы также можете получить свои данные в упорядоченном словаре списков. Вы можете использовать функцию get_dict():
# Import `OrderedDict` module
from pyexcel._compact import OrderedDict

# Get your data in an ordered dictionary of lists
my_dict = pyexcel.get_dict(file_name="test.xls", name_columns_by_row=0)

# Get your data in a dictionary of 2D arrays
book_dict = pyexcel.get_book_dict(file_name="test.xls")
Здесь видно, что если вы хотите получить словарь двумерных массивов или получить все листы рабочей книги в одном словаре, вы можете прибегнуть к get_book_dict().
Помните, что эти две структуры данных, которые были упомянуты выше, массивы и словари вашей таблицы, позволяют вам создавать DataFrames ваших данных с помощью pd.DataFrame(). Это облегчит обработку данных.
Кроме того, вы можете просто получить записи из таблицы с помощью pyexcel благодаря функции get_records(). Просто передайте аргумент file_name в функцию, и вы получите список словарей:
# Retrieve the records of the file
records = pyexcel.get_records(file_name="test.xls")
Чтобы узнать, как управлять списками Python, ознакомьтесь с примерами из документации о списках Python.
Запись в файл с pyexcel
С помощью этой библиотеки можно не только загружать данные в массивы, вы также можете экспортировать свои массивы обратно в таблицу. Используйте функцию save_as() и передайте массив и имя файла назначения в аргумент dest_file_name:
# Get the data
data = [[1, 2, 3], [4, 5, 6], [7, 8, 9]]

# Save the array to a file
pyexcel.save_as(array=data, dest_file_name="array_data.xls")
Обратите внимание, что если вы хотите указать разделитель, вы можете добавить аргумент dest_delimiter и передать символ, который вы хотите использовать в качестве разделителя между «».
Однако если у вас есть словарь, вам нужно использовать функцию save_book_as(). Передайте двумерный словарь в bookdict и укажите имя файла:
# The data
2d_array_dictionary = {'Sheet 1': [
                                   ['ID', 'AGE', 'SCORE']
                                   [1, 22, 5],
                                   [2, 15, 6],
                                   [3, 28, 9]
                                  ],
                       'Sheet 2': [
                                    ['X', 'Y', 'Z'],
                                    [1, 2, 3],
                                    [4, 5, 6]
                                    [7, 8, 9]
                                  ],
                       'Sheet 3': [
                                    ['M', 'N', 'O', 'P'],
                                    [10, 11, 12, 13],
                                    [14, 15, 16, 17]
                                    [18, 19, 20, 21]
                                   ]}

# Save the data to a file
pyexcel.save_book_as(bookdict=2d_array_dictionary, dest_file_name="2d_array_data.xls")
При использовании кода, напечатанного в приведенном выше примере, важно помнить, что порядок ваших данных в словаре не будет сохранен. Если вы не хотите этого, вам нужно сделать небольшой обход. Вы можете прочитать все об этом здесь.
Чтение и запись .csv файлов
Если вы все еще ищете библиотеки, которые позволяют загружать и записывать данные в файлы .csv, кроме Pandas, лучше всего использовать пакет csv:
# import `csv`
import csv

# Read in csv file
for row in csv.reader(open('data.csv'), delimiter=','):
      print(row)

# Write csv file
data = [[1, 2, 3], [4, 5, 6], [7, 8, 9]]
outfile = open('data.csv', 'w')
writer = csv.writer(outfile, delimiter=';', quotechar='"')
writer.writerows(data)
outfile.close()
Обратите внимание, что в пакете NumPy есть функция genfromtxt(), которая позволяет загружать данные, содержащиеся в файлах .csv, в массивы, которые затем можно поместить в DataFrames.
Финальная проверка данных
Когда у вас есть данные, не забудьте последний шаг: проверить, правильно ли загружены данные. Если вы поместили свои данные в DataFrame, вы можете легко и быстро проверить, был ли импорт успешным, выполнив следующие команды:
# Check the first entries of the DataFrame
df1.head()

# Check the last entries of the DataFrame
df1.tail()
Если у вас есть данные в массиве, вы можете проверить их, используя следующие атрибуты массива: shape, ndim, dtype и т.д .:
# Inspect the shape
data.shape

# Inspect the number of dimensions
data.ndim

# Inspect the data type
data.dtype
Что дальше?
Поздравляем! Вы успешно прошли наш урок и научились читать файлы Excel на Python.
Если вы хотите продолжить работу над этой темой, попробуйте воспользоваться PyXll, который позволяет писать функции в Python и вызывать их в Excel.

Support the project
If your company has embedded pyexcel and its components into a revenue generating
product, please support me on github, patreon
or bounty source to maintain
the project and develop it further.
If you are an individual, you are welcome to support me too and for however long
you feel like. As my backer, you will receive
early access to pyexcel related contents.
And your issues will get prioritized if you would like to become my patreon as pyexcel pro user.
With your financial support, I will be able to invest
a little bit more time in coding, documentation and writing interesting posts.
Known constraints
Fonts, colors and charts are not supported.
Nor to read password protected xls, xlsx and ods files.
Introduction
Feature Highlights
|
file format |
definition |
|---|---|
|
csv |
comma separated values |
|
tsv |
tab separated values |
|
csvz |
a zip file that contains one or many csv files |
|
tsvz |
a zip file that contains one or many tsv files |
|
xls |
a spreadsheet file format created by |
|
xlsx |
MS-Excel Extensions to the Office Open XML |
|
xlsm |
an MS-Excel Macro-Enabled Workbook file |
|
ods |
open document spreadsheet |
|
fods |
flat open document spreadsheet |
|
json |
java script object notation |
|
html |
html table of the data structure |
|
simple |
simple presentation |
|
rst |
rStructured Text presentation of the data |
|
mediawiki |
media wiki table |
-
One application programming interface(API) to handle multiple data sources:
-
physical file
-
memory file
-
SQLAlchemy table
-
Django Model
-
Python data structures: dictionary, records and array
-
-
One API to read and write data in various excel file formats.
-
For large data sets, data streaming are supported. A genenerator can be returned to you. Checkout iget_records, iget_array, isave_as and isave_book_as.
Installation
You can install pyexcel via pip:
$ pip install pyexcelor clone it and install it:
$ git clone https://github.com/pyexcel/pyexcel.git
$ cd pyexcel
$ python setup.py install
One liners
This section shows you how to get data from your excel files and how to
export data to excel files in one line
Read from the excel files
Get a list of dictionaries
Suppose you want to process History of Classical Music:
History of Classical Music:
|
Name |
Period |
Representative Composers |
|
Medieval |
c.1150-c.1400 |
Machaut, Landini |
|
Renaissance |
c.1400-c.1600 |
Gibbons, Frescobaldi |
|
Baroque |
c.1600-c.1750 |
JS Bach, Vivaldi |
|
Classical |
c.1750-c.1830 |
Joseph Haydn, Wolfgan Amadeus Mozart |
|
Earley Romantic |
c.1830-c.1860 |
Chopin, Mendelssohn, Schumann, Liszt |
|
Late Romantic |
c.1860-c.1920 |
Wagner,Verdi |
Let’s get a list of dictionary out from the xls file:
>>> records = p.get_records(file_name="your_file.xls")And let’s check what do we have:
>>> for row in records:
...     print(f"{row['Representative Composers']} are from {row['Name']} period ({row['Period']})")
Machaut, Landini are from Medieval period (c.1150-c.1400)
Gibbons, Frescobaldi are from Renaissance period (c.1400-c.1600)
JS Bach, Vivaldi are from Baroque period (c.1600-c.1750)
Joseph Haydn, Wolfgan Amadeus Mozart are from Classical period (c.1750-c.1830)
Chopin, Mendelssohn, Schumann, Liszt are from Earley Romantic period (c.1830-c.1860)
Wagner,Verdi are from Late Romantic period (c.1860-c.1920)
Get two dimensional array
Instead, what if you have to use pyexcel.get_array to do the same:
>>> for row in p.get_array(file_name="your_file.xls", start_row=1):
...     print(f"{row[2]} are from {row[0]} period ({row[1]})")
Machaut, Landini are from Medieval period (c.1150-c.1400)
Gibbons, Frescobaldi are from Renaissance period (c.1400-c.1600)
JS Bach, Vivaldi are from Baroque period (c.1600-c.1750)
Joseph Haydn, Wolfgan Amadeus Mozart are from Classical period (c.1750-c.1830)
Chopin, Mendelssohn, Schumann, Liszt are from Earley Romantic period (c.1830-c.1860)
Wagner,Verdi are from Late Romantic period (c.1860-c.1920)
where start_row skips the header row.
Get a dictionary
You can get a dictionary too:
Now let’s get a dictionary out from the spreadsheet:
>>> my_dict = p.get_dict(file_name="your_file.xls", name_columns_by_row=0)And check what do we have:
>>> from pyexcel._compact import OrderedDict
>>> isinstance(my_dict, OrderedDict)
True
>>> for key, values in my_dict.items():
...     print(key + " : " + ','.join([str(item) for item in values]))
Name : Medieval,Renaissance,Baroque,Classical,Earley Romantic,Late Romantic
Period : c.1150-c.1400,c.1400-c.1600,c.1600-c.1750,c.1750-c.1830,c.1830-c.1860,c.1860-c.1920
Representative Composers : Machaut, Landini,Gibbons, Frescobaldi,JS Bach, Vivaldi,Joseph Haydn, Wolfgan Amadeus Mozart,Chopin, Mendelssohn, Schumann, Liszt,Wagner,Verdi
Please note that my_dict is an OrderedDict.
Get a dictionary of two dimensional array
Suppose you have a multiple sheet book as the following:
pyexcel:Sheet 1:
pyexcel:Sheet 2:
pyexcel:Sheet 3:
Here is the code to obtain those sheets as a single dictionary:
>>> book_dict = p.get_book_dict(file_name="book.xls")And check:
>>> isinstance(book_dict, OrderedDict)
True
>>> import json
>>> for key, item in book_dict.items():
...     print(json.dumps({key: item}))
{"Sheet 1": [[1, 2, 3], [4, 5, 6], [7, 8, 9]]}
{"Sheet 2": [["X", "Y", "Z"], [1, 2, 3], [4, 5, 6]]}
{"Sheet 3": [["O", "P", "Q"], [3, 2, 1], [4, 3, 2]]}
Write data
Export an array
Suppose you have the following array:
>>> data = [[1, 2, 3], [4, 5, 6], [7, 8, 9]]And here is the code to save it as an excel file :
>>> p.save_as(array=data, dest_file_name="example.xls")Let’s verify it:
>>> p.get_sheet(file_name="example.xls")
pyexcel_sheet1:
+---+---+---+
| 1 | 2 | 3 |
+---+---+---+
| 4 | 5 | 6 |
+---+---+---+
| 7 | 8 | 9 |
+---+---+---+
And here is the code to save it as a csv file :
>>> p.save_as(array=data,
...           dest_file_name="example.csv",
...           dest_delimiter=':')
Let’s verify it:
>>> with open("example.csv") as f:
...     for line in f.readlines():
...         print(line.rstrip())
...
1:2:3
4:5:6
7:8:9
Export a list of dictionaries
>>> records = [
...     {"year": 1903, "country": "Germany", "speed": "206.7km/h"},
...     {"year": 1964, "country": "Japan", "speed": "210km/h"},
...     {"year": 2008, "country": "China", "speed": "350km/h"}
... ]
>>> p.save_as(records=records, dest_file_name='high_speed_rail.xls')
Export a dictionary of single key value pair
>>> henley_on_thames_facts = {
...     "area": "5.58 square meters",
...     "population": "11,619",
...     "civial parish": "Henley-on-Thames",
...     "latitude": "51.536",
...     "longitude": "-0.898"
... }
>>> p.save_as(adict=henley_on_thames_facts, dest_file_name='henley.xlsx')
Export a dictionary of single dimensonal array
>>> ccs_insights = {
...     "year": ["2017", "2018", "2019", "2020", "2021"],
...     "smart phones": [1.53, 1.64, 1.74, 1.82, 1.90],
...     "feature phones": [0.46, 0.38, 0.30, 0.23, 0.17]
... }
>>> p.save_as(adict=ccs_insights, dest_file_name='ccs.csv')
Export a dictionary of two dimensional array as a book
Suppose you want to save the below dictionary to an excel file :
>>> a_dictionary_of_two_dimensional_arrays = {
...      'Sheet 1':
...          [
...              [1.0, 2.0, 3.0],
...              [4.0, 5.0, 6.0],
...              [7.0, 8.0, 9.0]
...          ],
...      'Sheet 2':
...          [
...              ['X', 'Y', 'Z'],
...              [1.0, 2.0, 3.0],
...              [4.0, 5.0, 6.0]
...          ],
...      'Sheet 3':
...          [
...              ['O', 'P', 'Q'],
...              [3.0, 2.0, 1.0],
...              [4.0, 3.0, 2.0]
...          ]
...  }
Here is the code:
>>> p.save_book_as(
...    bookdict=a_dictionary_of_two_dimensional_arrays,
...    dest_file_name="book.xls"
... )
If you want to preserve the order of sheets in your dictionary, you have to
pass on an ordered dictionary to the function itself. For example:
>>> data = OrderedDict()
>>> data.update({"Sheet 2": a_dictionary_of_two_dimensional_arrays['Sheet 2']})
>>> data.update({"Sheet 1": a_dictionary_of_two_dimensional_arrays['Sheet 1']})
>>> data.update({"Sheet 3": a_dictionary_of_two_dimensional_arrays['Sheet 3']})
>>> p.save_book_as(bookdict=data, dest_file_name="book.xls")
Let’s verify its order:
>>> book_dict = p.get_book_dict(file_name="book.xls")
>>> for key, item in book_dict.items():
...     print(json.dumps({key: item}))
{"Sheet 2": [["X", "Y", "Z"], [1, 2, 3], [4, 5, 6]]}
{"Sheet 1": [[1, 2, 3], [4, 5, 6], [7, 8, 9]]}
{"Sheet 3": [["O", "P", "Q"], [3, 2, 1], [4, 3, 2]]}
Please notice that “Sheet 2” is the first item in the book_dict, meaning the order of sheets are preserved.
Transcoding
The following code does a simple file format transcoding from xls to csv:
>>> p.save_as(file_name="birth.xls", dest_file_name="birth.csv")Again it is really simple. Let’s verify what we have gotten:
>>> sheet = p.get_sheet(file_name="birth.csv")
>>> sheet
birth.csv:
+-------+--------+----------+
| name  | weight | birth    |
+-------+--------+----------+
| Adam  | 3.4    | 03/02/15 |
+-------+--------+----------+
| Smith | 4.2    | 12/11/14 |
+-------+--------+----------+
Let use previous example and save it as xlsx instead
>>> p.save_as(file_name="birth.xls",
...           dest_file_name="birth.xlsx") # change the file extension
Again let’s verify what we have gotten:
>>> sheet = p.get_sheet(file_name="birth.xlsx")
>>> sheet
pyexcel_sheet1:
+-------+--------+----------+
| name  | weight | birth    |
+-------+--------+----------+
| Adam  | 3.4    | 03/02/15 |
+-------+--------+----------+
| Smith | 4.2    | 12/11/14 |
+-------+--------+----------+
Excel book merge and split operation in one line
Merge all excel files in directory into a book where each file become a sheet
The following code will merge every excel files into one file, say “output.xls”:
from pyexcel.cookbook import merge_all_to_a_book
import glob


merge_all_to_a_book(glob.glob("your_csv_directory*.csv"), "output.xls")
You can mix and match with other excel formats: xls, xlsm and ods. For example, if you are sure you have only xls, xlsm, xlsx, ods and csv files in your_excel_file_directory, you can do the following:
from pyexcel.cookbook import merge_all_to_a_book
import glob


merge_all_to_a_book(glob.glob("your_excel_file_directory*.*"), "output.xls")
Split a book into single sheet files
Suppose you have many sheets in a work book and you would like to separate each into a single sheet excel file. You can easily do this:
>>> from pyexcel.cookbook import split_a_book
>>> split_a_book("megabook.xls", "output.xls")
>>> import glob
>>> outputfiles = glob.glob("*_output.xls")
>>> for file in sorted(outputfiles):
...     print(file)
...
Sheet 1_output.xls
Sheet 2_output.xls
Sheet 3_output.xls
for the output file, you can specify any of the supported formats
Hidden feature: partial read
Most pyexcel users do not know, but other library users were requesting partial read
When you are dealing with huge amount of data, e.g. 64GB, obviously you would not
like to fill up your memory with those data. What you may want to do is, record
data from Nth line, take M records and stop. And you only want to use your memory
for the M records, not for beginning part nor for the tail part.
Hence partial read feature is developed to read partial data into memory for
processing.
You can paginate by row, by column and by both, hence you dictate what portion of the
data to read back. But remember only row limit features help you save memory. Let’s
you use this feature to record data from Nth column, take M number of columns and skip
the rest. You are not going to reduce your memory footprint.
Why did not I see above benefit?
This feature depends heavily on the implementation details.
pyexcel-xls (xlrd), pyexcel-xlsx (openpyxl), pyexcel-ods (odfpy) and
pyexcel-ods3 (pyexcel-ezodf) will read all data into memory. Because xls,
xlsx and ods file are effective a zipped folder, all four will unzip the folder
and read the content in xml format in full, so as to make sense of all details.
Hence, during the partial data is been returned, the memory consumption won’t
differ from reading the whole data back. Only after the partial
data is returned, the memory comsumption curve shall jump the cliff. So pagination
code here only limits the data returned to your program.
With that said, pyexcel-xlsxr, pyexcel-odsr and pyexcel-htmlr DOES read
partial data into memory. Those three are implemented in such a way that they
consume the xml(html) when needed. When they have read designated portion of the
data, they stop, even if they are half way through.
In addition, pyexcel’s csv readers can read partial data into memory too.
Let’s assume the following file is a huge csv file:
>>> import datetime
>>> import pyexcel as pe
>>> data = [
...     [1, 21, 31],
...     [2, 22, 32],
...     [3, 23, 33],
...     [4, 24, 34],
...     [5, 25, 35],
...     [6, 26, 36]
... ]
>>> pe.save_as(array=data, dest_file_name="your_file.csv")
And let’s pretend to read partial data:
>>> pe.get_sheet(file_name="your_file.csv", start_row=2, row_limit=3)
your_file.csv:
+---+----+----+
| 3 | 23 | 33 |
+---+----+----+
| 4 | 24 | 34 |
+---+----+----+
| 5 | 25 | 35 |
+---+----+----+
And you could as well do the same for columns:
>>> pe.get_sheet(file_name="your_file.csv", start_column=1, column_limit=2)
your_file.csv:
+----+----+
| 21 | 31 |
+----+----+
| 22 | 32 |
+----+----+
| 23 | 33 |
+----+----+
| 24 | 34 |
+----+----+
| 25 | 35 |
+----+----+
| 26 | 36 |
+----+----+
Obvious, you could do both at the same time:
>>> pe.get_sheet(file_name="your_file.csv",
...     start_row=2, row_limit=3,
...     start_column=1, column_limit=2)
your_file.csv:
+----+----+
| 23 | 33 |
+----+----+
| 24 | 34 |
+----+----+
| 25 | 35 |
+----+----+
The pagination support is available across all pyexcel plugins.
Formatting while transcoding a big data file
If you are transcoding a big data set, conventional formatting method would not
help unless a on-demand free RAM is available. However, there is a way to minimize
the memory footprint of pyexcel while the formatting is performed.
Let’s continue from previous example. Suppose we want to transcode “your_file.csv”
to “your_file.xls” but increase each element by 1.
What we can do is to define a row renderer function as the following:
>>> def increment_by_one(row):
...     for element in row:
...         yield element + 1
Then pass it onto save_as function using row_renderer:
>>> pe.isave_as(file_name="your_file.csv",
...             row_renderer=increment_by_one,
...             dest_file_name="your_file.xlsx")
We can verify if it was done correctly:
>>> pe.get_sheet(file_name="your_file.xlsx")
your_file.csv:
+---+----+----+
| 2 | 22 | 32 |
+---+----+----+
| 3 | 23 | 33 |
+---+----+----+
| 4 | 24 | 34 |
+---+----+----+
| 5 | 25 | 35 |
+---+----+----+
| 6 | 26 | 36 |
+---+----+----+
| 7 | 27 | 37 |
+---+----+----+
Stream APIs for big file : A set of two liners
When you are dealing with BIG excel files, you will want pyexcel to use
constant memory.
This section shows you how to get data from your BIG excel files and how to
export data to excel files in two lines at most, without eating all
your computer memory.
Two liners for get data from big excel files
Get a list of dictionaries
Suppose you want to process the following coffee data again:
Top 5 coffeine drinks:
|
Coffees |
Serving Size |
Caffeine (mg) |
|
Starbucks Coffee Blonde Roast |
venti(20 oz) |
475 |
|
Dunkin’ Donuts Coffee with Turbo Shot |
large(20 oz.) |
398 |
|
Starbucks Coffee Pike Place Roast |
grande(16 oz.) |
310 |
|
Panera Coffee Light Roast |
regular(16 oz.) |
300 |
Let’s get a list of dictionary out from the xls file:
>>> records = p.iget_records(file_name="your_file.xls")And let’s check what do we have:
>>> for r in records:
...     print(f"{r['Serving Size']} of {r['Coffees']} has {r['Caffeine (mg)']} mg")
venti(20 oz) of Starbucks Coffee Blonde Roast has 475 mg
large(20 oz.) of Dunkin' Donuts Coffee with Turbo Shot has 398 mg
grande(16 oz.) of Starbucks Coffee Pike Place Roast has 310 mg
regular(16 oz.) of Panera Coffee Light Roast has 300 mg
Please do not forgot the second line to close the opened file handle:
>>> p.free_resources()Get two dimensional array
Instead, what if you have to use pyexcel.get_array to do the same:
>>> for row in p.iget_array(file_name="your_file.xls", start_row=1):
...     print(f"{row[1]} of {row[0]} has {row[2]} mg")
venti(20 oz) of Starbucks Coffee Blonde Roast has 475 mg
large(20 oz.) of Dunkin' Donuts Coffee with Turbo Shot has 398 mg
grande(16 oz.) of Starbucks Coffee Pike Place Roast has 310 mg
regular(16 oz.) of Panera Coffee Light Roast has 300 mg
Again, do not forgot the second line:
>>> p.free_resources()where start_row skips the header row.
Data export in one liners
Export an array
Suppose you have the following array:
>>> data = [[1, 2, 3], [4, 5, 6], [7, 8, 9]]And here is the code to save it as an excel file :
>>> p.isave_as(array=data, dest_file_name="example.xls")But the following line is not required because the data source
are not file sources:
>>> # p.free_resources()Let’s verify it:
>>> p.get_sheet(file_name="example.xls")
pyexcel_sheet1:
+---+---+---+
| 1 | 2 | 3 |
+---+---+---+
| 4 | 5 | 6 |
+---+---+---+
| 7 | 8 | 9 |
+---+---+---+
And here is the code to save it as a csv file :
>>> p.isave_as(array=data,
...            dest_file_name="example.csv",
...            dest_delimiter=':')
Let’s verify it:
>>> with open("example.csv") as f:
...     for line in f.readlines():
...         print(line.rstrip())
...
1:2:3
4:5:6
7:8:9
Export a list of dictionaries
>>> records = [
...     {"year": 1903, "country": "Germany", "speed": "206.7km/h"},
...     {"year": 1964, "country": "Japan", "speed": "210km/h"},
...     {"year": 2008, "country": "China", "speed": "350km/h"}
... ]
>>> p.isave_as(records=records, dest_file_name='high_speed_rail.xls')
Export a dictionary of single key value pair
>>> henley_on_thames_facts = {
...     "area": "5.58 square meters",
...     "population": "11,619",
...     "civial parish": "Henley-on-Thames",
...     "latitude": "51.536",
...     "longitude": "-0.898"
... }
>>> p.isave_as(adict=henley_on_thames_facts, dest_file_name='henley.xlsx')
Export a dictionary of single dimensonal array
>>> ccs_insights = {
...     "year": ["2017", "2018", "2019", "2020", "2021"],
...     "smart phones": [1.53, 1.64, 1.74, 1.82, 1.90],
...     "feature phones": [0.46, 0.38, 0.30, 0.23, 0.17]
... }
>>> p.isave_as(adict=ccs_insights, dest_file_name='ccs.csv')
>>> p.free_resources()
Export a dictionary of two dimensional array as a book
Suppose you want to save the below dictionary to an excel file :
>>> a_dictionary_of_two_dimensional_arrays = {
...      'Sheet 1':
...          [
...              [1.0, 2.0, 3.0],
...              [4.0, 5.0, 6.0],
...              [7.0, 8.0, 9.0]
...          ],
...      'Sheet 2':
...          [
...              ['X', 'Y', 'Z'],
...              [1.0, 2.0, 3.0],
...              [4.0, 5.0, 6.0]
...          ],
...      'Sheet 3':
...          [
...              ['O', 'P', 'Q'],
...              [3.0, 2.0, 1.0],
...              [4.0, 3.0, 2.0]
...          ]
...  }
Here is the code:
>>> p.isave_book_as(
...    bookdict=a_dictionary_of_two_dimensional_arrays,
...    dest_file_name="book.xls"
... )
If you want to preserve the order of sheets in your dictionary, you have to
pass on an ordered dictionary to the function itself. For example:
>>> from pyexcel._compact import OrderedDict
>>> data = OrderedDict()
>>> data.update({"Sheet 2": a_dictionary_of_two_dimensional_arrays['Sheet 2']})
>>> data.update({"Sheet 1": a_dictionary_of_two_dimensional_arrays['Sheet 1']})
>>> data.update({"Sheet 3": a_dictionary_of_two_dimensional_arrays['Sheet 3']})
>>> p.isave_book_as(bookdict=data, dest_file_name="book.xls")
>>> p.free_resources()
Let’s verify its order:
>>> import json
>>> book_dict = p.get_book_dict(file_name="book.xls")
>>> for key, item in book_dict.items():
...     print(json.dumps({key: item}))
{"Sheet 2": [["X", "Y", "Z"], [1, 2, 3], [4, 5, 6]]}
{"Sheet 1": [[1, 2, 3], [4, 5, 6], [7, 8, 9]]}
{"Sheet 3": [["O", "P", "Q"], [3, 2, 1], [4, 3, 2]]}
Please notice that “Sheet 2” is the first item in the book_dict, meaning the order of sheets are preserved.
File format transcoding on one line
The following code does a simple file format transcoding from xls to csv:
>>> import pyexcel
>>> p.save_as(file_name="birth.xls", dest_file_name="birth.csv")
Again it is really simple. Let’s verify what we have gotten:
>>> sheet = p.get_sheet(file_name="birth.csv")
>>> sheet
birth.csv:
+-------+--------+----------+
| name  | weight | birth    |
+-------+--------+----------+
| Adam  | 3.4    | 03/02/15 |
+-------+--------+----------+
| Smith | 4.2    | 12/11/14 |
+-------+--------+----------+
Let use previous example and save it as xlsx instead
>>> import pyexcel
>>> p.isave_as(file_name="birth.xls",
...            dest_file_name="birth.xlsx") # change the file extension
Again let’s verify what we have gotten:
>>> sheet = p.get_sheet(file_name="birth.xlsx")
>>> sheet
pyexcel_sheet1:
+-------+--------+----------+
| name  | weight | birth    |
+-------+--------+----------+
| Adam  | 3.4    | 03/02/15 |
+-------+--------+----------+
| Smith | 4.2    | 12/11/14 |
+-------+--------+----------+
Available Plugins
|
Package name |
Supported file formats |
Dependencies |
|---|---|---|
|
pyexcel-io |
csv, csvz [1], tsv, |
|
|
pyexcel-xls |
xls, xlsx(read only), |
xlrd, |
|
pyexcel-xlsx |
xlsx |
openpyxl |
|
pyexcel-ods3 |
ods |
pyexcel-ezodf, |
|
pyexcel-ods |
ods |
odfpy |
|
Package name |
Supported file formats |
Dependencies |
|---|---|---|
|
pyexcel-xlsxw |
xlsx(write only) |
XlsxWriter |
|
pyexcel-libxlsxw |
xlsx(write only) |
libxlsxwriter |
|
pyexcel-xlsxr |
xlsx(read only) |
lxml |
|
pyexcel-xlsbr |
xlsb(read only) |
pyxlsb |
|
pyexcel-odsr |
read only for ods, fods |
lxml |
|
pyexcel-odsw |
write only for ods |
loxun |
|
pyexcel-htmlr |
html(read only) |
lxml,html5lib |
|
pyexcel-pdfr |
pdf(read only) |
camelot |
Plugin shopping guide
Since 2020, all pyexcel-io plugins have dropped the support for python versions
which are lower than 3.6. If you want to use any of those Python versions, please use pyexcel-io
and its plugins versions that are lower than 0.6.0.
Except csv files, xls, xlsx and ods files are a zip of a folder containing a lot of
xml files
The dedicated readers for excel files can stream read
In order to manage the list of plugins installed, you need to use pip to add or remove
a plugin. When you use virtualenv, you can have different plugins per virtual
environment. In the situation where you have multiple plugins that does the same thing
in your environment, you need to tell pyexcel which plugin to use per function call.
For example, pyexcel-ods and pyexcel-odsr, and you want to get_array to use pyexcel-odsr.
You need to append get_array(…, library=’pyexcel-odsr’).
|
Package name |
Supported file formats |
Dependencies |
Python versions |
|---|---|---|---|
|
pyexcel-text |
write only:rst, |
tabulate |
2.6, 2.7, 3.3, 3.4 |
|
pyexcel-handsontable |
handsontable in html |
handsontable |
same as above |
|
pyexcel-pygal |
svg chart |
pygal |
2.7, 3.3, 3.4, 3.5 |
|
pyexcel-sortable |
sortable table in html |
csvtotable |
same as above |
|
pyexcel-gantt |
gantt chart in html |
frappe-gantt |
except pypy, same |
Footnotes
Acknowledgement
All great work have been done by odf, ezodf, xlrd, xlwt, tabulate and other
individual developers. This library unites only the data access code.
License
New BSD License
19 contributors
In alphabetical order:
-
Akshaya Kumar Sharma
-
Andre Almar
-
Arunkumar Rajendran
-
Ayan Banerjee
-
Chris Hill-Scott
-
Craig Anderson
-
Daryl Yu
-
J Harley
-
Joel Nothman
-
John Vandenberg
-
Linghui Zeng
-
Nik Nyby
-
Rintze M. Zelle, PhD
-
Simeon Visser
-
Simon Allen
-
simon klemenc
-
Tim Gates
-
Wesley A. Cheng
-
William Jamir Silva
Change log
0.7.0 — 12.2.2022
Fixed
-
#250: RecursionError
raised on deepcopy of a sheet
Updated
-
#255: pyexcel.get_array
documentation page seems to be a copy of pyexcel.get_sheet
Removed
-
#249: drop the support for
dummy import statements pyexcel.ext.*
0.6.7 — 12.09.2021
Updated
-
#243: fix small typo.
-
add chardet as explicit dependency
0.6.6 — 14.11.2020
Updated
-
#233: dynamically resize
the table matrix on set_value. sheet[‘AA1’] = ‘test’ will work in this
release.
0.6.5 — 8.10.2020
Updated
-
update queryset source to work with pyexcel-io 0.6.0
0.6.4 — 18.08.2020
Updated
-
#219: book created from
dict no longer discards order.
0.6.3 — 01.08.2020
fixed
-
#214: remove leading and
trailing whitespace for column names
removed
-
python 2 compatibility have been permanently removed.
0.6.2 — 8.06.2020
fixed
-
#109: Control the column
order when write the data output
0.6.1 — 02.05.2020
fixed
-
#203: texttable was
dropped out in 0.6.0 as compulsary dependency. end user may experience it
when a sheet/table is printed in a shell. otherwise, new user of pyexcel
won’t see it. As of release date, no issues were created
0.6.0 — 21.04.2020
updated
-
#199: += in place; = +
shall return new instance -
#195: documentation
update. however small is welcome
removed
-
Dropping the test support for python version lower than 3.6. v0.6.0 should
work with python 2.7 but is not guaranteed to work. Please upgrade to python
3.6+.
0.5.15 — 07.07.2019
updated
-
#185: fix a bug with http
data source. The real fix lies in pyexcel-io v0.5.19. this release just put
the version requirement in.
0.5.14 — 12.06.2019
updated
-
#182: support
dest_force_file_type on save_as and save_book_as
0.5.13 — 12.03.2019
updated
-
#176: get_sheet
{IndexError}list index out of range // XLSX can’t be opened
0.5.12 — 25.02.2019
updated
-
#174: include examples in
tarbar
0.5.11 — 22.02.2019
updated
-
#169: remove
pyexcel-handsontalbe in test -
add tests, and docs folder in distribution
0.5.10 — 3.12.2018
updated
-
#157: Please use
scan_plugins_regex, which lml 0.7 complains about -
updated dependency on pyexcel-io to 0.5.11
0.5.9.1 — 30.08.2018
updated
-
to require pyexcel-io 0.5.9.1 and use lml at least version 0.0.2
0.5.9 — 30.08.2018
added
-
support __len__. len(book) returns the number of sheets and len(sheet)
returns the number of rows -
#144: memory-efficient way
to read sheet names. -
#148: force_file_type is
introduced. When reading a file on a disk, this parameter allows you to
choose a reader. i.e. csv reader for a text file. xlsx reader for a xlsx file
but with .blob file suffix. -
finally, pyexcel got import pyexcel.__version__
updated
-
Sheet.to_records() returns a generator now, saving memory
-
#115, Fix set membership
test to run faster in python2 -
#140, Direct writes to
cells yield weird results
0.5.8 — 26.03.2018
added
-
#125, sort book sheets
updated
-
#126, dest_sheet_name in
save_as will set the sheet name in the output -
#115, Fix set membership
test to run faster in python2
0.5.7 — 11.01.2018
added
-
pyexcel-io#46, expose
bulk_save to developer.
0.5.6 — 23.10.2017
removed
-
#105, remove gease from
setup_requires, introduced by 0.5.5. -
removed testing against python 2.6
-
#103, include LICENSE file
in MANIFEST.in, meaning LICENSE file will appear in the released tar ball.
0.5.5 — 20.10.2017
removed
-
#105, remove gease from
setup_requires, introduced by 0.5.5. -
removed testing against python 2.6
-
#103, include LICENSE file
in MANIFEST.in, meaning LICENSE file will appear in the released tar ball.
0.5.4 — 27.09.2017
fixed
-
#100, Sheet.to_dict() gets
out of range error because there is only one row.
updated
-
Updated the baseline of pyexcel-io to 0.5.1.
0.5.3 — 01-08-2017
added
-
#95, respect the order of
records in iget_records, isave_as and save_as. -
#97, new feature to allow
intuitive initialization of pyexcel.Book.
0.5.2 — 26-07-2017
Updated
-
embeded the enabler for pyexcel-htmlr. http source does not support text/html
as mime type.
0.5.1 — 12.06.2017
Updated
-
support saving SheetStream and BookStream to database targets. This is needed
for pyexcel-webio and its downstream projects.
0.5.0 — 19.06.2017
Added
-
Sheet.top() and Sheet.top_left() for data browsing
-
add html as default rich display in Jupyter notebook when pyexcel-text and
pyexcel-chart is installed -
add svg as default rich display in Jupyter notebook when pyexcel-chart and
one of its implementation plugin(pyexcel-pygal, etc.) are is installed -
new dictionary source supported: a dictionary of key value pair could be read
into a sheet. -
added dynamic external plugin loading. meaning if a pyexcel plugin is
installed, it will be loaded implicitly. And this change would remove
unnecessary info log for those who do not use pyexcel-text and pyexcel-gal -
save_book_as before 0.5.0 becomes isave_book_as and save_book_as in 0.5.0
convert BookStream to Book before saving. -
#83, file closing mechanism
is enfored. free_resource is added and it should be called when iget_array,
iget_records, isave_as and/or isave_book_as are used.
Updated
-
array is passed to pyexcel.Sheet as reference. it means your array data will
be modified.
Removed
-
pyexcel.Writer and pyexcel.BookWriter were removed
-
pyexcel.load_book_from_sql and pyexcel.load_from_sql were removed
-
pyexcel.deprecated.load_from_query_sets,
pyexcel.deprecated.load_book_from_django_models and
pyexcel.deprecated.load_from_django_model were removed -
Removed plugin loading code and lml is used instead
0.4.5 — 17.03.2017
Updated
-
#80: remove pyexcel-chart
import from v0.4.x
0.4.4 — 06.02.2017
Updated
-
#68: regression
save_to_memory() should have returned a stream instance which has been reset
to zero if possible. The exception is sys.stdout, which cannot be reset. -
#74: Not able to handle
decimal.Decimal
Removed
-
remove get_{{file_type}}_stream functions from pyexcel.Sheet and pyexcel.Book
introduced since 0.4.3.
0.4.3 — 26.01.2017
Added
-
‘.stream’ attribute are attached to ~pyexcel.Sheet and ~pyexcel.Book to
get direct access the underneath stream in responding to file type
attributes, such as sheet.xls. it helps provide a custom stream to external
world, for example, Sheet.stream.csv gives a text stream that contains csv
formatted data. Book.stream.xls returns a xls format data in a byte stream.
Updated
-
Better error reporting when an unknown parameters or unsupported file types
were given to the signature functions.
0.4.2 — 17.01.2017
Updated
-
Raise exception if the incoming sheet does not have column names. In other
words, only sheet with column names could be saved to database. sheet with
row names cannot be saved. The alternative is to transpose the sheet, then
name_columns_by_row and then save. -
fix iget_records where a non-uniform content should be given, e.g. [[“x”,
“y”], [1, 2], [3]], some record would become non-uniform, e.g. key ‘y’ would
be missing from the second record. -
skip_empty_rows is applicable when saving a python data structure to
another data source. For example, if your array contains a row which is
consisted of empty string, such as [‘’, ‘’, ‘’ … ‘’], please specify
skip_empty_rows=False in order to preserve it. This becomes subtle when you
try save a python dictionary where empty rows is not easy to be spotted. -
#69: better documentation
for save_book_as.
0.4.1 — 23.12.2016
Updated
-
#68: regression
save_to_memory() should have returned a stream instance.
0.4.0 — 22.12.2016
Added
-
Flask-Excel#19 allow
sheet_name parameter -
pyexcel-xls#11
case-insensitive for file_type. xls and XLS are treated in the same way
Updated
-
#66: export_columns is
ignored -
Update dependency on pyexcel-io v0.3.0
0.3.3 — 07.11.2016
Updated
-
#63: cannot display empty
sheet(hence book with empty sheet) as texttable
0.3.2 — 02.11.2016
Updated
-
#62: optional module import
error become visible.
0.3.0 — 28.10.2016
Added:
-
file type setters for Sheet and Book, and its documentation
-
iget_records returns a generator for a list of records and should have
better memory performance, especially dealing with large csv files. -
iget_array returns a generator for a list of two dimensional array and
should have better memory performance, especially dealing with large csv
files. -
Enable pagination support, and custom row renderer via pyexcel-io v0.2.3
Updated
-
Take isave_as out from save_as. Hence two functions are there for save a
sheet as -
#60: encode ‘utf-8’ if the
console is of ascii encoding. -
#59: custom row renderer
-
#56: set cell value does
not work -
pyexcel.transpose becomes pyexcel.sheets.transpose
-
iterator functions of pyexcel.Sheet were converted to generator functions
-
pyexcel.Sheet.enumerate()
-
pyexcel.Sheet.reverse()
-
pyexcel.Sheet.vertical()
-
pyexcel.Sheet.rvertical()
-
pyexcel.Sheet.rows()
-
pyexcel.Sheet.rrows()
-
pyexcel.Sheet.columns()
-
pyexcel.Sheet.rcolumns()
-
pyexcel.Sheet.named_rows()
-
pyexcel.Sheet.named_columns()
-
-
~pyexcel.Sheet.save_to_memory and ~pyexcel.Book.save_to_memory return the
actual content. No longer they will return a io object hence you cannot call
getvalue() on them.
Removed:
-
content and out_file as function parameters to the signature functions
are no longer supported. -
SourceFactory and RendererFactory are removed
-
The following methods are removed
-
pyexcel.to_array
-
pyexcel.to_dict
-
pyexcel.utils.to_one_dimensional_array
-
pyexcel.dict_to_array
-
pyexcel.from_records
-
pyexcel.to_records
-
-
pyexcel.Sheet.filter has been re-implemented and all filters were removed:
-
pyexcel.filters.ColumnIndexFilter
-
pyexcel.filters.ColumnFilter
-
pyexcel.filters.RowFilter
-
pyexcel.filters.EvenColumnFilter
-
pyexcel.filters.OddColumnFilter
-
pyexcel.filters.EvenRowFilter
-
pyexcel.filters.OddRowFilter
-
pyexcel.filters.RowIndexFilter
-
pyexcel.filters.SingleColumnFilter
-
pyexcel.filters.RowValueFilter
-
pyexcel.filters.NamedRowValueFilter
-
pyexcel.filters.ColumnValueFilter
-
pyexcel.filters.NamedColumnValueFilter
-
pyexcel.filters.SingleRowFilter
-
-
the following functions have been removed
-
add_formatter
-
remove_formatter
-
clear_formatters
-
freeze_formatters
-
add_filter
-
remove_filter
-
clear_filters
-
freeze_formatters
-
-
pyexcel.Sheet.filter has been re-implemented and all filters were removed:
-
pyexcel.formatters.SheetFormatter
-
0.2.5 — 31.08.2016
Updated:
-
#58: texttable should have
been made as compulsory requirement
0.2.4 — 14.07.2016
Updated:
-
For python 2, writing to sys.stdout by pyexcel-cli raise IOError.
0.2.3 — 11.07.2016
Updated:
-
For python 3, do not seek 0 when saving to memory if sys.stdout is passed on.
Hence, adding support for sys.stdin and sys.stdout.
0.2.2 — 01.06.2016
Updated:
-
Explicit imports, no longer needed
-
Depends on latest setuptools 18.0.1
-
NotImplementedError will be raised if parameters to core functions are not
supported, e.g. get_sheet(cannot_find_me_option=”will be thrown out as
NotImplementedError”)
0.2.1 — 23.04.2016
Added:
-
add pyexcel-text file types as attributes of pyexcel.Sheet and pyexcel.Book,
related to #31 -
auto import pyexcel-text if it is pip installed
Updated:
-
code refactoring done for easy addition of sources.
-
bug fix #29, Even if the
format is a string it is displayed as a float -
pyexcel-text is no longer a plugin to pyexcel-io but to pyexcel.sources, see
pyexcel-text#22
Removed:
-
pyexcel.presentation is removed. No longer the internal decorate @outsource
is used. related to #31
0.2.0 — 17.01.2016
Updated
-
adopt pyexcel-io yield key word to return generator as content
-
pyexcel.save_as and pyexcel.save_book_as get performance improvements
0.1.7 — 03.07.2015
Added
-
Support pyramid-excel which does the database commit on its own.
0.1.6 — 13.06.2015
Added
-
get excel data from a http url
0.0.13 — 07.02.2015
Added
-
Support django
-
texttable as default renderer
0.0.12 — 25.01.2015
Added
-
Added sqlalchemy support
0.0.10 — 15.12.2015
Added
-
added csvz and tsvz format
0.0.4 — 12.10.2014
Updated
-
Support python 3
0.0.1 — 14.09.2014
Features:
-
read and write csv, ods, xls, xlsx and xlsm files(which are referred later as
excel files) -
various iterators for the reader
-
row and column filters for the reader
-
utilities to get array and dictionary out from excel files.
-
cookbok receipes for some common and simple usage of this library.
Microsoft Excel is one of the most powerful spreadsheet software applications in the world, and it has become critical in all business processes. Companies across the world, both big and small, are using Microsoft Excel to store, organize, analyze, and visualize data.
As a data professional, when you combine Python with Excel, you create a unique data analysis bundle that unlocks the value of the enterprise data.
In this tutorial, we’re going to learn how to read and work with Excel files in Python.
After you finish this tutorial, you’ll understand the following:
- Loading Excel spreadsheets into pandas DataFrames
- Working with an Excel workbook with multiple spreadsheets
- Combining multiple spreadsheets
- Reading Excel files using the
xlrdpackage
In this tutorial, we assume you know the fundamentals of pandas DataFrames. If you aren’t familiar with the pandas library, you might like to try our Pandas and NumPy Fundamentals – Dataquest.
Let’s dive in.
Reading Spreadsheets with Pandas
Technically, multiple packages allow us to work with Excel files in Python. However, in this tutorial, we’ll use pandas and xlrd libraries to interact with Excel workbooks. Essentially, you can think of a pandas DataFrame as a spreadsheet with rows and columns stored in Series objects. Traversability of Series as iterable objects allows us to grab specific data easily. Once we load an Excel workbook into a pandas DataFrame, we can perform any kind of data analysis on the data.
Before we proceed to the next step, let’s first download the following spreadsheet:
Sales Data Excel Workbook — xlsx ver.
The Excel workbook consists of two sheets that contain stationery sales data for 2020 and 2021.
NOTE
Although Excel spreadsheets can contain formula and also support formatting, pandas only imports Excel spreadsheets as flat files, and it doesn’t support spreadsheet formatting.
To import the Excel spreadsheet into a pandas DataFrame, first, we need to import the pandas package and then use the read_excel() method:
import pandas as pd
df = pd.read_excel('sales_data.xlsx')

display(df)| OrderDate | Region | Rep | Item | Units | Unit Cost | Total | Shipped | |
|---|---|---|---|---|---|---|---|---|
| 0 | 2020-01-06 | East | Jones | Pencil | 95 | 1.99 | 189.05 | True |
| 1 | 2020-02-09 | Central | Jardine | Pencil | 36 | 4.99 | 179.64 | True |
| 2 | 2020-03-15 | West | Sorvino | Pencil | 56 | 2.99 | 167.44 | True |
| 3 | 2020-04-01 | East | Jones | Binder | 60 | 4.99 | 299.40 | False |
| 4 | 2020-05-05 | Central | Jardine | Pencil | 90 | 4.99 | 449.10 | True |
| 5 | 2020-06-08 | East | Jones | Binder | 60 | 8.99 | 539.40 | True |
| 6 | 2020-07-12 | East | Howard | Binder | 29 | 1.99 | 57.71 | False |
| 7 | 2020-08-15 | East | Jones | Pencil | 35 | 4.99 | 174.65 | True |
| 8 | 2020-09-01 | Central | Smith | Desk | 32 | 125.00 | 250.00 | True |
| 9 | 2020-10-05 | Central | Morgan | Binder | 28 | 8.99 | 251.72 | True |
| 10 | 2020-11-08 | East | Mike | Pen | 15 | 19.99 | 299.85 | False |
| 11 | 2020-12-12 | Central | Smith | Pencil | 67 | 1.29 | 86.43 | False |
If you want to load only a limited number of rows into the DataFrame, you can specify the number of rows using the nrows argument:
df = pd.read_excel('sales_data.xlsx', nrows=5)
display(df)| OrderDate | Region | Rep | Item | Units | Unit Cost | Total | Shipped | |
|---|---|---|---|---|---|---|---|---|
| 0 | 2020-01-06 | East | Jones | Pencil | 95 | 1.99 | 189.05 | True |
| 1 | 2020-02-09 | Central | Jardine | Pencil | 36 | 4.99 | 179.64 | True |
| 2 | 2020-03-15 | West | Sorvino | Pencil | 56 | 2.99 | 167.44 | True |
| 3 | 2020-04-01 | East | Jones | Binder | 60 | 4.99 | 299.40 | False |
| 4 | 2020-05-05 | Central | Jardine | Pencil | 90 | 4.99 | 449.10 | True |
Skipping a specific number of rows from the begining of a spreadsheet or skipping over a list of particular rows is available through the skiprows argument, as follows:
df = pd.read_excel('sales_data.xlsx', skiprows=range(5))
display(df)| 2020-05-05 00:00:00 | Central | Jardine | Pencil | 90 | 4.99 | 449.1 | True | |
|---|---|---|---|---|---|---|---|---|
| 0 | 2020-06-08 | East | Jones | Binder | 60 | 8.99 | 539.40 | True |
| 1 | 2020-07-12 | East | Howard | Binder | 29 | 1.99 | 57.71 | False |
| 2 | 2020-08-15 | East | Jones | Pencil | 35 | 4.99 | 174.65 | True |
| 3 | 2020-09-01 | Central | Smith | Desk | 32 | 125.00 | 250.00 | True |
| 4 | 2020-10-05 | Central | Morgan | Binder | 28 | 8.99 | 251.72 | True |
| 5 | 2020-11-08 | East | Mike | Pen | 15 | 19.99 | 299.85 | False |
| 6 | 2020-12-12 | Central | Smith | Pencil | 67 | 1.29 | 86.43 | False |
The code above skips the first five rows and returns the rest of the data. Instead, the following code returns all the rows except for those with the mentioned indices:
df = pd.read_excel('sales_data.xlsx', skiprows=[1, 4,7,10])
display(df)| OrderDate | Region | Rep | Item | Units | Unit Cost | Total | Shipped | |
|---|---|---|---|---|---|---|---|---|
| 0 | 2020-02-09 | Central | Jardine | Pencil | 36 | 4.99 | 179.64 | True |
| 1 | 2020-03-15 | West | Sorvino | Pencil | 56 | 2.99 | 167.44 | True |
| 2 | 2020-05-05 | Central | Jardine | Pencil | 90 | 4.99 | 449.10 | True |
| 3 | 2020-06-08 | East | Jones | Binder | 60 | 8.99 | 539.40 | True |
| 4 | 2020-08-15 | East | Jones | Pencil | 35 | 4.99 | 174.65 | True |
| 5 | 2020-09-01 | Central | Smith | Desk | 32 | 125.00 | 250.00 | True |
| 6 | 2020-11-08 | East | Mike | Pen | 15 | 19.99 | 299.85 | False |
| 7 | 2020-12-12 | Central | Smith | Pencil | 67 | 1.29 | 86.43 | False |
Another useful argument is usecols, which allows us to select spreadsheet columns with their letters, names, or positional numbers. Let’s see how it works:
df = pd.read_excel('sales_data.xlsx', usecols='A:C,G')
display(df)| OrderDate | Region | Rep | Total | |
|---|---|---|---|---|
| 0 | 2020-01-06 | East | Jones | 189.05 |
| 1 | 2020-02-09 | Central | Jardine | 179.64 |
| 2 | 2020-03-15 | West | Sorvino | 167.44 |
| 3 | 2020-04-01 | East | Jones | 299.40 |
| 4 | 2020-05-05 | Central | Jardine | 449.10 |
| 5 | 2020-06-08 | East | Jones | 539.40 |
| 6 | 2020-07-12 | East | Howard | 57.71 |
| 7 | 2020-08-15 | East | Jones | 174.65 |
| 8 | 2020-09-01 | Central | Smith | 250.00 |
| 9 | 2020-10-05 | Central | Morgan | 251.72 |
| 10 | 2020-11-08 | East | Mike | 299.85 |
| 11 | 2020-12-12 | Central | Smith | 86.43 |
In the code above, the string assigned to the usecols argument contains a range of columns with : plus column G separated by a comma. Also, we’re able to provide a list of column names and assign it to the usecols argument, as follows:
df = pd.read_excel('sales_data.xlsx', usecols=['OrderDate', 'Region', 'Rep', 'Total'])
display(df)| OrderDate | Region | Rep | Total | |
|---|---|---|---|---|
| 0 | 2020-01-06 | East | Jones | 189.05 |
| 1 | 2020-02-09 | Central | Jardine | 179.64 |
| 2 | 2020-03-15 | West | Sorvino | 167.44 |
| 3 | 2020-04-01 | East | Jones | 299.40 |
| 4 | 2020-05-05 | Central | Jardine | 449.10 |
| 5 | 2020-06-08 | East | Jones | 539.40 |
| 6 | 2020-07-12 | East | Howard | 57.71 |
| 7 | 2020-08-15 | East | Jones | 174.65 |
| 8 | 2020-09-01 | Central | Smith | 250.00 |
| 9 | 2020-10-05 | Central | Morgan | 251.72 |
| 10 | 2020-11-08 | East | Mike | 299.85 |
| 11 | 2020-12-12 | Central | Smith | 86.43 |
The usecols argument accepts a list of column numbers, too. The following code shows how we can pick up specific columns using their indices:
df = pd.read_excel('sales_data.xlsx', usecols=[0, 1, 2, 6])
display(df)| OrderDate | Region | Rep | Total | |
|---|---|---|---|---|
| 0 | 2020-01-06 | East | Jones | 189.05 |
| 1 | 2020-02-09 | Central | Jardine | 179.64 |
| 2 | 2020-03-15 | West | Sorvino | 167.44 |
| 3 | 2020-04-01 | East | Jones | 299.40 |
| 4 | 2020-05-05 | Central | Jardine | 449.10 |
| 5 | 2020-06-08 | East | Jones | 539.40 |
| 6 | 2020-07-12 | East | Howard | 57.71 |
| 7 | 2020-08-15 | East | Jones | 174.65 |
| 8 | 2020-09-01 | Central | Smith | 250.00 |
| 9 | 2020-10-05 | Central | Morgan | 251.72 |
| 10 | 2020-11-08 | East | Mike | 299.85 |
| 11 | 2020-12-12 | Central | Smith | 86.43 |
Working with Multiple Spreadsheets
Excel files or workbooks usually contain more than one spreadsheet. The pandas library allows us to load data from a specific sheet or combine multiple spreadsheets into a single DataFrame. In this section, we’ll explore how to use these valuable capabilities.
By default, the read_excel() method reads the first Excel sheet with the index 0. However, we can choose the other sheets by assigning a particular sheet name, sheet index, or even a list of sheet names or indices to the sheet_name argument. Let’s try it:
df = pd.read_excel('sales_data.xlsx', sheet_name='2021')
display(df)| OrderDate | Region | Rep | Item | Units | Unit Cost | Total | Shipped | |
|---|---|---|---|---|---|---|---|---|
| 0 | 2021-01-15 | Central | Gill | Binder | 46 | 8.99 | 413.54 | True |
| 1 | 2021-02-01 | Central | Smith | Binder | 87 | 15.00 | 1305.00 | True |
| 2 | 2021-03-07 | West | Sorvino | Binder | 27 | 19.99 | 139.93 | True |
| 3 | 2021-04-10 | Central | Andrews | Pencil | 66 | 1.99 | 131.34 | False |
| 4 | 2021-05-14 | Central | Gill | Pencil | 53 | 1.29 | 68.37 | False |
| 5 | 2021-06-17 | Central | Tom | Desk | 15 | 125.00 | 625.00 | True |
| 6 | 2021-07-04 | East | Jones | Pen Set | 62 | 4.99 | 309.38 | True |
| 7 | 2021-08-07 | Central | Tom | Pen Set | 42 | 23.95 | 1005.90 | True |
| 8 | 2021-09-10 | Central | Gill | Pencil | 47 | 1.29 | 9.03 | True |
| 9 | 2021-10-14 | West | Thompson | Binder | 57 | 19.99 | 1139.43 | False |
| 10 | 2021-11-17 | Central | Jardine | Binder | 11 | 4.99 | 54.89 | False |
| 11 | 2021-12-04 | Central | Jardine | Binder | 94 | 19.99 | 1879.06 | False |
The code above reads the second spreadsheet in the workbook, whose name is 2021. As mentioned before, we also can assign a sheet position number (zero-indexed) to the sheet_name argument. Let’s see how it works:
df = pd.read_excel('sales_data.xlsx', sheet_name=1)
display(df)| OrderDate | Region | Rep | Item | Units | Unit Cost | Total | Shipped | |
|---|---|---|---|---|---|---|---|---|
| 0 | 2021-01-15 | Central | Gill | Binder | 46 | 8.99 | 413.54 | True |
| 1 | 2021-02-01 | Central | Smith | Binder | 87 | 15.00 | 1305.00 | True |
| 2 | 2021-03-07 | West | Sorvino | Binder | 27 | 19.99 | 139.93 | True |
| 3 | 2021-04-10 | Central | Andrews | Pencil | 66 | 1.99 | 131.34 | False |
| 4 | 2021-05-14 | Central | Gill | Pencil | 53 | 1.29 | 68.37 | False |
| 5 | 2021-06-17 | Central | Tom | Desk | 15 | 125.00 | 625.00 | True |
| 6 | 2021-07-04 | East | Jones | Pen Set | 62 | 4.99 | 309.38 | True |
| 7 | 2021-08-07 | Central | Tom | Pen Set | 42 | 23.95 | 1005.90 | True |
| 8 | 2021-09-10 | Central | Gill | Pencil | 47 | 1.29 | 9.03 | True |
| 9 | 2021-10-14 | West | Thompson | Binder | 57 | 19.99 | 1139.43 | False |
| 10 | 2021-11-17 | Central | Jardine | Binder | 11 | 4.99 | 54.89 | False |
| 11 | 2021-12-04 | Central | Jardine | Binder | 94 | 19.99 | 1879.06 | False |
As you can see, both statements take in either the actual sheet name or sheet index to return the same result.
Sometimes, we want to import all the spreadsheets stored in an Excel file into pandas DataFrames simultaneously. The good news is that the read_excel() method provides this feature for us. In order to do this, we can assign a list of sheet names or their indices to the sheet_name argument. But there is a much easier way to do the same: to assign None to the sheet_name argument. Let’s try it:
all_sheets = pd.read_excel('sales_data.xlsx', sheet_name=None)Before exploring the data stored in the all_sheets variable, let’s check its data type:
type(all_sheets)dictAs you can see, the variable is a dictionary. Now, let’s reveal what is stored in this dictionary:
for key, value in all_sheets.items():
    print(key, type(value))
2020 <class 'pandas.core.frame.DataFrame'>
2021 <class 'pandas.core.frame.DataFrame'>The code above shows that the dictionary’s keys are the Excel workbook sheet names, and its values are pandas DataFrames for each spreadsheet. To print out the content of the dictionary, we can use the following code:
for key, value in all_sheets.items():
    print(key)
display(value)2020| OrderDate | Region | Rep | Item | Units | Unit Cost | Total | Shipped | |
|---|---|---|---|---|---|---|---|---|
| 0 | 2020-01-06 | East | Jones | Pencil | 95 | 1.99 | 189.05 | True |
| 1 | 2020-02-09 | Central | Jardine | Pencil | 36 | 4.99 | 179.64 | True |
| 2 | 2020-03-15 | West | Sorvino | Pencil | 56 | 2.99 | 167.44 | True |
| 3 | 2020-04-01 | East | Jones | Binder | 60 | 4.99 | 299.40 | False |
| 4 | 2020-05-05 | Central | Jardine | Pencil | 90 | 4.99 | 449.10 | True |
| 5 | 2020-06-08 | East | Jones | Binder | 60 | 8.99 | 539.40 | True |
| 6 | 2020-07-12 | East | Howard | Binder | 29 | 1.99 | 57.71 | False |
| 7 | 2020-08-15 | East | Jones | Pencil | 35 | 4.99 | 174.65 | True |
| 8 | 2020-09-01 | Central | Smith | Desk | 32 | 125.00 | 250.00 | True |
| 9 | 2020-10-05 | Central | Morgan | Binder | 28 | 8.99 | 251.72 | True |
| 10 | 2020-11-08 | East | Mike | Pen | 15 | 19.99 | 299.85 | False |
| 11 | 2020-12-12 | Central | Smith | Pencil | 67 | 1.29 | 86.43 | False |
2021| OrderDate | Region | Rep | Item | Units | Unit Cost | Total | Shipped | |
|---|---|---|---|---|---|---|---|---|
| 0 | 2021-01-15 | Central | Gill | Binder | 46 | 8.99 | 413.54 | True |
| 1 | 2021-02-01 | Central | Smith | Binder | 87 | 15.00 | 1305.00 | True |
| 2 | 2021-03-07 | West | Sorvino | Binder | 27 | 19.99 | 139.93 | True |
| 3 | 2021-04-10 | Central | Andrews | Pencil | 66 | 1.99 | 131.34 | False |
| 4 | 2021-05-14 | Central | Gill | Pencil | 53 | 1.29 | 68.37 | False |
| 5 | 2021-06-17 | Central | Tom | Desk | 15 | 125.00 | 625.00 | True |
| 6 | 2021-07-04 | East | Jones | Pen Set | 62 | 4.99 | 309.38 | True |
| 7 | 2021-08-07 | Central | Tom | Pen Set | 42 | 23.95 | 1005.90 | True |
| 8 | 2021-09-10 | Central | Gill | Pencil | 47 | 1.29 | 9.03 | True |
| 9 | 2021-10-14 | West | Thompson | Binder | 57 | 19.99 | 1139.43 | False |
| 10 | 2021-11-17 | Central | Jardine | Binder | 11 | 4.99 | 54.89 | False |
| 11 | 2021-12-04 | Central | Jardine | Binder | 94 | 19.99 | 1879.06 | False |
Combining Multiple Excel Spreadsheets into a Single Pandas DataFrame
Having one DataFrame per sheet allows us to have different columns or content in different sheets.
But what if we prefer to store all the spreadsheets’ data in a single DataFrame? In this tutorial, the workbook spreadsheets have the same columns, so we can combine them with the concat() method of pandas.
If you run the code below, you’ll see that the two DataFrames stored in the dictionary are concatenated:
combined_df = pd.concat(all_sheets.values(), ignore_index=True)
display(combined_df)| OrderDate | Region | Rep | Item | Units | Unit Cost | Total | Shipped | |
|---|---|---|---|---|---|---|---|---|
| 0 | 2020-01-06 | East | Jones | Pencil | 95 | 1.99 | 189.05 | True |
| 1 | 2020-02-09 | Central | Jardine | Pencil | 36 | 4.99 | 179.64 | True |
| 2 | 2020-03-15 | West | Sorvino | Pencil | 56 | 2.99 | 167.44 | True |
| 3 | 2020-04-01 | East | Jones | Binder | 60 | 4.99 | 299.40 | False |
| 4 | 2020-05-05 | Central | Jardine | Pencil | 90 | 4.99 | 449.10 | True |
| 5 | 2020-06-08 | East | Jones | Binder | 60 | 8.99 | 539.40 | True |
| 6 | 2020-07-12 | East | Howard | Binder | 29 | 1.99 | 57.71 | False |
| 7 | 2020-08-15 | East | Jones | Pencil | 35 | 4.99 | 174.65 | True |
| 8 | 2020-09-01 | Central | Smith | Desk | 32 | 125.00 | 250.00 | True |
| 9 | 2020-10-05 | Central | Morgan | Binder | 28 | 8.99 | 251.72 | True |
| 10 | 2020-11-08 | East | Mike | Pen | 15 | 19.99 | 299.85 | False |
| 11 | 2020-12-12 | Central | Smith | Pencil | 67 | 1.29 | 86.43 | False |
| 12 | 2021-01-15 | Central | Gill | Binder | 46 | 8.99 | 413.54 | True |
| 13 | 2021-02-01 | Central | Smith | Binder | 87 | 15.00 | 1305.00 | True |
| 14 | 2021-03-07 | West | Sorvino | Binder | 27 | 19.99 | 139.93 | True |
| 15 | 2021-04-10 | Central | Andrews | Pencil | 66 | 1.99 | 131.34 | False |
| 16 | 2021-05-14 | Central | Gill | Pencil | 53 | 1.29 | 68.37 | False |
| 17 | 2021-06-17 | Central | Tom | Desk | 15 | 125.00 | 625.00 | True |
| 18 | 2021-07-04 | East | Jones | Pen Set | 62 | 4.99 | 309.38 | True |
| 19 | 2021-08-07 | Central | Tom | Pen Set | 42 | 23.95 | 1005.90 | True |
| 20 | 2021-09-10 | Central | Gill | Pencil | 47 | 1.29 | 9.03 | True |
| 21 | 2021-10-14 | West | Thompson | Binder | 57 | 19.99 | 1139.43 | False |
| 22 | 2021-11-17 | Central | Jardine | Binder | 11 | 4.99 | 54.89 | False |
| 23 | 2021-12-04 | Central | Jardine | Binder | 94 | 19.99 | 1879.06 | False |
Now the data stored in the combined_df DataFrame is ready for further processing or visualization. In the following piece of code, we’re going to create a simple bar chart that shows the total sales amount made by each representative. Let’s run it and see the output plot:
total_sales_amount = combined_df.groupby('Rep').Total.sum()
total_sales_amount.plot.bar(figsize=(10, 6))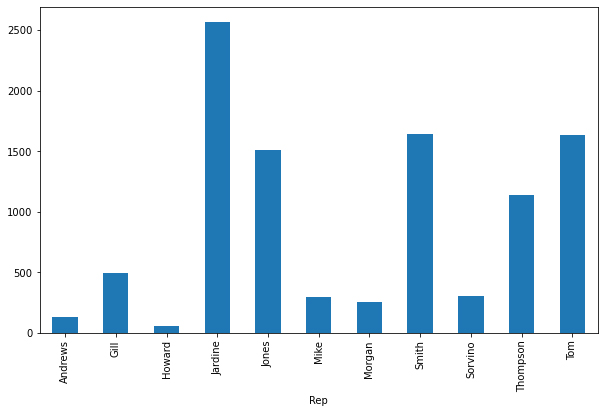
Reading Excel Files Using xlrd
Although importing data into a pandas DataFrame is much more common, another helpful package for reading Excel files in Python is xlrd. In this section, we’re going to scratch the surface of how to read Excel spreadsheets using this package.
NOTE
The xlrd package doesn’t support xlsx files due to a potential security vulnerability. So, we use the xls version of the sales data. You can download the xls version from the link below:
Sales Data Excel Workbook — xls ver.
Let’s see how it works:
import xlrd
excel_workbook = xlrd.open_workbook('sales_data.xls')
Above, the first line imports the xlrd package, then the open_workbook method reads the sales_data.xls file.
We can also open an individual sheet containing the actual data. There are two ways to do so: opening a sheet by index or by name. Let’s open the first sheet by index and the second one by name:
excel_worksheet_2020 = excel_workbook.sheet_by_index(0)
excel_worksheet_2021 = excel_workbook.sheet_by_name('2021')
Now, let’s see how we can print a cell value. The xlrd package provides a method called cell_value() that takes in two arguments: the cell’s row index and column index. Let’s explore it:
print(excel_worksheet_2020.cell_value(1, 3))PencilWe can see that the cell_value function returned the value of the cell at row index 1 (the 2nd row) and column index 3 (the 4th column).
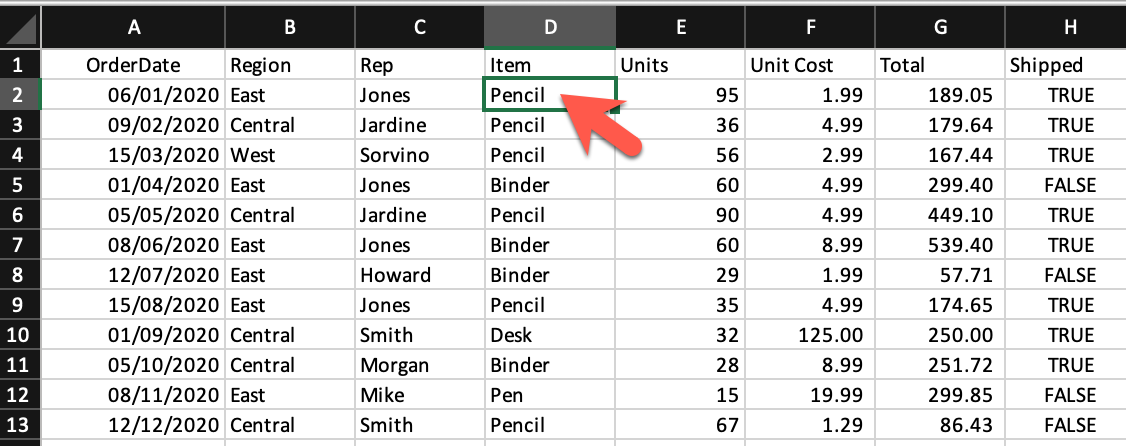
The xlrd package provides two helpful properties: nrows and ncols, returning the number of nonempty spreadsheet’s rows and columns respectively:
print('Columns#:', excel_worksheet_2020.ncols)
print('Rows#:', excel_worksheet_2020.nrows)
Columns#: 8
Rows#: 13Knowing the number of nonempty rows and columns in a spreadsheet helps us with iterating over the data using nested for loops. This makes all the Excel sheet data accessible via the cell_value() method.
Conclusion
This tutorial discussed how to load Excel spreadsheets into pandas DataFrames, work with multiple Excel sheets, and combine them into a single pandas DataFrame. We also explored the main aspects of the xlrd package as one of the simplest tools for accessing the Excel spreadsheets data.
pyexcel — Let you focus on data, instead of file formats

![]()
![]()
Support the project
If your company has embedded pyexcel and its components into a revenue generating
product, please support me on github, patreon
or bounty source to maintain
the project and develop it further.
If you are an individual, you are welcome to support me too and for however long
you feel like. As my backer, you will receive
early access to pyexcel related contents.
And your issues will get prioritized if you would like to become my patreon as pyexcel pro user.
With your financial support, I will be able to invest
a little bit more time in coding, documentation and writing interesting posts.
Known constraints
Fonts, colors and charts are not supported.
Nor to read password protected xls, xlsx and ods files.
Introduction
Feature Highlights
A list of supported file formats
| file format | definition |
|---|---|
| csv | comma separated values |
| tsv | tab separated values |
| csvz | a zip file that contains one or many csv files |
| tsvz | a zip file that contains one or many tsv files |
| xls | a spreadsheet file format created by MS-Excel 97-2003 |
| xlsx | MS-Excel Extensions to the Office Open XML SpreadsheetML File Format. |
| xlsm | an MS-Excel Macro-Enabled Workbook file |
| ods | open document spreadsheet |
| fods | flat open document spreadsheet |
| json | java script object notation |
| html | html table of the data structure |
| simple | simple presentation |
| rst | rStructured Text presentation of the data |
| mediawiki | media wiki table |

- One application programming interface(API) to handle multiple data sources:
- physical file
- memory file
- SQLAlchemy table
- Django Model
- Python data structures: dictionary, records and array
- One API to read and write data in various excel file formats.
- For large data sets, data streaming are supported. A genenerator can be returned to you. Checkout iget_records, iget_array, isave_as and isave_book_as.
Installation
You can install pyexcel via pip:
or clone it and install it:
$ git clone https://github.com/pyexcel/pyexcel.git
$ cd pyexcel
$ python setup.py install
One liners
This section shows you how to get data from your excel files and how to
export data to excel files in one line
Read from the excel files
Get a list of dictionaries
Suppose you want to process History of Classical Music:
History of Classical Music:
| Name | Period | Representative Composers |
| Medieval | c.1150-c.1400 | Machaut, Landini |
| Renaissance | c.1400-c.1600 | Gibbons, Frescobaldi |
| Baroque | c.1600-c.1750 | JS Bach, Vivaldi |
| Classical | c.1750-c.1830 | Joseph Haydn, Wolfgan Amadeus Mozart |
| Early Romantic | c.1830-c.1860 | Chopin, Mendelssohn, Schumann, Liszt |
| Late Romantic | c.1860-c.1920 | Wagner,Verdi |
| Modernist | 20th century | Sergei Rachmaninoff,Calude Debussy |
Let’s get a list of dictionary out from the xls file:
>>> records = p.get_records(file_name="your_file.xls")
And let’s check what do we have:
>>> for row in records:
...     print(f"{row['Representative Composers']} are from {row['Name']} period ({row['Period']})")
Machaut, Landini are from Medieval period (c.1150-c.1400)
Gibbons, Frescobaldi are from Renaissance period (c.1400-c.1600)
JS Bach, Vivaldi are from Baroque period (c.1600-c.1750)
Joseph Haydn, Wolfgan Amadeus Mozart are from Classical period (c.1750-c.1830)
Chopin, Mendelssohn, Schumann, Liszt are from Early Romantic period (c.1830-c.1860)
Wagner,Verdi are from Late Romantic period (c.1860-c.1920)
Sergei Rachmaninoff,Calude Debussy are from Modernist period (20th century)
Get two dimensional array
Instead, what if you have to use pyexcel.get_array to do the same:
>>> for row in p.get_array(file_name="your_file.xls", start_row=1):
...     print(f"{row[2]} are from {row[0]} period ({row[1]})")
Machaut, Landini are from Medieval period (c.1150-c.1400)
Gibbons, Frescobaldi are from Renaissance period (c.1400-c.1600)
JS Bach, Vivaldi are from Baroque period (c.1600-c.1750)
Joseph Haydn, Wolfgan Amadeus Mozart are from Classical period (c.1750-c.1830)
Chopin, Mendelssohn, Schumann, Liszt are from Early Romantic period (c.1830-c.1860)
Wagner,Verdi are from Late Romantic period (c.1860-c.1920)
Sergei Rachmaninoff,Calude Debussy are from Modernist period (20th century)
where start_row skips the header row.
Get a dictionary
You can get a dictionary too:
>>> my_dict = p.get_dict(file_name="your_file.xls", name_columns_by_row=0)
And let’s have a look inside:
>>> from pyexcel._compact import OrderedDict
>>> isinstance(my_dict, OrderedDict)
True
>>> for key, values in my_dict.items():
...     print(key + " : " + ','.join([str(item) for item in values]))
Name : Medieval,Renaissance,Baroque,Classical,Early Romantic,Late Romantic,Modernist
Period : c.1150-c.1400,c.1400-c.1600,c.1600-c.1750,c.1750-c.1830,c.1830-c.1860,c.1860-c.1920,20th century
Representative Composers : Machaut, Landini,Gibbons, Frescobaldi,JS Bach, Vivaldi,Joseph Haydn, Wolfgan Amadeus Mozart,Chopin, Mendelssohn, Schumann, Liszt,Wagner,Verdi,Sergei Rachmaninoff,Calude Debussy
Please note that my_dict is an OrderedDict.
Get a dictionary of two dimensional array
Suppose you have a multiple sheet book as the following:
Top Violinist:
| Name | Period | Nationality |
| Antonio Vivaldi | 1678-1741 | Italian |
| Niccolo Paganini | 1782-1840 | Italian |
| Pablo de Sarasate | 1852-1904 | Spainish |
| Eugene Ysaye | 1858-1931 | Belgian |
| Fritz Kreisler | 1875-1962 | Astria-American |
| Jascha Heifetz | 1901-1987 | Russian-American |
| David Oistrakh | 1908-1974 | Russian |
| Yehundi Menuhin | 1916-1999 | American |
| Itzhak Perlman | 1945- | Israeli-American |
| Hilary Hahn | 1979- | American |
Noteable Violin Makers:
| Maker | Period | Country |
| Antonio Stradivari | 1644-1737 | Cremona, Italy |
| Giovanni Paolo Maggini | 1580-1630 | Botticino, Italy |
| Amati Family | 1500-1740 | Cremona, Italy |
| Guarneri Family | 1626-1744 | Cremona, Italy |
| Rugeri Family | 1628-1719 | Cremona, Italy |
| Carlo Bergonzi | 1683-1747 | Cremona, Italy |
| Jacob Stainer | 1617-1683 | Austria |
Most Expensive Violins:
| Name | Estimated Value | Location |
| Messiah Stradivarious | $ 20,000,000 | Ashmolean Museum in Oxford, England |
| Vieuxtemps Guarneri | $ 16,000,000 | On loan to Anne Akiko Meyers |
| Lady Blunt | $ 15,900,000 | Anonymous bidder |
Here is the code to obtain those sheets as a single dictionary:
>>> book_dict = p.get_book_dict(file_name="book.xls")
And check:
>>> isinstance(book_dict, OrderedDict)
True
>>> import json
>>> for key, item in book_dict.items():
...     print(json.dumps({key: item}))
{"Most Expensive Violins": [["Name", "Estimated Value", "Location"], ["Messiah Stradivarious", "$ 20,000,000", "Ashmolean Museum in Oxford, England"], ["Vieuxtemps Guarneri", "$ 16,000,000", "On loan to Anne Akiko Meyers"], ["Lady Blunt", "$ 15,900,000", "Anonymous bidder"]]}
{"Noteable Violin Makers": [["Maker", "Period", "Country"], ["Antonio Stradivari", "1644-1737", "Cremona, Italy"], ["Giovanni Paolo Maggini", "1580-1630", "Botticino, Italy"], ["Amati Family", "1500-1740", "Cremona, Italy"], ["Guarneri Family", "1626-1744", "Cremona, Italy"], ["Rugeri Family", "1628-1719", "Cremona, Italy"], ["Carlo Bergonzi", "1683-1747", "Cremona, Italy"], ["Jacob Stainer", "1617-1683", "Austria"]]}
{"Top Violinist": [["Name", "Period", "Nationality"], ["Antonio Vivaldi", "1678-1741", "Italian"], ["Niccolo Paganini", "1782-1840", "Italian"], ["Pablo de Sarasate", "1852-1904", "Spainish"], ["Eugene Ysaye", "1858-1931", "Belgian"], ["Fritz Kreisler", "1875-1962", "Astria-American"], ["Jascha Heifetz", "1901-1987", "Russian-American"], ["David Oistrakh", "1908-1974", "Russian"], ["Yehundi Menuhin", "1916-1999", "American"], ["Itzhak Perlman", "1945-", "Israeli-American"], ["Hilary Hahn", "1979-", "American"]]}
Write data
Export an array
Suppose you have the following array:
>>> data = [['G', 'D', 'A', 'E'], ['Thomastik-Infield Domaints', 'Thomastik-Infield Domaints', 'Thomastik-Infield Domaints', 'Pirastro'], ['Silver wound', '', 'Aluminum wound', 'Gold Label Steel']]
And here is the code to save it as an excel file :
>>> p.save_as(array=data, dest_file_name="example.xls")
Let’s verify it:
>>> p.get_sheet(file_name="example.xls")
pyexcel_sheet1:
+----------------------------+----------------------------+----------------------------+------------------+
| G                          | D                          | A                          | E                |
+----------------------------+----------------------------+----------------------------+------------------+
| Thomastik-Infield Domaints | Thomastik-Infield Domaints | Thomastik-Infield Domaints | Pirastro         |
+----------------------------+----------------------------+----------------------------+------------------+
| Silver wound               |                            | Aluminum wound             | Gold Label Steel |
+----------------------------+----------------------------+----------------------------+------------------+
And here is the code to save it as a csv file :
>>> p.save_as(array=data,
...           dest_file_name="example.csv",
...           dest_delimiter=':')
Let’s verify it:
>>> with open("example.csv") as f:
...     for line in f.readlines():
...         print(line.rstrip())
...
G:D:A:E
Thomastik-Infield Domaints:Thomastik-Infield Domaints:Thomastik-Infield Domaints:Pirastro
Silver wound::Aluminum wound:Gold Label Steel
Export a list of dictionaries
>>> records = [
...     {"year": 1903, "country": "Germany", "speed": "206.7km/h"},
...     {"year": 1964, "country": "Japan", "speed": "210km/h"},
...     {"year": 2008, "country": "China", "speed": "350km/h"}
... ]
>>> p.save_as(records=records, dest_file_name='high_speed_rail.xls')
Export a dictionary of single key value pair
>>> henley_on_thames_facts = {
...     "area": "5.58 square meters",
...     "population": "11,619",
...     "civial parish": "Henley-on-Thames",
...     "latitude": "51.536",
...     "longitude": "-0.898"
... }
>>> p.save_as(adict=henley_on_thames_facts, dest_file_name='henley.xlsx')
Export a dictionary of single dimensonal array
>>> ccs_insights = {
...     "year": ["2017", "2018", "2019", "2020", "2021"],
...     "smart phones": [1.53, 1.64, 1.74, 1.82, 1.90],
...     "feature phones": [0.46, 0.38, 0.30, 0.23, 0.17]
... }
>>> p.save_as(adict=ccs_insights, dest_file_name='ccs.csv')
Export a dictionary of two dimensional array as a book
Suppose you want to save the below dictionary to an excel file :
>>> a_dictionary_of_two_dimensional_arrays = {
...      'Sheet 1':
...          [
...              [1.0, 2.0, 3.0],
...              [4.0, 5.0, 6.0],
...              [7.0, 8.0, 9.0]
...          ],
...      'Sheet 2':
...          [
...              ['X', 'Y', 'Z'],
...              [1.0, 2.0, 3.0],
...              [4.0, 5.0, 6.0]
...          ],
...      'Sheet 3':
...          [
...              ['O', 'P', 'Q'],
...              [3.0, 2.0, 1.0],
...              [4.0, 3.0, 2.0]
...          ]
...  }
Here is the code:
>>> p.save_book_as(
...    bookdict=a_dictionary_of_two_dimensional_arrays,
...    dest_file_name="book.xls"
... )
If you want to preserve the order of sheets in your dictionary, you have to
pass on an ordered dictionary to the function itself. For example:
>>> data = OrderedDict()
>>> data.update({"Sheet 2": a_dictionary_of_two_dimensional_arrays['Sheet 2']})
>>> data.update({"Sheet 1": a_dictionary_of_two_dimensional_arrays['Sheet 1']})
>>> data.update({"Sheet 3": a_dictionary_of_two_dimensional_arrays['Sheet 3']})
>>> p.save_book_as(bookdict=data, dest_file_name="book.xls")
Let’s verify its order:
>>> book_dict = p.get_book_dict(file_name="book.xls")
>>> for key, item in book_dict.items():
...     print(json.dumps({key: item}))
{"Sheet 2": [["X", "Y", "Z"], [1, 2, 3], [4, 5, 6]]}
{"Sheet 1": [[1, 2, 3], [4, 5, 6], [7, 8, 9]]}
{"Sheet 3": [["O", "P", "Q"], [3, 2, 1], [4, 3, 2]]}
Please notice that «Sheet 2» is the first item in the book_dict, meaning the order of sheets are preserved.
Transcoding
Note
Please note that pyexcel-cli can perform file transcoding at command line.
No need to open your editor, save the problem, then python run.
The following code does a simple file format transcoding from xls to csv:
>>> p.save_as(file_name="birth.xls", dest_file_name="birth.csv")
Again it is really simple. Let’s verify what we have gotten:
>>> sheet = p.get_sheet(file_name="birth.csv")
>>> sheet
birth.csv:
+-------+--------+----------+
| name  | weight | birth    |
+-------+--------+----------+
| Adam  | 3.4    | 03/02/15 |
+-------+--------+----------+
| Smith | 4.2    | 12/11/14 |
+-------+--------+----------+
Note
Please note that csv(comma separate value) file is pure text file. Formula, charts, images and formatting in xls file will disappear no matter which transcoding tool you use. Hence, pyexcel is a quick alternative for this transcoding job.
Let use previous example and save it as xlsx instead
>>> p.save_as(file_name="birth.xls",
...           dest_file_name="birth.xlsx") # change the file extension
Again let’s verify what we have gotten:
>>> sheet = p.get_sheet(file_name="birth.xlsx")
>>> sheet
pyexcel_sheet1:
+-------+--------+----------+
| name  | weight | birth    |
+-------+--------+----------+
| Adam  | 3.4    | 03/02/15 |
+-------+--------+----------+
| Smith | 4.2    | 12/11/14 |
+-------+--------+----------+
Excel book merge and split operation in one line
Merge all excel files in directory into a book where each file become a sheet
The following code will merge every excel files into one file, say «output.xls»:
from pyexcel.cookbook import merge_all_to_a_book
import glob


merge_all_to_a_book(glob.glob("your_csv_directory*.csv"), "output.xls")
You can mix and match with other excel formats: xls, xlsm and ods. For example, if you are sure you have only xls, xlsm, xlsx, ods and csv files in your_excel_file_directory, you can do the following:
from pyexcel.cookbook import merge_all_to_a_book
import glob


merge_all_to_a_book(glob.glob("your_excel_file_directory*.*"), "output.xls")
Split a book into single sheet files
Suppose you have many sheets in a work book and you would like to separate each into a single sheet excel file. You can easily do this:
>>> from pyexcel.cookbook import split_a_book
>>> split_a_book("megabook.xls", "output.xls")
>>> import glob
>>> outputfiles = glob.glob("*_output.xls")
>>> for file in sorted(outputfiles):
...     print(file)
...
Sheet 1_output.xls
Sheet 2_output.xls
Sheet 3_output.xls
for the output file, you can specify any of the supported formats
Extract just one sheet from a book
Suppose you just want to extract one sheet from many sheets that exists in a work book and you would like to separate it into a single sheet excel file. You can easily do this:
>>> from pyexcel.cookbook import extract_a_sheet_from_a_book
>>> extract_a_sheet_from_a_book("megabook.xls", "Sheet 1", "output.xls")
>>> if os.path.exists("Sheet 1_output.xls"):
...     print("Sheet 1_output.xls exists")
...
Sheet 1_output.xls exists
for the output file, you can specify any of the supported formats
Hidden feature: partial read
Most pyexcel users do not know, but other library users were requesting partial read
When you are dealing with huge amount of data, e.g. 64GB, obviously you would not
like to fill up your memory with those data. What you may want to do is, record
data from Nth line, take M records and stop. And you only want to use your memory
for the M records, not for beginning part nor for the tail part.
Hence partial read feature is developed to read partial data into memory for
processing.
You can paginate by row, by column and by both, hence you dictate what portion of the
data to read back. But remember only row limit features help you save memory. Let’s
you use this feature to record data from Nth column, take M number of columns and skip
the rest. You are not going to reduce your memory footprint.
Why did not I see above benefit?
This feature depends heavily on the implementation details.
pyexcel-xls (xlrd), pyexcel-xlsx (openpyxl), pyexcel-ods (odfpy) and
pyexcel-ods3 (pyexcel-ezodf) will read all data into memory. Because xls,
xlsx and ods file are effective a zipped folder, all four will unzip the folder
and read the content in xml format in full, so as to make sense of all details.
Hence, during the partial data is been returned, the memory consumption won’t
differ from reading the whole data back. Only after the partial
data is returned, the memory comsumption curve shall jump the cliff. So pagination
code here only limits the data returned to your program.
With that said, pyexcel-xlsxr, pyexcel-odsr and pyexcel-htmlr DOES read
partial data into memory. Those three are implemented in such a way that they
consume the xml(html) when needed. When they have read designated portion of the
data, they stop, even if they are half way through.
In addition, pyexcel’s csv readers can read partial data into memory too.
Let’s assume the following file is a huge csv file:
>>> import datetime
>>> import pyexcel as pe
>>> data = [
...     [1, 21, 31],
...     [2, 22, 32],
...     [3, 23, 33],
...     [4, 24, 34],
...     [5, 25, 35],
...     [6, 26, 36]
... ]
>>> pe.save_as(array=data, dest_file_name="your_file.csv")
And let’s pretend to read partial data:
>>> pe.get_sheet(file_name="your_file.csv", start_row=2, row_limit=3)
your_file.csv:
+---+----+----+
| 3 | 23 | 33 |
+---+----+----+
| 4 | 24 | 34 |
+---+----+----+
| 5 | 25 | 35 |
+---+----+----+
And you could as well do the same for columns:
>>> pe.get_sheet(file_name="your_file.csv", start_column=1, column_limit=2)
your_file.csv:
+----+----+
| 21 | 31 |
+----+----+
| 22 | 32 |
+----+----+
| 23 | 33 |
+----+----+
| 24 | 34 |
+----+----+
| 25 | 35 |
+----+----+
| 26 | 36 |
+----+----+
Obvious, you could do both at the same time:
>>> pe.get_sheet(file_name="your_file.csv",
...     start_row=2, row_limit=3,
...     start_column=1, column_limit=2)
your_file.csv:
+----+----+
| 23 | 33 |
+----+----+
| 24 | 34 |
+----+----+
| 25 | 35 |
+----+----+
The pagination support is available across all pyexcel plugins.
Note
No column pagination support for query sets as data source.
Formatting while transcoding a big data file
If you are transcoding a big data set, conventional formatting method would not
help unless a on-demand free RAM is available. However, there is a way to minimize
the memory footprint of pyexcel while the formatting is performed.
Let’s continue from previous example. Suppose we want to transcode «your_file.csv»
to «your_file.xls» but increase each element by 1.
What we can do is to define a row renderer function as the following:
>>> def increment_by_one(row):
...     for element in row:
...         yield element + 1
Then pass it onto save_as function using row_renderer:
>>> pe.isave_as(file_name="your_file.csv",
...             row_renderer=increment_by_one,
...             dest_file_name="your_file.xlsx")
Note
If the data content is from a generator, isave_as has to be used.
We can verify if it was done correctly:
>>> pe.get_sheet(file_name="your_file.xlsx")
your_file.csv:
+---+----+----+
| 2 | 22 | 32 |
+---+----+----+
| 3 | 23 | 33 |
+---+----+----+
| 4 | 24 | 34 |
+---+----+----+
| 5 | 25 | 35 |
+---+----+----+
| 6 | 26 | 36 |
+---+----+----+
| 7 | 27 | 37 |
+---+----+----+
Stream APIs for big file : A set of two liners
When you are dealing with BIG excel files, you will want pyexcel to use
constant memory.
This section shows you how to get data from your BIG excel files and how to
export data to excel files in two lines at most, without eating all
your computer memory.
Two liners for get data from big excel files
Get a list of dictionaries
Suppose you want to process the following coffee data again:
Top 5 coffeine drinks:
| Coffees | Serving Size | Caffeine (mg) |
| Starbucks Coffee Blonde Roast | venti(20 oz) | 475 |
| Dunkin’ Donuts Coffee with Turbo Shot | large(20 oz.) | 398 |
| Starbucks Coffee Pike Place Roast | grande(16 oz.) | 310 |
| Panera Coffee Light Roast | regular(16 oz.) | 300 |
Let’s get a list of dictionary out from the xls file:
>>> records = p.iget_records(file_name="your_file.xls")
And let’s check what do we have:
>>> for r in records:
...     print(f"{r['Serving Size']} of {r['Coffees']} has {r['Caffeine (mg)']} mg")
venti(20 oz) of Starbucks Coffee Blonde Roast has 475 mg
large(20 oz.) of Dunkin' Donuts Coffee with Turbo Shot has 398 mg
grande(16 oz.) of Starbucks Coffee Pike Place Roast has 310 mg
regular(16 oz.) of Panera Coffee Light Roast has 300 mg
Please do not forgot the second line to close the opened file handle:
Get two dimensional array
Instead, what if you have to use pyexcel.get_array to do the same:
>>> for row in p.iget_array(file_name="your_file.xls", start_row=1):
...     print(f"{row[1]} of {row[0]} has {row[2]} mg")
venti(20 oz) of Starbucks Coffee Blonde Roast has 475 mg
large(20 oz.) of Dunkin' Donuts Coffee with Turbo Shot has 398 mg
grande(16 oz.) of Starbucks Coffee Pike Place Roast has 310 mg
regular(16 oz.) of Panera Coffee Light Roast has 300 mg
Again, do not forgot the second line:
where start_row skips the header row.
Data export in one liners
Export an array
Suppose you have the following array:
>>> data = [[1, 2, 3], [4, 5, 6], [7, 8, 9]]
And here is the code to save it as an excel file :
>>> p.isave_as(array=data, dest_file_name="example.xls")
But the following line is not required because the data source
are not file sources:
Let’s verify it:
>>> p.get_sheet(file_name="example.xls")
pyexcel_sheet1:
+---+---+---+
| 1 | 2 | 3 |
+---+---+---+
| 4 | 5 | 6 |
+---+---+---+
| 7 | 8 | 9 |
+---+---+---+
And here is the code to save it as a csv file :
>>> p.isave_as(array=data,
...            dest_file_name="example.csv",
...            dest_delimiter=':')
Let’s verify it:
>>> with open("example.csv") as f:
...     for line in f.readlines():
...         print(line.rstrip())
...
1:2:3
4:5:6
7:8:9
Export a list of dictionaries
>>> records = [
...     {"year": 1903, "country": "Germany", "speed": "206.7km/h"},
...     {"year": 1964, "country": "Japan", "speed": "210km/h"},
...     {"year": 2008, "country": "China", "speed": "350km/h"}
... ]
>>> p.isave_as(records=records, dest_file_name='high_speed_rail.xls')
Export a dictionary of single key value pair
>>> henley_on_thames_facts = {
...     "area": "5.58 square meters",
...     "population": "11,619",
...     "civial parish": "Henley-on-Thames",
...     "latitude": "51.536",
...     "longitude": "-0.898"
... }
>>> p.isave_as(adict=henley_on_thames_facts, dest_file_name='henley.xlsx')
Export a dictionary of single dimensonal array
>>> ccs_insights = {
...     "year": ["2017", "2018", "2019", "2020", "2021"],
...     "smart phones": [1.53, 1.64, 1.74, 1.82, 1.90],
...     "feature phones": [0.46, 0.38, 0.30, 0.23, 0.17]
... }
>>> p.isave_as(adict=ccs_insights, dest_file_name='ccs.csv')
>>> p.free_resources()
Export a dictionary of two dimensional array as a book
Suppose you want to save the below dictionary to an excel file :
>>> a_dictionary_of_two_dimensional_arrays = {
...      'Sheet 1':
...          [
...              [1.0, 2.0, 3.0],
...              [4.0, 5.0, 6.0],
...              [7.0, 8.0, 9.0]
...          ],
...      'Sheet 2':
...          [
...              ['X', 'Y', 'Z'],
...              [1.0, 2.0, 3.0],
...              [4.0, 5.0, 6.0]
...          ],
...      'Sheet 3':
...          [
...              ['O', 'P', 'Q'],
...              [3.0, 2.0, 1.0],
...              [4.0, 3.0, 2.0]
...          ]
...  }
Here is the code:
>>> p.isave_book_as(
...    bookdict=a_dictionary_of_two_dimensional_arrays,
...    dest_file_name="book.xls"
... )
If you want to preserve the order of sheets in your dictionary, you have to
pass on an ordered dictionary to the function itself. For example:
>>> from pyexcel._compact import OrderedDict
>>> data = OrderedDict()
>>> data.update({"Sheet 2": a_dictionary_of_two_dimensional_arrays['Sheet 2']})
>>> data.update({"Sheet 1": a_dictionary_of_two_dimensional_arrays['Sheet 1']})
>>> data.update({"Sheet 3": a_dictionary_of_two_dimensional_arrays['Sheet 3']})
>>> p.isave_book_as(bookdict=data, dest_file_name="book.xls")
>>> p.free_resources()
Let’s verify its order:
>>> import json
>>> book_dict = p.get_book_dict(file_name="book.xls")
>>> for key, item in book_dict.items():
...     print(json.dumps({key: item}))
{"Sheet 2": [["X", "Y", "Z"], [1, 2, 3], [4, 5, 6]]}
{"Sheet 1": [[1, 2, 3], [4, 5, 6], [7, 8, 9]]}
{"Sheet 3": [["O", "P", "Q"], [3, 2, 1], [4, 3, 2]]}
Please notice that «Sheet 2» is the first item in the book_dict, meaning the order of sheets are preserved.
File format transcoding on one line
Note
Please note that the following file transcoding could be with zero line. Please
install pyexcel-cli and you will do the transcode in one command. No need to
open your editor, save the problem, then python run.
The following code does a simple file format transcoding from xls to csv:
>>> import pyexcel
>>> p.save_as(file_name="birth.xls", dest_file_name="birth.csv")
Again it is really simple. Let’s verify what we have gotten:
>>> sheet = p.get_sheet(file_name="birth.csv")
>>> sheet
birth.csv:
+-------+--------+----------+
| name  | weight | birth    |
+-------+--------+----------+
| Adam  | 3.4    | 03/02/15 |
+-------+--------+----------+
| Smith | 4.2    | 12/11/14 |
+-------+--------+----------+
Note
Please note that csv(comma separate value) file is pure text file. Formula, charts, images and formatting in xls file will disappear no matter which transcoding tool you use. Hence, pyexcel is a quick alternative for this transcoding job.
Let use previous example and save it as xlsx instead
>>> import pyexcel
>>> p.isave_as(file_name="birth.xls",
...            dest_file_name="birth.xlsx") # change the file extension
Again let’s verify what we have gotten:
>>> sheet = p.get_sheet(file_name="birth.xlsx")
>>> sheet
pyexcel_sheet1:
+-------+--------+----------+
| name  | weight | birth    |
+-------+--------+----------+
| Adam  | 3.4    | 03/02/15 |
+-------+--------+----------+
| Smith | 4.2    | 12/11/14 |
+-------+--------+----------+
Available Plugins
A list of file formats supported by external plugins
| Package name | Supported file formats | Dependencies |
|---|---|---|
| pyexcel-io | csv, csvz [1], tsv, tsvz [2] |
|
| pyexcel-xls | xls, xlsx(read only), xlsm(read only) |
xlrd, xlwt |
| pyexcel-xlsx | xlsx | openpyxl |
| pyexcel-ods3 | ods | pyexcel-ezodf, lxml |
| pyexcel-ods | ods | odfpy |
Dedicated file reader and writers
| Package name | Supported file formats | Dependencies |
|---|---|---|
| pyexcel-xlsxw | xlsx(write only) | XlsxWriter |
| pyexcel-libxlsxw | xlsx(write only) | libxlsxwriter |
| pyexcel-xlsxr | xlsx(read only) | lxml |
| pyexcel-xlsbr | xlsb(read only) | pyxlsb |
| pyexcel-odsr | read only for ods, fods | lxml |
| pyexcel-odsw | write only for ods | loxun |
| pyexcel-htmlr | html(read only) | lxml,html5lib |
| pyexcel-pdfr | pdf(read only) | camelot |
Plugin shopping guide
Since 2020, all pyexcel-io plugins have dropped the support for python versions
which are lower than 3.6. If you want to use any of those Python versions, please use pyexcel-io
and its plugins versions that are lower than 0.6.0.
Except csv files, xls, xlsx and ods files are a zip of a folder containing a lot of
xml files
The dedicated readers for excel files can stream read
In order to manage the list of plugins installed, you need to use pip to add or remove
a plugin. When you use virtualenv, you can have different plugins per virtual
environment. In the situation where you have multiple plugins that does the same thing
in your environment, you need to tell pyexcel which plugin to use per function call.
For example, pyexcel-ods and pyexcel-odsr, and you want to get_array to use pyexcel-odsr.
You need to append get_array(…, library=’pyexcel-odsr’).
Other data renderers
| Package name | Supported file formats | Dependencies | Python versions |
|---|---|---|---|
| pyexcel-text | write only:rst, mediawiki, html, latex, grid, pipe, orgtbl, plain simple read only: ndjson r/w: json |
tabulate | 2.6, 2.7, 3.3, 3.4 3.5, 3.6, pypy |
| pyexcel-handsontable | handsontable in html | handsontable | same as above |
| pyexcel-pygal | svg chart | pygal | 2.7, 3.3, 3.4, 3.5 3.6, pypy |
| pyexcel-sortable | sortable table in html | csvtotable | same as above |
| pyexcel-gantt | gantt chart in html | frappe-gantt | except pypy, same as above |
Footnotes
Acknowledgement
All great work have been done by odf, ezodf, xlrd, xlwt, tabulate and other
individual developers. This library unites only the data access code.
License
New BSD License
dcc.Download
With the dcc.Download component, you can allow users to directly download files from your app. These files include (but are not limited to) spreadsheets, images, text files, etc. dcc.Download opens a download dialog when the data property changes.
Note that the following examples make use of the prevent_initial_call attribute to prevent the callbacks from being triggered when the app inputs are initially rendered. See Advanced Callbacks for more details.
Examples
Find a few usage examples below.
For more examples of minimal Dash apps that use dcc.Download, go to the community-driven Example Index.
Downloading Content as Strings
Here is an example of downloading content as a string, while showing the raw JSON:
from dash import Dash, dcc, html, Input, Output

app = Dash(__name__)
app.layout = html.Div([
    html.Button("Download Text", id="btn-download-txt"),
    dcc.Download(id="download-text")
])


@app.callback(
    Output("download-text", "data"),
    Input("btn-download-txt", "n_clicks"),
    prevent_initial_call=True,
)
def func(n_clicks):
    return dict(content="Hello world!", filename="hello.txt")


if __name__ == "__main__":
    app.run_server(debug=True)
Downloading a Dataframe as a CSV file
For downloading dataframes, the many Pandas export methods are supported. Below we are downloading a dataframe as a CSV:
from dash import Dash, dcc, html, Input, Output
import pandas as pd

app = Dash(__name__)
app.layout = html.Div(
    [
        html.Button("Download CSV", id="btn_csv"),
        dcc.Download(id="download-dataframe-csv"),
    ]
)

df = pd.DataFrame({"a": [1, 2, 3, 4], "b": [2, 1, 5, 6], "c": ["x", "x", "y", "y"]})


@app.callback(
    Output("download-dataframe-csv", "data"),
    Input("btn_csv", "n_clicks"),
    prevent_initial_call=True,
)
def func(n_clicks):
    return dcc.send_data_frame(df.to_csv, "mydf.csv")


if __name__ == "__main__":
    app.run_server(debug=True)
Downloading a Dataframe as an Excel file
To download a dataframe as an Excel file with Pandas, add xlsxwriter or openpyxl as an app dependency:
from dash import Dash, dcc, html, Input, Output
import pandas as pd

app = Dash(__name__)
app.layout = html.Div([
    html.Button("Download Excel", id="btn_xlsx"),
    dcc.Download(id="download-dataframe-xlsx"),
])


df = pd.DataFrame({"a": [1, 2, 3, 4], "b": [2, 1, 5, 6], "c": ["x", "x", "y", "y"]})


@app.callback(
    Output("download-dataframe-xlsx", "data"),
    Input("btn_xlsx", "n_clicks"),
    prevent_initial_call=True,
)
def func(n_clicks):
    return dcc.send_data_frame(df.to_excel, "mydf.xlsx", sheet_name="Sheet_name_1")


if __name__ == "__main__":
    app.run_server(debug=True)
Downloading Images
To download a file from disk, use dcc.send_file, taking care to specify the file path.
from dash import Dash, dcc, html, Input, Output

app = Dash(__name__)
app.layout = html.Div([
    html.Button("Download Image", id="btn_image"),
    dcc.Download(id="download-image")
])


@app.callback(
    Output("download-image", "data"),
    Input("btn_image", "n_clicks"),
    prevent_initial_call=True,
)
def func(n_clicks):
    return dcc.send_file(
        "./dash_docs/assets/images/gallery/dash-community-components.png"
    )


if __name__ == "__main__":
    app.run_server(debug=True)
Download Properties
Access this documentation in your Python terminal with:
«`pythonhelp(dash.dcc.Download)
«`Our recommended IDE for writing Dash apps is Dash Enterprise’s
Data Science Workspaces,
which has typeahead support for Dash Component Properties.
Find out if your company is using
Dash Enterprise.
id (string; optional):
The ID of this component, used to identify dash components in
callbacks.
data (dict; optional):
On change, a download is invoked.
data is a dict with keys:
-
base64(boolean; optional):
Set to True, when data is base64 encoded. -
content(string; required):
File content. -
filename(string; required):
Suggested filename in the download dialogue. -
type(string; optional):
Blob type, usually a MIME-type.
base64 (boolean; default False):
Default value for base64, used when not set as part of the data
property.
type (string; default 'text/plain'):
Default value for type, used when not set as part of the data property.