
Why run a Python script through Excel? Why bother with the middleman when environments such as Spyder and Jupyter Notebook exists?
Something that I have been learning of late is the importance of diversifying methods of presenting one’s work in the spirit of open science, communicability and inclusion. In that line of thinking, running a Python script via an Excel ‘user interface’ addresses two issues:
- Excel VBA’s slower reading and writing of data
- The steep learning curve associated with learning how to code in Python
In short, executing Python via Excel provides those with sufficient experience in the language with an avenue to efficiently communicate and visualize their data in a way that most people can see and understand. This blog post will demonstrate this point by extracting the mean and standard deviation of the sepal length and width, as well as the petal length and width, of three different iris subspecies available from the famed Iris dataset, that can be found here.
Download the dataset, called ‘iris.data’ into a folder or location of your choice. Next, change the extension of the file to ‘.csv’. Let’s start processing this in Python!
1. Writing the Python script
Here, we will be writing a Python script to generate two files: the means (iris_means.csv) and standard deviations (iris_std.csv) of each iris subspecies’ attributes. We will first write the Python script to do so:
import pandas as pd

# the types of data within the iris dataset
col_names = ["sepal_length", "sepal_width", "petal_length", "petal_width", "subspecies"]

iris_data = pd.read_csv('C:/your-preferred-location/iris.csv',
                        sep=',', header=None, names=col_names, index_col=None)

#%%
iris_setosa = iris_data[iris_data['subspecies']=='Iris-setosa']
iris_setosa=iris_setosa.drop(['subspecies'], axis=1)

iris_versicolor = iris_data[iris_data['subspecies']=='Iris-versicolor']
iris_versicolor=iris_versicolor.drop(['subspecies'], axis=1)

iris_virginica = iris_data[iris_data['subspecies']=='Iris-virginica']
iris_virginica=iris_virginica.drop(['subspecies'], axis=1)

#%%
mean_setosa = iris_setosa.mean(axis=0)
std_setosa = iris_setosa.std(axis=0)

mean_versicolor = iris_versicolor.mean(axis=0)
std_versicolor = iris_versicolor.std(axis=0)

mean_virginica = iris_virginica.mean(axis=0)
std_virginica = iris_virginica.std(axis=0)

subspecies = ['Setosa', 'Versicolor', 'Virginica']

mean_vals = pd.concat([mean_setosa, mean_versicolor, mean_virginica], axis=1)
mean_vals.columns=subspecies

std_vals = pd.concat([std_setosa, std_versicolor, std_virginica], axis=1)
std_vals.columns=subspecies

mean_vals.to_csv('C:/Users/your-preferred-location/iris_means.csv',
                 sep=',', header=True, index=True)
std_vals.to_csv('C:/Users/your-preferred-location/iris_std.csv',
                sep=',', header=True, index=True)
2. Write the Excel VBA macro
We will first set up the Excel document that will execute the Excel macro. Create an Excel worksheet file. Mine is named ‘iris_GUI.xlsx’. Next, navigate to the ‘File’ tab and select ‘Options’. Go to ‘Customize Ribbon’ and make sure that ‘Developer’ is checked:

Click ‘OK’. The developer tab should now be visible in your Toolbar Ribbon:

Let’s get to the macro! Under the Developer tab, identify the ‘Macros’ tool on the far-left side of the toolbar. Select it and give your macro a suitable name. I called mine ‘link_python_excel’.

Once this is done, click ‘Create’. Next, you should see a window like this pop up:

Within the provided space, first initialize the macro using Sub link_python_excel(). This tells Excel VBA (Excel’s programming language) that you are about to write a macro called ‘link_python_excel’.
Next, declare your macro as an object, and your Python executable and Python script as strings. This is to enable VBA to locate the Python executable and use it to run the script as intended.
Dim objShell As Object
Dim PythonExe, PythonScript As String
You will then want to assign a macro object to its declaration:
Set objShell = VBA.CreateObject("Wscript.shell")
Please do not tamper with the “Wscript.shell” term. This assignment is the portion of the code that enables the macro to interact with Windows PowerShell, thus enabling VBA to execute the Python script. More information on this matter can be found at this website.
Following this, provide the filepath to the Python executable and the Python script:
PythonExe = """C:Userslbl59AppDataLocalProgramsPythonPython39python.exe"""
PythonScript = "C:Userslbl59Desktoprun_python_in_excelprocess_iris_data.py"
Note the use of the triple quotation marks. This method of assigning a string in VBA is used when the string potentially contains spaces. It is generally considered good practice to use “””…””” for file paths.
Finally, run your Python script and activate your workbook. The activation is necessary if you would like to run the script via a button in Excel, which we shall be going through in a bit.
objShell.Run PythonExe & PythonScript
Application.Goto Reference:="link_python_excel"
Finally, don’t forget to end the macro using End Sub.
Overall, your script should look as such:
Sub link_python_excel()

' link_python_excel Macro
' Declare all variables
Dim objShell As Object
Dim PythonExe, PythonScript As String

    'Create a new Shell Object
    Set objShell = VBA.CreateObject("Wscript.shell")

    'Provide the file path to the Python Exe
    PythonExe = """C:Userslbl59AppDataLocalProgramsPythonPython39python.exe"""

    'Provide the file path to the Python script
    PythonScript = "C:Userslbl59Desktoprun_python_in_excelprocess_iris_data.py"

    'Run the Python script
    objShell.Run PythonExe & PythonScript
    Application.Goto Reference:="link_python_excel"

End Sub
3. Run the Python script for Excel
Save the macro. Note that you will have to save the Excel workbook as a ‘.xlsm’ file to enable macro functionality. Once this is done, navigate to the ‘Developer’ tab and select ‘Insert’ and click on the button icon.

Draw the button the same way you would a rectangular shape. Rename the button, if you so prefer. In this exercise, the button is labeled ‘Run Code’. Next, right click on the button and select ‘Assign Macro’.

Once this is selected, you should be able to see the option to add the ‘link_python_excel’ macro to the button. Select the macro, and you are done! The two output files should have been output into the same location where you stored your iris.csv dataset.
Summary
In this post, we walked through the steps of writing a Python script to be run using an Excel macro. First, a Python script was written to process the iris dataset and output two files. Next, the Excel macro was written to execute this script. Finally, the macro was assigned to a button in the Excel sheet, where the Python script can be executed when the button is clicked.
Hope you found this useful!
Last Updated on July 14, 2022 by
In this tutorial, I will show you how to automate Excel with Python xlwings library. Excel is an awesome software with a simple and intuitive user interface, and Python is a powerful programming language that is very efficient at data analysis. xlwings is the glue that allows us to have the best of both worlds.
The author of xlwings says the library “Make Excel Fly!”, and I couldn’t agree more. You can use xlwings + Python for the following tasks:
- Automate Excel with Python, such as producing reports
- Write macros in Python, and run from Excel by clicking on a button
- Write user-defined functions in Python, and call those function from Excel just like any Excel function
Sounds exciting? Let’s get started!
Part 1. Installing xlwings
There are two parts to install xlwings: Python library and Excel add-in. Let’s start with getting the Python library first:
pip install xlwingsThen download the Excel add-in from xlwings’ official Github repository. It’s the xlwings.xlam file on the page, and feel free to grab the latest version. The link here is to v0.18.0.
Put the xlwings.xlam file into your Excel add-in folder, which is:
C:UsersxxxxAppDataRoamingMicrosoftAddIns
The xxxx is your own user name on your computer.
Then, open Excel, File -> Options -> Add-ins. Click on the “Go” button besides Manage: Excel Add-ins.

When the Add-ins window pops up, click on “Browse”.

This will take you directly to the Addins folder, simply select the xlwings.xlam file from the folder, and hit “OK”. xlwings addin is now added to your Excel, this add-in will be automatically enabled whenever you launch the Excel app.

Now, the xlwings tab should appear on your Excel ribbon.

The set up is done at this point, and now let’s have fun with automating Excel with Python!
Part 2. Automating Excel
Run the following Python script, which will open a new Excel instance.
import xlwings as xw
wb = xw.Book()
Write data to Excel
Here, wb refers to the new (and open) Excel file, and it’s also a Python object at the same time, which means we can manipulate it (the Excel file) in Python! Try the following code, which will allow you to input values from Python into Excel.
sheet = wb.sheets['Sheet1']
sheet.range('A1').value = "Hello Excel from Python"
We can also use the .range((x,y)) notation to refer to individual cells in Excel. x refers to row, and y refers to column. So .range((3, 2)) means cell B3.
sheet.range((3,2)).value = 'x-axis'
sheet.range((3,3)).value = 'y-axis'
for i in range(5):
    sheet.range((i+4, 2)).value = i
It’s also possible to write formulas in Excel using Python. Basically we are writing a string into the cell. Here, we want to calculate the exponential values of the x-axis in another column. In the below code, we are using an “f-string”, which is an improved string formatting syntax starting from Python 3.6.
for i in range(5):
    sheet.range((i+4,3)).value = f'=exp(B{i+4})'
Reading data from Excel
Reading data from Excel is as easy, the following code reads Excel data into Python as a list.
data = sheet.range('B3:C8').value
Check out the following short code if you want to read Excel data into Python as a pandas Dataframe. .expand() automatically detects the dimension of the data, and .options() specifies that we want a pandas Dataframe. We reset the index at the end so the x-axis will be treated as a column instead of a dataframe index.
import pandas as pd
df = xw.Range('B3').expand().options(pd.DataFrame).value
df.reset_index(inplace=True)
Now we have a table, what are we missing?… Yes, a graph! Since the data is already read into Python, we can generate a graph then put it into Excel file. For plotting the graph, we’ll use the matplotlib library.
import matplotlib.pyplot as plt
fig = plt.figure()
plt.plot(df['x-axis'],df['y-axis'])
plt.xlabel('x-axis')
plt.ylabel('y-axis')
sheet.pictures.add(fig, name='MyPlot', update=True)   #add the graph back into Excel
Finally, as we do for every Excel spreadsheet, we gotta save our work and close the file! wb refers to the workbook here.
wb.save('automate_excel_with_python.xlsx')
wb.close()
Part 3. Write a macro in Python and run in Excel
Let me just clarify, the “macro” isn’t referring to the VBA Excel macros. These are Python programs, which can be executed from Excel. However, it requires a tiny bit of VBA to allow Excel to call a Python function.
Python Script
Let’s first write a simple Python function to generate 10 random numbers, and then place them in an Excel sheet cell A1. Note the xw.Book.caller() refers to the current workbook. Save the following script as “rand_10.py”.
import numpy as np
import xlwings as xw

def generate():
    wb = xw.Book.caller()
    wb.sheets[0].range('A1').value = np.random.rand(10)
Excel VBA & linking to the Python script
Once we have the Python script, open up the VBA Editor, you can do this by pressing Alt + F11 inside the Excel app.
In the VBA editor, go to Tools -> Reference, and check the “xlwings” checkbox. OK and save.

Next, in the VBAProject window, right click on your Excel file, and insert a module. In the new module window appears on the right-hand side, you can type the following VBA code.

Sub Rand_10()
    RunPython ("import rand_10; rand_10.generate()")
End Sub
Some notes here: rand_10 is the Python script file name. i.e. we just saved the script as “rand_10.py”. The VBA code RunPython("import rand_10; rand_10.generate()") basically says: import the Python script called “rand_10”, then run the function generate() using Python.
Next, save the VBA code, and now we want to create a button in Excel sheet. Going back into Excel, under the “Developer” tab. Insert -> Button. If you don’t have the Developer tab. Right click on your Excel ribbon, and “Customize the Ribbon”. Check the Developer checkbox, and then OK to save the change.

Once you have a button, right click on it, then Assign Macro to assign the button to the VBA macro named Rand_10(). Click on the button, and 10 random numbers will be populated from cells A1 to J1.

Part 3. Write a user-defined function in Python and call it within Excel
Advanced Excel users know that we can create user-defined functions in VBA. This feature is great, as not all built-in Excel functions fit our needs. However, VBA is 1) hard to use/learn, and 2) has very limited functionality. With xlwings, we can create our own user-defined functions in Python. All we need is a Python script, and a little bit setup in Excel to achieve this.
Python script
Let’s write a simple Python function that calculates the square of a number.
import xlwings as xw

@xw.func
def square(x):
    return x ** 2
Two things to note here:
@xw.funcis a decorator. It must be added right before thedefto let xlwings know this is a user-defined function.- The function must return something so the returned value can be passed into Excel.
Excel setup
The default settings expect that the Python code and the Excel file to be:
- in the same directory
- with the same name, but Python file ends with
.pyand the Excel file ends with.xlsm(or.xlsb)
To illustrate, I’m going to name my files as “square.py” and “square.xlsb”. Open up square.xlsb in Excel, go to the xlwings tab, then click on Import Functions.
In some cases, you might get an “Automation error 440” pop up. 
We can fix this by taking the below steps:
- In Excel, click on File -> Options -> Trust Center -> Trust Center Settings… -> Macro Settings. Check “Trust access to the VBA project object model” box, and enable macros. OK to save changes.

- Go to VBA editor (press
Alt + F11). Tools -> References, then check “xlwings” box. OK to save change.


Once you complete the above 2 steps, go back to Excel the xlwings tab, click on the Import Functions again. After a brief pause, if no error message pops up, it means the Python function was imported successfully, and we can start using the Python function sqaure() inside Excel sheets. Let’s now test it!
You can type =square(A1) inside any cell, and notice that as you type out the function, square actually shows up in the function list! That’s a neat feature. Yep, you saw that – we can use this Python function just like an Excel function, and we can pass cell references into the function. Make no mistake here – it appears we are using an Excel function, but under the hood, Python is doing all the calculation, then only the result is displayed to the user via Excel. This means that, we can create really complex functions thanks to Python’s power. For example, a dynamic function that extract financial data from a website and display data in Excel.

Debugging
Two common errors you might experience as a beginner are:
- Automation error 404. We talked about how to fix this error, make sure the Excel Macro setting is correct.
- When you type the user defined function, “Object Require” shows up in the cell. Make sure xlwings is checked in VBA Editor -> Tools -> References, and the change is saved for the appropriate Excel file. Sometimes, when we have multiple Excel sheets open, we might end up applying this change to another file unintentionally.
I’ve recently taken it as a project to teach myself how to program in Python. Overall, I must say that I’m impressed with it.
In the past I’ve typically stuck to programming in VBA mostly for MS Excel (but also a bit in MS Access and Word) and have struggled to find ways to make it do things that Python can easily do with a single command.
I was wondering if there were a reasonable way to harness the programming power and ease of Python while at the same time make use of the various tools in Office (mostly Excel)?
![]()
ZygD
21k39 gold badges77 silver badges98 bronze badges
asked Jan 26, 2010 at 19:23
![]()
7
Yes, absolutely. You want to use win32com module, which is part of pywin32 (get it here).
I’ve found you can really simplify Python integration by writing a macro in VBA for Python to use, and then just have Python call the macro. It will look something like this:
from win32com.client import Dispatch as comDispatch

xl = comDispatch('Excel.Application')
xl.Workbooks.Open("Macros.xls", False, True)
xl.Run("Macros.xls!Macro_1")
I’m sure there are plently of examples on SO… Like this one.
![]()
answered Jan 26, 2010 at 19:26
![]()
Jason CoonJason Coon
17.5k10 gold badges41 silver badges50 bronze badges
There is a set of cross platform Python utilities — called xlrd, xlwt, and xlutils — for reading & writing Excel files. There are some limitations (e.g. I don’t think they can process macros), but they do allow you to work with Excel files on non-Windows platforms, if that’s of use to you. See: http://www.python-excel.org/
Also, there are SO questions already dealing with this sort of topic, including this:
Is there a better way (besides COM) to remote-control Excel?
![]()
answered Jan 26, 2010 at 21:23
![]()
GreenMattGreenMatt
18.1k7 gold badges53 silver badges79 bronze badges
Or have a look at IronPython. IPy is a native .NET implementation of Python 2.6, you can find it at http://www.codeplex.com/ironpython.
We have used it for several projects. You can use it «from the outside» using COM or — as we do — write a Excel AddIn with a ScriptHost, which calls out to IronPython code giving you an environment similar to VBA.
Being a .NET dll, IPy integrates extremely well into the modern Windows .NET stack.
answered Jan 26, 2010 at 21:14
![]()
2
The xlrd, xlwt, and xlutils packages mentioned above can only read and write .xls files which have size limitations of 65,000 rows and 256 columns. Aside from that it is a good tool.
But I have moved on to another python-excel package, OpenPyXL, which can read and write .xlsx files. Also I find it easy to use and the documentation is good.
OpenPyXL: http://packages.python.org/openpyxl/index.html
answered Sep 26, 2011 at 17:10
![]()
sequoiasequoia
2,9758 gold badges32 silver badges41 bronze badges
here is a useful link:
http://continuum.io/using-excel
-
Try Pyvot – A Python to/from Excel Connector from Microsoft:
http://pytools.codeplex.com/wikipage?title=Pyvot
I also really like PTVS from the same dev. team, which provides best debugging in Python that I experienced so far.
2.
What you can do with VBA + Python is following:
Compile your py scripts that take inputs and generate outputs as text files or from console. Then VBA will prepare input for py, call the pre-compiled py script and read back its output.
3.
Consider OpenOffice or LibreOffice which support Python scripts.
This is assuming that available options with COM or MS script interfaces do not satisfy your needs.
4.
This is not free approach, but worth mentioning (featured in Forbes and New York Times):
https://datanitro.com
5.
This is not free for commercial use:
PyXLL — Excel addin that enables functions written in Python to be called in Excel.
answered Oct 13, 2013 at 14:43
![]()
denfromufadenfromufa
5,97612 gold badges77 silver badges138 bronze badges
This is a question from a long time ago, but I’m putting it here so others can point to it in their search.
One option not discussed here, which I use all the time, is to create a COM server from Python and call it from VBA in any Office application. There is a good tutorial of doing COM server with Python at: http://timgolden.me.uk/pywin32-docs/html/com/win32com/HTML/QuickStartServerCom.html
What you end up with is a COM server (don’t forget to make it In Process) that can be created by a call to CreateObject() in VBA. You then call the methods on it as you do with an COM object created with CreateObject(). You can’t single step in your Python script, but you can intercept logging with win32traceutil from Pywin32 distribution. Works flawlessly.
![]()
ZygD
21k39 gold badges77 silver badges98 bronze badges
answered Apr 7, 2015 at 20:11
![]()
При обработке данных Excel файлов используя Python, бывают ситуации, когда необходимо запустить с помощью Python макрос VBA, написанный ранее в Excel. В этой статье мы разберемся как это сделать с применением библиотеки Xlwings.
Для нашего учебного примера давайте создадим Excel файл и в нем макрос:
Sub SampleMacro()
MsgBox («VBA макрос запущен при помощи Python»)
End Sub

Сохраните Excel файл c поддержкой макросов под именем «vba_python.xlsm». Кстати, если вы позабыли, как создавать VBA макросы, то прочитайте нашу статью «
Как удалить скрытые имена в Excel
», в ней подробно мы разбирали этот вопрос.
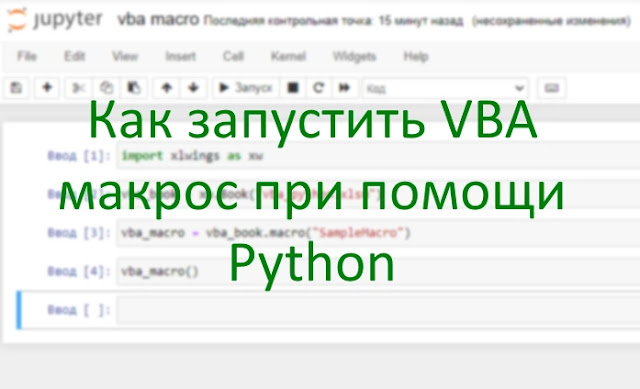
Теперь запускаем Python и импортируем библиотеку Xlwings:
import xlwings as xw
Следующим этапом открываем Excel файл, который создали ранее:
vba_book = xw.Book(«vba_python.xlsm»)
Воспользуемся встроенным в Xlwings методом macro(), который как раз и предназначен для запуска VBA макросов. В качестве параметра в метод передается названия созданного ранее VBA макроса.:
vba_macro = vba_book.macro(«SampleMacro»)
Теперь запускаем макрос:
vba_macro()
Итого общий код нашего минипроекта выглядит следующим образом:

Выполнив этот код, мы получим следующий результат в Excel файле:
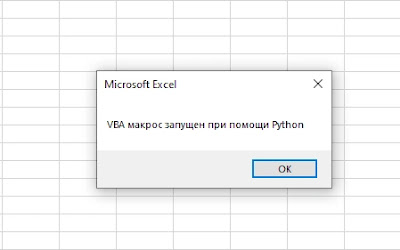
Отлично, все работает!
Хотел бы обратить ваше внимание, что ваше знание Python и Excel очень поможет в освоении новой, перспективной и востребованной профессии «Data Scientist». Если хотите узнать об этом побольше, запишитесь на курс «
Data Scientist с нуля до Junior
» от Skillbox.
Спасибо за внимание, жду ваших вопросов в комментариях.
Excel is a surprisingly common tool for data analysis.
Data analysts can readily modify, examine, and display huge amounts of data with Excel, which makes it simpler to gain insights and make wise choices.
Excel’s versatility lets users carry out a variety of data analysis activities, from straightforward math operations to intricate statistical analysis. Also, Excel offers automation through the use of third-party programs like Python or the built-in programming language VBA.
Excel is frequently used for data analysis across a range of industries, including banking, healthcare, and marketing, thanks to its versatility and usability.
But as a data analyst, you might often find yourself repeating mundane tasks on a daily basis when working with Excel.
These tasks may include copying and pasting data, formatting cells, and creating charts, among others. Over time, this can become monotonous and time-consuming, leaving you with less time to focus on more important aspects of data analysis, such as identifying trends, outliers, and insights.
This is why automating Excel using Python can be a game-changer, helping you streamline your workflows and free up time for more meaningful analysis.
In this tutorial, I’ll show you some helpful ways to create, update, and analyze Excel spreadsheets using Python programming. Let’s dive in.
How to Merge Two Separate Spreadsheets with Python
Data analysts often have to work on many spreadsheets, which can become hectic when you have to merge those files together.
The code below helps you merge two separate files together.
import pandas as pd

# Read in the two Excel files

file1 = pd.read_excel('file1.xlsx')file2 = pd.read_excel('file2.xlsx')

# Merge the two files using the concat() method
merged_file = pd.concat([file1, file2], ignore_index=True)

# Write the merged file to a new Excel file
merged_file.to_excel('merged_file.xlsx', index=False)
In this code, we first import the Pandas library, which we’ll use to read in and manipulate the Excel files.
We then use the read_excel() method to read in both file1.xlsx and file2.xlsx. Next, we use the concat() method to merge the two files together. The ignore_index=True argument ensures that the index values from both files are reset, so we don’t end up with duplicate index values in the merged file.
Finally, we use the to_excel() method to write the merged file to a new Excel file named merged_file.xlsx. We also set index=False to ensure that the index column is not included in the output file.
How to Import and Export Data with Python
This task involves using Python libraries such as Pandas to read Excel files into a DataFrame object. You can then manipulate it and analyze it using Python.
You can also export data from Python back into an Excel file using the same libraries.
import pandas as pd
# Import Excel file

df = pd.read_excel('filename.xlsx', sheet_name='Sheet1')

# Export to Excel file
df.to_excel('new_filename.xlsx', index=False)
The given code imports the Pandas library and reads an Excel file named «filename.xlsx» from Sheet1 of the workbook, storing the data in a Pandas dataframe named «df». The dataframe is then exported to a new Excel file named «new_filename.xlsx» using the «to_excel» method. The «index=False» parameter is used to exclude row indexing in the output file.
Essentially, the code copies the contents of the original Excel file to a new file using Pandas.
How to Clean and Transform Data using Python
This task involves using Python libraries such as Pandas to clean and transform data in Excel.
This may include removing duplicates, filtering data based on specific criteria, and performing calculations on the data.
import pandas as pd

# Remove duplicates
df = df.drop_duplicates()

# Filter data
df = df[df['column_name'] > 10]

# Perform calculations
df['new_column'] = df['column1'] + df['column2']
The code snippet above performs data cleaning and manipulation tasks on a Pandas dataframe named ‘df’ using the Pandas library.
Firstly, it removes duplicate rows from ‘df’ using the «drop_duplicates» method. Secondly, it filters the ‘df’ dataframe by selecting rows where the value in the ‘column_name’ column is greater than 10 and assigns the filtered result to a new dataframe called ‘data_df’.
Lastly, a new column named ‘new_column’ is added to ‘df’ which contains the sum of values from ‘column1’ and ‘column2’.
Overall, the code effectively cleans and manipulates the data by removing duplicates, filtering specific rows, and adding a new calculated column to the original dataframe.
How to Perform Data Analysis with Python
This task involves using Python libraries such as Pandas and NumPy to perform data analysis on Excel data.
This may include calculating summary statistics, such as mean and standard deviation, or creating custom reports by grouping data based on specific criteria.
import pandas as pd
import numpy as np

# Calculate summary statistics
df.describe()
# Create custom reports
df.pivot_table(values='column_name', index='category_name', columns='date')
The code utilizes the Pandas and NumPy libraries and performs data analysis and reporting tasks on a Pandas dataframe named «df».
Firstly, it calculates summary statistics for the numerical data in the dataframe using the «describe» method. This method generates valuable insights on the data’s distribution, central tendency, and dispersion.
Secondly, the code uses the «pivot_table» method to create customized reports from the dataframe. This method summarizes and aggregates the data in the dataframe and can produce tables in various formats.
In this code, it generates a new dataframe where the ‘column_name’ values are grouped by the ‘category_name’ and ‘date’ columns.
Overall, the code performs statistical analysis and reporting tasks on the dataframe to gain insights from the data.
How to Create Charts with Python
This task involves using Python libraries such as matplotlib or seaborn to create charts and graphs from Excel data.
You can customize these charts to display specific data and format them to meet specific requirements.
import pandas as pd
import matplotlib.pyplot as plt
# Create a bar chart
df.plot(kind='bar', x='category_name', y='sales')
plt.show()
# Create a scatter plot
df.plot(kind='scatter', x='column1', y='column2')plt.show()
The code imports two libraries, Pandas and matplotlib.pyplot using the aliases ‘pd’ and ‘plt’, respectively.
The Pandas «plot» method is then used to create two types of plots. The first type of plot is a bar chart that shows the relationship between the ‘category_name’ and ‘sales’ columns in the «df» dataframe.
The second type of plot is a scatter plot that shows the relationship between the ‘column1’ and ‘column2’ columns in the same dataframe. The code uses the parameters «kind=’bar'» for the bar chart and «kind=’scatter'» for the scatter plot to create the respective plots.
Lastly, the «show» method is called to display the plots on the screen. In summary, the code utilizes Pandas and matplotlib to create a bar chart and a scatter plot to visualize the data in the «df» dataframe.
How to Do Data Visualization in Python
This task involves using Python libraries such as Plotly and bokeh to create interactive data visualizations from Excel data.
These visualizations allow users to explore data in new ways, such as by zooming in on specific data points or filtering data based on specific criteria.
import pandas as pd
import plotly.express as px
# Create a heatmap
fig = px.imshow(df.corr())
fig.show()
# Create a line chart
fig = px.line(df, x='date', y='sales', color='category')
fig.show()
The code uses the Pandas and plotly.express libraries to create two types of visualizations. First, a heatmap plot is created using plotly.express’s «imshow» method that visualizes the correlation between columns in the «df» dataframe.
Second, a line chart is created using plotly.express’s «line» method that displays the relationship between the ‘date’ and ‘sales’ columns while differentiating between categories based on the ‘category’ column of the dataframe. Both plots are displayed using the «show» method.
How to Automate Report Generation with Python
This task involves using Python scripts to automate the process of generating reports from Excel data.
You can set up these scripts to run on a regular schedule, such as daily or weekly. They can also automatically update as new data becomes available.
import pandas as pd
# Create daily report
df_daily = df[df['date'] == '2022-01-01']
df_daily.to_excel('daily_report.xlsx', index=False)
# Create weekly report
df_weekly = df.groupby('category').sum()
df_weekly.to_excel('weekly_report.xlsx', index=False)
The code creates a daily report by creating a new dataframe «df_daily» that includes only the rows where the ‘date’ column equals ‘2022-01-01′. This is achieved by using Pandas’ boolean indexing feature.
Afterward, the «to_excel» method is used to export the filtered data to an Excel file named «daily_report.xlsx», without including the index column.
Next, the code creates a weekly report by grouping the «df» dataframe by the ‘category’ column and summing the values of all other columns. This is accomplished using the Pandas «groupby» and «sum» methods.
The result is saved in a new dataframe named «df_weekly». Lastly, the «to_excel» method is used to export the aggregated data to an Excel file named «weekly_report.xlsx», without including the index column.
In summary, the code creates two reports using the Pandas library. The first report is a daily report that includes only data from a specific date, and the second report is a weekly report that aggregates data by category. Both reports are exported to Excel files using the «to_excel» method.
How to Automate Repetitive Tasks with Macros and Scripts in Python
This task involves using Python to automate repetitive tasks in Excel, such as data entry or formatting. You can do this by creating macros or scripts that can execute automatically, or by using Python to interact with the Excel application directly.
import win32com.client as win32
# Open Excel file
excel = win32.gencache.EnsureDispatch('Excel.Application')
workbook = excel.Workbooks.Open(r'filename.xlsx')
# Run macro
excel.Application.Run('macro_name')
# Save and close Excel
 fileworkbook.Save()workbook.Close()excel.Quit()
The code uses the win32com.client module to interact with Microsoft Excel via the Windows API.
First, an instance of the Excel application is opened using the EnsureDispatch() method, and the specified Excel file is opened using the Workbooks.Open() method.
Next, a macro is executed using the Application.Run() method, passing the name of the macro as an argument.
Finally, the changes made to the Excel file are saved using the Save() method, the workbook is closed using the Close() method, and the Excel application is terminated using the Quit() method
How to Scrape Data with Python
This task involves using Python libraries such as requests and Beautiful Soup to scrape data from web pages or other sources and import it into Excel.
You can then analyze and manipulate this data using Python libraries such as Pandas.
import pandas as pd
import requests
from bs4 import BeautifulSoup
# Scrape data from web page
url = 'https://www.website.com/data'
response = requests.get(url)
soup = BeautifulSoup(response.text, 'html.parser')
table = soup.find('table')
df = pd.read_html(str(table))[0]
# Export to Excel file
df.to_excel('scraped_data.xlsx', index=False)
This code uses the requests library to send an HTTP GET request to the URL ‘https://www.example.com’. It then uses the BeautifulSoup library to parse the HTML content of the response into a BeautifulSoup object named ‘soup’.
You can then use BeautifulSoup methods such as find_all() to extract specific data from the HTML:
links = []for link in soup.find_all('a'): href = link.get('href') links.append(href)
This code finds all the anchor tags in the HTML and extracts the value of the ‘href’ attribute for each one, adding them to a list named ‘links’.
How to Use Python to Integrate Excel with Other Applications
This task involves using Python to integrate Excel with other applications, such as databases or web services.
You can do this using Python libraries such as pyodbc to connect to databases or by using APIs to connect to web services. This allows for seamless data transfer and analysis between different applications.
import pandas as pd
import pyodbc
# Connect to database
cnxn = pyodbc.connect('DRIVER={SQL Server};SERVER=server_name;DATABASE=db_name;UID=user_id;PWD=password')
# Read data from database
query = 'SELECT * FROM table_name'
df = pd.read_sql(query, cnxn)
# Export to Excel file
df.to_excel('database_data.xlsx', index=False)
The code establishes a connection to a SQL Server database using pyodbc.connect() method, where the driver, server name, database name, user ID, and password are provided as arguments.
Then, a SQL query is defined and executed to retrieve data from a table in the database using the pd.read_sql() method, where the SQL query and the connection object are provided as arguments. The retrieved data is then stored in a pandas DataFrame.
Finally, the data in the DataFrame is exported to an Excel file named «database_data.xlsx» using the to_excel() method, with the index column excluded from the export by setting the index parameter to False.
Conclusion
Python is a versatile language that you can use to automate many Excel tasks. You can also use various libraries such as Pandas, openpyxl, xlwings, and pyautogui to manipulate data, extract information, generate reports, and automate repetitive tasks.
Automation can save time and effort, reduce errors, and boost productivity. Python proficiency can be a valuable skill for any professional working with Excel, whether you’re a data or financial analyst. By learning Python, you can elevate your work to new heights.
Let’s connect on Twitter and LinkedIn. Thanks for reading!
Learn to code for free. freeCodeCamp’s open source curriculum has helped more than 40,000 people get jobs as developers. Get started