
A project timeline can be created in Excel using charts linked to data tables, so that the chart updates when you edit the data table. The first template on this page uses a stacked bar chart technique and also includes up to 4 milestones as vertical lines. This template is a cross between my project schedule and task list templates. I’ve populated the template with some generic product development terminology, but it is designed for you to enter your own tasks and dates. The second template uses a scatter chart with data labels and leader lines to create a more traditional type of timeline.
Advertisement
⤓ Download
For: Excel 2013 or later
«No installation, no macros — just a simple spreadsheet» — by
License: Private Use
(not for distribution or resale)
Using the Project Timeline Template
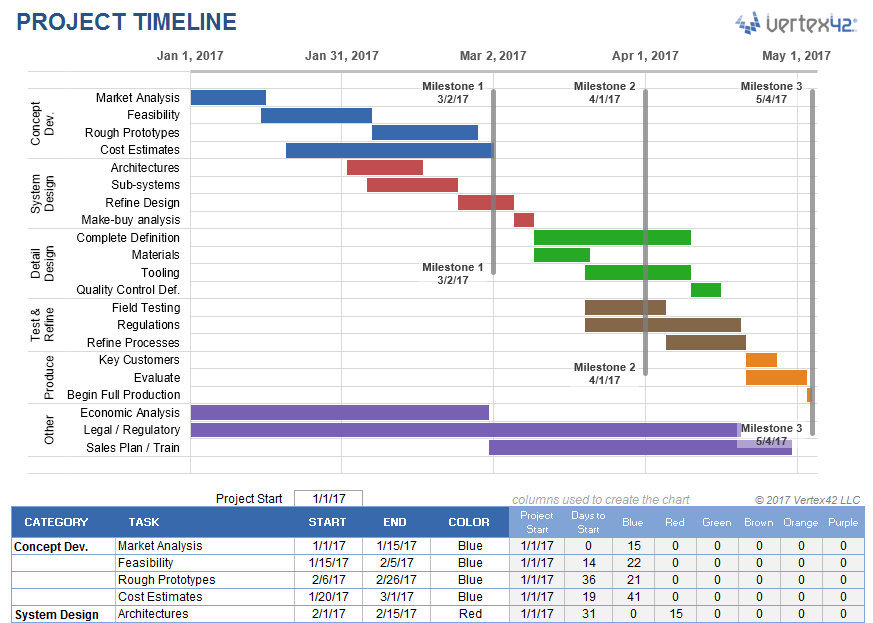
Grouping Tasks Using Different Colors: One of the key features of this template is the ability to choose a different color for the bars in the timeline via a drop-down box in the Color column. This makes it easy to identify the different phases or categories of tasks. You can insert and delete tasks by just inserting or deleting rows in the spreadsheet’s data table.
The example above shows some of the steps in a product development cycle (Concept Development, System Design, Detail Design, Testing and Refining, Production, etc.), with different colors representing different phases of the cycle. However, there are other ways to use this type of timeline. Another common way to group tasks within a project timeline is by key organization function, such as Marketing, Design, Testing, Manufacturing, Finance, Sales, Quality Assurance, Legal, etc.
Milestones: With any project timeline, you will most likely want to define at least a couple key milestones. In the above example you will see 3 milestones as vertical lines. You can edit the milestone labels and dates via the data table. The template lets you show up to 4 milestones. Adding more is possible but would require you to create the new data series yourself (you can’t just insert rows for more milestones like you can with the tasks).
Can I Add More Colors? This project timeline is set up to allow up to 6 different color choices. Adding more colors is possible, but that would require more Excel experience. Some general steps to follow to attempt adding more colors:
- Add a new column to the right of the current data table.
- Copy the formulas in the previous column into the new column.
- Select the timeline and drag the range marker to the right to include the new column.
- Add some data to see what color the new column uses and then update the column label.
- Update the list used for the data validation drop-down box in the Color column to include the new label.
Dates Not Changing in the Chart? To edit the range of dates shown in the chart, you need to edit the Minimum and Maximum bounds of the horizontal axis. Right-click on the axis and select Format Axis.
Want More Flexibility / Ease of Use? If you don’t care about automation and just want a simple way to create a high-level project timeline, you might want to try the Project Schedule Template. Colors are modified by just changing the background colors of the cells in the spreadsheet.
Project Timeline Chart
for Excel
Description
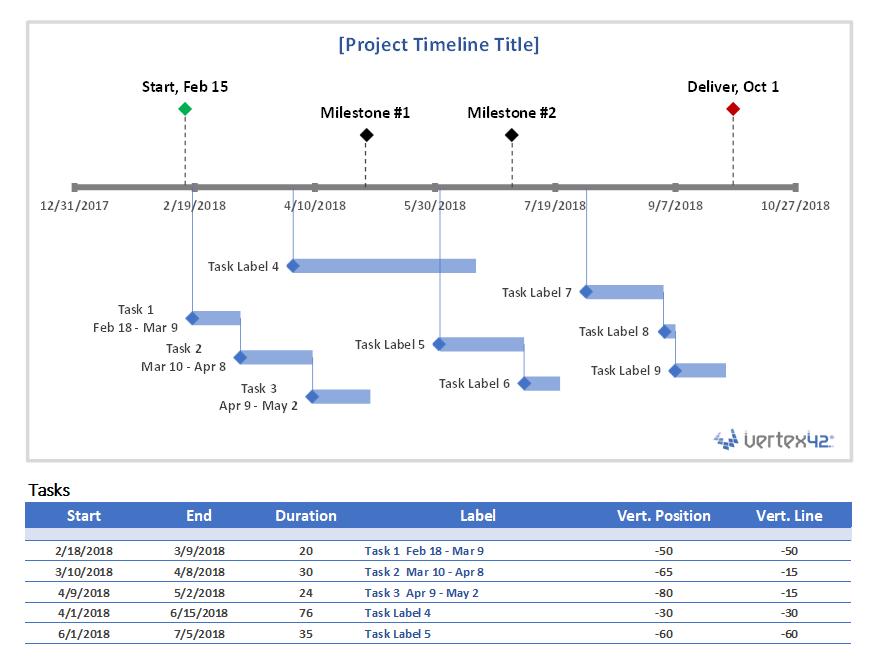
This project timeline uses two different scatter chart series to display milestones above the timeline and tasks with durations below the timeline. The durations are created using X Error bars. The length of the leaderlines for the tasks can be defined by the user to show task dependencies.
The vertical positions of the tasks and milestones are adjusted by the user. This may work great for some timelines, but if you have more than 20 tasks to show, you may be better of using a Gantt Chart.
This template is based on the original Vertex42 Excel Timeline Template, which was one of the first timeline templates developed for Excel using the technique of leaderlines and error bars for durations. This new project timeline works only in the more recent versions of Excel (2013 or later) because of the new feature in Excel that allows you to specify a range of cells for Data Labels.
To learn how to create a timeline using a scatter chart, see the video demos for the Bubble Chart Timeline and Vertical Timeline templates.
Use a Graphic as a Data Point Marker in a Project Timeline
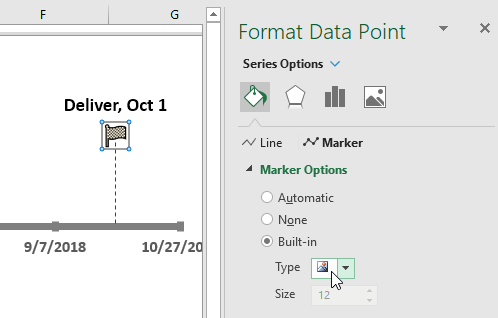
You can add graphics to a project timeline to make it more interesting or visually appealing. For example, you may want to mark the final milestone with a finish-line flag, as shown in the image below. To do this, you will first need to create a graphic using your favorite image editing app, or download one. The diamond ![]() and flag
and flag ![]() that I use in my project timelines were created from screenshots of common unicode characters.
that I use in my project timelines were created from screenshots of common unicode characters.
Steps for using a graphic as a data point marker:
- Select a single data point by clicking on it and then clicking on it again.
- Right-click on the selected data point to open the Format Data Point task pane.
- Click on the Bucket > Marker > Marker Options > Built-in, then select the picture icon from the Type drop-down.
- Select the image from your computer.
To see other examples of using graphics in a timeline, see my original Timeline Template.
More Project Timelines
Project Planner Template
Create a project plan using a gantt chart that shows the planned schedule vs. the actual schedule.
Gantt Chart Template
The Gantt Chart template (and especially the Pro version) is great for project scheduling and detailed task scheduling.
Временные шкалы — это важное средство для обучения и управления проектами. Но их создание может занять некоторое время. Шаблон временной шкалы Майкрософт может с этим помочь.
В этих привлекательных бесплатных шаблонах временной шкалы используются различные стили, цвета, форматы, иллюстрации и инфографика.
Существует шаблон временной шкалы для месячного, годового и более продолжительного проекта, а также шаблоны с визуальным указанием основных вех проекта. Используйте шаблон временной шкалы Excel для отображения рабочего плана или воспользуйтесь шаблоном временной шкалы PowerPoint для отслеживания основных дат. Вертикальный шаблон временной шкалы хорошо подходит для истории эпохи, страны или проекта. Если вы руководите командой, попробуйте применить шаблон временной шкалы с назначением задач. Добавляйте визуальные элементы в свое расписание с помощью шаблона временной шкалы с записками или с ракетами. Есть даже шаблоны временной шкалы для личных целей, например для похудения.
Любой выбранный шаблон временной шкалы — это отличный способ управления ресурсами и прогнозами.
In this article, you’ll find the most useful collection of free Microsoft Excel project timeline templates for project managers, project sponsors, project team members, and other project stakeholders.
Included on this page, you’ll find a simple project timeline template, a project timeline Gantt chart template, a project milestone and task timeline template, a sample timeline template, and a monthly project timeline template, among others. You’ll also find a list of helpful tips for filling out these Microsoft Excel project timeline templates.
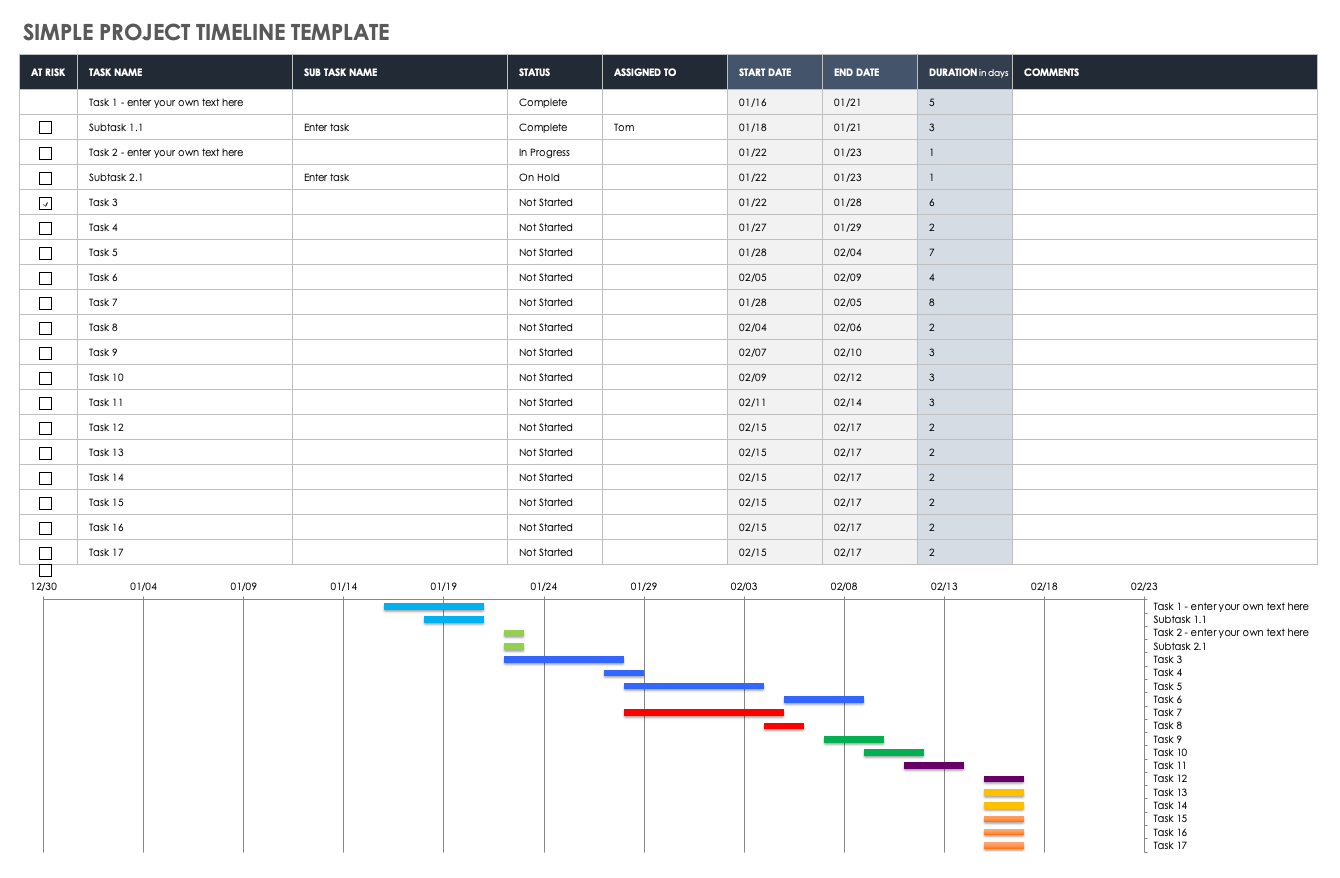
Simple Project Timeline Template
Download Simple Project Timeline Template – Microsoft Excel
Use this simple project timeline template to break down your project’s tasks into weeks, months, and phases. This visually dynamic timeline includes pre-filled, color-coded project phase swimlanes, such as Project Conception and Initiation, Project Definition and Planning, and Project Launch / Execution, so you can match each project task to a phase and track its progress chronologically. This timeline template uses a classic Gantt chart to help you plan and execute your time-sensitive project deliverables.
Check out this article to get step-by-step instructions for creating the perfect project timeline template in Microsoft Excel.
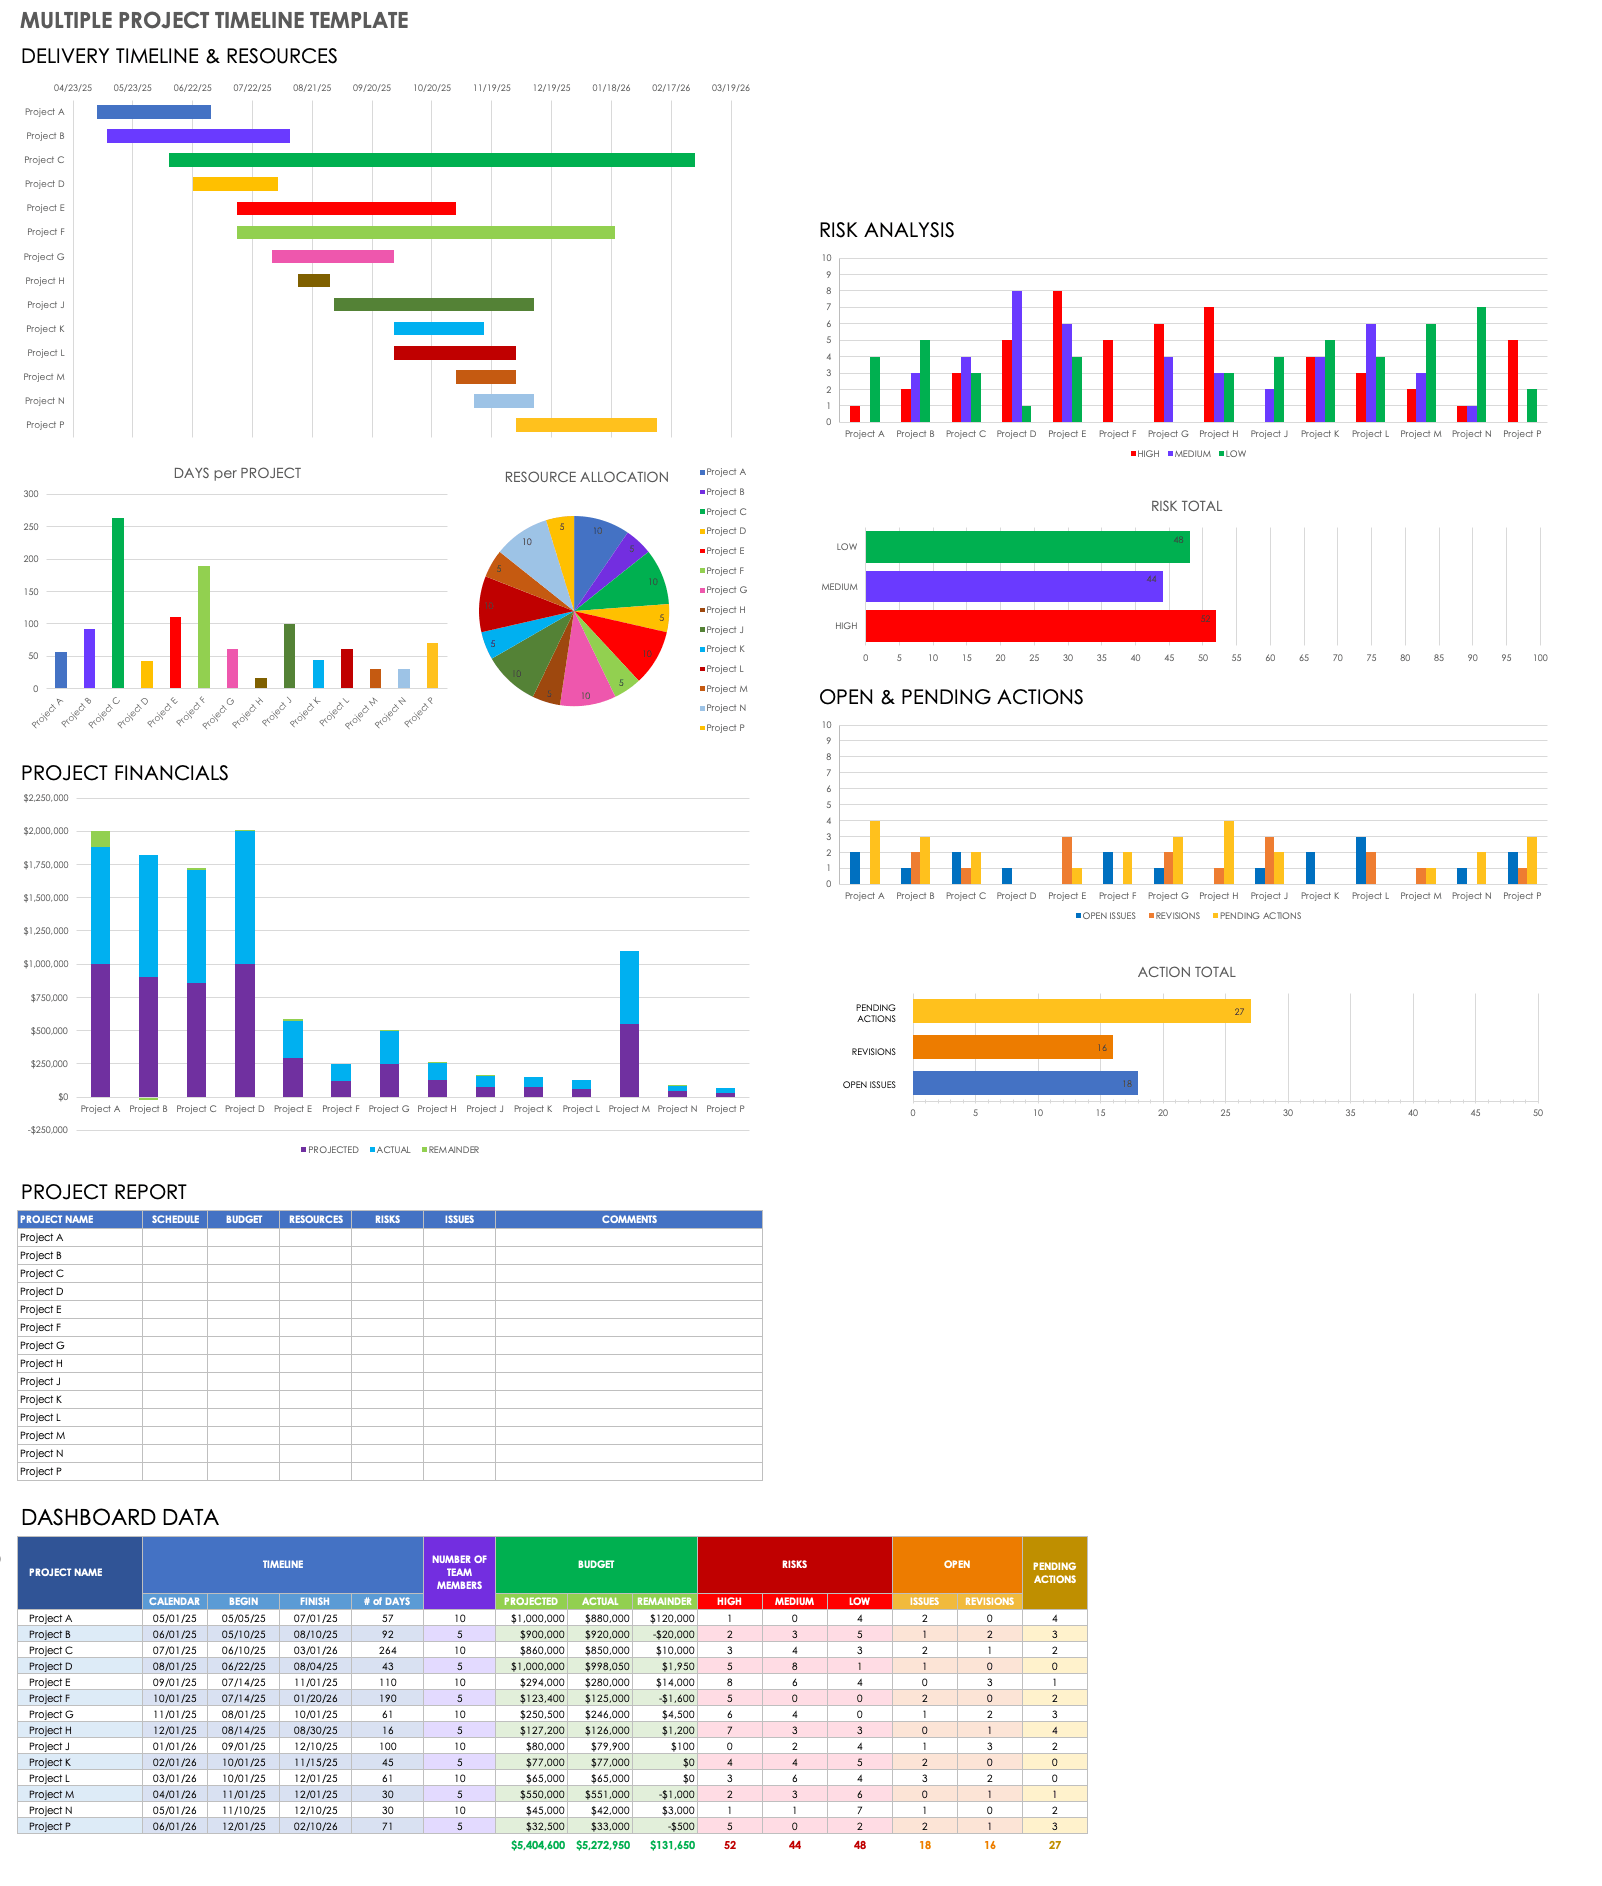
Multiple Project Timeline Template
Download Multiple Project Timeline Template – Microsoft Excel
This visually rich, dashboard-style multiple project timeline template enables you to be proactive and stay on schedule regarding project deliverables. Use the Delivery Timeline and Resources section to get a bar-chart overview of each project’s sequential progress. The Risk Analysis section’s vertical bar graph indicates the risk level of each project task (e.g., High, Medium, or Low). The Open and Pending Actions section lets you know how many project tasks have open issues, are undergoing revisions, or have pending actions. This project-by-project template provides a high-level overview of each project’s status and allows you to drill down into time-crucial, project-specific action items.
To find additional resources and get the most out of your project planning timelines, see this collection of free project timeline templates.
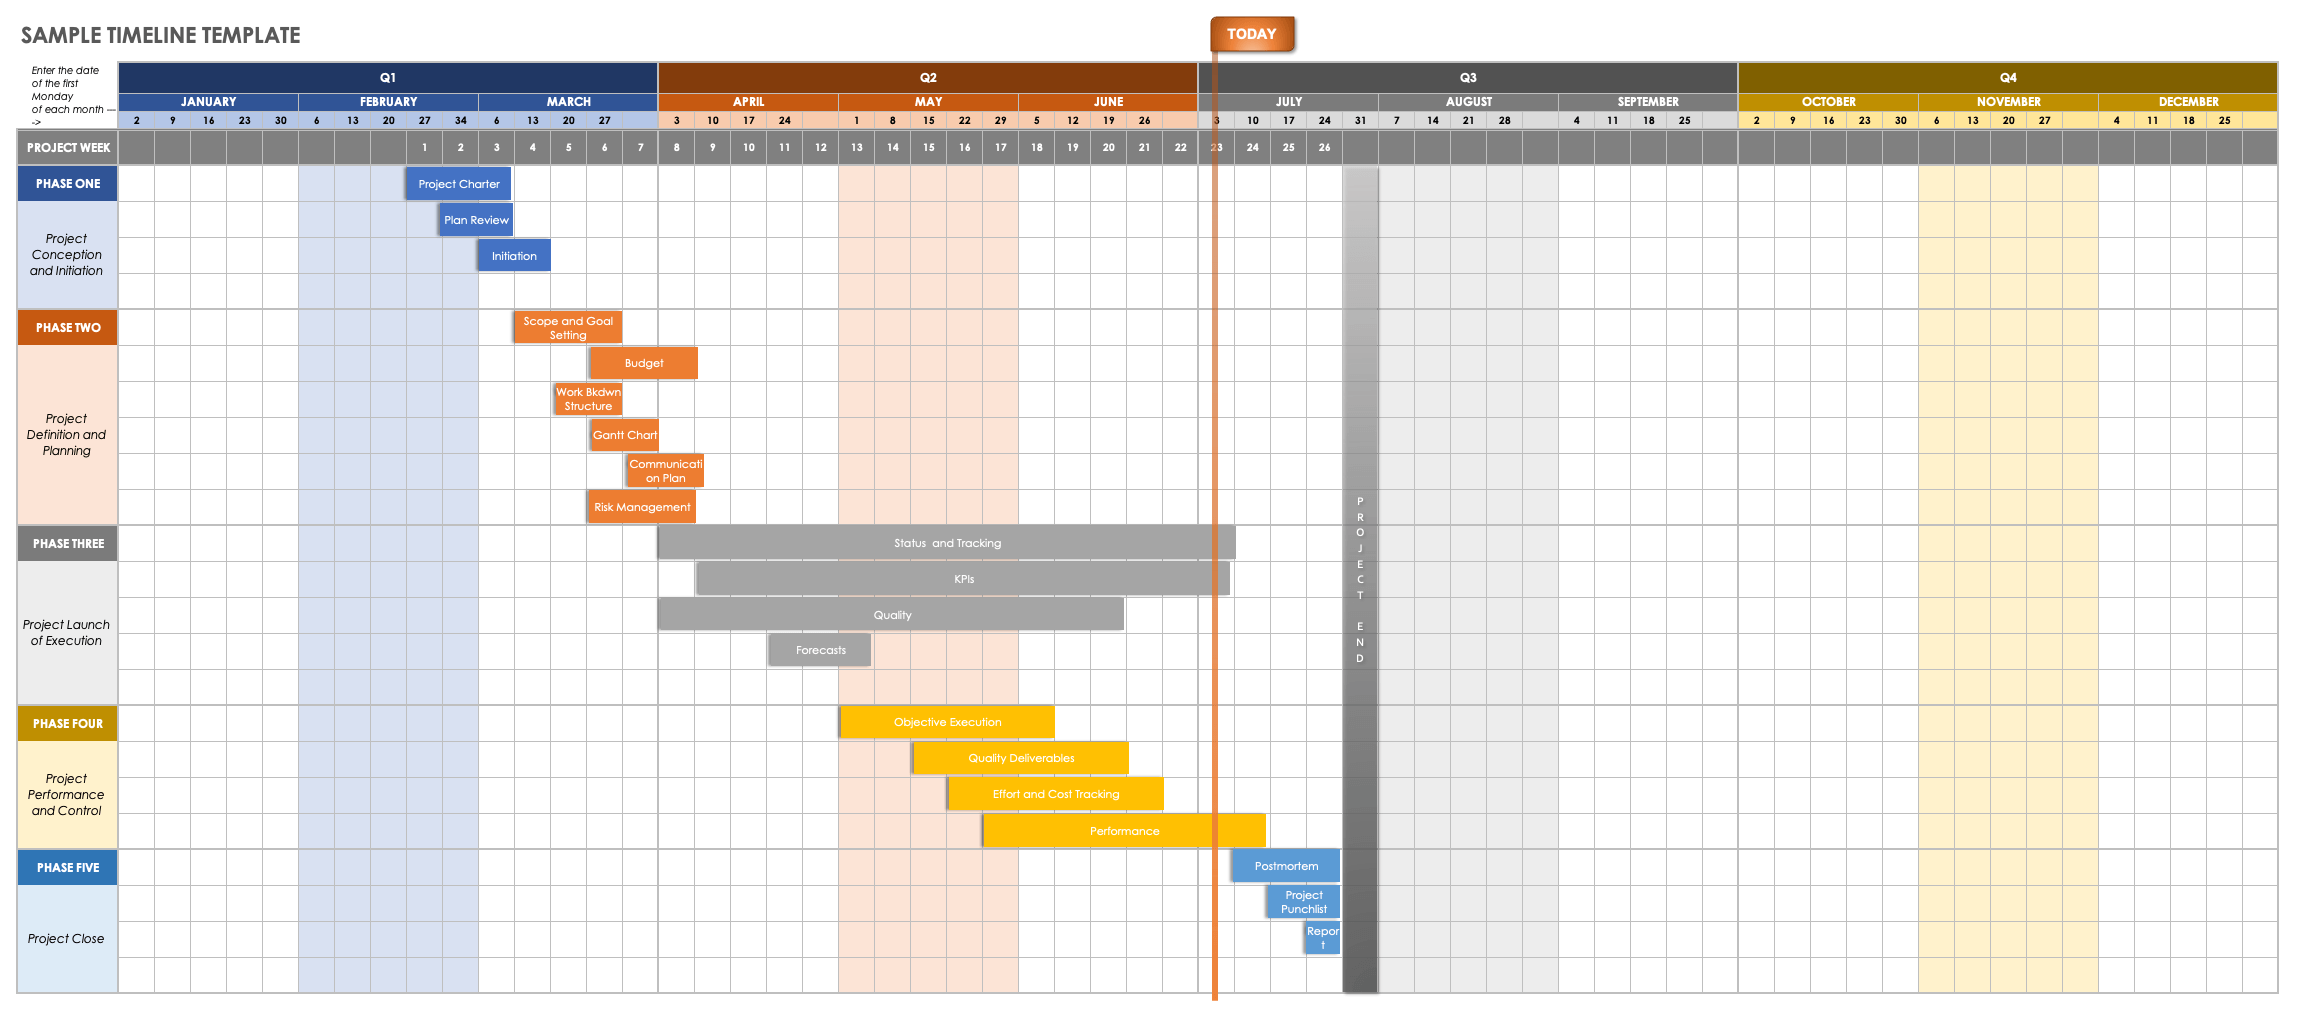
Sample Timeline Template
Download Sample Timeline Template – Microsoft Excel
With this comprehensive sample timeline template, you can customize the task durations of each project phase in order to solidify your project’s key deliverables. The template includes editable example text to guide you through the project-development stages, from project conception and initiation through project completion. View project-task achievement in quarterly, monthly, and week-by-week stages with this easy-to-use template that keeps you and your team on track to successfully complete your project on time.
Monthly Project Timeline Template
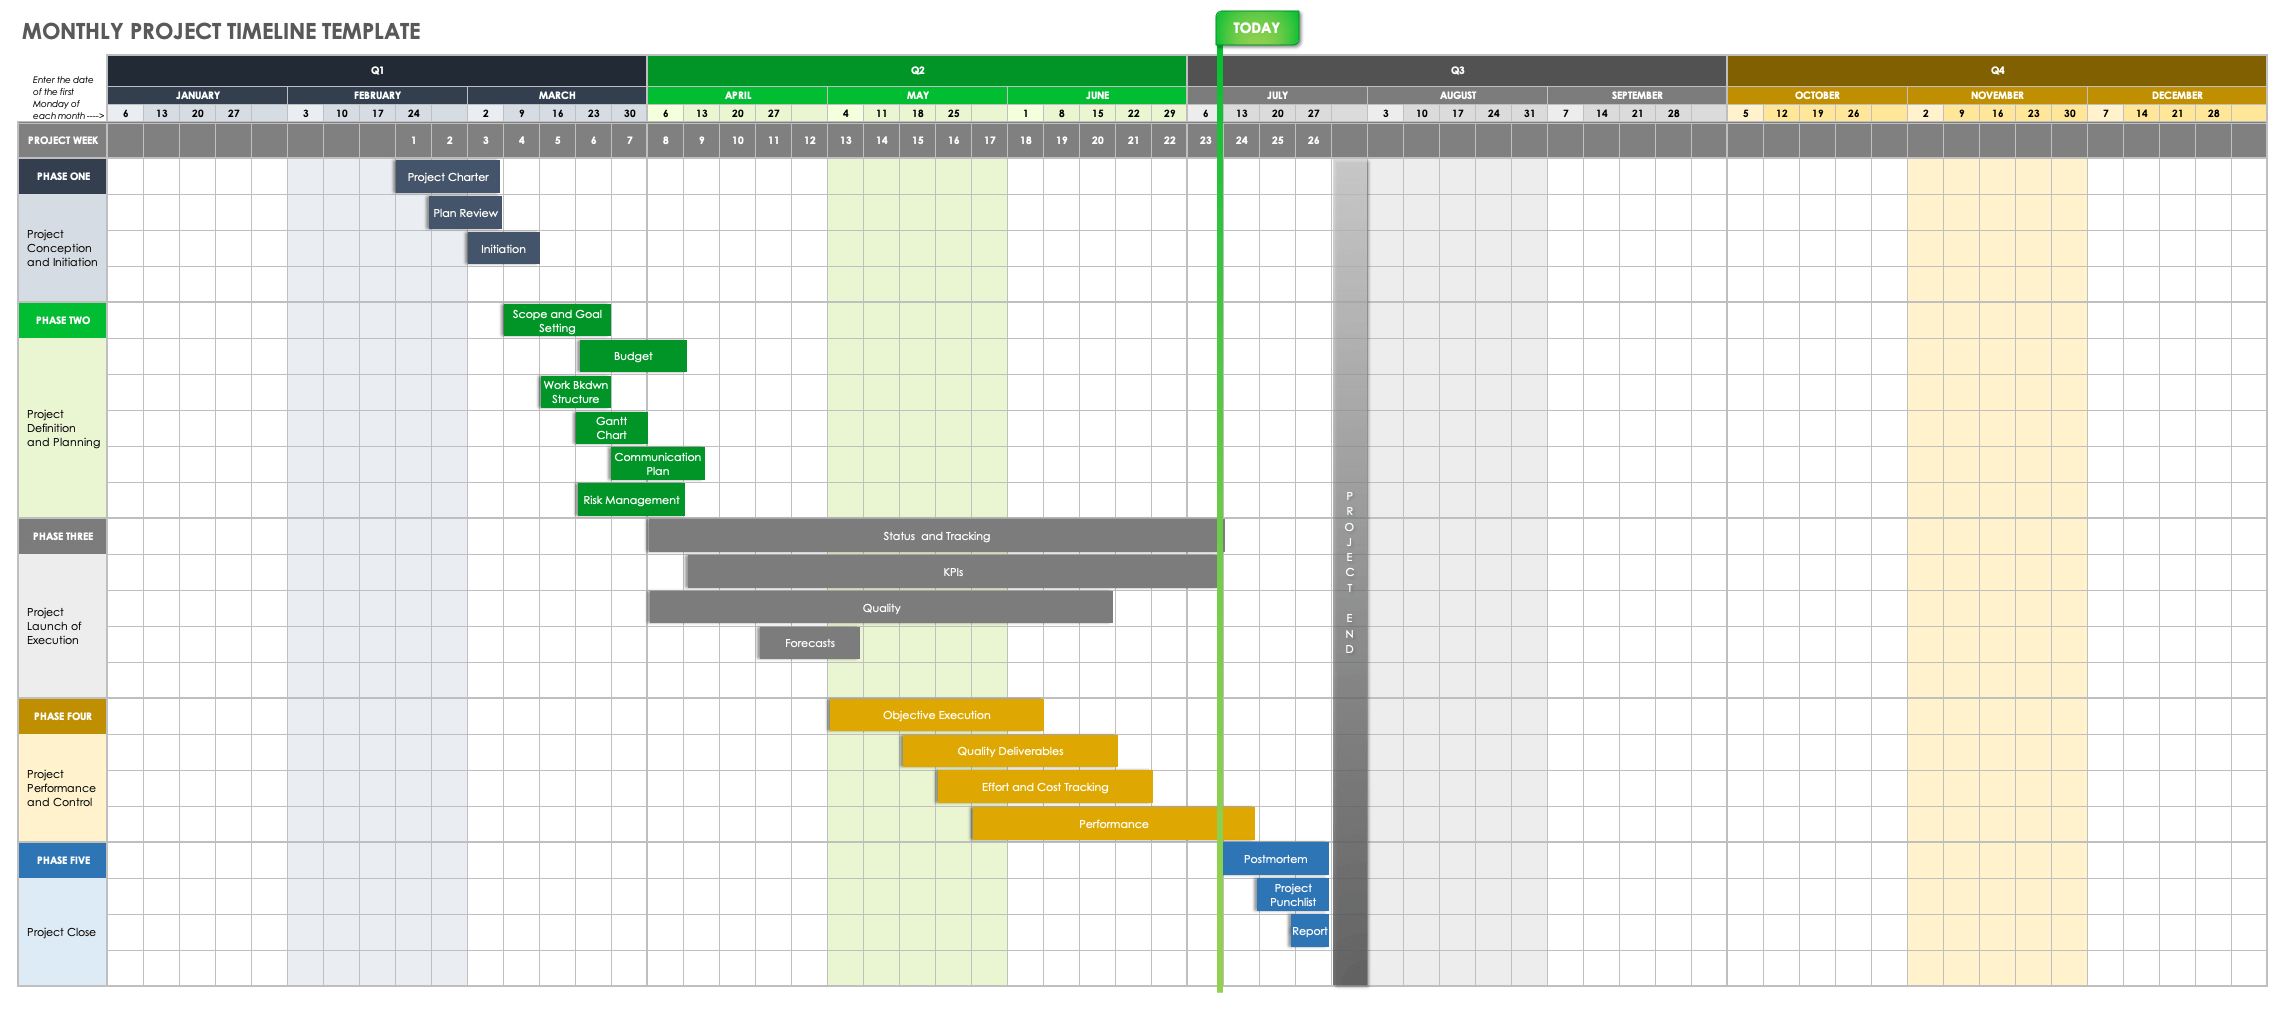
Download Monthly Project Timeline Template – Microsoft Excel
Create accurate month-by-month project plans and track the progress of deliverables with this color-coded, monthly project timeline template. The template includes five horizontal Phase swimlanes in which to capture your project’s various tasks. Plan tasks within their respective stages by plotting them on the timeline and setting start and end dates for each. This fully customizable template is the perfect fit for project teams that want to plan and execute their tasks on a monthly basis and quickly view their project’s cascading progress in its entirety.
Weekly Project Timeline Template
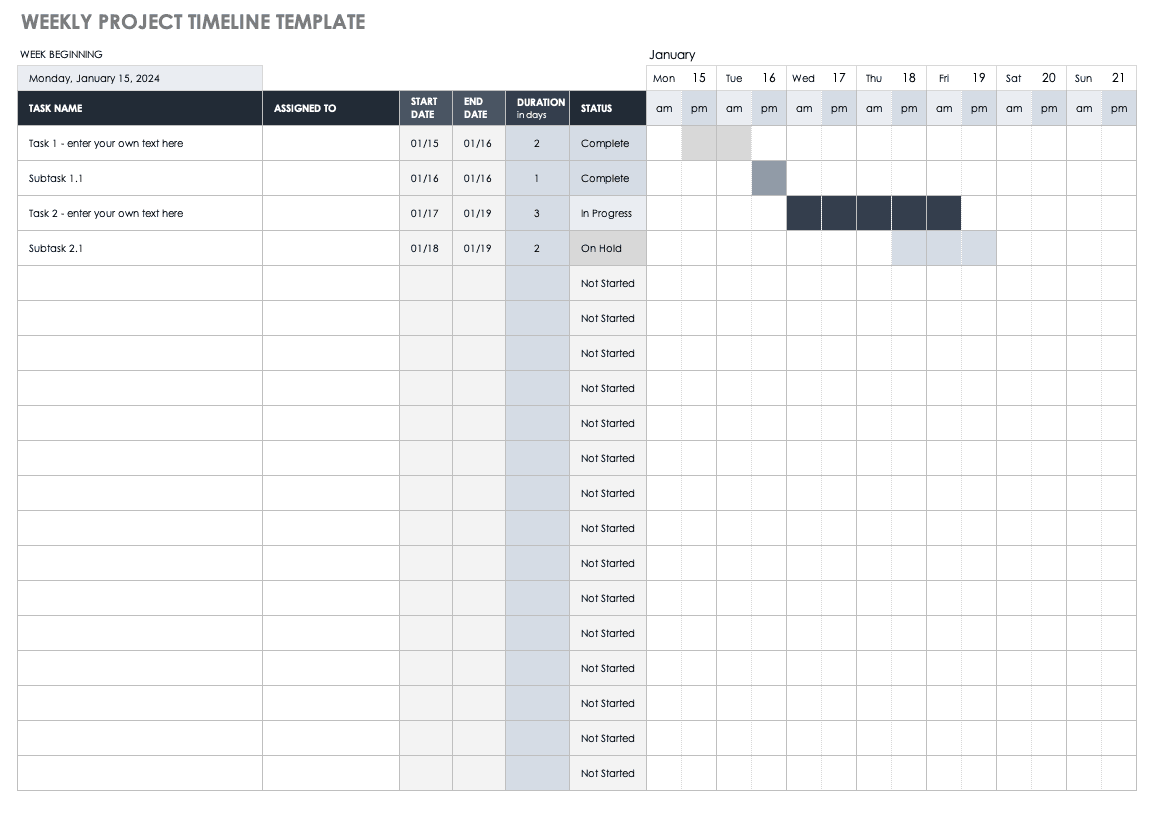
Download Weekly Project Timeline Template – Microsoft Excel
Easily manage the week-to-week logistics of your project tasks with this dynamic weekly project timeline template. Enter task names, their start and end dates, durations, and current status (e.g., Not Started, In Progress, Complete, or On Hold) so any team member can quickly determine how close a task is to completion. The template is ideal for teams undertaking single-week sprints or who want to keep tabs on week-by-week task interdependencies, while also viewing overall project progress.
Yearly Project Timeline Template
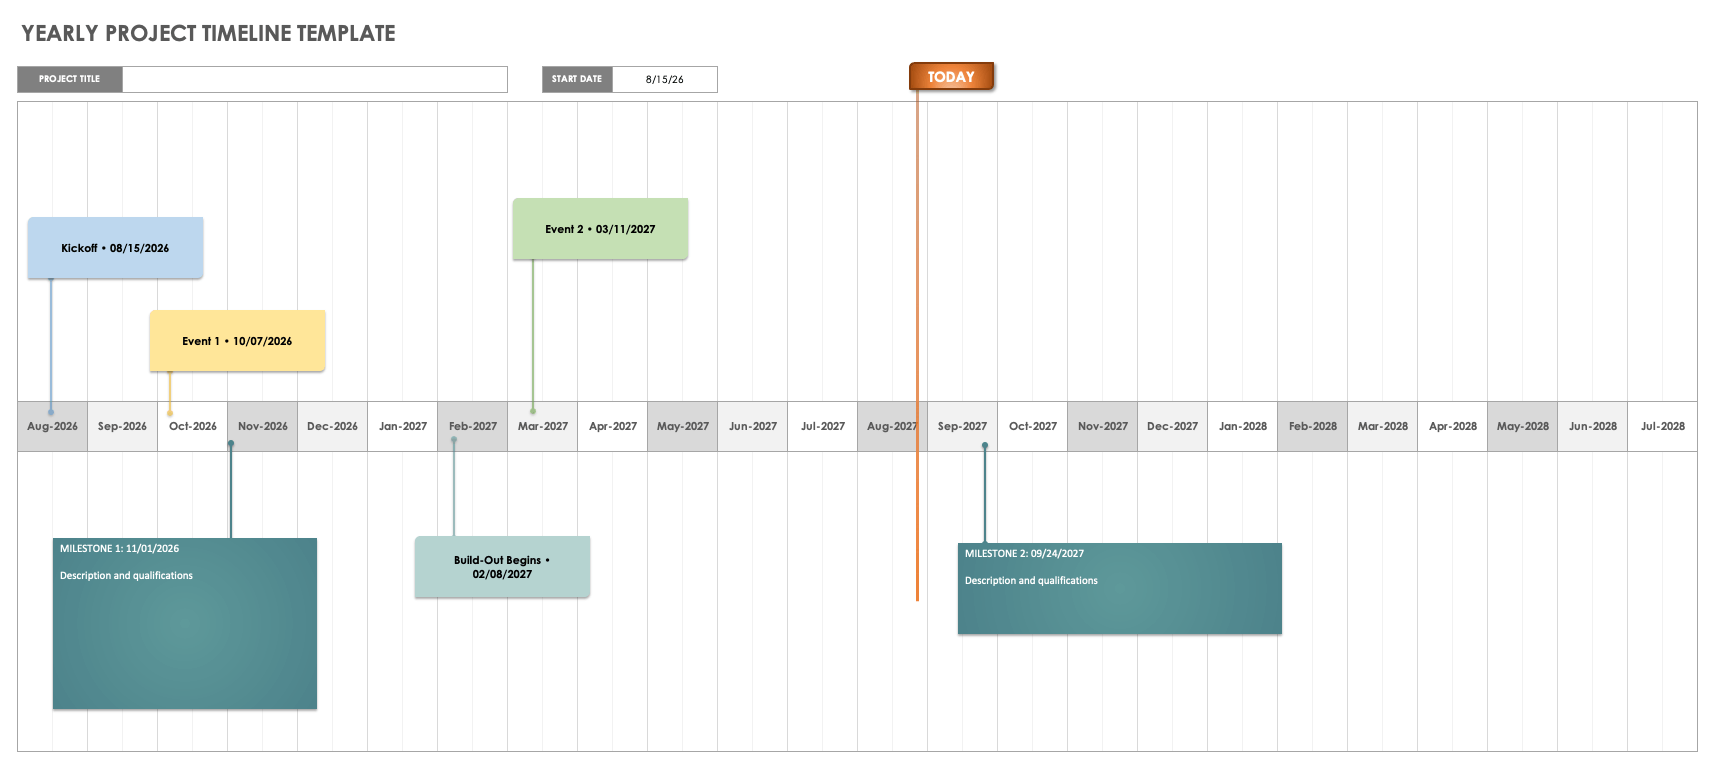
Download Yearly Project Timeline Template – Microsoft Excel
Capture your project’s key milestones with this high-level, yearly project timeline template. Simply add descriptive text for each milestone, its delivery date, and any other relevant details, and arrange them chronologically on the horizontal timeline. This template is the perfect tool to help you prioritize tasks visually and ensure the timely delivery of your team’s long-term projects.
IT Project Timeline Template
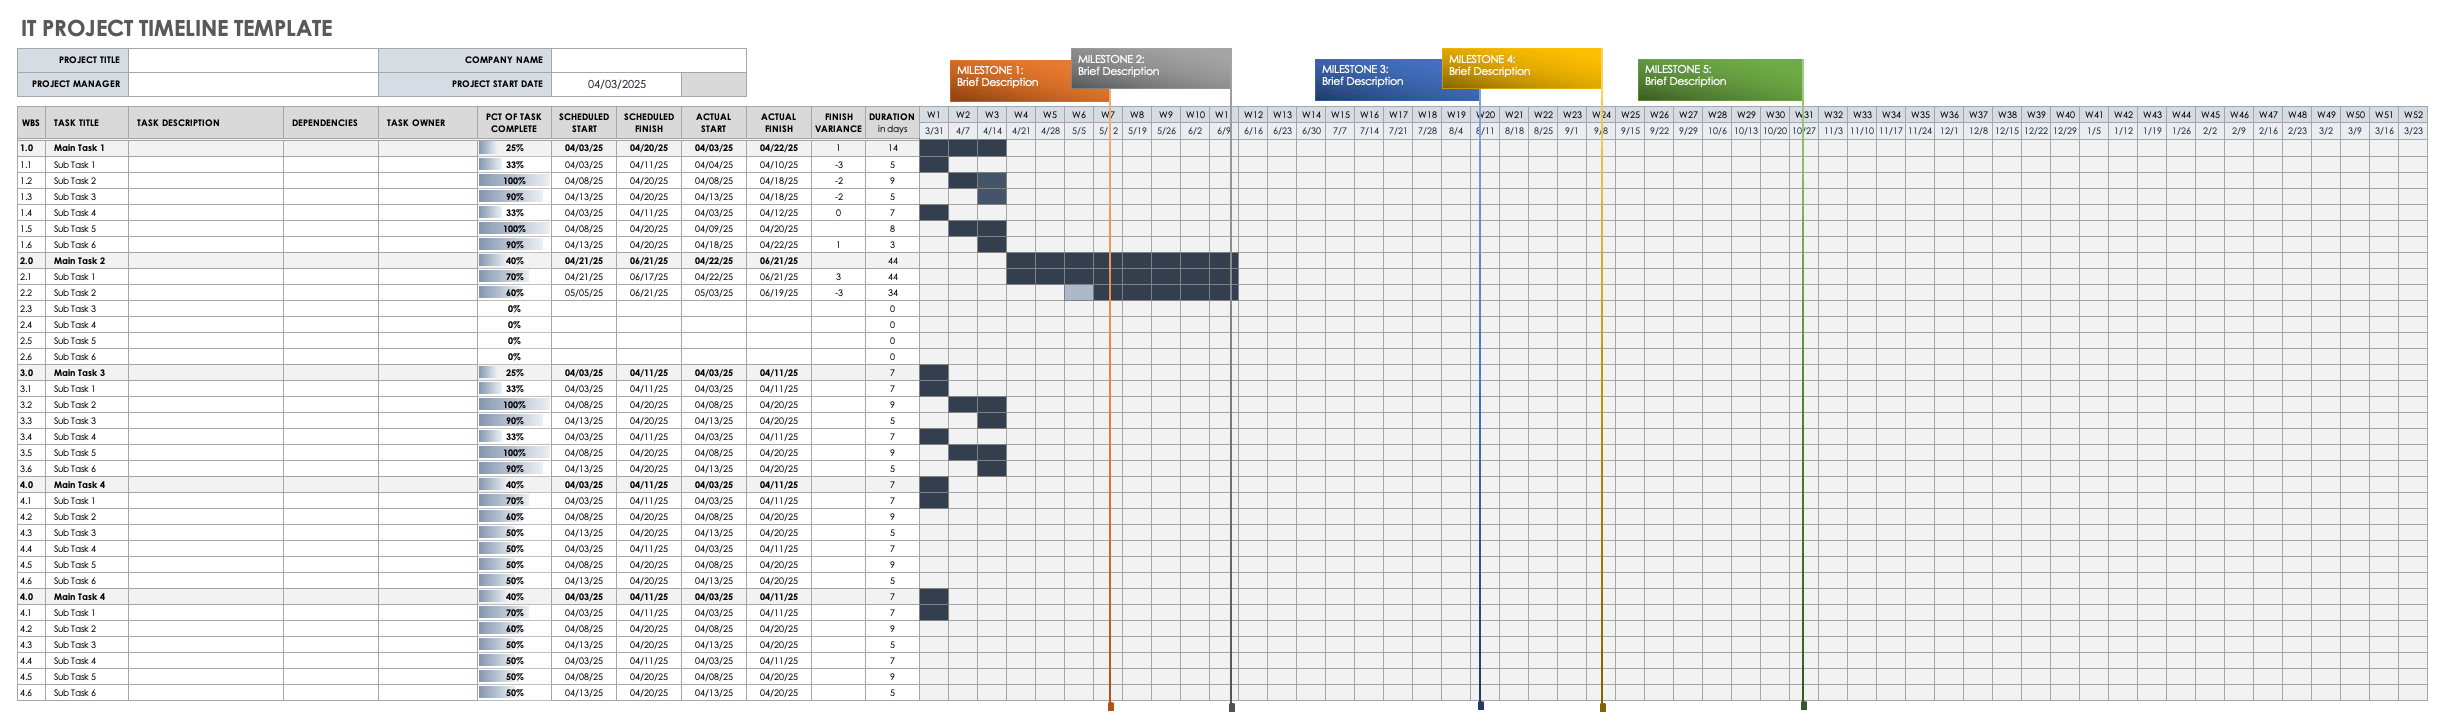
Download IT Project Timeline Template – Microsoft Excel
This IT project timeline template provides a comprehensive structure for everything you and your IT department need to plan and successfully complete IT projects. The template includes rows where you can list each project task, subtask, work breakdown structure (WBS), description, dependencies, and task owners. Schedule project task start and finish dates, compare the variances between proposed and actual finish dates, and enter the percentage complete of each task. The template also allows you to add visually compelling milestones to its weekly calendar section.
Project Tracker Timeline Template
![]()
Download Project Tracker Timeline Template – Microsoft Excel
Use this dynamic project tracker timeline template to keep tabs on the deadlines, priorities, and statuses of each project task. Enter task name, description, assignee, deliverable, percentage complete, and estimated hours to complete. Team members can refer to the Status Key and Priority Key legends to help determine whether prioritized tasks are at risk of not being completed and how close the entire project is to successful completion.
Project Milestone and Task Timeline Template
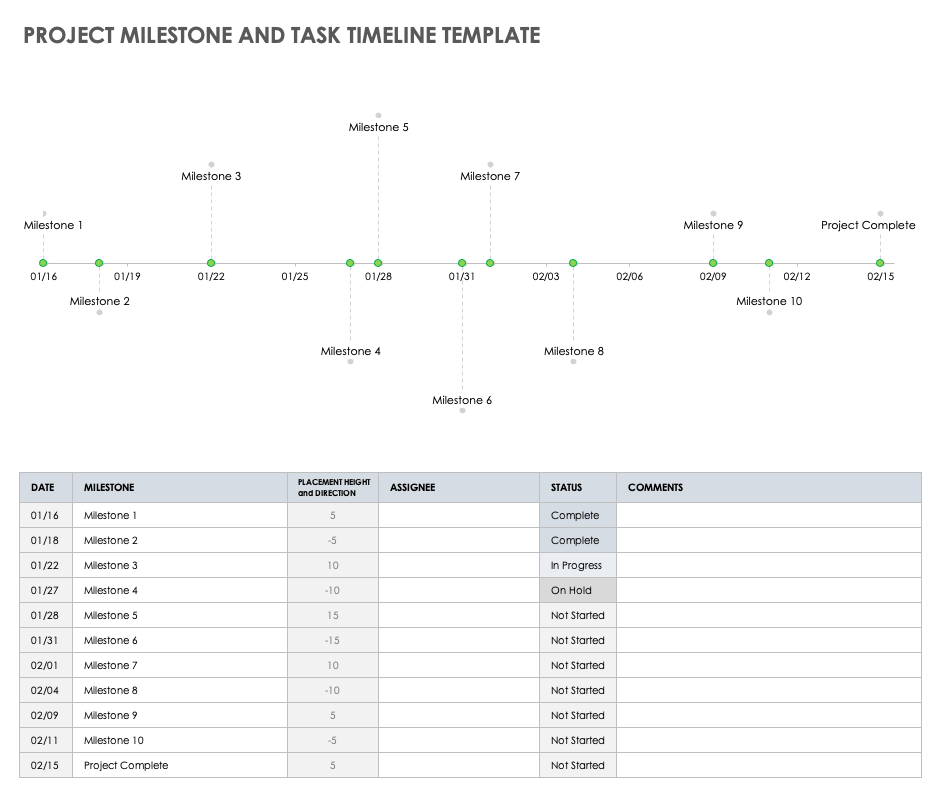
Download Project Milestone and Task Timeline Template – Microsoft Excel
This timeline template provides you with a milestone-driven, visual illustration of your project’s primary events and their statuses. While many templates break project goals into individual tasks and subtasks, this template’s emphasis is on crucial project milestones. By referring to this visually rich timeline, any project team member can see, at a glance, if a scheduled milestone has been started, is in progress, is on hold, or has been completed.
Project Timeline Gantt Chart Template
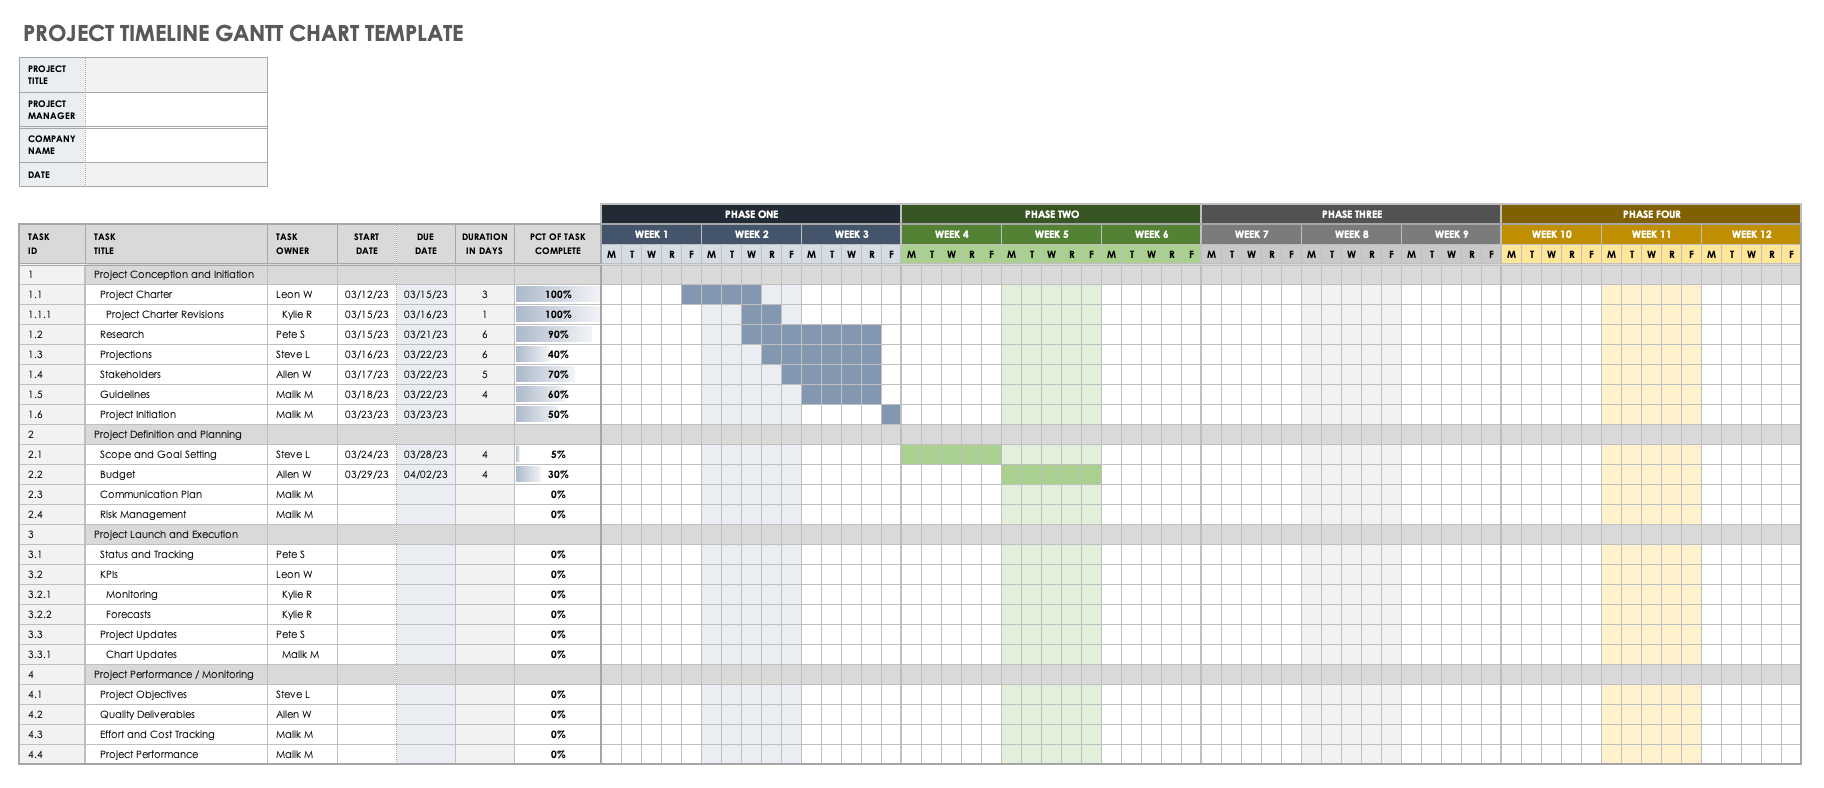
Download Project Timeline Gantt Chart Template – Microsoft Excel
Provide team members with a proactive project timeline by using this all-inclusive, dynamic project timeline Gantt chart template. Break project goals down into achievable tasks, then assign task owners, and set start and end dates for each. Customizable, color-coded phase columns visually guide you through the sequential process of planning and successfully executing your project.
Agile Project Timeline Template
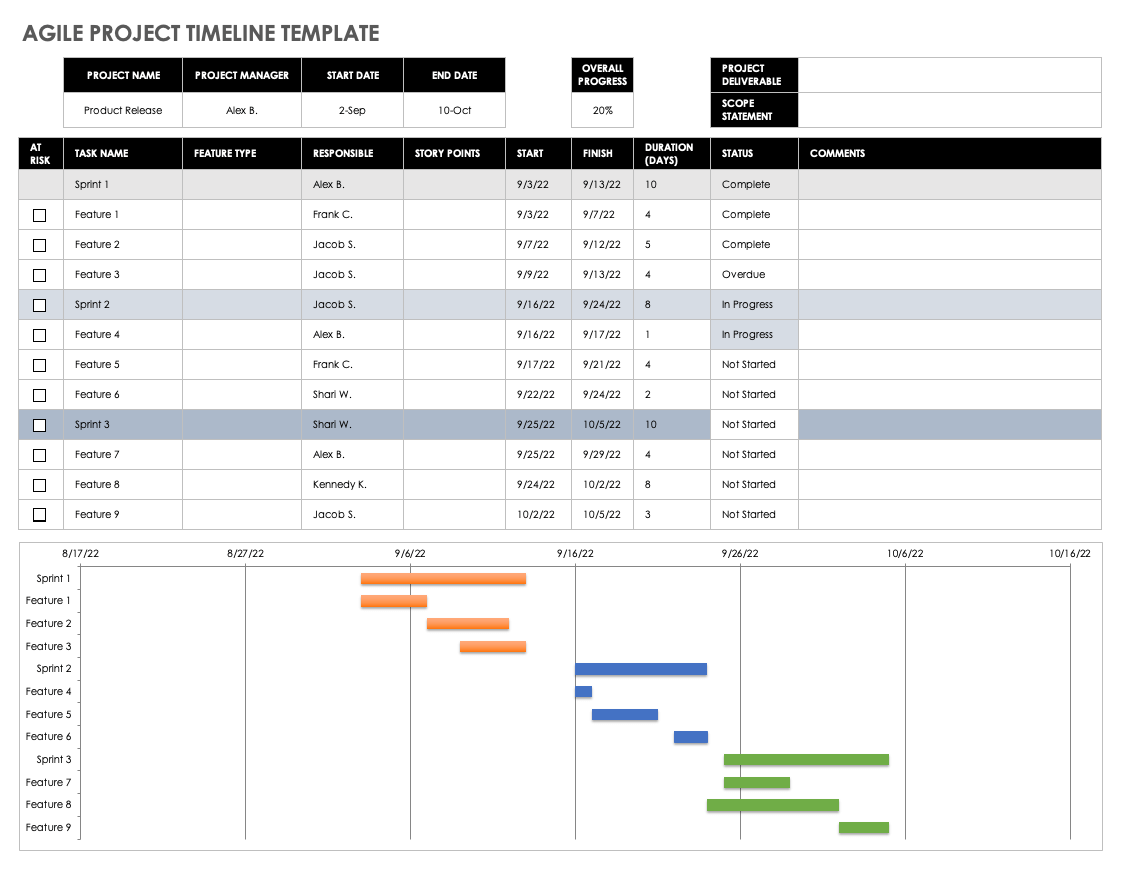
Download Agile Project Timeline Template – Microsoft Excel
This Agile-specific project timeline is the perfect tool for Agile teams to perform sprint-by-sprint task scheduling and monitoring. The template enables you to assign a weight or story point to each task during Program Increment (PI) Planning, and update their statuses as your project progresses. An Overall Status section helps you keep track of overall project status so that you’re on track for on-time project completion.
Daily Project Timeline Template
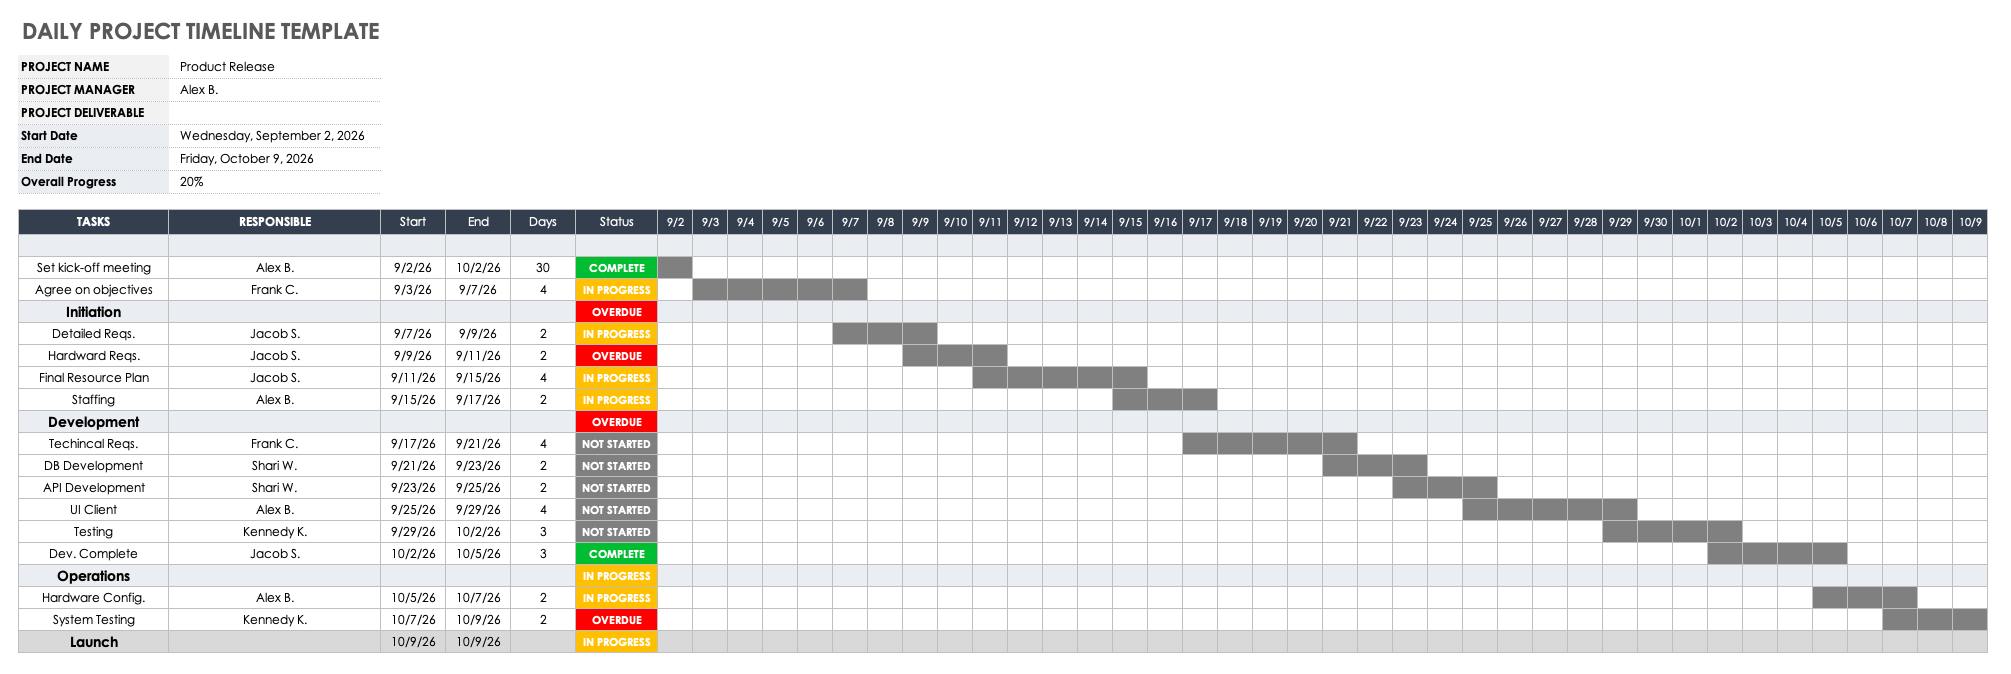
Download Daily Project Timeline Template – Microsoft Excel
Clearly communicate your project’s deliverables and deadlines on a day-by-day basis with this daily project timeline template. Update the template frequently with overall project and individual milestone statuses so that all team members and stakeholders stay up to date on project progress. Enter the details, owners, due dates, and current statuses for each task in the appropriate field. This template is the perfect fit for teams working on short deadlines that need frequent updates on project status.
Hourly Project Timeline Template
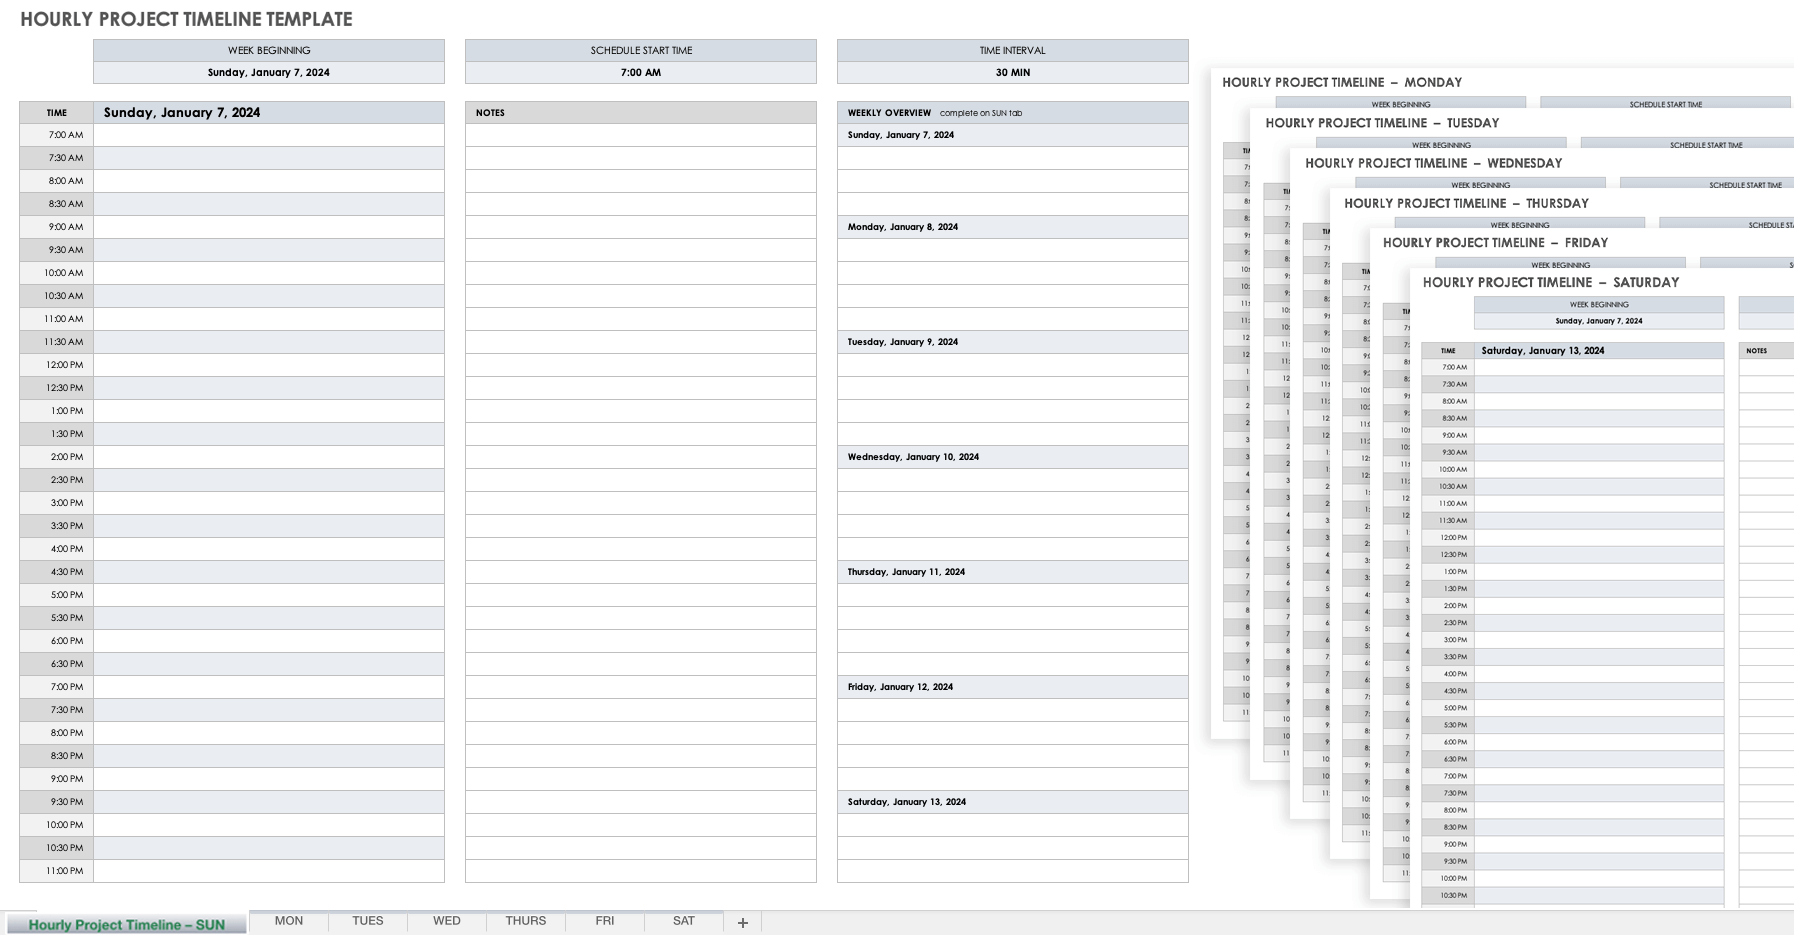
Download Hourly Project Timeline Template – Microsoft Excel
Break down your project’s work days into hourly tasks with this simple hourly project timeline template. For each task, you can easily add the task owner, start and end time, and current status. The template also includes a visual day-by-day bar chart to show you the progress of each project task across any designated time period.
Six-Month Project Timeline Template
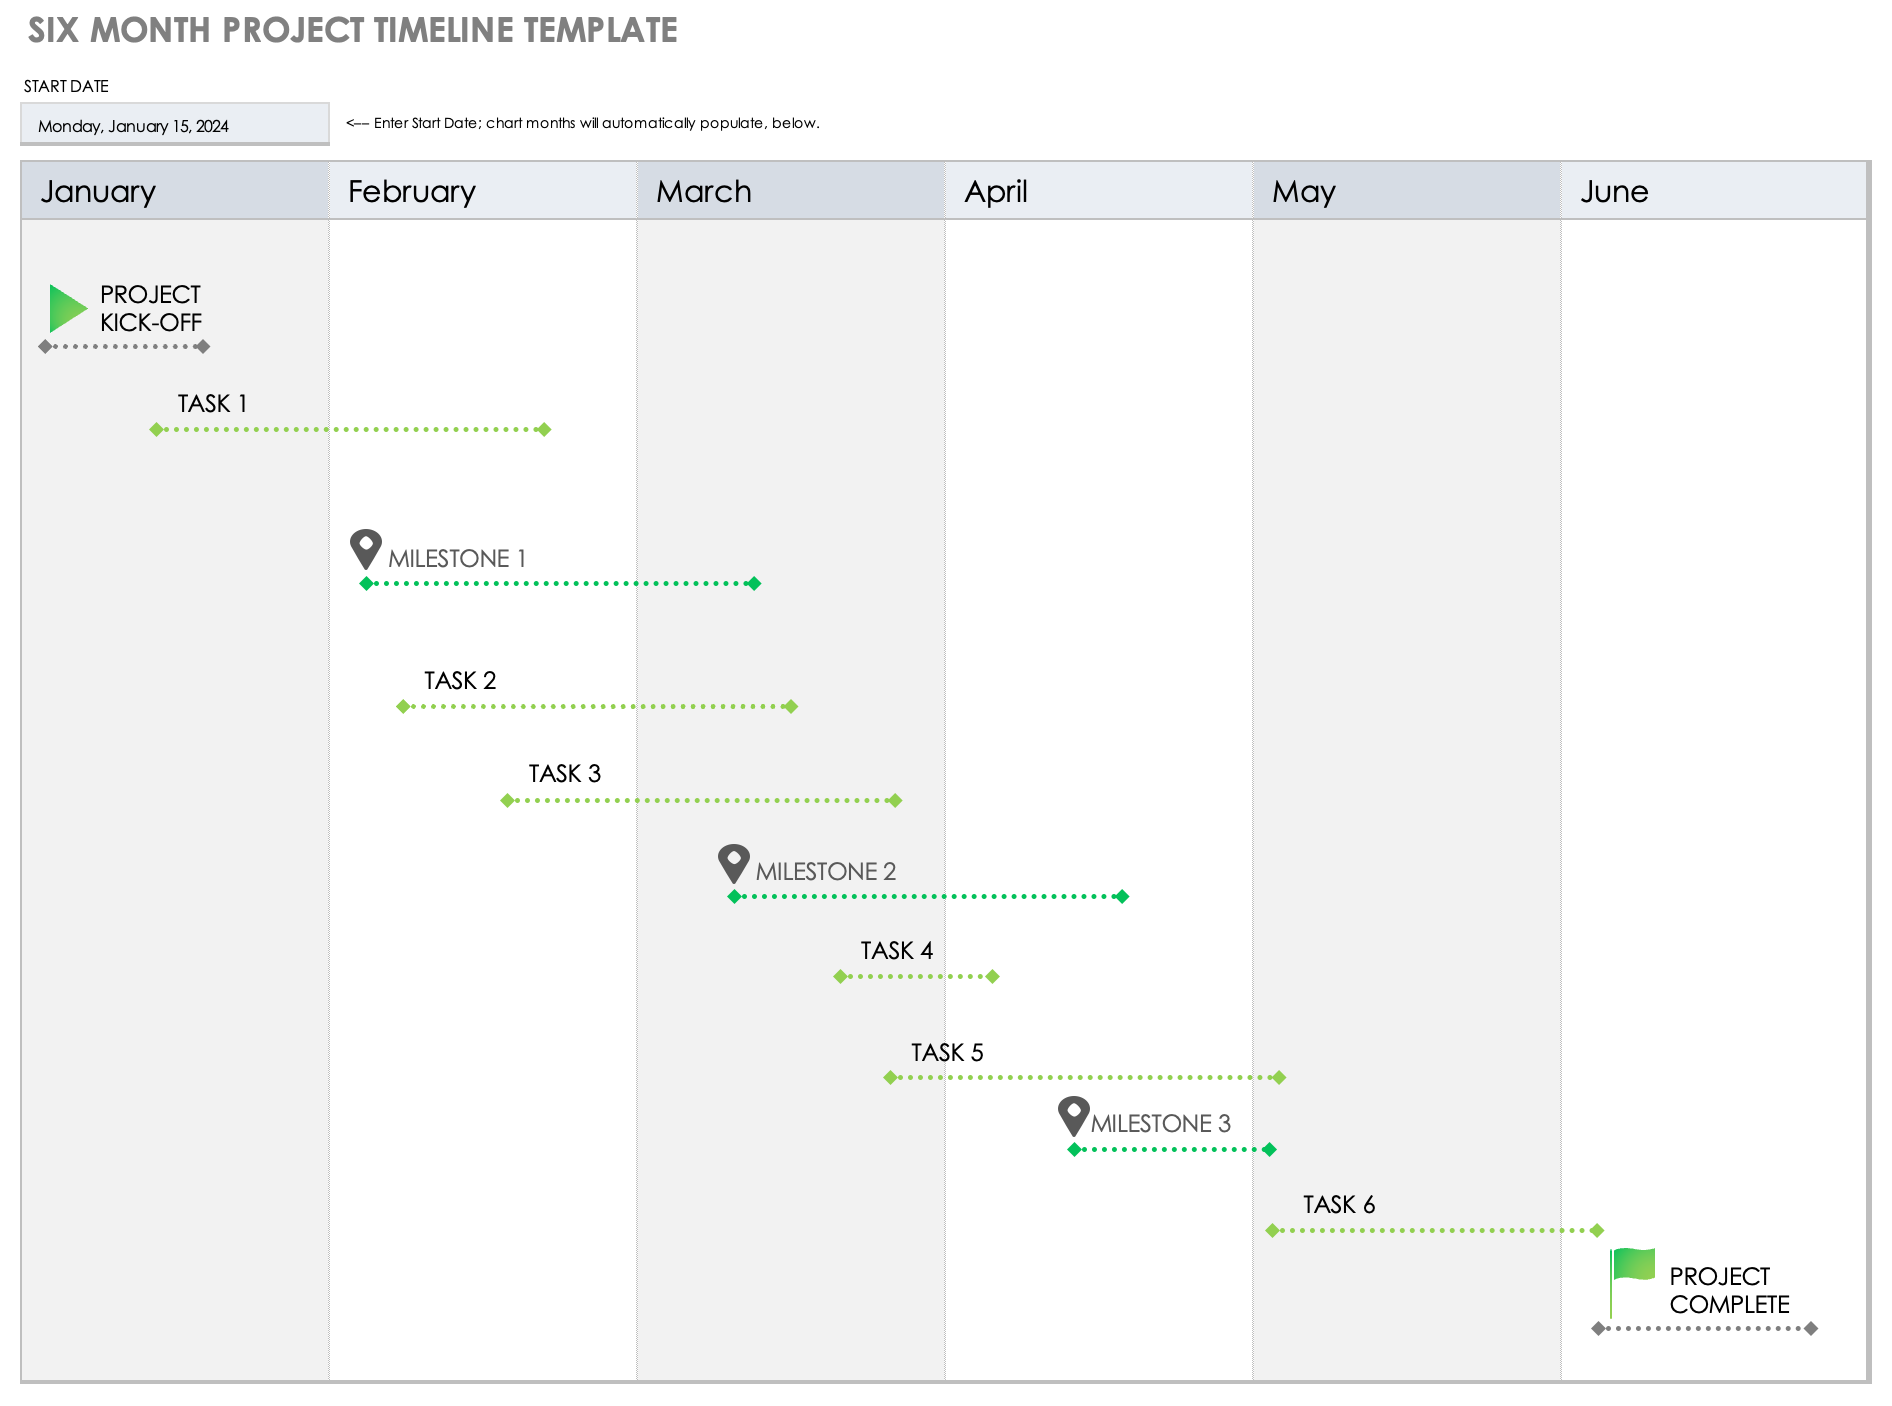
Download Six-Month Project Timeline Template – Microsoft Excel
Track project tasks and milestones across a six-month period with this easy-to-use, broad-strokes project timeline template. List project start and end dates, and add project tasks to this visually dynamic timeline. The template includes example text for primary project actions (e.g., Project Kick-Off or Project Complete) and milestones so you can ensure that you capture all of your project’s deliverables.
Three-Month Project Roadmap Template
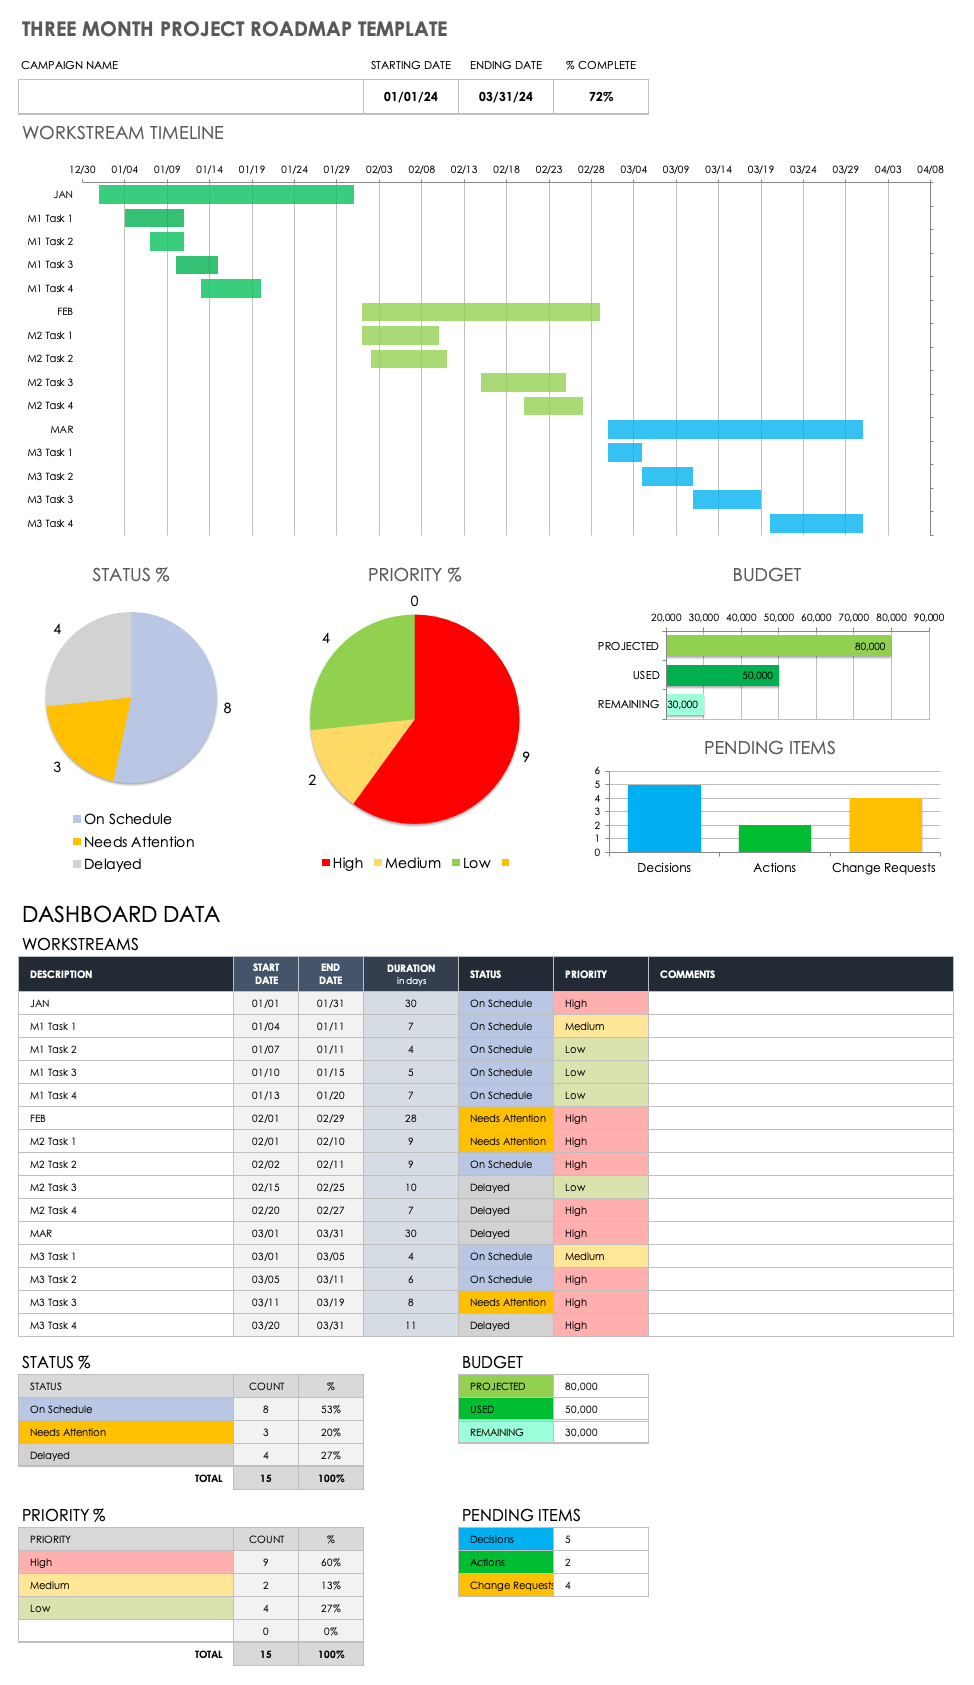
Download Three-Month Project Roadmap Template – Microsoft Excel
This dashboard-style three-month project roadmap template helps you capture your quarterly project goals with both a visually dynamic bar chart workstream timeline and project task Status and Priority pie charts. Enter task details under the template’s Workstreams section, including to-do task items, start and end dates, and task duration. Status Percentage and Priority Percentage tables give team members at-a-glance insight into overall project status and what tasks remain for successful project delivery.
Construction Project Timeline Template
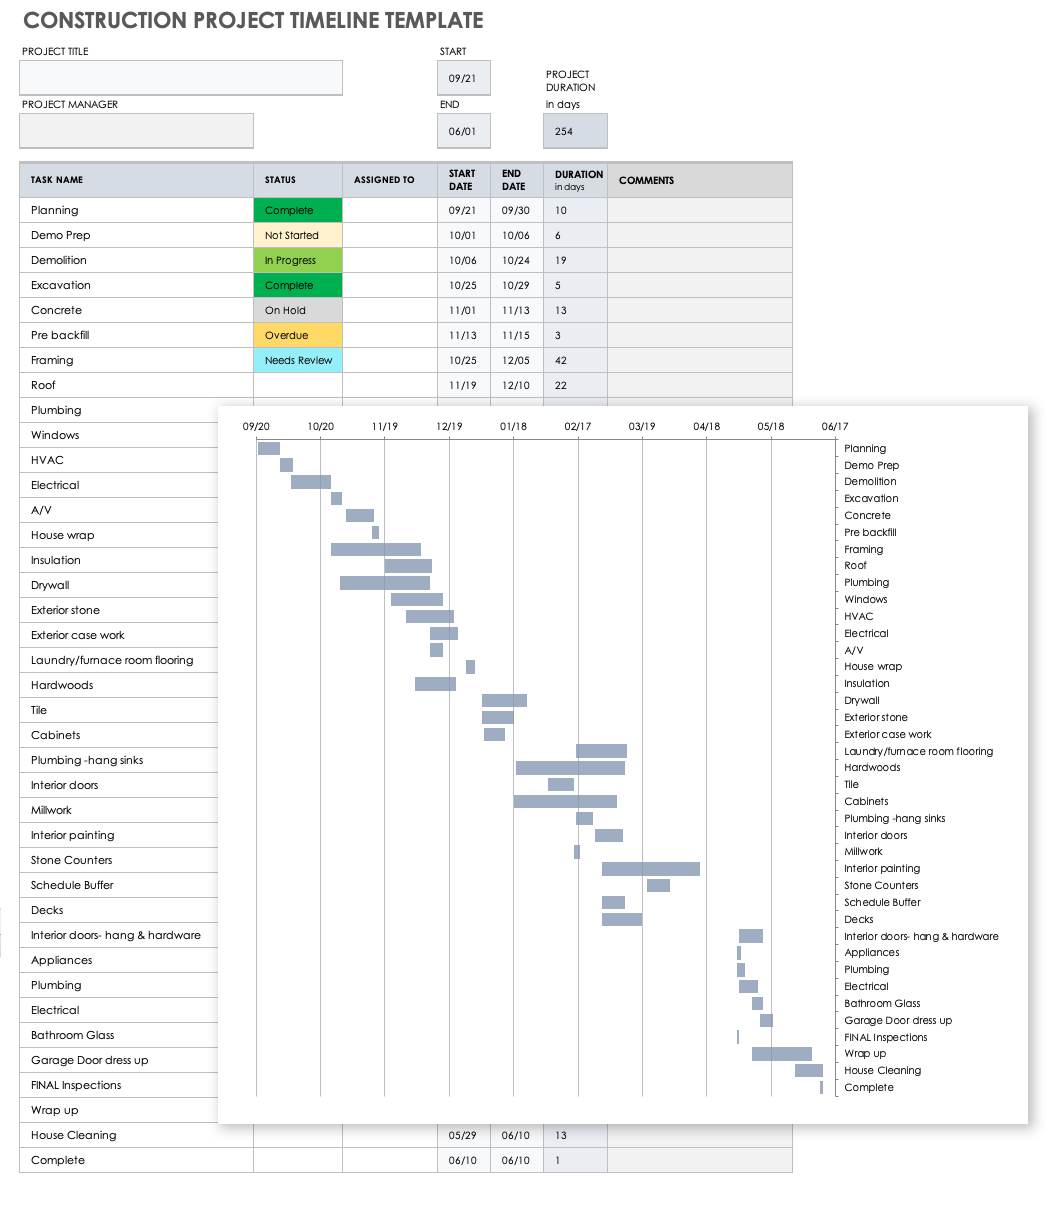
Download Construction Project Timeline Template
Microsoft Excel | Smartsheet
Ensure that you and your construction team are on track to complete all required project tasks with this construction project timeline template. The template includes pre-filled sample tasks, such as excavation, concrete, framing, plumbing, HVAC, and electrical, to help aid in quick and comprehensive construction project planning. This template is the perfect fit for construction project managers who need a project plan that can facilitate timely task completion and that they can easily present to project stakeholders.
For additional resources and to get the most out of your construction project planning timelines, see this article on Microsoft Excel construction management templates.
What Is an Excel Project Timeline Template?
An Excel project timeline template is a visually dynamic tool that project managers can use to plan and monitor project progress. Use the template for a visual representation of your project’s goals, scope, and tasks to ensure timely project delivery.
As the primary vehicle for managing your project’s deliverables, a project timeline template provides a comprehensive method for tracking project tasks, assigning them to team members, setting delivery dates, and monitoring their progress. Timeline templates also serve as a roadmap for your project so that all stakeholders are aware of project goals. Use a project timeline template to add key project milestones so that it’s clear during project planning what primary actions or events need to be met, and when.
With its horizontal bar chart, a project timeline provides team members with a clear visual map of individual task delivery dates, priorities, and current statuses, as well as whether or not they have task dependencies.
While project timeline templates may vary, most of them include the following components to ensure that you account for everything on your project roadmap:
- Project Name: Enter the name of the project that you and your teammates will be undertaking.
- Task Name: Provide a name for each project task that needs to be completed in order to meet the criteria for project success.
- Task Owner: Assign the team member who is responsible for completing each individual project task.
- Start Date: Enter the date that each individual task needs to be started.
- End Date: Set the date for when the individual task must be completed.
- Duration: Review the task duration, which is calculated by each task’s defined start and end dates.
- Status: Select a status for each individual project task (e.g., Not Started, In Progress, On Hold, or Complete).
- Milestone: Define your project’s time-sensitive milestones that must be met in order for the project to be successfully completed.
Additionally, some project timeline templates include the following components:
- At-Risk Tasks: Identify tasks that are in danger of not being completed, and notify relevant team members.
- Department: Include the name of any department responsible for a project task or phase, or the department on which a task or project phase has a dependency.
- Objectives or Goals: List the project’s key objectives, such as the problem it will address and what goals it must meet by project completion.
- Project Scope: Provide a brief description of what is in scope for the project. This includes all aspects of the project, including tasks, activities, departments, timeline overview, key deliverables, and milestones.
- Sprint: For Agile teams, clearly label each sprint on your project timeline so that team members can see which sprint-specific tasks must be completed within a specific timeboxed period.
- Stage or Phase: Break your project timeline down into stages that include key tasks for each phase of the project.
- Task ID: Provide a unique identifying number for each task on the project for easy reference.
Accurately Track Your Project Timelines with Smartsheet
From simple task management and project planning to complex resource and portfolio management, Smartsheet helps you improve collaboration and increase work velocity — empowering you to get more done.
The Smartsheet platform makes it easy to plan, capture, manage, and report on work from anywhere, helping your team be more effective and get more done. Report on key metrics and get real-time visibility into work as it happens with roll-up reports, dashboards, and automated workflows built to keep your team connected and informed.
When teams have clarity into the work getting done, there’s no telling how much more they can accomplish in the same amount of time. Try Smartsheet for free, today.
Want to learn how to create a timeline in Excel?
A project timeline is a record of all the important events and milestones in a project.
And like it or not, Microsoft Excel is still a commonly used tool for this purpose.
In this article, you’ll learn about what a project timeline is, how to create one in Excel, and a better alternative to the process!
Let’s get started!
What Is A Project Timeline?
A project timeline chart is a visualization of the chronological order of events in a project. It’s a series of tasks (assigned to individuals or teams) that need to be completed within a set time frame.
Here’s what a comprehensive project timeline chart contains:
- Tasks in various phases
- Start date and end date of tasks
- Dependencies between tasks
- Milestones
In short, it’s something your project team will refer to track what’s done and what needs to be done.
How To Create A Project Timeline In Excel?
There are two main approaches to create a timeline in Excel.
Let’s dive right in.
1. SmartArt tools graphics
SmartArt tools are the best choice for a basic, to-the-point project timeline in Excel.
Here’s how you can create an Excel timeline chart using SmartArt.
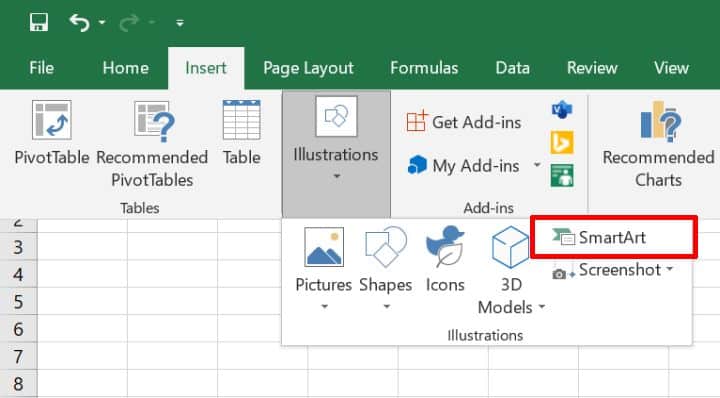
- Click on the Insert tab on the overhead task pane
- Select Insert a SmartArt Graphic tool
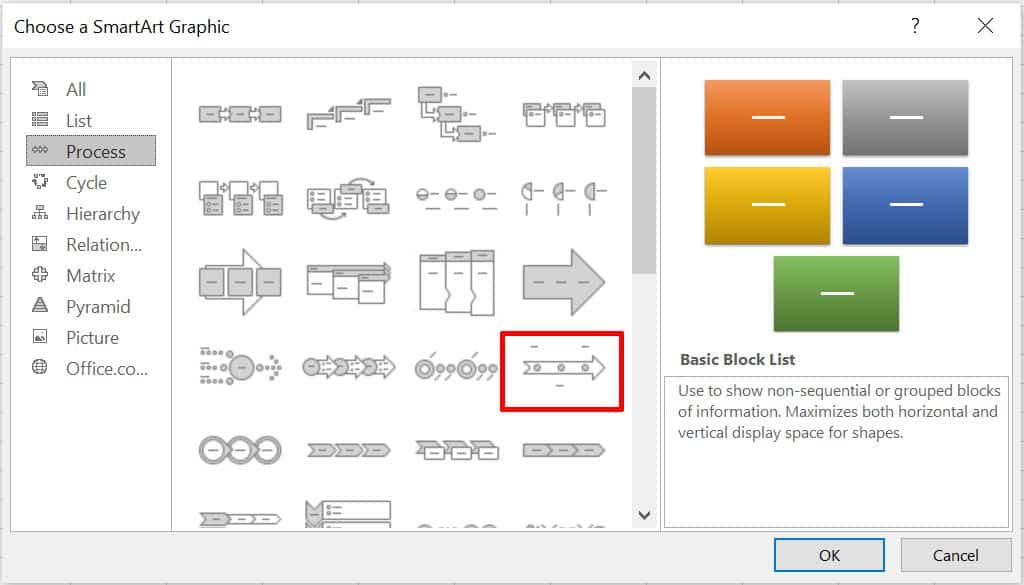
- Under this, choose the Process option
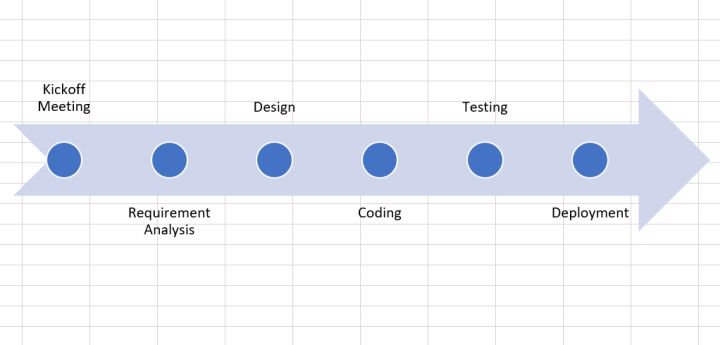
- Find the Basic Timeline chart type and click on it
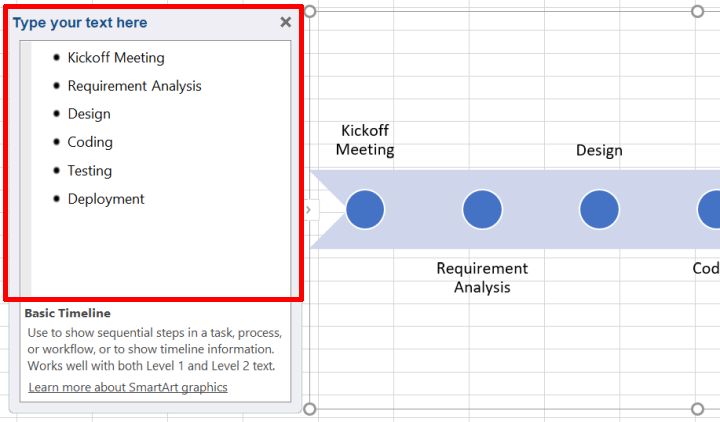
- Edit the text in the text pane to reflect your project timeline
Add as many fields as you want in the SmartArt text box by simply hitting Enter in the text pane to open up the respective dialog box.
Excel also lets you change the SmartArt timeline layout after you’ve inserted the text.
You can change it to a:
- Line chart
- Basic bar chart
- Stacked bar chart
And of course, feel free to play around with the Excel chart color schemes in the SmartArt Design tab.

A SmartArt graphic is perfect for a high-level project timeline that displays all the important milestones. However, it may not be sufficient to display all the tasks and activities that lead up to them.
For this, your Excel dashboard will need something more complex: like a scatter plot Excel chart.
2. Scatter plot charts
Scatter plot charts display every complex data point at one glance.
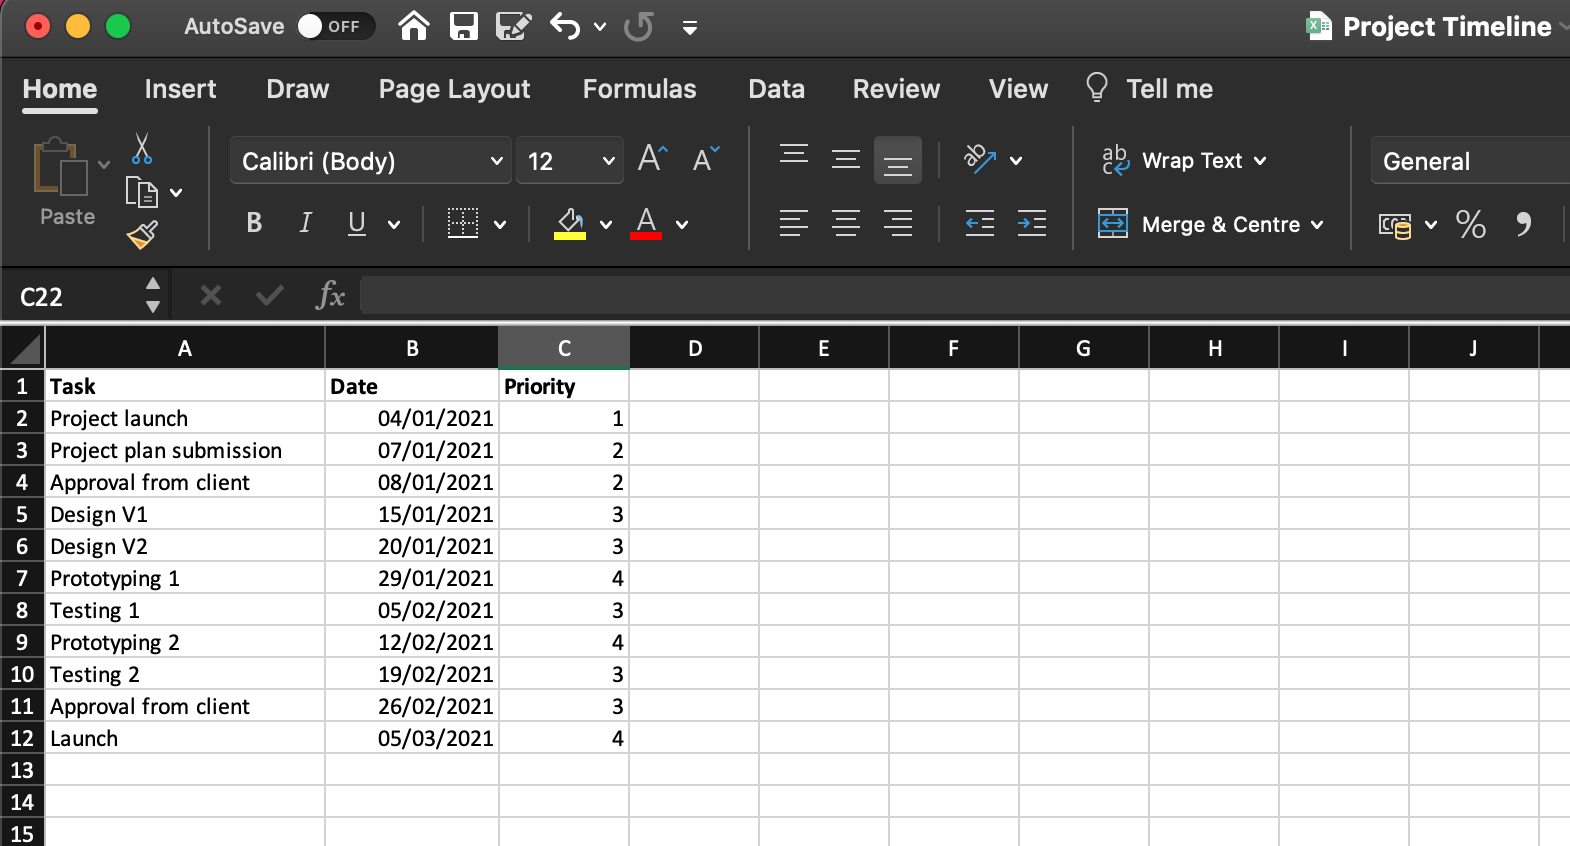
First, lay the foundation for the chart by making a data table with basic information such as:
- Task (or milestone) name
- Due date
- Priority level (1-4, in increasing order)
When you add dates, make sure your cells are formatted to reflect the correct date format. For example, DD/MM/YYYY, MM/DD/YYYY, etc.
Here’s what a sample data table looks like:
To generate a scatter plot chart from this:
- Drag and select the data table
- Click on the Insert tab in the top menu
- Click on the Scatter chart icon
- Select your preferred chart layout
Format this basic scatter chart to show your data even more clearly:
- Select the chart
- Click on the Chart Design tab on the overhead task pane
- Click on the Add Chart Element icon in the top left corner
- Add a Data Label and Data Callout
- Edit the chart title
Keep exploring to customize the scatter plot chart further.
While scatter plot charts are slightly more complex than a SmartArt graphic, they may still not be enough for your horizontal timeline.
And let’s not forget that the purpose of a project timeline is to manage time on a project. How’s one supposed to do that while attending Excel 101 classes to create a simple chart?
The answer lies in using a project timeline template:
3 Excel Project Timeline Templates
Don’t we all know an Excel wizard?
Someone who makes us feel like we skipped a class?
Well, now you can be one of them too!
Thankfully you won’t have to read moth-eaten books and sit in ancient libraries to become an Excel expert.
Just let an Excel project timeline template do the magic.
1. Excel Gantt chart timeline template
2. Excel timeline template for milestones
3. Excel project schedule template
An Excel template should ease your project timeline worries. For some time. 👀
Meanwhile, the clock is ticking on the long-term issues of Excel project management:
3 Limitations Of Using Excel To Create A Project Timeline
Excel is like the old t-shirt that you never want to give away.
Why should you?
It fits you just right and has the coolest hashtags!
But if you want to achieve audacious goals, you’ll need to move beyond both of them. 💔
Here’s why you need to move on from Microsoft Excel for your project timeline needs.
1. No individual to-do lists
Sure, being able to access gigantic spreadsheets and data series with conditional formatting is great.
But you know what’s better?
Something that tells you what you need to do.
After all, Excel can’t help you build a functional to-do list and assign it to individual team members.
Unless your idea of a team meeting is looking into your spreadsheet’s soul with a magnifying glass, Excel won’t cut it for to-do lists.
However, let’s say you physically type out each person’s deliveries in a sheet, you still have the problem of…
2. Manual follow-ups
In the age of customized app notifications and uber-smart reminders, Excel project management depends on manual follow-ups.
What will your strategy be? Email colleagues, conduct hourly check-ins, or tap on everyone’s shoulders to ask if they’re done with their task. 🤯
Not only is it terribly inconvenient (and frankly annoying) it gives you no idea about your project’s progress.
3. Non-collaborative
Do you work in a non-hierarchical Agile environment where the whole team is involved in the decision-making process?
Well, guess what?
An Excel file can’t handle this.
Microsoft Excel (and other MS tools like Powerpoint) believe in single ownership of documents with limited support for collaboration.
And that’s hardly the complete list of why Excel can’t deliver.
Read all about why Excel project management SHOULDN’T be your go-to solution.
Luckily, we can point you in the direction of smoother workflows and efficient project management.
Check out ClickUp!
Create Effortless Project Timelines With ClickUp
Excel is a smart, handy tool that’s also occasionally clunky and very intimidating.
But what if you could have a tool that can do everything Excel does, except far better?
The answer is ClickUp!
It’s an award-winning project management tool that ensures end-to-end project management without the need to toggle between windows.
Just use the Timeline view, Gantt Chart, and Table view to get a complete picture of your project timeline on ClickUp.
1. Timeline view
ClickUp’s Timeline view is for those who want more from their timelines!
It gives you more tasks per row and more customization options than you can imagine.
2. Gantt chart view
If you’re plotting a project timeline, chances are you’re also plotting a Gantt chart.
It’s one step above a linear timeline as it lets you visualize project progress (as opposed to just the scheduled tasks) and trace dependencies clearly.
And with ClickUp on your side, it’s never been easier to create a Gantt chart!
Simple Gantt Chart Template by ClickUp

Use ClickUp’s Simple Gantt Chart Template is a great way to plan out tasks and estimate how long they will take.
Easily view the relationships between tasks in an easy-to-read timeline, so you can quickly adjust resources when needed. Plus, all changes are synchronized across teams, making it simple to stay up-to-date with everyone’s progress.
Make the most of your Gantt chart experience by managing Dependencies.
- Draw lines between tasks to schedule dependencies
- Reschedule them with drag and drop actions
- Delete them by hovering over and clicking on the dependency line and then selecting Delete
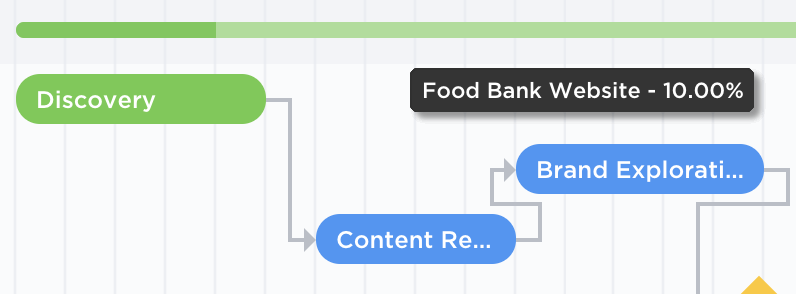
Find out the progress percentage of your project by hovering over the progress bar.
3. Table view
You may be wondering, “Hey, that all sounds good, but Microsoft Excel feels like home.”
That’s why we have the ClickUp’s Table view.

It’s a condensed look at your project timeline.
But you can also enhance it to show as much background information as you want.
Amp up your spreadsheet experience with these functions:
- Drag to copy your table and paste it into any Excel-type software
- Pin columns and change the row height for handy data analysis
- Navigate the spreadsheet with keyboard shortcuts
The Time’s Up For Excel Project Timelines!
Deadlines, coordination, reviews. Project time management is an endless struggle. And your project timeline is the one tool that helps you consistently navigate this.
Excel may seem like a simple way out, but it’s not the friendly, long-term companion it promises to be.
Try ClickUp for free today.
Related readings:
- How to create a timesheet in Excel
- How to create a form in Excel
- How to make a calendar in Excel
- How to create a Kanban board in Excel
- How to create a mind map in Excel
- How to create a KPI dashboard in Excel
- How to create a flowchart in Excel
- How to create a database in Excel
- How to Display Work Breakdown Structures in Excel
Содержание
- Timeline Templates for Excel
- Common Uses for Timelines
- Example Timeline Spreadsheets
- Project Timeline / Schedule ▶
- Vertical Timeline Using Shape Objects
- Description
- Project Timeline via Drawing Tools
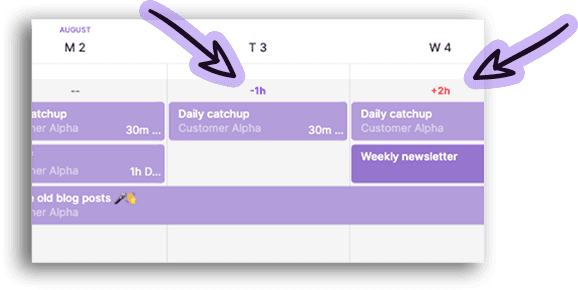
- Time Period Comparisons
- Automated Timeline Templates
- Bubble Chart Timeline Template ▶
- Excel Timeline Template ▶
- Vertical Timeline ▶
- Google Sheets Timeline Template ▶
- Project Timeline Template ▶
- Project Timeline Chart ▶
- References
- Cite This Page
- Project Timeline Template
- Project Timeline Template
- Using the Project Timeline Template
- Project Timeline Chart
- Description
- Use a Graphic as a Data Point Marker in a Project Timeline
- Steps for using a graphic as a data point marker:
- 3 Ways To Create A Project Timeline In Excel (+ free template)
- How to create a timeline in Excel using SmartArt? (and for what purpose)
- SmartArt Graphics Timeline In Excel: for what purpose?
- Create your SmartArt timeline
- How to Create an Excel Timeline Using a Scatter Chart? (and for what purpose)
- Scatter chart timelines in Excel: for what purpose?
- Create your scatter chart timeline in Excel
- How to Create a timeline in Excel using Timeline Templates?
- Create your timelines with Excel Templates
- Pros & Cons Of Excel Timelines
- What makes Excel an interesting project timeline maker…
- … and why you might need something that’s built for project planning and work management
- So, what then? What’s the alternative?
- Meet Toggl Plan. The best way to create visual project timelines.
- Create beautiful timelines for complex projects
- Don’t overwork yourself, or your team.
- Collaborate with your teammates
- Drag and drop your projects
Timeline Templates for Excel
A timeline can be a useful way to visualize changes or events that occur over periods of time. Excel can be a great tool for creating timelines, particularly when you want to perform date calculations or take advantage of the drawing tools in Excel. See below for some example timeline templates to help you get started.
Common Uses for Timelines
- Display a project schedule.
— Deliverable dates — Milestones — Task completion — - Chronologically arrange past events.
— Innovations in science between 1800 and 2000 — World history — - Represent a person’s life history.
— Depiction of life events along with historical time periods or local events — - Map historic events and time periods.
— History of the universe — Theory of evolution — Geologic time —
Example Timeline Spreadsheets
 Project Timeline / Schedule ▶
 Project Timeline / Schedule ▶
 This project schedule template can be used for creating nice looking project timelines. It is very similar to a gantt chart but it doesn’t have all the features that a typical gantt chart would have.
Vertical Timeline Using Shape Objects

License: Private Use (not for distribution or resale)
Author: Jon Wittwer
Description
I like using Excel has a drawing canvas, especially for timelines, because the canvas is nearly infinite in size. A vertical timeline is easy to create using shape objects (lines, text boxes, callouts, etc.). You can use this template to give you a head start. Format a shape or callout the way you want and then use copy/paste to duplicate the shape and add your events.
Project Timeline via Drawing Tools
A Gantt chart is typically used in business and engineering to plan and schedule projects. If you need a special format for a project timeline, you can create one using the drawing tools in Excel. This spreadsheet below contains two example project schedules.
Time Period Comparisons
In history and geneological research, timelines are particularly useful for comparing events and people’s life spans. This example spreadsheet uses stacked bar charts to compare a few different people living before and during the civil war. If you do genealogy research, you may want to try the Family Tree Template, also.
Automated Timeline Templates

Horizontal Bubble Chart Timeline
Bubble Chart Timeline Template ▶
(For Excel 2013+) Learn how to create a timeline using a Bubble Chart! The axis labels can be customized easily and the bubbles for the axis and timeline events can be different sizes.
Excel Timeline Template ▶
 Excel Timeline Template ▶
 Create a historical or project timeline quickly and easily using this original Vertex42 timeline template. This page was originally an article explaining how to create a timeline using an XY chart and error bars for leaderlines, but now you can download the time line template and get a huge head start on your project!
Vertical Timeline ▶
 Vertical Timeline ▶
 Create a dynamic vertical timeline in Excel using a scatter chart, data labels, and leader lines. Download the template or follow the instructions to create the timeline from scratch.
Google Sheets Timeline Template ▶
 Google Sheets Timeline Template ▶
 Create a horizontal or vertical timeline in Google Sheets using a scatter chart and data labels.
Project Timeline Template ▶
 Project Timeline Template ▶
 Create a project timeline in Excel using a stacked bar graph and different colors for different phases or categories. Great for high-level project timelines.
Project Timeline Chart ▶
 Project Timeline Chart ▶
 Create a project timeline showing both milestones and tasks, using a scatter chart with data labels and leader lines.
References
- Create a Timeline in Excel — Vertex42.com — This is my article about various techniques for creating timelines using Excel.
- Make a Timeline Using SmartArt graphics — support.microsoft.com — I haven’t tried this approach yet, but it looks interesting.
Cite This Page
To reference this page, please use something similar to the following citation:
Источник
Project Timeline Template
A project timeline can be created in Excel using charts linked to data tables, so that the chart updates when you edit the data table. The first template on this page uses a stacked bar chart technique and also includes up to 4 milestones as vertical lines. This template is a cross between my project schedule and task list templates. I’ve populated the template with some generic product development terminology, but it is designed for you to enter your own tasks and dates. The second template uses a scatter chart with data labels and leader lines to create a more traditional type of timeline.
Project Timeline Template
«No installation, no macros — just a simple spreadsheet» — by Jon Wittwer
License: Private Use
(not for distribution or resale)
Using the Project Timeline Template
Grouping Tasks Using Different Colors: One of the key features of this template is the ability to choose a different color for the bars in the timeline via a drop-down box in the Color column. This makes it easy to identify the different phases or categories of tasks. You can insert and delete tasks by just inserting or deleting rows in the spreadsheet’s data table.
The example above shows some of the steps in a product development cycle (Concept Development, System Design, Detail Design, Testing and Refining, Production, etc.), with different colors representing different phases of the cycle. However, there are other ways to use this type of timeline. Another common way to group tasks within a project timeline is by key organization function, such as Marketing, Design, Testing, Manufacturing, Finance, Sales, Quality Assurance, Legal, etc.
Milestones: With any project timeline, you will most likely want to define at least a couple key milestones. In the above example you will see 3 milestones as vertical lines. You can edit the milestone labels and dates via the data table. The template lets you show up to 4 milestones. Adding more is possible but would require you to create the new data series yourself (you can’t just insert rows for more milestones like you can with the tasks).
Can I Add More Colors? This project timeline is set up to allow up to 6 different color choices. Adding more colors is possible, but that would require more Excel experience. Some general steps to follow to attempt adding more colors:
- Add a new column to the right of the current data table.
- Copy the formulas in the previous column into the new column.
- Select the timeline and drag the range marker to the right to include the new column.
- Add some data to see what color the new column uses and then update the column label.
- Update the list used for the data validation drop-down box in the Color column to include the new label.
Dates Not Changing in the Chart? To edit the range of dates shown in the chart, you need to edit the Minimum and Maximum bounds of the horizontal axis. Right-click on the axis and select Format Axis.
Want More Flexibility / Ease of Use? If you don’t care about automation and just want a simple way to create a high-level project timeline, you might want to try the Project Schedule Template. Colors are modified by just changing the background colors of the cells in the spreadsheet.
Project Timeline Chart
License: Private Use (not for distribution or resale)
Description
This project timeline uses two different scatter chart series to display milestones above the timeline and tasks with durations below the timeline. The durations are created using X Error bars. The length of the leaderlines for the tasks can be defined by the user to show task dependencies.
The vertical positions of the tasks and milestones are adjusted by the user. This may work great for some timelines, but if you have more than 20 tasks to show, you may be better of using a Gantt Chart.
This template is based on the original Vertex42 Excel Timeline Template, which was one of the first timeline templates developed for Excel using the technique of leaderlines and error bars for durations. This new project timeline works only in the more recent versions of Excel (2013 or later) because of the new feature in Excel that allows you to specify a range of cells for Data Labels.
To learn how to create a timeline using a scatter chart, see the video demos for the Bubble Chart Timeline and Vertical Timeline templates.
Use a Graphic as a Data Point Marker in a Project Timeline
You can add graphics to a project timeline to make it more interesting or visually appealing. For example, you may want to mark the final milestone with a finish-line flag, as shown in the image below. To do this, you will first need to create a graphic using your favorite image editing app, or download one. The diamond  and flag
  that I use in my project timelines were created from screenshots of common unicode characters.
Steps for using a graphic as a data point marker:
- Select a single data point by clicking on it and then clicking on it again.
- Right-click on the selected data point to open the Format Data Point task pane.
- Click on the Bucket > Marker > Marker Options > Built-in, then select the picture icon from the Type drop-down.
- Select the image from your computer.
To see other examples of using graphics in a timeline, see my original Timeline Template.
Источник
3 Ways To Create A Project Timeline In Excel (+ free template)
Last Updated: 20 August 2021 02 September 2022
We, humans, are visual animals.
In other words, the human brain will find it a lot easier to digest information that’s clearly communicated and displayed. For this reason, the visual component is essential when planning complex projects with many moving pieces.
Well, you’re in the right place to learn precisely how to do just that.
In this blog post, you’ll get a step-by-step process to create a timeline in Excel in three different ways to visually communicate your project’s schedule and create a powerful visual timeline to plan without getting a headache.
How to create a timeline in Excel using SmartArt? (and for what purpose)
For starters, what are SmartArt graphics?
SmartArt Graphics Timeline In Excel: for what purpose?
Microsoft Excel’s Smart Art feature makes it reasonably straightforward to create a project timeline.
Now, while SmartArt timelines can be a valuable tool to communicate a project’s roadmap to stakeholders, they are also limited; you can only create simplistic timelines to visualize the milestones of a project.
In short: SmartArt timelines are okay for simple reporting purposes, not to work with.
Create your SmartArt timeline
- Open a blank Excel document. Click Insert > SmartArt > Process.
- Then select Basic Timeline from the Graphic options. You may also choose other graphics templates that suit your needs.
- Enter Timeline data either in the provided text box or directly on the timeline.
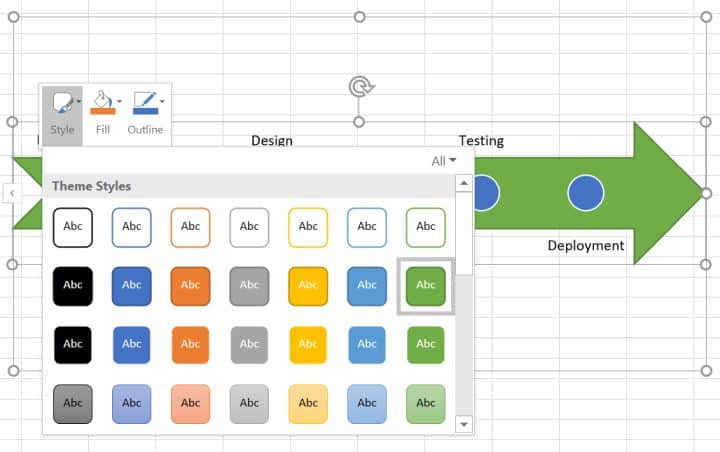
- Excel also allows you to change the style of a timeline. To do so, simply right-click to change the theme style, fill color, and outline styles.
And you’re all set. Your simplistic Excel SmartArt timeline should be ready!
If you’re after something more usable than SmartArt, you may be interested in building a scatter chart.
How to Create an Excel Timeline Using a Scatter Chart? (and for what purpose)
Scatter chart timelines in Excel: for what purpose?
Scatter charts provide a simple way to visualize various data entries over a specific period.
For instance, you could use a scatter chart to visualize the due date for all milestones of a project along with the necessary resources to complete them.
This is something that a basic SmartArt timeline couldn’t deliver.
Here again, you can choose from and edit the many charts available in Microsoft Excel to represent a simple project timeline that will suit your needs.
In short: Scatter chart timelines are a viable option to plan elementary projects that don’t require much resourcing.
Create your scatter chart timeline in Excel
This guide is a bit longer, but stick to our steps, and you’ll be fine! — alternatively, feel free to leave a comment below if you’re stuck!
- First, open a blank Excel document.
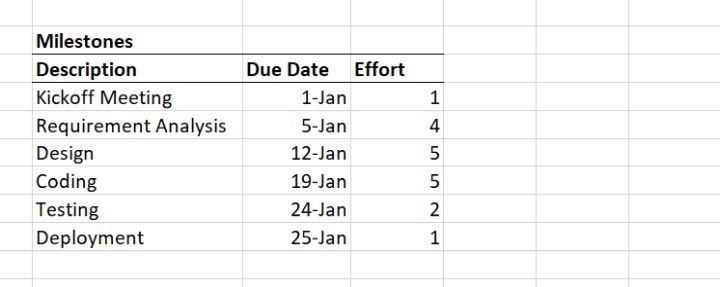
- Then, prepare your chart data.
For this chart, we’ll create milestones for a website design project and attribute a due date and an estimated effort for each.
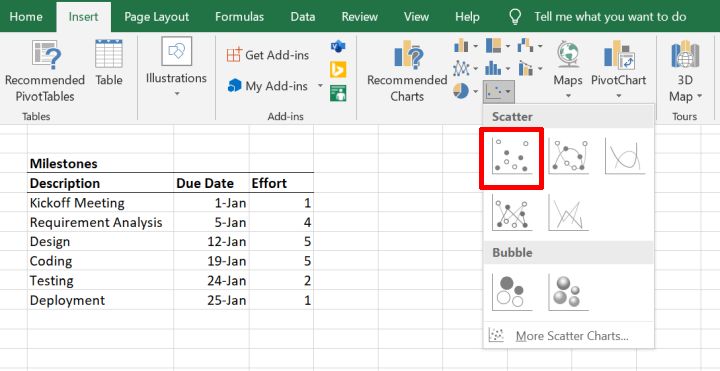
- Next, insert a scatter chart from Insert > Charts. Then select the Scatter option.
Now, we need to map our prepared data to the chart.
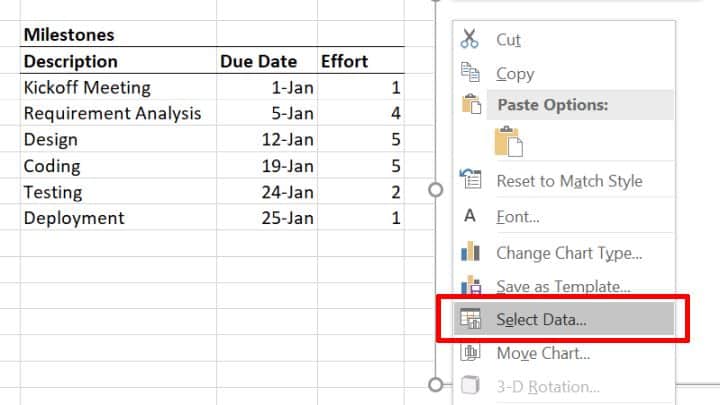
- Right-click on the scatter chart. Then click the Select Data option.
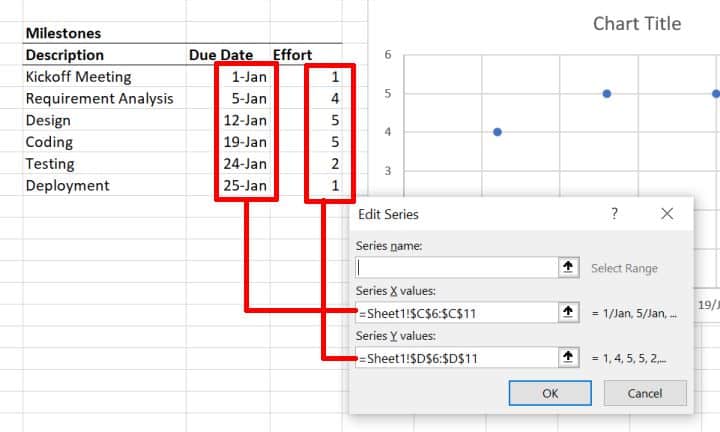
- In the dialog that pops up, click on the Add button in the Legend Entries section.
- Set the Due Dates range as Series X values, and the Efforts range as the Series Y values.
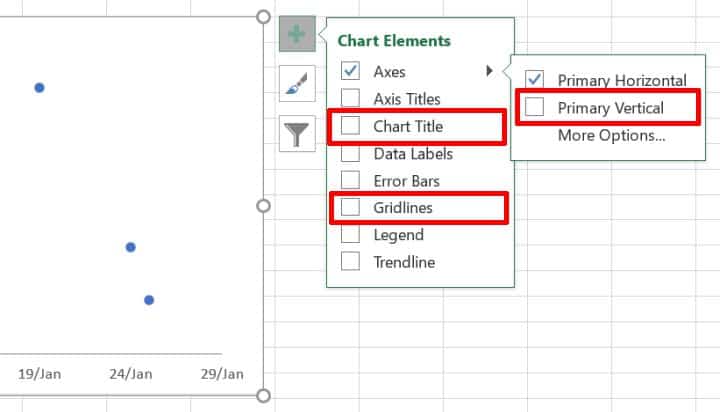
- Next, make our chart look like a timeline, disable the Primary Vertical Axis, Chart Title, and Gridlines chart elements.
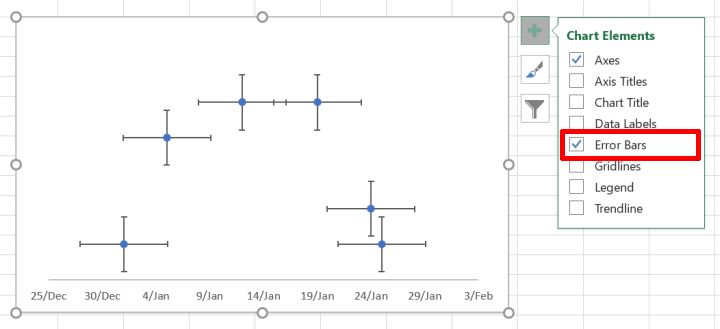
- To display the timeline markers, check the Error Bars option in Chart Elements.
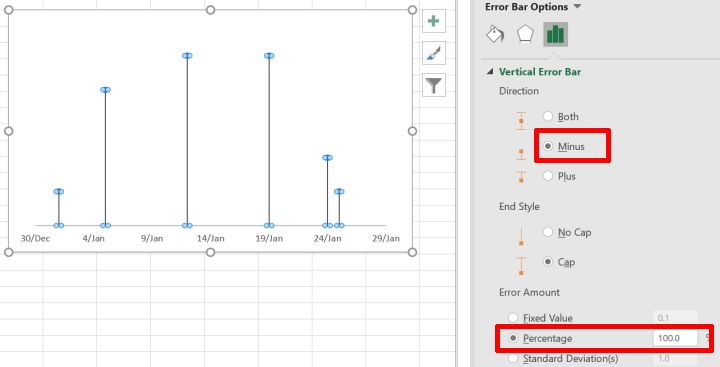
- Then to format the error bars, click on Chart Elements > Error bars > More Options.
- For horizontal error bars, set the End Style to No Cap and the Error Amount > Percentage to 0%.
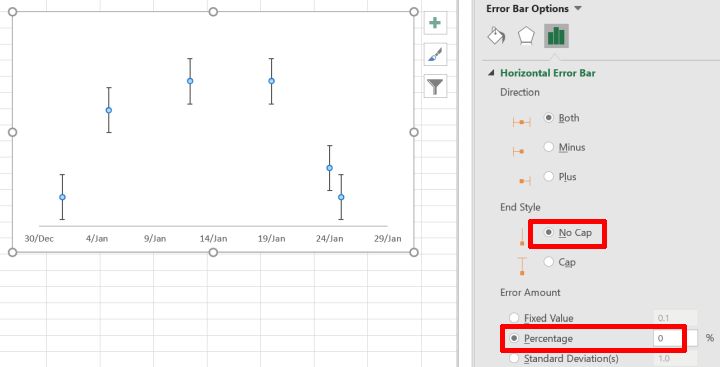
- For vertical error bars, set the Direction to Minus and the Error Amount > Percentage to 100%.
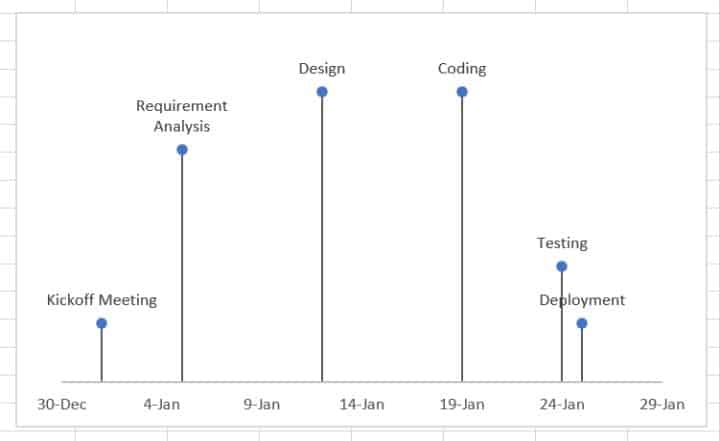
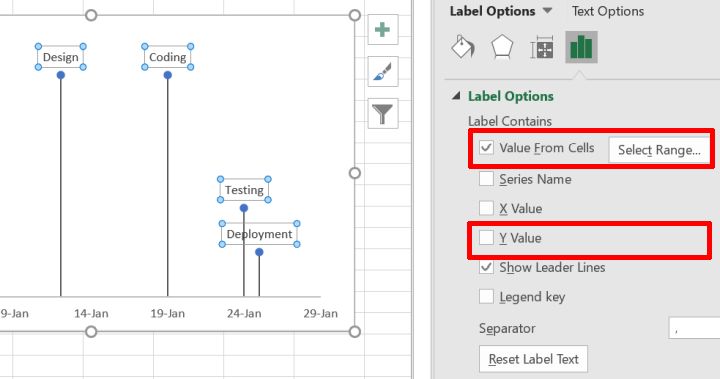
- To display the milestone labels, enable Data Labels from Chart Elements > Data Labels. Then click on Data Labels > More Options.
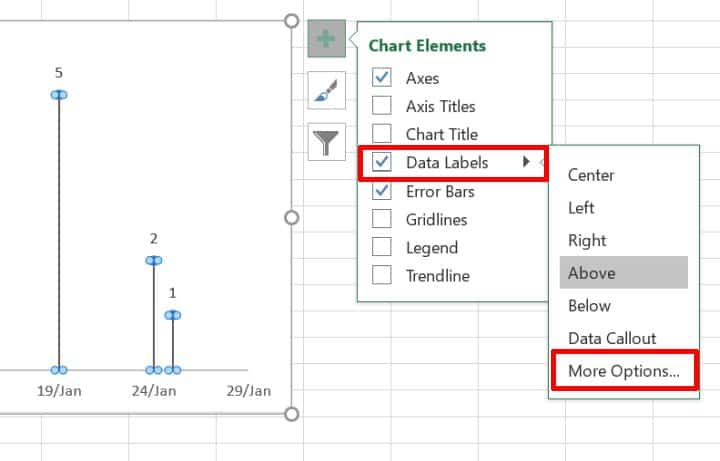
- Enable the Value From Cells option and select the range of milestones names from our prepared data. Uncheck the Y Value option.
Hats off to you! You made it! Your Excel timeline using a scatter chart is ready.
Now, if you don’t want to bother creating your own Excel timeline charts from scratch (I can’t blame you there), an alternative is to make your timelines using Excel templates.
How to Create a timeline in Excel using Timeline Templates?
Excel timeline templates are readily available in Microsoft Office’s Template Library.
Note that some of these templates will only be available once you purchase a Microsoft Office 365 subscription. However, the vast majority is available free of charge.
In short: use ready Excel templates to create simple project plans to avoid building them yourself.
Let’s look at how to create a timeline in Excel using a template.
Create your timelines with Excel Templates
- Download the free “Project timeline with milestones” template from the Office template library.
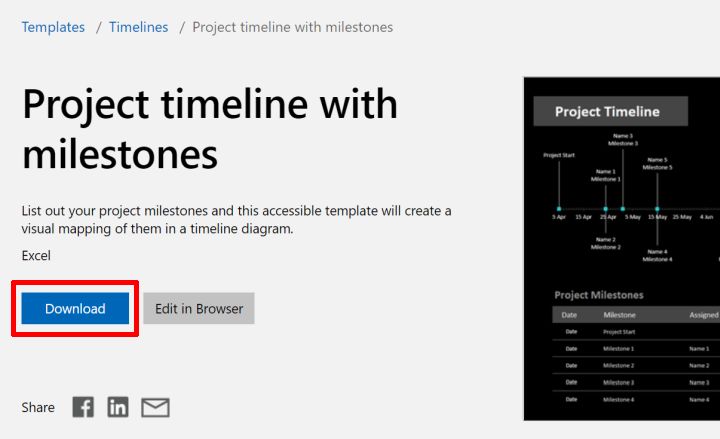
- Open the downloaded template in Excel and update your milestone data in the Project Milestones section. Set the milestone due date, milestone description, the person responsible, and the milestone label position.
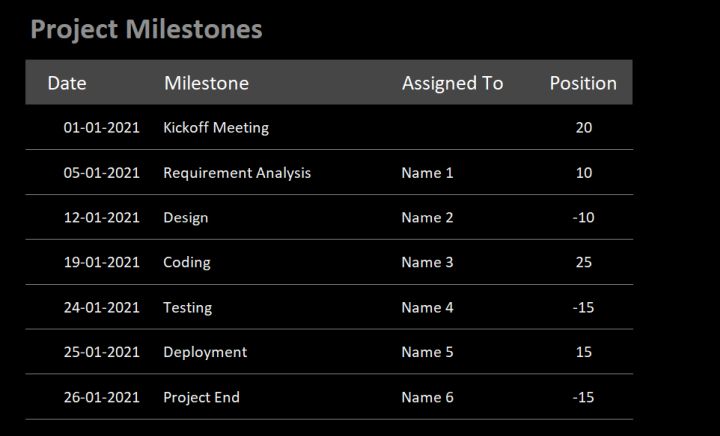
As you update your project milestone data, the milestone chart above automatically gets updated.
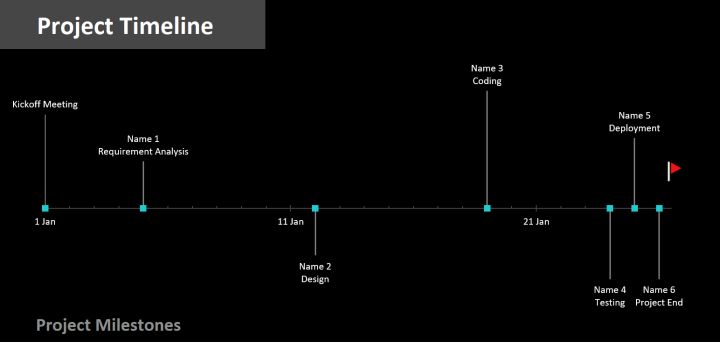
This is most likely the fastest way to build a decent timeline on Excel, especially if you don’t want to bother creating one from scratch on your own.
Now, you’ve probably noticed that while Excel makes it possible to create project timelines, it’s not cut for it.
Pros & Cons Of Excel Timelines
As mentioned earlier, a timeline is a powerful visual tool for project managers.
In the early stages of a project, it helps to communicate a project’s roadmap. And in the later stages, it allows project managers to plan and track project schedules and allocate resources.
What makes Excel an interesting project timeline maker…
The most significant advantage of using Microsoft Excel to create a timeline is that it’s easily available:
- Anyone with a computer, a smartphone, or a tablet can use Excel. It’s relatively affordable and doesn’t require a beast of a computer to run properly.
- You probably already have access to it. If you already have access to the MS Office Suite, you won’t need to spend anything extra.
- Your team is most likely Excel literate (up to a certain degree). If your team members are already comfortable using Excel, you won’t need to spend time training and onboarding them on the tool.
- You can find a ton of free Excel templates online. Using these templates, it’s reasonably easy to create a timeline in Excel.
… and why you might need something that’s built for project planning and work management
Don’t get me wrong; I love Excel (there’s a reason why I’ve decided to write this step-by-step blog post). And if you are seriously considering using Excel as your project timeline maker, know that I’ve been in your position, and I’d rather tell you why it might drive you crazy.
- Excel lacks collaborative features. You cannot work with another team member on a project’s schedule unless you both sit right next to each other. As a result, it is tough for distributed teams to plan together.
- You can’t ensure data integrity. It’s (way too) easy for anyone to wrongly update or delete data from an Excel document, making it hard to keep track of who did what, where, and when.
- Version soup: “Oh shoot, I thought we were working from the Team Planning V12_new.xls?” Team members will eventually work on different versions of Excel spreadsheets. From experience, I know that combining data from these versions can quickly become chaotic.
To sum up, Excel is OK for small and simple projects. You will need something else for anything bigger because Excel timeline templates are too basic and aren’t really teamwork-friendly.
So, what then? What’s the alternative?
To create project timelines for larger projects, you may want to consider using a project planning tool like Toggl Plan.
Meet Toggl Plan. The best way to create visual project timelines.
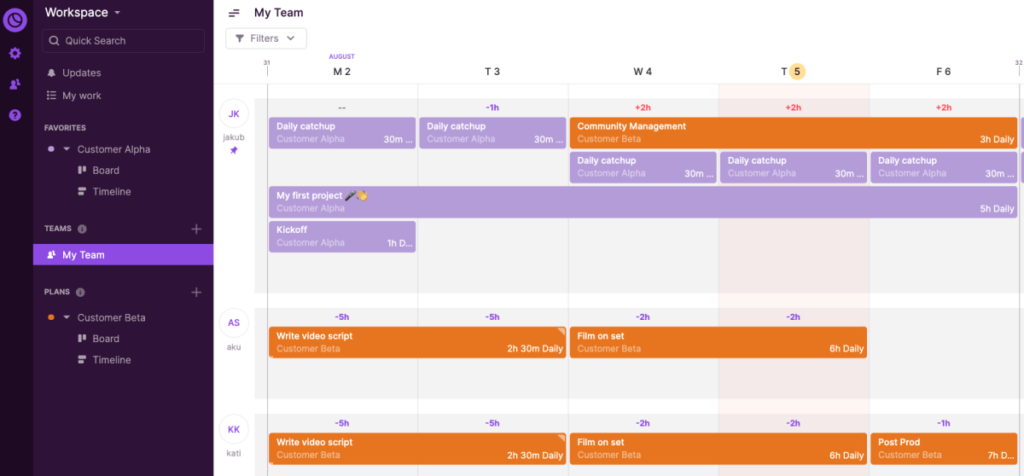
Toggl Plan is an easy-to-use SaaS with a drag-and-drop interface that helps those in charge of delivering projects to be on top of their work and capacity planning by providing a clear overview of who’s doing what and when, well ahead of time.
Consequently, teams can work at capacity and deliver projects on time, without stressing about it.
Create beautiful timelines for complex projects
Excel’s timelines can be helpful – But they are too simplistic and can be darn hard to read. We built Toggl Plan’s timeline to become the only tool you need to plan and visualize your projects.
Don’t overwork yourself, or your team.
One of the advantages of planning well ahead of time is to anticipate how much work you and your team can take.
In Toggl Plan, you’ll be able to see how busy everyone is in the blink of an eye, thus making it more convenient to move tasks around and make sure that no one in your team works silly hours.
Collaborate with your teammates
While you can benefit from it as a single user, we actually built Toggl Plan for teams. When working together, you can leave comments, create and assign tasks, move tasks around, adjust how long it took to complete a project, etc.
In other words, Toggl Plan enables teamwork.
Drag and drop your projects
While Excel is most likely the most comprehensive software out there, it’s not user-friendly. One of the things that I dislike the most about it is the impossibility to drag-and-drop items.
In Toggl Plan, you can simply drag and drop your tasks.
Painless. Fast. Easy.
Long story short, Toggl Plan makes project planning and work management bliss. Now, hold your horse because the best is yet to come. If you’re an individual user, Toggl Plan is free forever. And if you work with a team, you can sign up for a 14-day free trial.
Jitesh is an SEO and Content Specialist at Toggl. On this blog, he shares actionable tips for professional service teams to deliver projects profitably.
Источник
Download these Free Project Timeline Templates created using MS Word, MS Excel, and MS PowerPoint to quickly assist you in your project Timelines.
In project management, there are several different things and tasks involved. One of the key elements of any project management is the project timeline. A project timeline is the list of tasks and assignments that should be done to complete the project. Not only that the project timeline includes all of the important parts and milestones of a project but it also provides additional help with explaining how things should be done, which task should be completed first, which part depends on other tasks, the time it will take to complete each task and most importantly, the cost and resources required for completion of individual tasks as well as the entire project.
Key Elements of a Project Timeline:
- Overview of the project
- Core objectives
- Key performance indicators
- Breakdown of the project into smaller tasks
- Date for completion of each task
- Time required for completion of each task
- Dependencies of tasks
- Responsibilities of core team members
Here are previews and download links for these Project Timeline Templates in MS Excel, and MS Word.
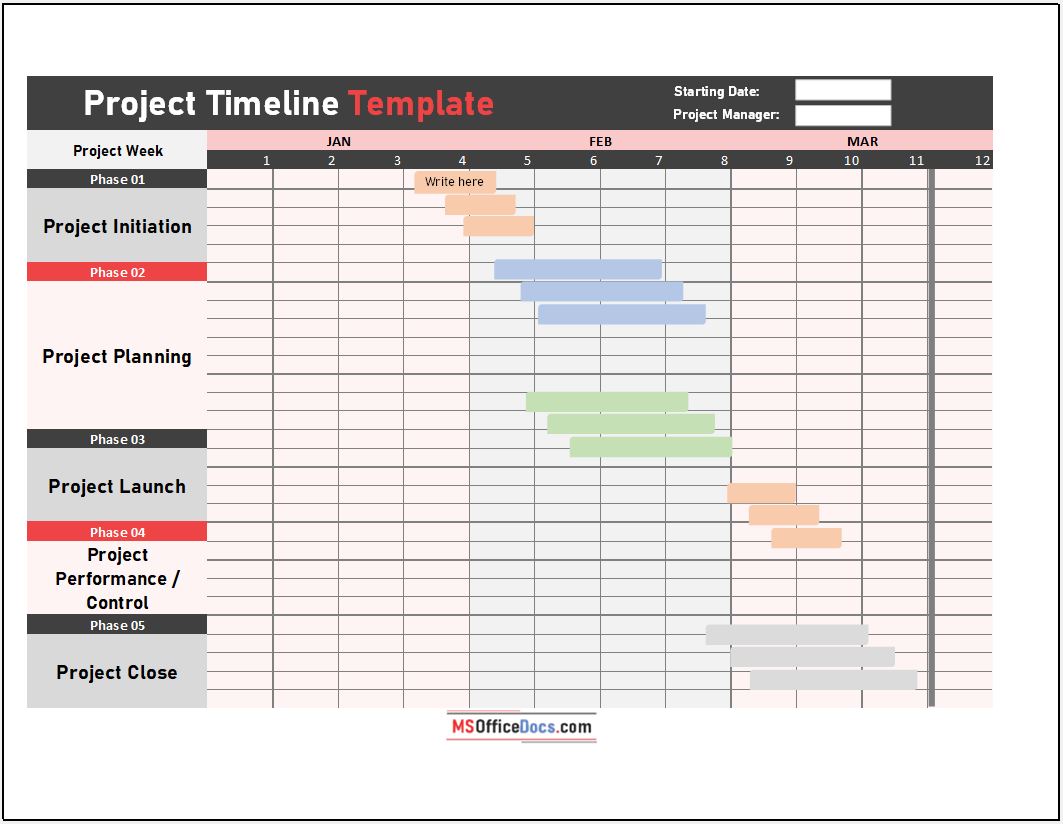
Here is the download link for this Project Timeline Template 01 in MS Excel Format,

Another very useful yet professional Project Timeline Template 02 in MS Word is to help you out.
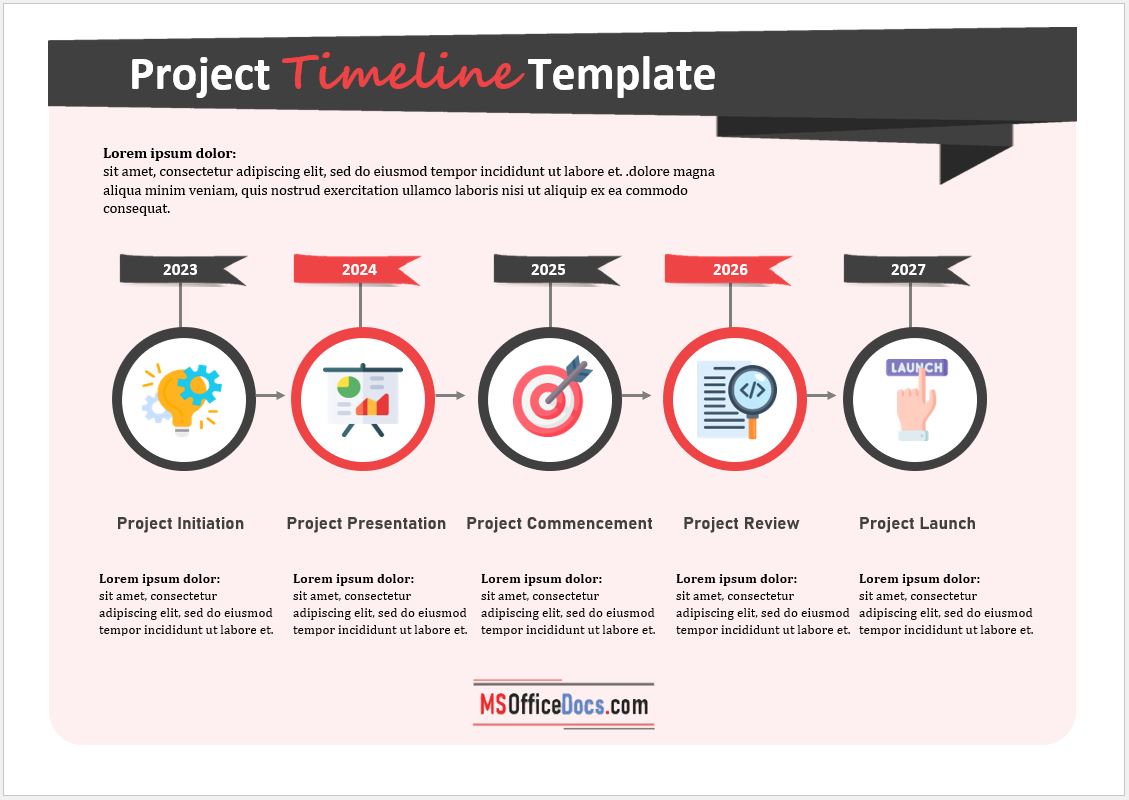
Here is the download link for this Project Timeline Template,
Role of Timelines in Project Management:
It helps in Cost Management:
One of the most important aspects of any project is its cost and the expenses that the company has to make to execute and complete a project. When the team members are not so sure about how to execute, what important milestones are, and which task depends on what, it’s going to create problems, issues, and delays in the overall performance. When you create a project timeline, not only that it streamlines every important task of the project but the team members and project manager is also sure of when and where to put the resources to work to avoid last-minute hiccups and spending the extra money to get things done quickly.
It Accommodates Proper Documentation:
Projects most of the time seem very simple but clever project managers know that even if a task seems simple, it’s not that simple to execute. They understand the real challenges that might take place during the execution of the project with limited resources. Therefore, to avoid most of these troubles, project managers create proper documents including project timelines. Not only that this timeline breaks down the project into smaller pieces but every part is clearly explained the most important part is that each document is shown to the client and the project team moves forward only after the approval of the client.
It Makes Execution Simple and Practical:
When you listen to the idea that a client has and you understand what he wants, you quickly realize that it’s going to be difficult to complete the project because it requires 1 year’s worth of work to be done in just six months. This is where a project timeline shines mainly. When you use the timeline, you break down the entire project into smaller tasks or projects which are easy to manage and put focus on. This way you can not only see how things should be done but can estimate the workforce you will need, which tasks are more important than others, and which ones should be completed first to keep moving things forward on the decided schedule. Another added benefit is that you can assign these smaller tasks to individual members to separate teams and they will be fully responsible for the execution and completion and which makes accountability much easier.
We, humans, are visual animals.
In other words, the human brain will find it a lot easier to digest information that’s clearly communicated and displayed. For this reason, the visual component is essential when planning complex projects with many moving pieces.
Well, you’re in the right place to learn precisely how to do just that.
In this blog post, you’ll get a step-by-step process to create a timeline in Excel in three different ways to visually communicate your project’s schedule and create a powerful visual timeline to plan without getting a headache.
- Create a timeline in Excel using SmartArt Graphics
- Create a timeline in Excel using Scatter Charts
- Create a timeline in Excel using Timeline Templates
- The pros & cons of Excel timelines
- The alternative
How to create a timeline in Excel using SmartArt? (and for what purpose)
For starters, what are SmartArt graphics?
SmartArt Graphics Timeline In Excel: for what purpose?
Microsoft Excel’s Smart Art feature makes it reasonably straightforward to create a project timeline.
Now, while SmartArt timelines can be a valuable tool to communicate a project’s roadmap to stakeholders, they are also limited; you can only create simplistic timelines to visualize the milestones of a project.
In short: SmartArt timelines are okay for simple reporting purposes, not to work with.
Create your SmartArt timeline
- Open a blank Excel document. Click Insert > SmartArt > Process.
- Then select Basic Timeline from the Graphic options. You may also choose other graphics templates that suit your needs.
- Enter Timeline data either in the provided text box or directly on the timeline.
- Excel also allows you to change the style of a timeline. To do so, simply right-click to change the theme style, fill color, and outline styles.
And you’re all set. Your simplistic Excel SmartArt timeline should be ready!
If you’re after something more usable than SmartArt, you may be interested in building a scatter chart.
How to Create an Excel Timeline Using a Scatter Chart? (and for what purpose)
Scatter chart timelines in Excel: for what purpose?
Scatter charts provide a simple way to visualize various data entries over a specific period.
For instance, you could use a scatter chart to visualize the due date for all milestones of a project along with the necessary resources to complete them.
This is something that a basic SmartArt timeline couldn’t deliver.
Here again, you can choose from and edit the many charts available in Microsoft Excel to represent a simple project timeline that will suit your needs.
In short: Scatter chart timelines are a viable option to plan elementary projects that don’t require much resourcing.
Create your scatter chart timeline in Excel
This guide is a bit longer, but stick to our steps, and you’ll be fine! — alternatively, feel free to leave a comment below if you’re stuck!
- First, open a blank Excel document.
- Then, prepare your chart data.
For this chart, we’ll create milestones for a website design project and attribute a due date and an estimated effort for each.
- Next, insert a scatter chart from Insert > Charts. Then select the Scatter option.
Now, we need to map our prepared data to the chart.
- Right-click on the scatter chart. Then click the Select Data option.
- In the dialog that pops up, click on the Add button in the Legend Entries section.
- Set the Due Dates range as Series X values, and the Efforts range as the Series Y values.
- Next, make our chart look like a timeline, disable the Primary Vertical Axis, Chart Title, and Gridlines chart elements.
- To display the timeline markers, check the Error Bars option in Chart Elements.
- Then to format the error bars, click on Chart Elements > Error bars > More Options.
- For horizontal error bars, set the End Style to No Cap and the Error Amount > Percentage to 0%.
- For vertical error bars, set the Direction to Minus and the Error Amount > Percentage to 100%.
- To display the milestone labels, enable Data Labels from Chart Elements > Data Labels. Then click on Data Labels > More Options.
- Enable the Value From Cells option and select the range of milestones names from our prepared data. Uncheck the Y Value option.
Hats off to you! You made it! Your Excel timeline using a scatter chart is ready.
Now, if you don’t want to bother creating your own Excel timeline charts from scratch (I can’t blame you there), an alternative is to make your timelines using Excel templates.
Excel timeline templates are readily available in Microsoft Office’s Template Library.
Note that some of these templates will only be available once you purchase a Microsoft Office 365 subscription. However, the vast majority is available free of charge.
In short: use ready Excel templates to create simple project plans to avoid building them yourself.
Let’s look at how to create a timeline in Excel using a template.
Create your timelines with Excel Templates
- Download the free “Project timeline with milestones” template from the Office template library.
- Open the downloaded template in Excel and update your milestone data in the Project Milestones section. Set the milestone due date, milestone description, the person responsible, and the milestone label position.
As you update your project milestone data, the milestone chart above automatically gets updated.
This is most likely the fastest way to build a decent timeline on Excel, especially if you don’t want to bother creating one from scratch on your own.
Now, you’ve probably noticed that while Excel makes it possible to create project timelines, it’s not cut for it.
Pros & Cons Of Excel Timelines
As mentioned earlier, a timeline is a powerful visual tool for project managers.
In the early stages of a project, it helps to communicate a project’s roadmap. And in the later stages, it allows project managers to plan and track project schedules and allocate resources.
What makes Excel an interesting project timeline maker…
The most significant advantage of using Microsoft Excel to create a timeline is that it’s easily available:
- Anyone with a computer, a smartphone, or a tablet can use Excel. It’s relatively affordable and doesn’t require a beast of a computer to run properly.
- You probably already have access to it. If you already have access to the MS Office Suite, you won’t need to spend anything extra.
- Your team is most likely Excel literate (up to a certain degree). If your team members are already comfortable using Excel, you won’t need to spend time training and onboarding them on the tool.
- You can find a ton of free Excel templates online. Using these templates, it’s reasonably easy to create a timeline in Excel.
… and why you might need something that’s built for project planning and work management
Don’t get me wrong; I love Excel (there’s a reason why I’ve decided to write this step-by-step blog post). And if you are seriously considering using Excel as your project timeline maker, know that I’ve been in your position, and I’d rather tell you why it might drive you crazy.
- Excel lacks collaborative features. You cannot work with another team member on a project’s schedule unless you both sit right next to each other. As a result, it is tough for distributed teams to plan together.
- You can’t ensure data integrity. It’s (way too) easy for anyone to wrongly update or delete data from an Excel document, making it hard to keep track of who did what, where, and when.
- Version soup: “Oh shoot, I thought we were working from the Team Planning V12_new.xls?” Team members will eventually work on different versions of Excel spreadsheets. From experience, I know that combining data from these versions can quickly become chaotic.
To sum up, Excel is OK for small and simple projects. You will need something else for anything bigger because Excel timeline templates are too basic and aren’t really teamwork-friendly.
So, what then? What’s the alternative?
To create project timelines for larger projects, you may want to consider using a project planning tool like Toggl Plan.
Meet Toggl Plan. The best way to create visual project timelines.
Toggl Plan is an easy-to-use SaaS with a drag-and-drop interface that helps those in charge of delivering projects to be on top of their work and capacity planning by providing a clear overview of who’s doing what and when, well ahead of time.
Consequently, teams can work at capacity and deliver projects on time, without stressing about it.
Create beautiful timelines for complex projects
Excel’s timelines can be helpful – But they are too simplistic and can be darn hard to read. We built Toggl Plan’s timeline to become the only tool you need to plan and visualize your projects.
Don’t overwork yourself, or your team.
One of the advantages of planning well ahead of time is to anticipate how much work you and your team can take.
In Toggl Plan, you’ll be able to see how busy everyone is in the blink of an eye, thus making it more convenient to move tasks around and make sure that no one in your team works silly hours.
Collaborate with your teammates
While you can benefit from it as a single user, we actually built Toggl Plan for teams. When working together, you can leave comments, create and assign tasks, move tasks around, adjust how long it took to complete a project, etc.
In other words, Toggl Plan enables teamwork.
Drag and drop your projects
While Excel is most likely the most comprehensive software out there, it’s not user-friendly. One of the things that I dislike the most about it is the impossibility to drag-and-drop items.
In Toggl Plan, you can simply drag and drop your tasks.
Painless. Fast. Easy.
Long story short, Toggl Plan makes project planning and work management bliss. Now, hold your horse because the best is yet to come. If you’re an individual user, Toggl Plan is free forever. And if you work with a team, you can sign up for a 14-day free trial.

Jitesh is an SEO and content specialist. He manages content projects at Toggl and loves sharing actionable tips to deliver projects profitably.
Project Timeline Template
Purpose of Project Timeline:
A Powerful & Multi-purpose Templates for project management. Now seamlessly manage your projects, tasks, meetings, presentations, teams, customers, stakeholders and time. This page describes all the amazing new features and options that come with our premium templates.
Save Up to 85% LIMITED TIME OFFER

All-in-One Pack
120+ Project Management Templates
Essential Pack
50+ Project Management Templates
Excel Pack
50+ Excel PM Templates
PowerPoint Pack
50+ Excel PM Templates
MS Word Pack
25+ Word PM Templates
Ultimate Project Management Template
Ultimate Resource Management Template
Project Portfolio Management Templates
-
- Purpose of Project Timeline:
Effortlessly
Manage Your Projects
120+ Project Management Templates
Seamlessly manage your projects with our powerful & multi-purpose templates for project management.
120+ PM Templates Includes:
Effectively Manage Your
Projects and Resources
ANALYSISTABS.COM provides free and premium project management tools, templates and dashboards for effectively managing the projects and analyzing the data.
We’re a crew of professionals expertise in Excel VBA, Business Analysis, Project Management. We’re Sharing our map to Project success with innovative tools, templates, tutorials and tips.
Project Management
Excel VBA
Download Free Excel 2007, 2010, 2013 Add-in for Creating Innovative Dashboards, Tools for Data Mining, Analysis, Visualization. Learn VBA for MS Excel, Word, PowerPoint, Access, Outlook to develop applications for retail, insurance, banking, finance, telecom, healthcare domains.
Page load link
Go to Top
Create a project timeline in minutes with these free project timeline templates for either Excel or ProjectManager. If you’re looking to schedule a project and need a timeline, having a project timeline template is a great way to start collecting your data in one place. Using a Microsoft Excel project timeline will set you on the road to project success. But, if you open the project timeline template in ProjectManager, you’ll be able to manage your project on not just a timeline, but with five different views: Gantt, kanban board, task list, calendar and sheet. Plus, you’ll be able to collaborate on those tasks with your team in real time and track progress in the software with live dashboards and instant status reports. Get started for free with ProjectManager and build a dynamic project timeline in minutes.
What Is a Project Timeline Template?
A project timeline template is a project planning tool that helps project managers easily create project timelines by simply adding tasks, due dates and milestones. There are two main types of project timeline templates. Excel project timeline templates and timeline templates for project management software, which are usually made with Gantt charts. An Excel project timeline is a good alternative for beginners because it is a basic project planning tool and most people are familiar with Excel. However, Excel project timelines have limitations. If you want a more advanced project timeline, you can open the project timeline template in ProjectManager.
When to Use a Project Timeline Template
A project timeline is an essential planning tool, but it’s also limited in its functions. This Microsoft Excel template is a great way to get started with the process of scheduling a project, but as you move on to other phases it quickly loses its value. That doesn’t mean a project timeline template is useless. Here’s a short explanation of when to use a project timeline. A project timeline lays the groundwork for your project schedule and in so doing the entire project plan. It shows you the major deliverables for the project and in what order they need to be done. This allows you to determine the resources and costs associated with executing those tasks. As you can see, the whole project plan emerges from a simple timeline.
Every project has stakeholders and a project timeline is a tool that you can use to communicate with them. It provides an outline of the project deliverables, which notes when and what the deadlines are. There are many ways to update stakeholders and a timeline is one of their first glimpses into how the project will progress. Simply download our free project timeline template for Excel to get started.
Why Use a Project Timeline Template?
The main selling point of a project timeline template is that it’s a visual tool. This is ideal for visual thinkers, but everyone benefits when they can see the entire project plan laid out before them. At a glance, they’ll discern the tasks, when they need to be completed and where the milestones are.
Advantages of Using an Excel Project Timeline Template
As noted, a timeline is a visual representation of your project schedule. It shows you the tasks you need to do in order, with start dates and end dates, similar to a PERT chart. If there are changes, each user has to manually add them. You can also add a noted column to the template to jot down important information, but it won’t show on the Excel project timeline.
Disadvantages of Using an Excel Project Timeline Template
There’s a lot you can’t do with an Excel project timeline. For example, you are not able to link dependent tasks, add project milestones or collaborate in real-time with your team like you would with ProjectManager’s Gantt chart. Since the template is a static document, there’s no way to use it as part of a larger suite of project management tools to build your plan, assign tasks and track and report on progress. One of the biggest drawbacks of this Excel project timeline template is that your team members can’t make changes in real time to the same document because each user has to download a copy. ProjectManager is an online project planning software that has the features you need to create project timelines that are much more dynamic than Microsoft Excel, Powerpoint, Google Sheets and Office Timeline templates.
How to Use This Free Project Timeline Template for Excel
Download our free project timeline template and you’ll simply have to fill out the various fields that are already laid out for you. The basic structure of project timelines is simple: tasks and their start and end dates. This project timeline Excel template captures this data and automatically populates the spreadsheet into a visual timeline.
1. Create a Task List
Tasks are small, manageable pieces of work. Each task is a step towards a deliverable, leading to the final deliverable, which is the project objective. Simply write the name of your task down in the task column. Our template has some sample tasks, but you can enter as many as you’ll need to complete the project. You can download our work breakdown structure template to help you identify the tasks that make up your project. 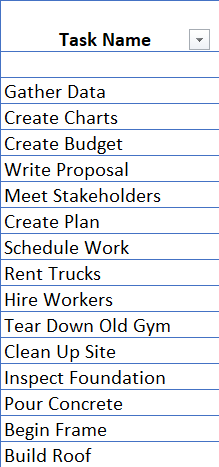
2. Add Due Dates
This is the date you want the work to start on executing the task. It’s simply the day, month and year. These dates might be estimations, but that’s fine as they can always be changed. If you do edit your timeline, that information will instantly reflect on the visual side of the template. Estimating is a big part of project planning. You can use a PERT chart or the critical path method to help you with this process. Again, this is the estimation of the task’s conclusion. When you expect the work on the task to be completed or the deadline by which it must be done. Just add the day, month and year. This endpoint with the previous start point will chart your timeline. 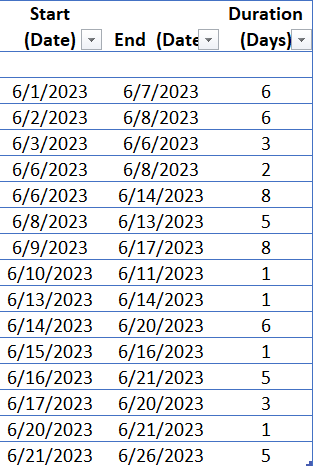
3. Calculate the Duration of Each Task
In this field, the amount of days between the start date and the end date is automatically calculated. This is called the duration or how long the task is estimated to take. Remember, these dates are your best estimation of how long everything will take based on research. They’ll likely change, but the template is designed to be flexible.
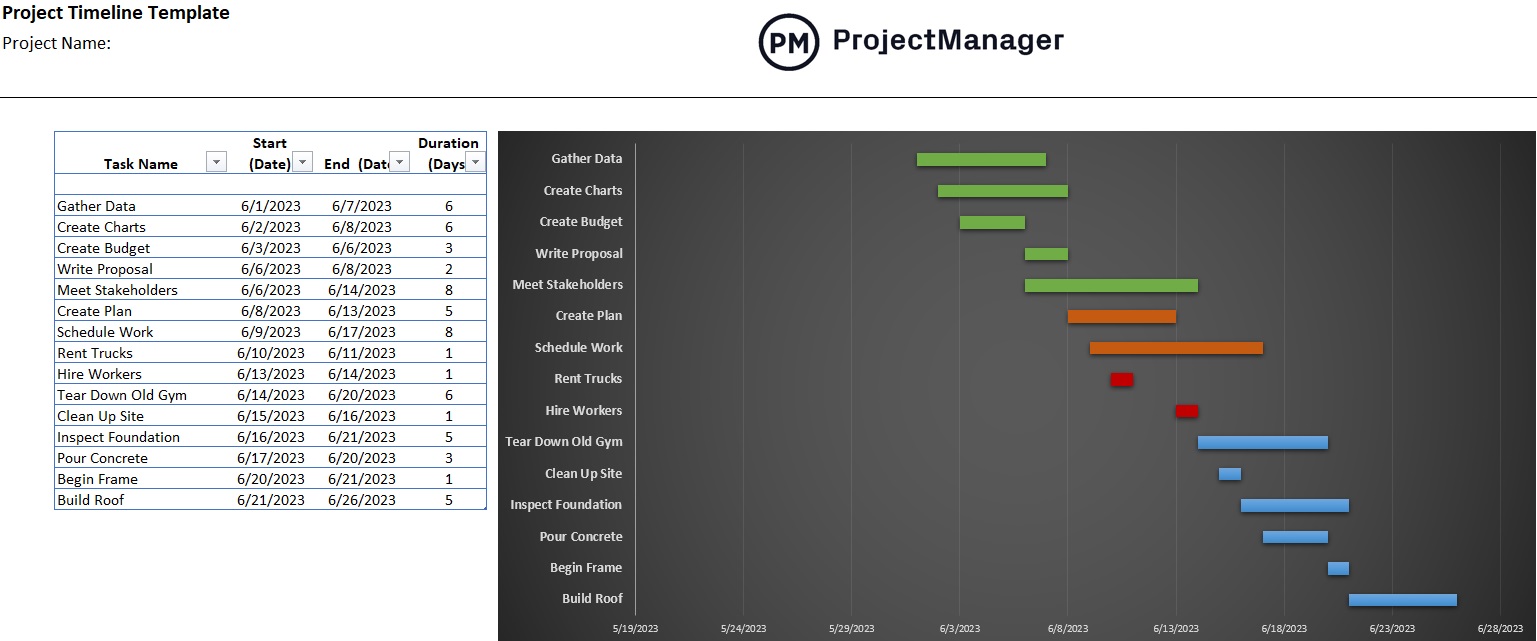
4. Create a Visual Project Timeline
This Excel project timeline template also generates a project timeline for you, in the form of a stacked bar chart. Similar to a Gantt chart, this chart lets you visualize tasks on a project timeline as shown in the image below. 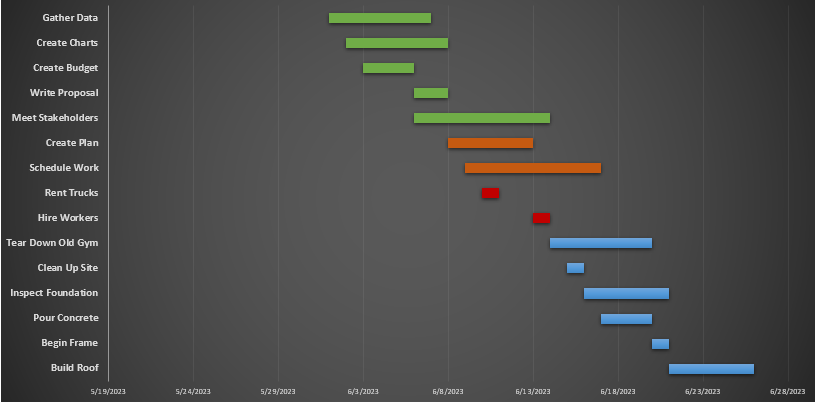
Who Should Use This Excel Project Timeline Template?
The project manager is usually the owner of the project timeline. They’re responsible for building it, but the data they use can come from a multitude of sources. For one, historical data can help you figure out what tasks are needed, how long they’ll take and what resources and costs they’ll require. While the task of creating the timeline falls under the purview of the project manager, stakeholders and team members all contribute. Stakeholders are the reason for the project and their investment means whatever expectations they have should be addressed. Project teams, on the other hand, have practical knowledge of the work. They were assembled because of their skills and experiences working on similar projects and therefore can offer great insights into what’s needed and how long things will take to accomplish the project goals.
What Other Project Management Templates Can Help You Build a Project Timeline?
Creating a project timeline is only a small part of project planning. That’s why we’ve created a library of free project management templates to help you plan, schedule and track projects. Here are some of them.
Project Plan Template
Creating a project timeline it’s an important step toward making a project plan. Our free project plan template is a starting point that helps project managers gather all the information they need.
Project Scope Template
Defining your project scope is the foundation of creating a project timeline. This free project scope template helps you define what will be the reach of your project.
Work Breakdown Structure Template
Our free work breakdown structure template is the ideal tool to help you gather all the project tasks that will feed into your project timeline.
Project Management Software Takes Project Timeline Templates Further than Excel
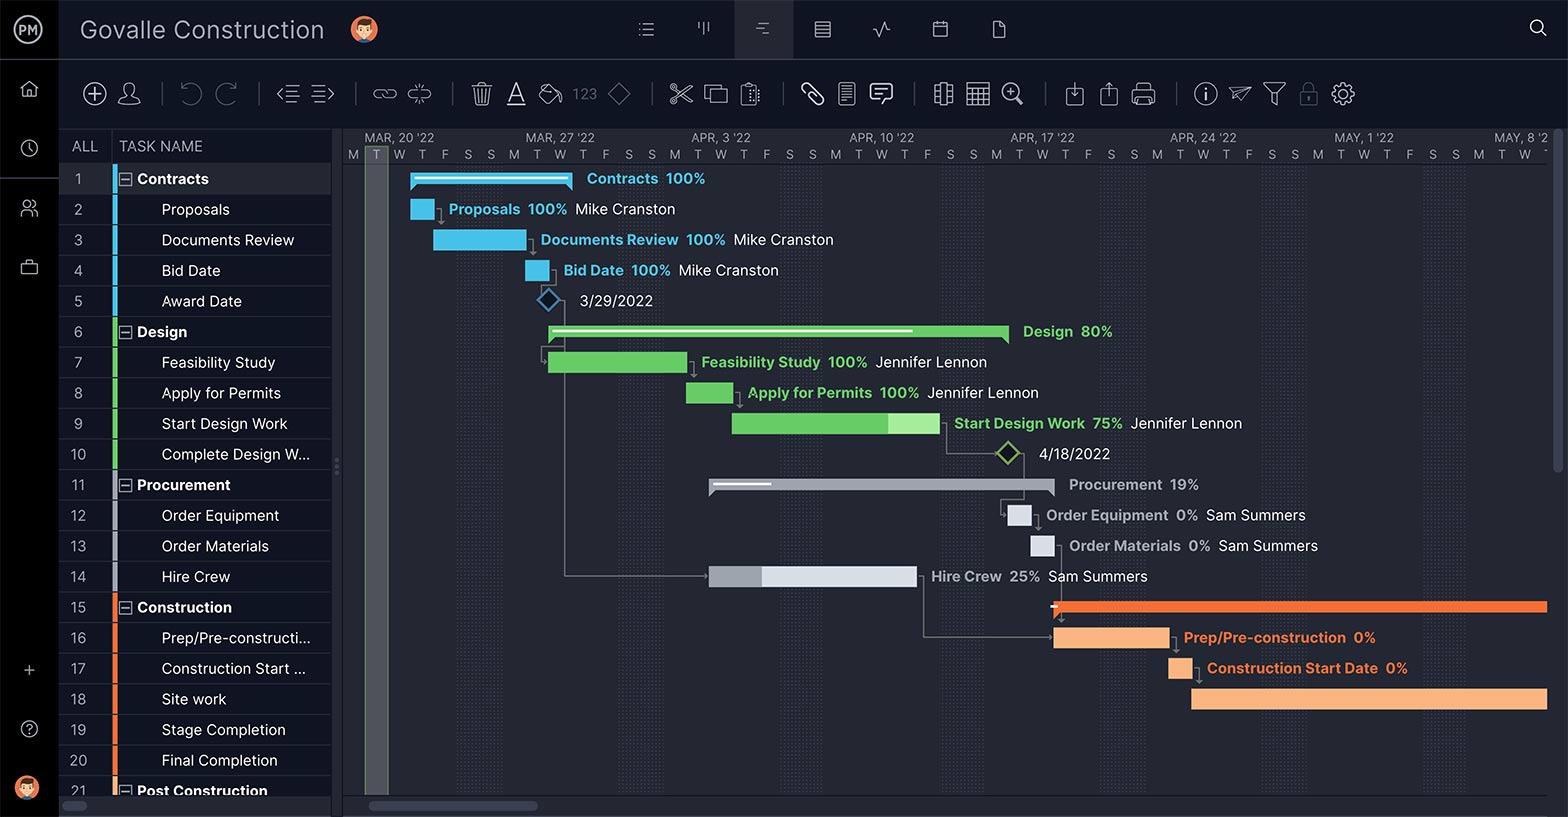
A timeline template provides the basis for defining when your project deliverables are due. Use project management software to turn that timeline into a dynamic schedule. ProjectManager has online Gantt charts so you can build powerful project plans that link dependencies, set milestones and create subtasks. Plus, you can track the costs and resources needed to execute project activities. Set the baseline and then compare actual versus planned progress to keep on track. You can even see the critical path within your timeline to know what tasks are essential to achieving your goal.
How to Import your Excel Project Timeline Template Into ProjectManager
Once you download your Excel project timeline template and start building your project plan, you’ll quickly discover some roadblocks. Our free Excel template is a fine tool to get started or for a static visual document to outline the chronological tasks in your project. However, managing a project involves much more than just project timelines. If you’re looking to super-size your timeline so that it’s integrated into a holistic project management software then try out ProjectManager. First, you’ll want to take advantage of the free 30-day trial. Then follow these steps. Get your Excel project timeline template into ProjectManager. It’s easy. Just use the import button, choose the file and import. You can also just open the Gantt chart view on the software and input the data manually or use one of the many industry-specific templates to get started.
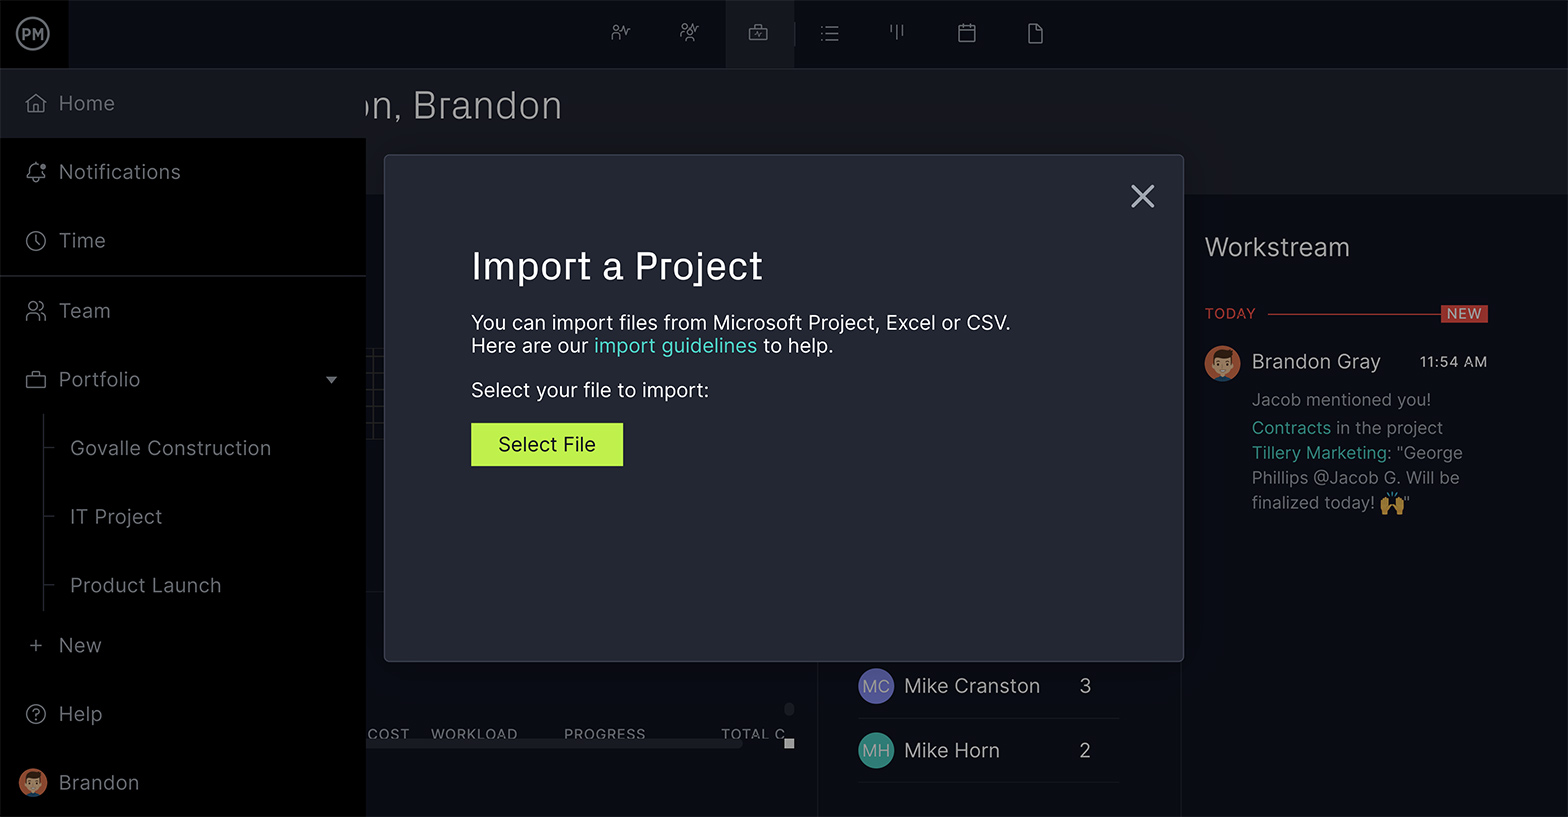
Add Start and End Dates
Import the project timeline Excel template and the information you collected will populate the Gantt chart. If you’re starting from scratch, you’ll have to add those start and finish dates in the appropriate columns. This will then reflect on the timeline side of the Gantt chart. You’ll see the duration indicated by a bar connecting the start and endpoints. 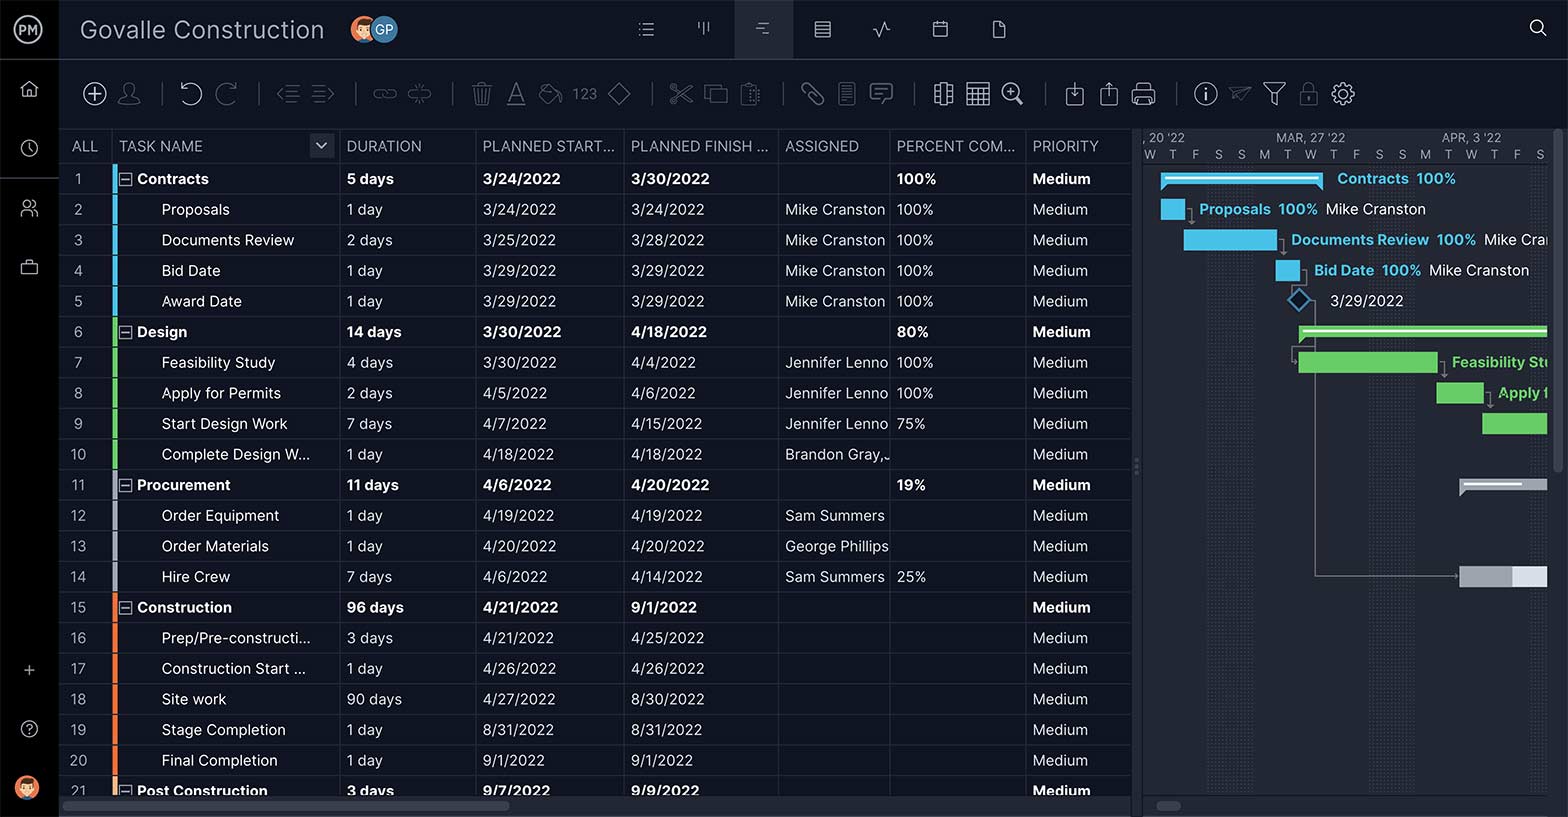
Set Project Milestones
Add milestones to your online Gantt chart. Your project milestones are represented by diamond icons on the timeline. They represent important dates in the project and are used to note the end of one project phase and the start of another. This breaks the project into more manageable bits.
Link Task Dependencies
Connect tasks that are dependent on one another by simply dragging and dropping one to another. Dependent tasks are those that can’t start or end until another starts or ends. Identifying these dependencies helps avoid bottlenecks later on in the project. 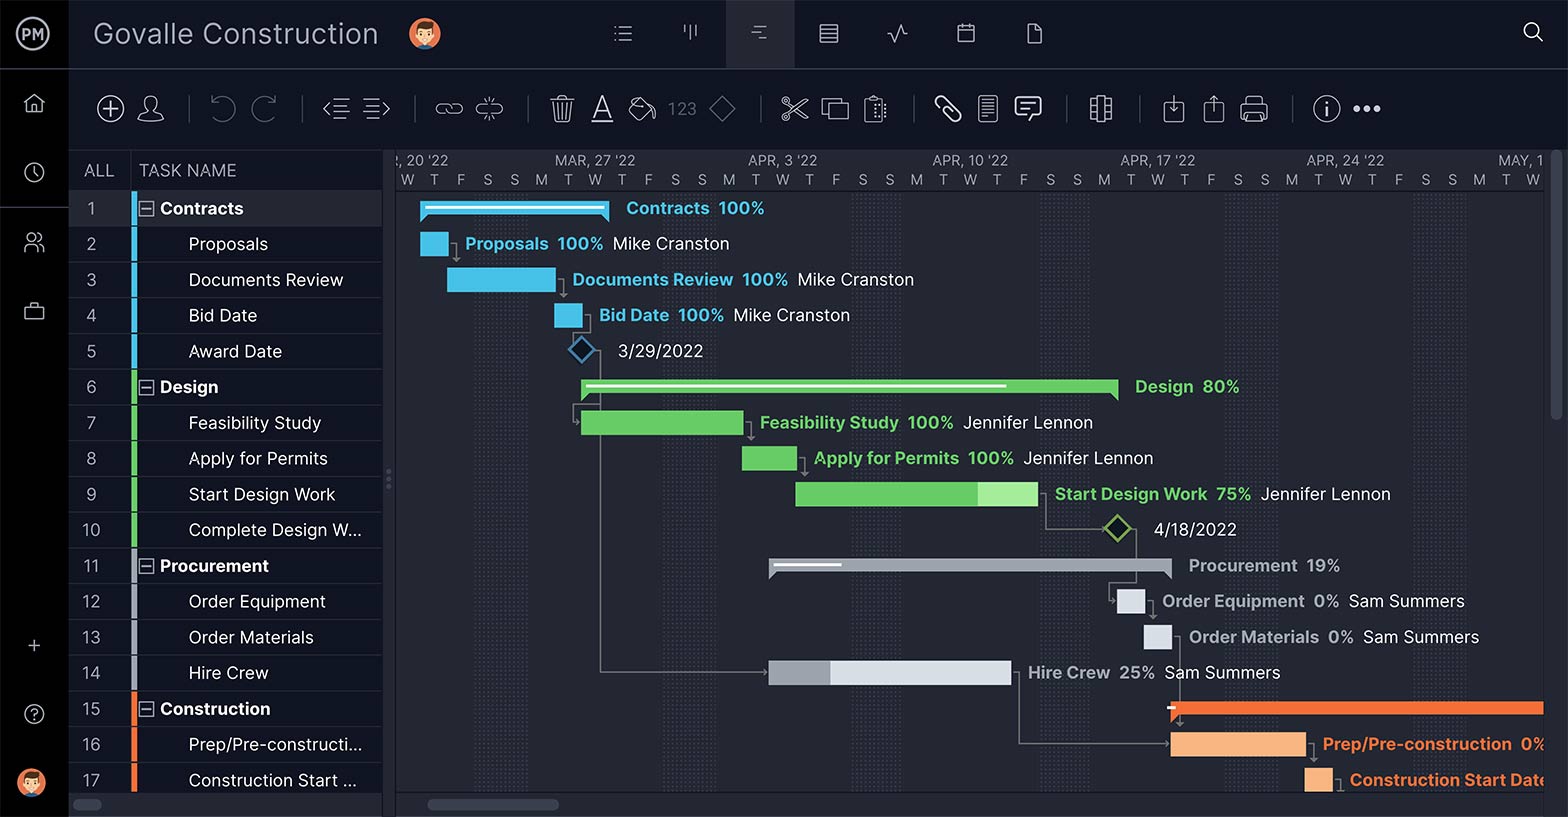 Milestones and dependencies are just the beginning of how using a project management tool can take your timeline to the next level. You can even assign tasks from the Gantt, attaching files and giving teams detailed descriptions of what needs to be done. Then tag the task for priority or to make it easy to find. Our online tool gives your real-time data, which means that teams can collaborate on the same platform even if they’re working remotely without having to download any files. Managers can oversee their progress with dashboards and reports. There’s even a workload page to see who is overallocated and reallocate their work to keep teams productive. Once you’ve imported your Excel timeline template into our software you have the tools you need to control every aspect of your project all from one place. It organizes your work for greater efficiency. Why jump from one application to another and download countless files when all you need to bring in a successful project is altogether in one online tool? For more information, check our 5-step guide to make a timeline.
Project Timeline Tutorial Video
For more information on how to create and manage a project timeline, watch the video below. Jennifer Bridges, PMP, gives you a number of crucial tips that can help you get the most out of your project timeline template.
Related Content
ProjectManager is an award-winning software and also the industry’s hub for all things project management. There are scores of blogs, guides and videos to help you through all aspects of managing your project. If you’re interested in project timelines, then you’ll probably want to read the following pages on our site.
- Project Timeline Guide
- Project Timeline Software
- Gantt Chart Guide
- Project Planning Guide
- Project Scheduling Guide
- Critical Path Method (CPM) Guide
- Project Scope 101
Once you’ve imported the Microsoft Excel project timeline template into our tool you’ll see how it expands your project horizons to include more robust planning, monitoring of your project’s performance and detailed reporting to keep stakeholders up-to-date. Used by tens of thousands of project teams from NASA to Ralph Lauren, see what it can do for you by taking this free 30-day trial.