
A Product Datasheet is an important part of every E-commerce business. It allows you to present your product data in a simple but elegant way that ensures a better brand representation.
In this blog, we will discuss what product sheets are, and the steps to create an efficient product data sheet for your eCommerce business. Let’s get started.
- What is a Product Data sheet?
- Examples of a Product Data Sheet
- 1. Furniture Industry Data Sheet
- Key Components of a Data Sheet
- 1. Your Logo
- 2. Your Contact Details
- 4. Product Attributes
- How to make your Data Sheet more efficient:
- Tip # 1: Keep it simple
- Tip # 2: Customize different versions of the datasheet
- Tip # 3: Use the right tool
- How to automate your Product data Sheets Creation process?
What is a Product Data sheet?
A Product Data Sheet is a PDF document that enlists all the relevant product information, including the pricing, description, technical information, material, and physical aspects that help buyers make their decision more quickly.
Take an example of a Camera. Your store is launching a new camera. You have to update data sheets for customers. The sheets will include information such as the overall description of the camera.
Furthermore, it will have the camera’s key features. For example, high-resolution image sensors and fast autofocus. The benefits such as superior image quality and simple controls, technical specifications such as lens mount, ISO range, and pricing. See the example below for a product data-sheet example from Nikon’s D300s 1

Download our Free Product Data Sheets template, & start organizing your data
Download the FREE editable Product specs sheet template by clicking on the button.

Examples of a Product Data Sheet
1. Furniture Industry Data Sheet

If you are dealing with the furniture industry, the above is an example of what your product data sheet should look like.
A good furniture product data sheet should include product information, contact details, and ordering details. You can have a single data sheet for every single item, e.g. a single product data sheet for a table with variations.
2. Fashion Industry Data Sheet

A Fashion industry data sheet should look a bit more attractive and colorful.
It should have a clean layout highlighting the basics that include product information, contact details, and ordering details.
It is always preferable to lay out your fashion product line horizontally!
If you plan on making a data sheet for clothes, all you need to include in your product data-sheet is a list of designs, variations, and prices.
A Product Sheet can provide an easy and quick way to overlook all the essential information for retailers, and potential buyers. Which in normal conditions would take hours to explain. A very convenenient way as well!
Mobeen Ali – Product Marketing Manager – Apimio
Adding a delivery date usually adds more value to your Product data sheet as it informs the buyers as to when they will receive their goods.
3. Jewellery Industry Data Sheet

A Jewelry product data sheet should include clear images of the jewelry items with detailed information regarding their color, price, and material.
It is always a good idea to feature jewelry items that belong together in a collection. You need to make sure that your pictures align properly, they should be crisp and should clearly show the attributes of each jewelry piece. We will be catering to the top 5 industries for you, have a look at
How to create a Product Datasheet in Excel?
Are you struggling with making a product data sheet? This blog will tell you how you can easily make a product data sheet!
Creating a product data sheet in Microsoft Excel is a straightforward process. Here are the steps to follow:
- In your Excel workbook create columns for the data you want to include in your product data sheet. Common columns for product data sheets include product names, product codes, product descriptions, product specifications, and product images.
- Enter the data for each product in the corresponding cells. Be sure to include all relevant information and keep the data organized and consistent across products.
- Add any images or graphics related to the product by inserting them into the worksheet.
- Format the worksheet to make it visually appealing and easier to read. This can include adding borders, adjusting column widths, and applying font styles and colors.
- Save the workbook and give it an appropriate name, such as “Product Data Sheet.”
Create and Manage Product Data Sheets using a PIM
It gets quite difficult and time-consuming when it comes to managing a Product data sheet! Managing your Product data sheets is a long process comprising collecting, editing, and distributing Product information.
Updating your data sheet according to the requirements of your retailers gets very hectic! If you’re also facing these issues with managing your product data sheets, then apimio has got you covered!
By utilizing Apimio, you can save time and resources while ensuring that your product data is accurate, up-to-date, and consistent across all channels. Don’t miss out on the opportunity to take your product data management to the next level!
Explore how Apimio can Automate Product data sheets management
Create, manage, and share product spec sheets through a centralized space with our PIM.

Key Components of a Data Sheet
Apimio makes it easier for you by listing the exact components you need to cover in your Product data sheets.
The key components of a product sheet include:
1. Your Logo
Logos are the most crucial element of a product sheet. If you don’t currently get a logo, you better create one! The logo should be memorable and straightforward. Some logos are iconic and instantly recognizable, while others may take the viewer a little longer to understand. A few things any good logo will have:
- A unique shape or symbol that sets it apart from other brands in its industry or market niche
- Easy readability from a distance or when reproduced in different sizes and formats
2. Your Contact Details
Include your contact information next to or below the logo. This includes the contact person’s name, phone number, street address, email address, and, of course, the URL.
3. Colorful Images
Then come the photos. Make sure that all of your images are colorful, that they show off your goods in the greatest light, and that they are all the same size for consistency. Please, no shaky photos. The main aim over here is to make sure your product images stand out. Also, for this one, stick to product shots. Save those nice lifestyle photos for a later day.
4. Product Attributes
This is the crucial portion. All of your product details should be cleanly and precisely written out.
To put it another way, always include the following attributes:
- Product Name
- SKU
- Retail Price
- Minimum Order Count
- Variants – Colors, sizes, etc.
- Style name
- Style Number
NOTE: Avoid including information such as whether the products are recyclable, machine-washable, handcrafted, or their size. This information is vital, but they aren’t relevant to your sheet.
Challenges of Product Data Sheet
- Too much information
- Underrepresentation of the brand
- Doesn’t make a good first impression
- Ineffective
#1 Too much information
Providing extra information regarding your product may not always work in your favor, people might focus on the information you don’t want them to focus on and this may lead them to be reluctant in buying the product. Hence, excessive information may not always have a positive influence on your potential customers.
#2 Underrepresentation of the Brand
A data sheet may belittle the focus and importance that should be placed on providing information regarding the brand itself. A datasheet ends up focusing too much on the details of a product and may not be able to attract a customer who has no idea about the brand, its background, or its values.
#3 Doesn’t make a good first impression
A data sheet is not really a compelling representation of your offerings. A line sheet isn’t a marketing tool that grabs the attention of the customers or looks appealing to them.
#4 Ineffective
A product data sheet is used by many e-commerce businesses and due to the high competition there are chances of your line sheet being ignored or not getting the attention it deserves. Also, it can be very easy for the retailer to miss out on your data sheet while dealing with a client due to the excessive amount of line sheets available.
How Apimio can help you with these challenges
Managing your product data sheets through Apimio is the smart choice for businesses looking to stay ahead of the competition! You will come across a lot of benefits when it comes to Apimio PIM! Apimio allows you to easily tackle these problems by providing the following solutions:
- Cost Effective
- Easily Customizable
- Easy to view
- Organized Display
1. Cost Effective
Getting together too much information can also take a lot of time, and with that comes a large amount f cost! The best thing about a data-sheets created through Apimio is that even if you’re a business running short on budget, you can still use a data sheet as it doesn’t demand a large chunk of money.
It is more cost-effective as compared to many other PIM providers as neither does it require a high cost for editing and designing nor does it require entire collection editing like in the case of a catalog.
2. Customization
Did you know that a Product sheet can be customized according to the type of customer you are catering to? An example of a product data sheet for a new client can be more informative, providing more details regarding the products and attracting them to make a purchase.
A Product sheet helps fulfill different requirements by allowing you to create information according to your target market.
3. Easy to view
Aapimio makes sure to create Product data sheets that allow your target market to look for the exact offering they are interested in without having to scroll through the irrelevant material.
4. Organized Display
Apimio provides a layout of a Product data sheet which includes an organized display of the product lines; this assists in navigating the exact product one are looking for and this way there’s no chance of your Product Sheet being ineffective.
What to look for in a data Sheet Software Tool
With the availability of thousands of software tools, choosing the most suitable tool can be a demanding task.
Apimio makes your job easier here by providing the things you need to look for while making your decision regarding the data sheet software tool for your products.
#1 User-friendly
It’s always a better idea to look for a tool that is easy to understand and use, this way one can create and edit high-quality Product sheets with the required templates for different products.
#2 Ease of export in different formats
Not every software tool allows you to export your file in different export formats and this restricts you from grabbing different marketing opportunities. I’m sure that you don’t want this to happen to you, so always make sure that the datasheet software tool you’re opting for allows you to export your product data-sheet in a format that is acceptable everywhere.
How to make your Data Sheet more efficient:
Tip # 1: Keep it simple
While it might be tempting to include every piece of information about your company on your sheet, don’t do it. It will only lead to a cluttered, confusing mess that no one will want to read. Apimio recommends keeping things simple so that the reader is persuaded by what you have written, rather than being distracted by all of the elements on the page.
Tip # 2: Customize different versions of the datasheet
A datasheet helps companies differentiate their products from one another. If you want to include information about your product variations on your product sheet, use conditional formatting to highlight the unique features of each version.
This way, all conditions are satisfied, and you can easily update variations when necessary without creating an entirely different sheet.
Tip # 3: Use the right tool
Hiring a professional designer to create a data sheet that best represents your brand and products might be a bit expensive for you. Apimio tells you about the things you need to look out for while you’re opting for the right tool. Using the right tool would save you time and the cost associated with hiring a professional designer to create and manage one for your company.
Tip # 4: Get an outsider’s perspective
Once you’ve followed the tips mentioned above, the next thing you need to do is to get a second opinion on your product data-sheet.
The observer should preferably be someone from the outside, this allows you to have a look at your data sheet from a different perspective and also highlights the mistakes and flaws that need to be fixed!
Creating product data sheets can seem overwhelming at first, but you’ll be surprised how easy it is with the help of our simple guide.
If you have any questions along the way, please feel free to leave them in our comment section. We would love to hear from you!
How to automate your Product data Sheets Creation process?
- Download our free Product data sheet template and start creating new Product Datasheets for your products faster.
- And if you’re from the Fashion industry, Explore What Line sheets are and their use in our new blog: What are Line sheets and How to Optimize them.
- Read more about our Product Information related Guides here.
- Learn how you can use a PIM tool to Improve your Product Time to Market & SEO. Start your Free 14 Day Trial.
- Contact our support or Comment your thoughts under the blog section if you have any questions or issues.
Frequently Asked Questions
What is a Product Data Sheet?
A Product data sheet is a short, single-page file, often available in a PDF format, used to summarize and explain a product’s key technical aspects, components, materials, and functionalities. The product data sheet template is often customized based on client-specific market demand or regulatory requirements.
What should a product data-sheet include?
A product data sheet includes dimensions, weight, materials, and other important details according to specific regulatory, market, or client-specific requirements.
What are the benefits of creating an effective product data sheet?
1. Highlights the most important features of your product.
2. It Helps you to show potential customers why your product is better than the competition.
3. You can answer common questions about your product up front.
Regardless of your business area, keeping track of the overall product portfolio could be messy. So, having one master file would save you a lot of trouble to record changes in product specs. Then imagine that’s already in Excel with no need for any additional software. That’s when the Product Database Excel Template comes into the picture.
Above all, this sheet can be used for internal departmental communication as well as business-to-business operations. In general, from sales to distribution, all parts of the supply chain can refer to one single file to check the product information. Therefore, with the option to accommodate a large amount of information, this Product Database is essential in organizing and retrieving needed information.
Product Database Excel Template Features
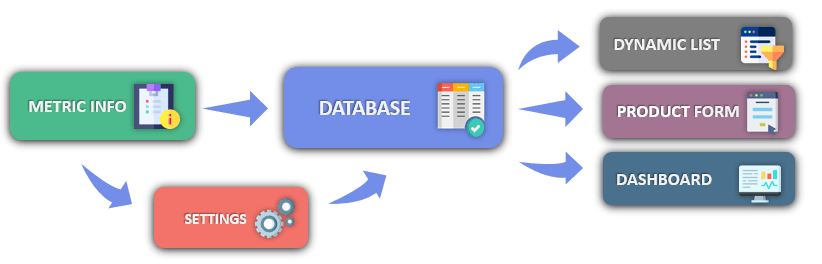
In summary, the template includes five main sections. These are 1. Navigation Menu, 2. Metric Info, 3. Settings, 4. Database and 5. Output sections.
Furthermore, the Dynamic List, Product Form and Dashboard are the output sections of the Product Database Template.
1. Navigation Menu
By using the navigation menu you may easily switch between sections of the Excel spreadsheet. So, you can navigate between each sheet by clicking on the buttons. Furthermore, you may also find the instructions notes here which explain the main functions of each section.
2. Metric Info
There are two ready-made columns in this sheet: Metric and description. While the metric column is necessary for the template to function, descriptions are optional.
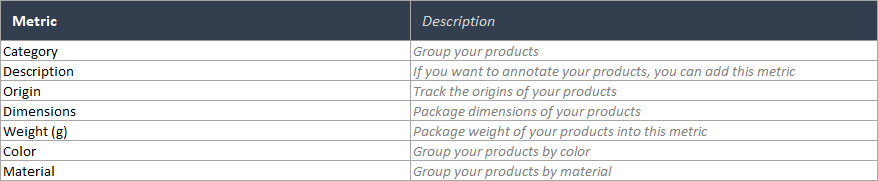
Firstly, in the metric list, you will input data that will be used throughout other template sheets such as Database, Dynamic List and Product Form sections. Moreover, your dropdown selection options in those sheets will be populated from this metric list. Up to 30 different metrics can be input into the list.
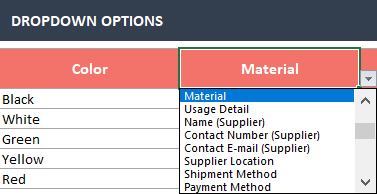
3. Settings
After defining your metrics, feel free to continue with the Settings section. The metrics you input in the previous section will be displayed on the dropdown list in settings headers. Optionally, you may select up to fifteen different metrics and continue with including properties for each metric category.
These options will be displayed in the database. By default, you will have seven metric columns, if you would like to input more metrics press the “+” sign on the top to add additional columns.
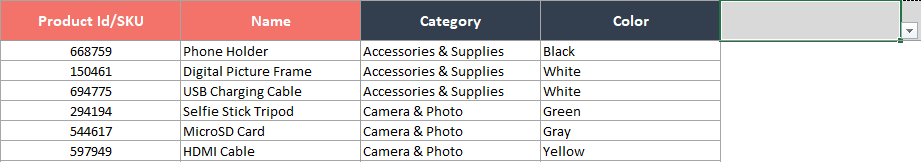
4. Database
This is the main sheet of the Product Excel Sheet. By default, you can edit the 7 ready-made info columns by using the arrows on each cell. These arrows will bring the dropdown options for you to select.
You will select the headings from desired metrics entered on the ‘Metric Info’ sheet. If you have added the details for these metrics in the settings section, you can also select them from cell drop-downs. If you wish to do so, you can also input your data manually.
Should you need to add further info columns after the readily made seven, just click on the arrow with no heading and select which category to be added. The database accommodates up to 30 columns and 2000 rows.
5. Output Sections of Excel Product Database
Product Database Template has three different output sections. These are Dynamic List, Product Form and Dashboard. All these sections gather their data from the Database sheet. The dropdown and filtering options available will be based on your input in the Database section. We will explain these Excel template sections below in detail.
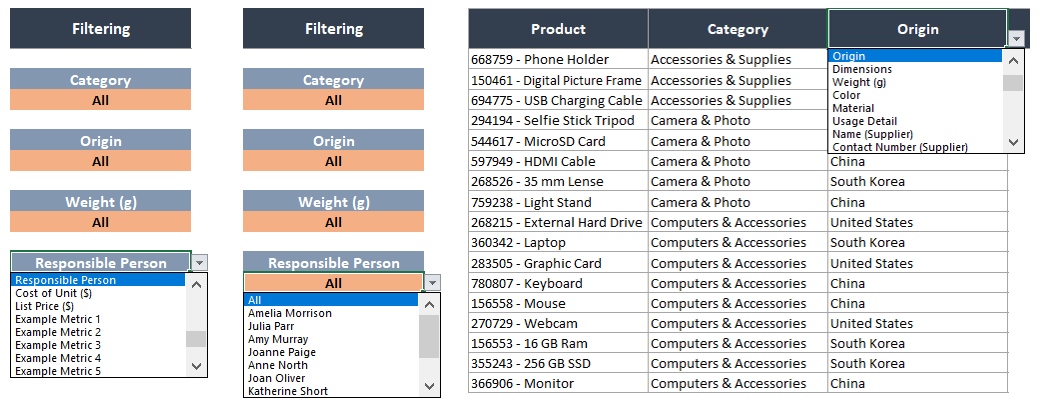
5.1. Dynamic List
Dynamic product list grounds on the product database input. In addition, you will see the filtering options on the left side of the product output list. According to these selections, your list will populate automatically.
You may not only select the filter categories but also decide on the displaying data. In addition, you can also use the column dropdown options to decide on which metric categories you will include in the dynamic list. Please note that, in addition to the product information, you may select up to 10 different info columns.
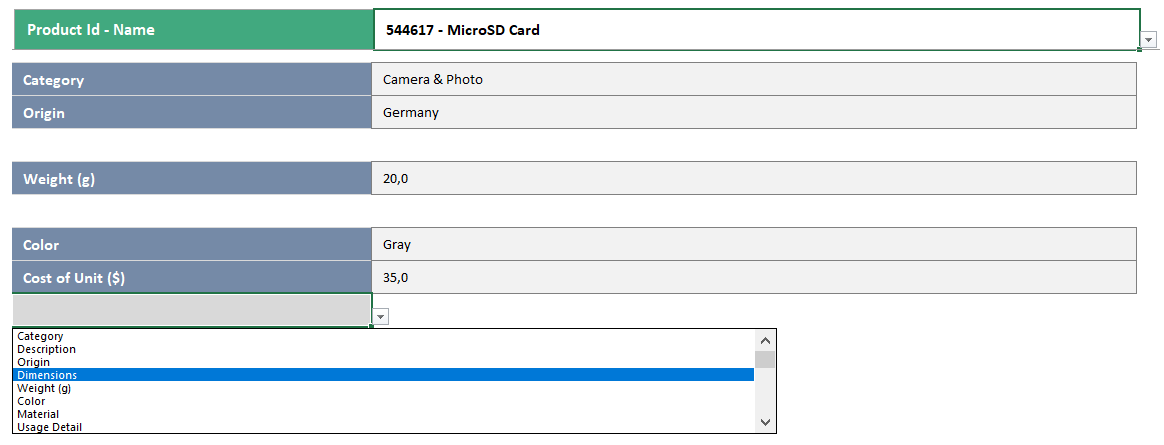
5.2. Product Form
Basically, you can self-create unique product forms here by selecting a product and product specs for the form. Start by selecting the desired product, and continue with adding each product property by using the dropdown options. As this list is fully customizable you can easily design the blanks and order according to your needs.
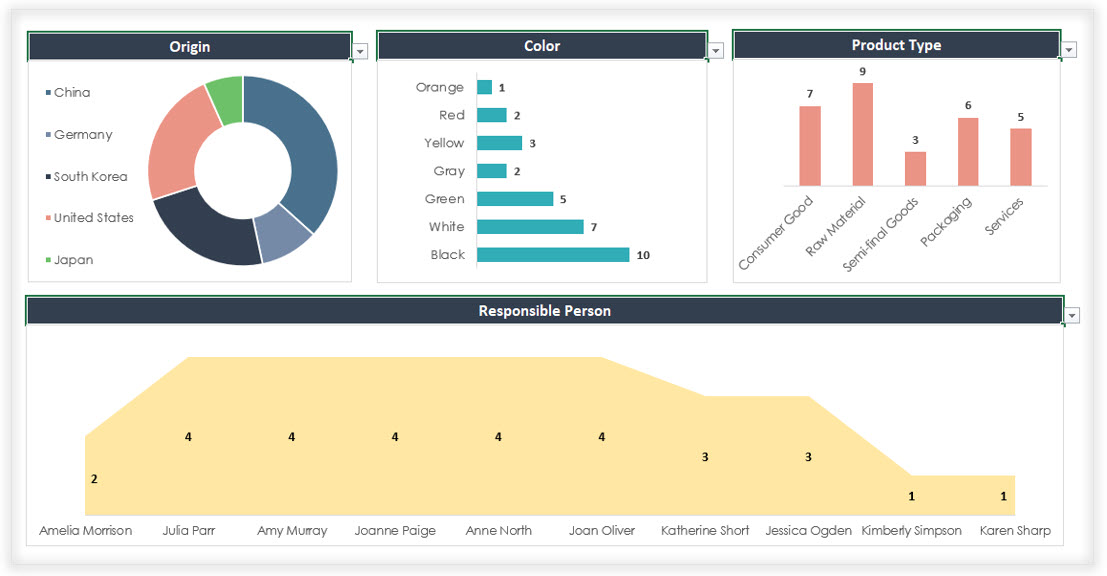
5.3. Dashboard
Last but not least, you are able to create interactive visualization charts in the dashboard section. Just choose the metric category from the top of each chart and this will update the charts automatically.
There are four different charts you can utilize and customize based on your needs. After selecting the analysis metric from the dropdown options arrow, you can also change the design and colors of the charts.
Product Database Excel Template Features Summary:
- Product data analysis in Excel
- Customizable input data table
- Dynamics summary charts
- Informational notes included
- No installation needed, ready-to-use
- Works both on Mac and Windows
- Compatible with Excel 2010 and later versions
- Does not include any VBA code or macros
Product Database Template is a ready-to-use Excel Template and provided as-is. If you need customization on your reports or need more complex templates, please refer to our custom services.
| Posted on July 16, 2016 |
Have you wondered if it would be handy to have a product catalog for your small business?
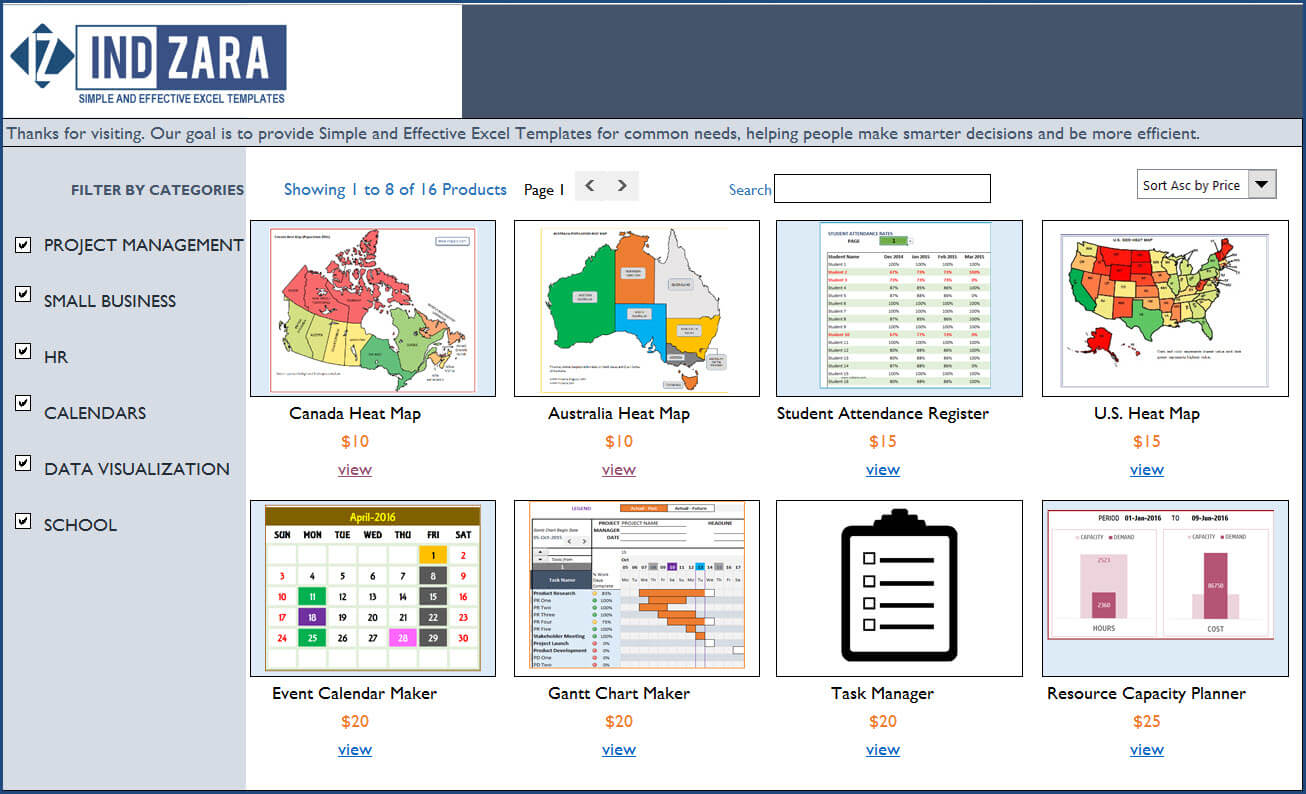
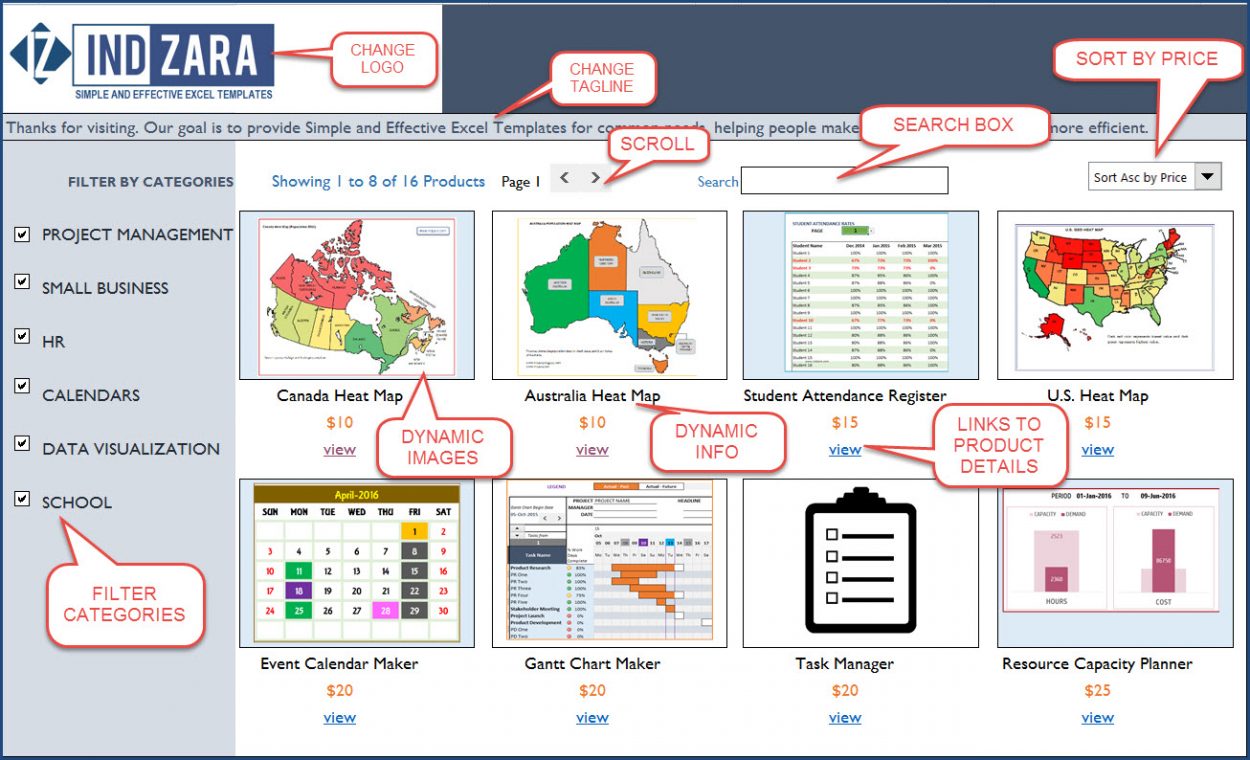
Did you know that we can create the entire online product catalog or online store experience within Excel? Without payment processing, of course 🙂 You could use this to share your product info with your prospects and customers in an interactive tool.
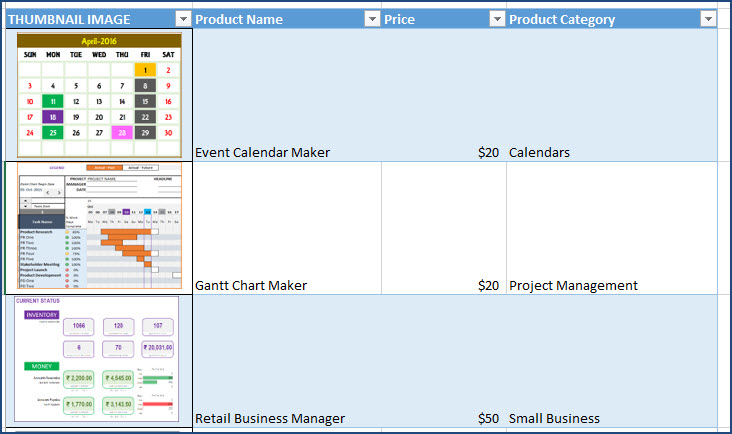
This is how the product catalog/store appears in Excel.
For more features try our premium template Small Business Digital Catalog
If this sounds interesting, please read further on the functionality and for how to use this (hint: it’s so easy. Just enter your data and you are done). You can download this Excel template for free using the link below.
Free Download
Benefits of Product catalog in Excel
- Filter products by Categories
- Search products by keywords (on Product Name)
- Sort products by Price (Ascending or Descending)
- Scroll to see products in sets of 8
- Add thumbnail images to appear on Catalog
- Add links to website as needed on product detail sheets
- Catalog links to individual product detail sheets
- Format the catalog as needed with usual Excel formatting options
- Customize product detail pages as needed
Video Demo
How to create Product catalog for your business?
Overview of Steps
- Unhide hidden Input_Data sheet. Enter product categories and product data for your business.
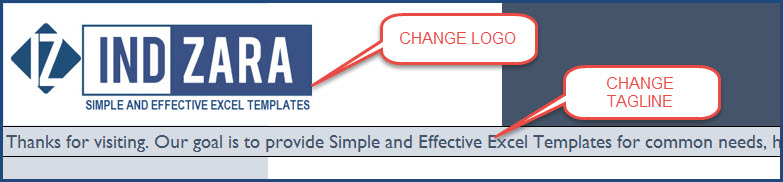
- In Product_Catalog sheet, change logo and tagline text to suit your business.
- In each product’s individual product detail sheet, rename the sheet to match the product name
- Update product image and highlights for each product
- Change formatting – colors, fonts, etc. as needed
Detailed Steps
Entering product data
Unhide Input_Data sheet.
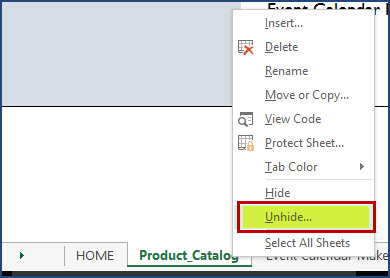
Select Input_Data Sheet.
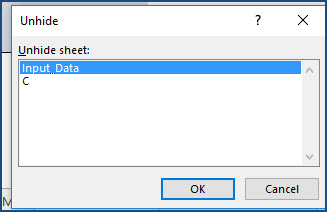
Now, the sheet should be open and visible.
Enter Product Categories you need. It is set up for up to 6. If you need only 5, just select the 6th category (cell A8) and hit the Delete key to clear value.
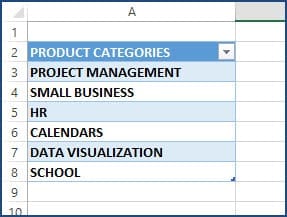
Enter Product Data in the Products table.
Click on a product thumbnail image and choose Change Picture. Select picture from your computer.

Enter product name, price and category.
This ends our product data entry process for one product. Repeat for all products. After you enter all your products, you can hide this sheet. Now, we are ready to customize the catalog/store appearance.
Customize Catalog Appearance
First, in the Product_Catalog sheet, change logo by changing picture as explained above. Change the tagline text to suit your business.
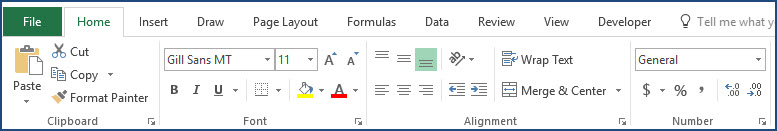
If you want to change the colors, fonts or any formatting, please select cells and change formatting as usual in Excel.
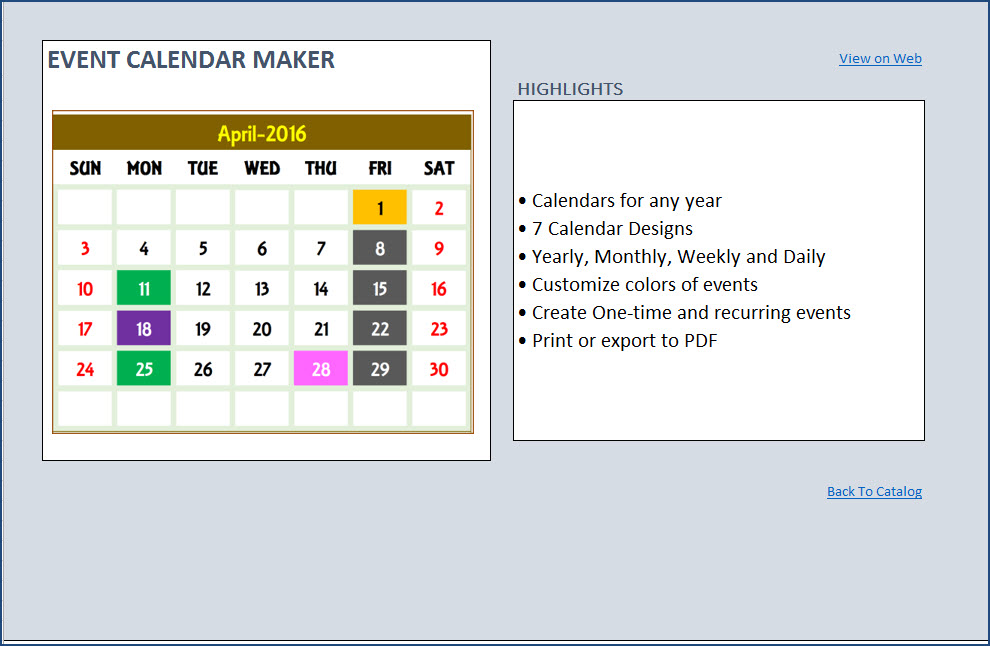
Customizing Product Details Excel Sheet
You will notice that in the catalog, there are links to product detail sheets. Each product has its own sheet where we have its image and description.
- Rename the sheet to match your product name. If your product name is Cool Product, please rename the sheet to Cool Product.
- Replace image and description with your products’ info.
- I have added two links, one to the product page on the website and the other to go back to Catalog. Replace the web link with your product web page link. You can remove the web link if you don’t need or have.
- (Optional) You can change formatting (colors, fonts) as needed. There are no formulas in the product detail sheet.
Repeat this step for each of your products.
Tip: to insert a bullet as I did in the product highlights, use Alt+0149.
Once you have completed all your product detail sheets, you are done. You can go back to the Product_Catalog sheet and your catalog is ready. Start. Sort, Search, Filter, Scroll. 🙂
Print/Export
You can export to PDF or print as all sheets are set up as print friendly in this excel product database template.
Limits
- Designed by default for 30 products & 6 product categories. Can be extended if needed.
- Names of Products should match the Product Detail Sheet Names. This allows hyperlinks to function properly.
As always, I look forward to your feedback to understand how this can be extended to suit more small business needs. If you have any feedback or suggestions, please leave them in the comments. Thanks.
Recommended Template
-

Small Business Digital Catalog – Excel Template
$35
Related Free Templates
Improve Collaboration with Real-Time Work Management in Smartsheet
Streamlining business processes, managing workflows, and enabling cross-functional collaboration is the key to the success of your project or organization. To ensure that your business reaches its goal and objectives in the most efficient way, consider using a tool that enables you to plan, manage, automate, and report on projects and processes in real-time, in one centralized location.
Smartsheet is an enterprise work execution platform that is fundamentally changing the way businesses and teams work. Over 80,000 brands and millions of information workers trust Smartsheet to help them accelerate business execution and address the volume and velocity of today’s collaborative work.
The familiar Smartsheet interface that is designed for how people actually work leads to rapid and broad adoption across your organization. Use self-service reports and dashboards in Smartsheet to provide real-time visibility into resources, status, and performance, so you can rapidly align operations with strategy.
Try Smartsheet to discover why millions of professionals around the world use it to move from idea to impact, fast.
Inventory Spreadsheet Template – Excel Product Tracking
Managing stocks or inventory is very important if you are a retailer. However, without the help of professional software, it is almost impossible to keep an eye on your warehouse stocks. Unfortunately, professional software costs you a considerable amount from your pocket. Still, in this article, we will show you how to build an inventory tracking template in Excel. You can download and use it free of cost.
When the bulk order comes from a customer, you need to be ready to tell the customer how many stocks are there in the warehouse and the time required for you to deliver all the products.
Table of contents
- Inventory Spreadsheet Template – Excel Product Tracking
- How to Create Inventory Template in Excel?
- Things to Remember
- Recommended Articles
How to Create Inventory Template in Excel?
You can download this Inventory Tracking Excel Template here – Inventory Tracking Excel Template
Follow the below steps to create an inventory tracking template in Excel.
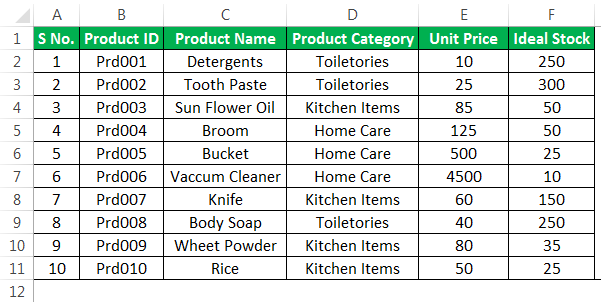
- The first thing is we need to create a product master. This sheet should include all the product’s basic information.

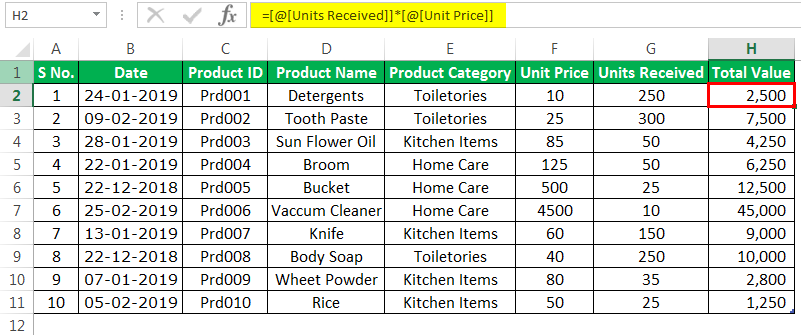
- Now, create one more sheet for Product Inflow. This sheet is to add all the incoming items from the vendors.

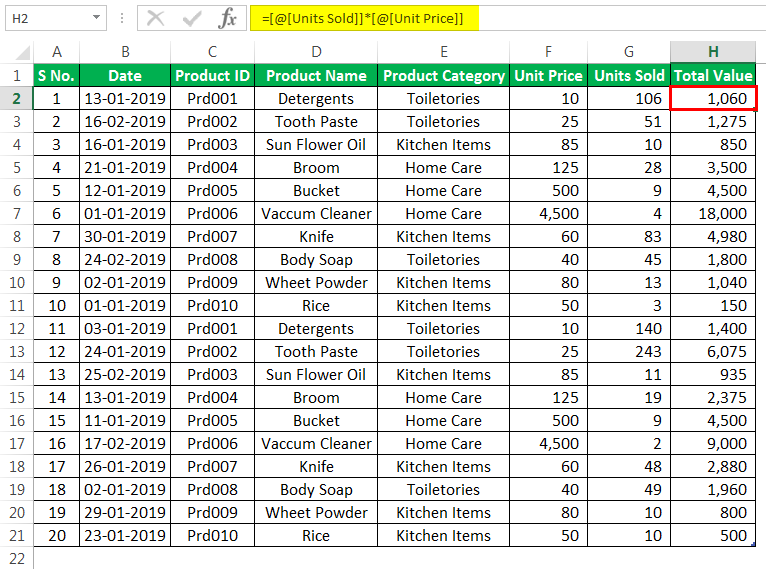
- Now, create a Stock Outflow sheet. This sheet is to update when the actual sale happens.

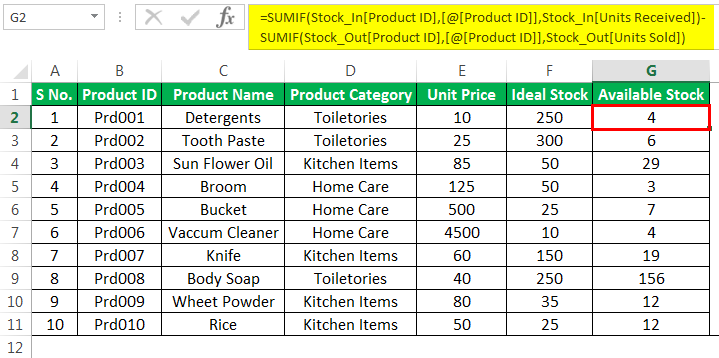
- In the Product Master sheet, arrive at how many units are available as the stock in the warehouse.

- The technique we have used here is: first, we have arrived at how many units were received from the vendors from the stock inflow sheet. Then, we have deducted the quantities sold data from the stock outflow sheet. This sheet would give me how many stocks are available for each product.
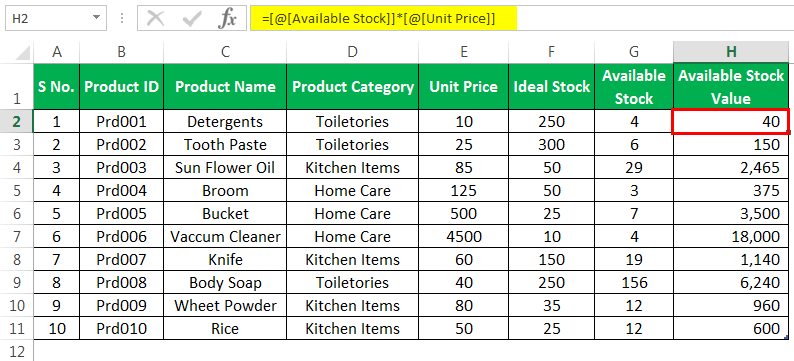
Now, arrive at an available stock value by multiplying the available stock by Unit Price.

- Let us now look at the next step. First, we have created a Product Master Sheet, Stock Incoming Tracker, and Stock Outgoing Tracker. Then, we arrived at the available stock by deducting stock received from a stock sold.
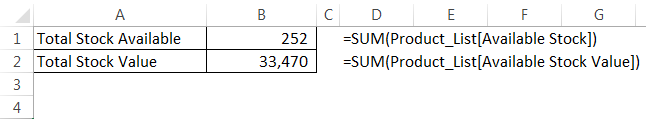
Now, we need to create more sheets called “calculations.”
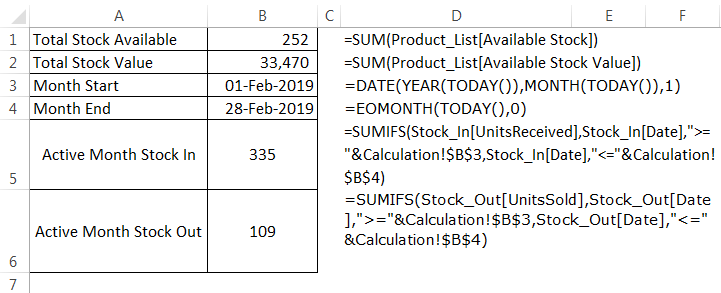
- We first need to arrive at the Total Stock Available and the Total Stock Value in the calculation sheet.

We have added an available stock column and available stock value column from the product list table.
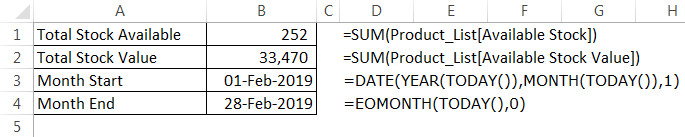
- Create the current month’s starting date and ending date. We have applied the formula, which will automatically create the first day and last day of the current month.

- Now, the current month’s stock inflow and stock outflow have arrived.

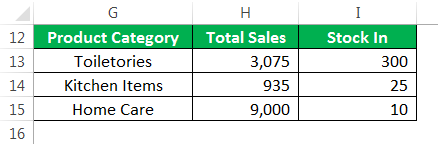
- Arrive category-wise current month sales and stocks available.

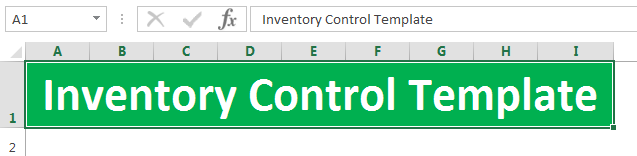
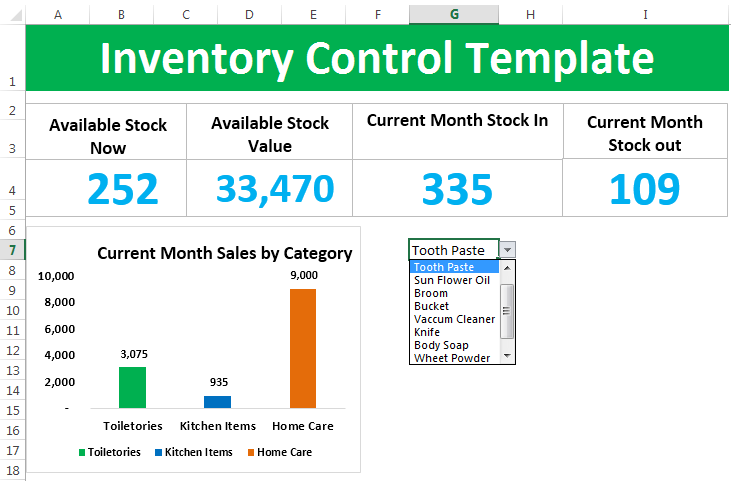
- We need to create an excel dashboard for our inventory control template. Create a sheet and name it Dashboard.
- First, name the heading Inventory Control Template.

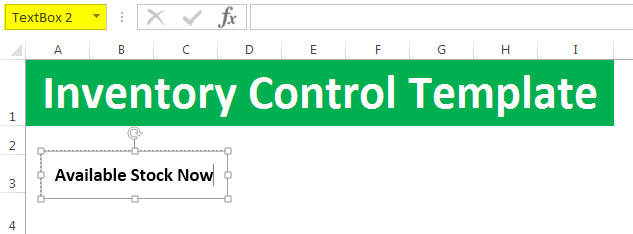
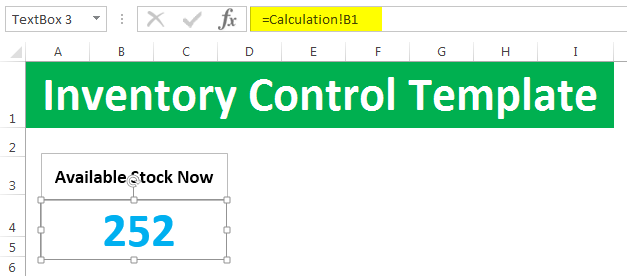
- Draw a text box and type Available Stock Now.

- Draw one more text box under this and link to the calculation sheet for Available Stock Now cells.

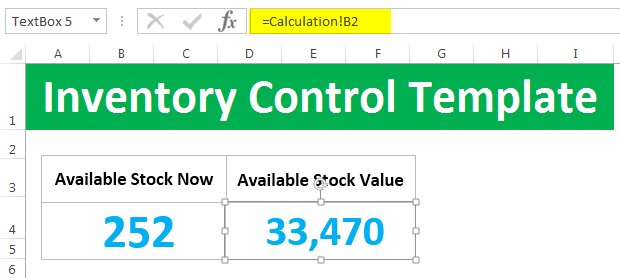
- Like this, we must do the same for Available Stock Value.

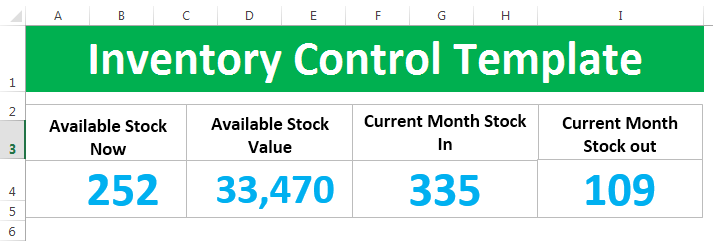
- Similarly, create boxes and give a link for the Current Month Stock In and Current Month Stock Out.

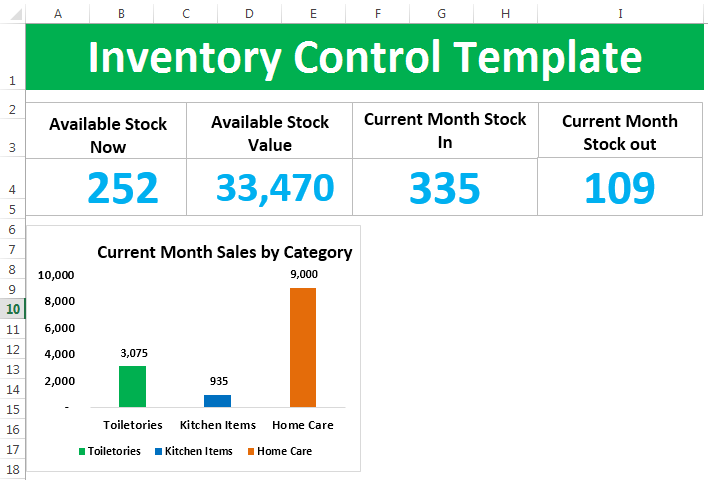
- Create a simple column chart for the current month’s category-wise sales.

- We must create a down list in excel of all the items from the product list table in Excel.

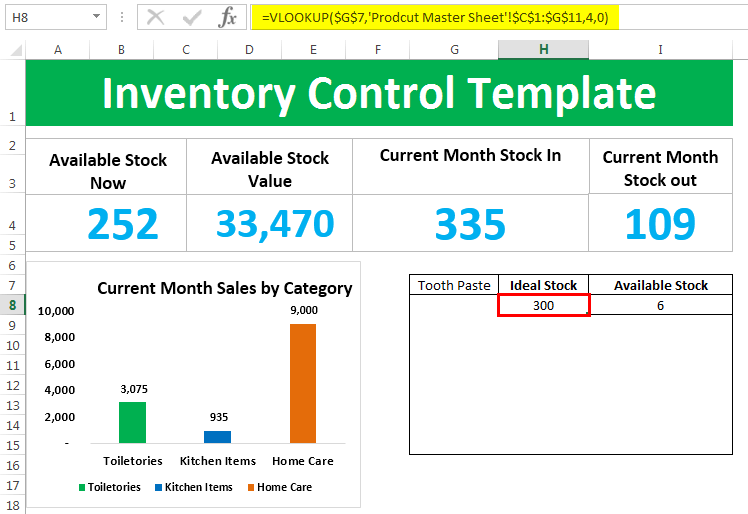
- Apply VLOOKUP and arrive at the ideal and current stock quantities.

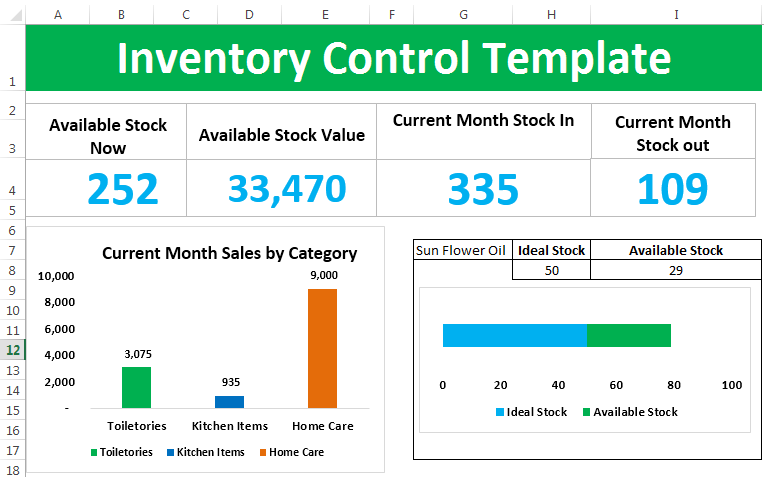
- Create a simple bar chart and show the difference between Ideal and Availableu stock.

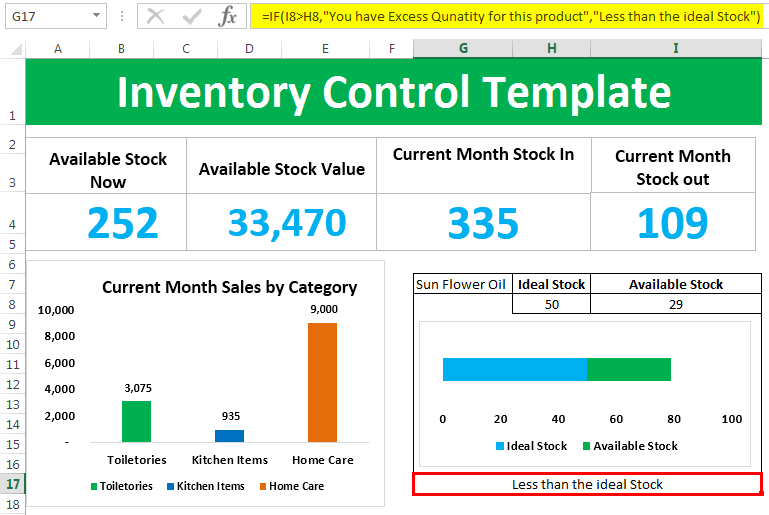
- Now, we must enter the recommendation as if the available stock is less than the ideal stock, then the recommendation is Order Quantity or else the recommendation is You have Excess Quantity for this product.

Now, your inventory tracking Excel template is ready to use.
Things to Remember
- Firstly, we must update all the available products in the “Product List” worksheet. It will help if we ensure there are no duplicate entries to it.
- When we receive fresh or new items, we need to return to the “Product List” sheet and update the latest products accordingly.
- We need to update the “Stock Out” sheet data if any sales happen.
- If any stocks are received from the vendor, then update the data in the “Stock In” sheet.
- All the above steps dashboard will work fine and show the inventory analytics if followed.
Recommended Articles
This article is a guide to the Inventory Template in Excel. We discuss the steps to create an inventory stock template in Excel, practical examples, and a downloadable Excel template. You may learn more about Excel from the following articles: –
- Creating a KPI Dashboard in Excel
- Text Box in VBA
- Create a Dashboard in Excel
- Using Excel Chart Wizard
Home / Ready to use Excel Inventory Management Template [User form + Stock Sheet]
Sometimes it’s really hard to track stock or inventory in a normal spreadsheet. And you do need a template that can help you to track your stock effectively.
So if you are searching for an Excel inventory management template that can help you track your stock easily then you are landed in a right place. For me, it’s an honor to tell you that here I have an amazing template in which you can track your inventory easily.
This is an automated template that will help you to save a lot of time. As all the formulas and data sheets are already arranged this way you don’t need to do anything. It’s simple, quick, and easy to use and I’m sure you’ll love it.
Dashboard
Here all the important insights are in a single sheet. And, you don’t have to worry about updating it again and again.

These insights will get updated in real-time, as soon as you add new data. This dashboard will help you to track the following important insights.
Current Stock
This figure is the current stock units as of date. It will update with every single entry done by you for stock-in and stock-out. It will calculate by deducting stock-out from stock-in.

Stock Value
Stock value is the total value of the current stock after deducting stock out from stock in. It’s calculated by using the unit price of each product.

Stock In
Stock In is the units you have entered in stock-in data in the current month. If you are using pro version you can use the drop-down to check stock in quantity for previous months as well.

Stock In Return [Pro]
This section will show you the stock-in units which you have returned back to suppliers. In pro version, you can track them supplier-wise.

Stock Out
The stock out is the units you have entered in stock out data in the current month. Using the drop-down menu, you can check for other months as well.

Stock Out Return [Pro]
This section will show you the stock-out units which your customers have returned back to you. In pro version, you can track them customer-wise.

Category Wise Stock
The current stock value is for each product category. You can specify the category for each product in the product master sheet.

Product Wise Stock and Reorder Level
This part of the dashboard will show you the product’s current stock and value. It will also tell you about the re-order level of a product. And, you will get an alert message if the stock level is less than the re-order level. There is a drop-down to select different products.

User Forms
You can use these user forms to enter data. I have managed user forms in this way that you have to enter minimum data. Here are the things you can capture with these user forms.
New Product
By using this user form you can create a new product. The best part is we are using data from the product master to fill other user forms with minimum data.

Stock In
Whenever there is new stock, you can enter that stock using this user form. In this user form, you just have to insert the product name (using a drop-down list), supplier name, and quantity. It will get the rest of the data from your product master sheet.

Stock Out
Use this user form to enter stock-out data. All you have to enter, is the product name, customer name, and quantity. The rest of the data will be captured from the product master sheet.

Invoice Generation [Pro]
In the Pro Version, you can also generate invoices. With an invoice generation sheet, you can instantly create invoices & track data on the sheet. It just works like a stock-out user form, but specifically for invoices.
You can create a proper invoice with all the customer details & further you can also generate a custom report as well. This form stores data in the same sheet where you have stock-out data.

Data Sheets
You can access the data sheets where the entire data will capture from user forms. Every entry in user forms has a serial number which you can use to refer to it.
Product Master
Product Master is the most important sheet in this template. Your all products will be listed here with details.

Stock-In Sheet
The stock-in sheet will contain your entire stock-in data. Each entry is captured with a unique serial number, and you can use that serial number to refer to a specific entry. And, if you are using the pro version, the stock-in return will also be captured here in this sheet.
Stock-Out Sheet
Same as the stock-in sheet stock-out will contain the entire stock-out data. You can enter your data in this sheet using the stock-out user form. Entries in this form are also captured with a unique serial number. And, if you are using the pro version, the stock-out return will also be captured here in this sheet.
Customer Details [Pro]
You can enter customer details in this sheet which will further use in the stock user form to track customer-wise stock details.

Supplier Sheet [Pro]
You can enter supplier details in this sheet which will further use in stock in user form to track supplier-wise stock details.

Reports
In this template, all the major insights are on the dashboard. But, you can also extract the following reports.
Stock Report
This stock report will be generated from your product master sheet. It will give you a complete summary of the current stock.

Customer Wise Stock Out [Pro]
You have the option to create a customer-wise report with a pivot table for stock out. It will show you the quantity and values of stock out.

Supplier Wise Stock Out [Pro]
You also have the option to create a supplier-wise report with a pivot table for stock out. It will show you the quantity and values of the stock.

Product Wise Current Stock [Pro]
In one click you can also generate a product-wise current stock report. It will show you the product-wise quantity and value of the current stock.

Instructions
This template is user-friendly and easy to use, and here are some instructions to follow which will help you to use this template effectively
This template has a dynamic menu bar that has all the option buttons on it. You can call it anytime using this menu button.

From this menu bar, you can navigate to any of the data sheets, and user forms, and generate reports.

Use the back button at the top of the menu bar to go to the dashboard

Entering Data
As I have already mentioned that you have user-forms to capture your data. And, data from each user form will be captured into a separate data sheet. In the user form, after entering your data, click on the enter button to save the entry.

Don’t
- Change the name of any worksheet.
- Delete any worksheet.
- Add or remove any cell, row, or column in the user form.
Things You Can Try
- You can create your pivot table from data sheets (available in the pro version).
- You can take a printout of your dashboard.
- Before using this template make sure to enable macros.
Download Your Template
Create a Spreadsheet in Excel (Table of Content)
- Introduction to Create Spreadsheet in Excel
- How to Create a Spreadsheet in Excel?
Introduction to Create Spreadsheet in Excel
A spreadsheet is a grid-based file designed to manage or perform any calculation on personal or business data. It is the best choice for users because it has 400+ functions and features such as pivot, coloring, graph, chart, and conditional formatting. It is accessible in both Office 365 and MS Office. Office 365 is a cloud-based application, whereas MS Office is an on-premises solution.
The workbook is the Excel lingo for ‘spreadsheet.’ MS Excel uses this term to emphasize that a single workbook can contain multiple worksheets, each with its own data grid, chart, or graph.
How to Create a Spreadsheet in Excel?
Here are a few examples of creating different types of spreadsheets in Excel with the key features of the created spreadsheets.
You can download this Create Spreadsheet Excel Template here – Create Spreadsheet Excel Template
Example #1 – How to Create Spreadsheet in Excel?
Step 1: Open MS Excel.
Step 2: Go to Menu and select New >> Click on the Blank workbook to create a simple worksheet.
OR – Press Ctrl + N: To create a new spreadsheet.
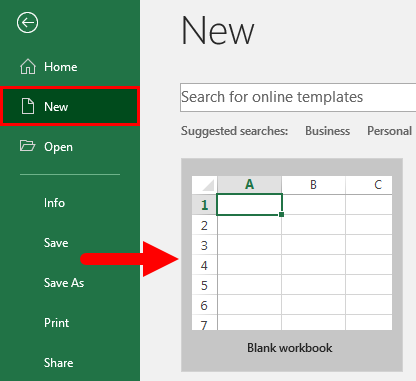
Step 3: By default, Sheet 1 will be created as a worksheet in the spreadsheet. The name of the spreadsheet will be given as Book 1 if you are opening it for the first time.
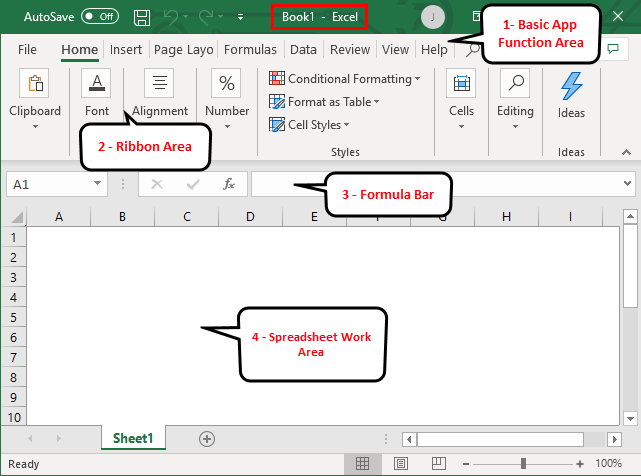
Key Features of the Created Spreadsheet:
- Basic App Functions Area: There is a green banner that contains all types of actions to perform on the worksheet, like – save the file, back or front step move, new, undo, redo, and many more.
- Ribbon Area: This is a gray area just below the basic app functions area called Ribbon. It contains data manipulation, a data visualizing toolbar, page layout tools, and many more.
- Spreadsheet Work Area: By default, a grid contains alphabetic columns like A, B, C, …, Z, ZA…, ZZ, ZZA… and rows as numbers like 1,2 3, …. 100, 101, and… so on. Each rectangle box in the spreadsheet is called a cell, like the one selected in the above image (cell A1). It is a cell where the user can perform their calculation for personal or business data.
- Formula Bar: It shows the data in the selected cell; if it contains any formula, it will show here. Like the above area, a search bar is available in the top right corner, and a sheet tab is available on the downside of the worksheet. A user can change the name of the sheet name.
Once you create an Excel Spreadsheet, you can convert it to a universally accepted format like PDF. For convenience, some useful Excel to PDF converters converts Excel to PDF files for free while maintaining the original formatting.
Example #2 – How to Create a Simple Budget Spreadsheet in Excel?
Suppose a user wishes to design a spreadsheet for budget calculation. For 2018, he has a few products and their quarterly sales. He now wants to present his client with this budget.
Let’s see how we can do this with the help of the spreadsheet.
Step 1: Open MS Excel.
Step 2: Go to Menu and select New >> Click on the Blank workbook to create a simple worksheet.
OR – Press Ctrl + N: To create a new spreadsheet.

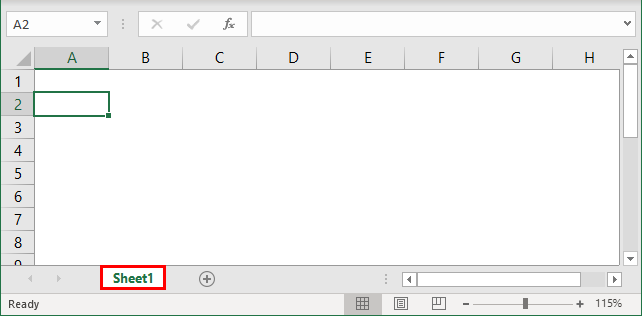
Step 3: Go to the spreadsheet work area, sheet 1.
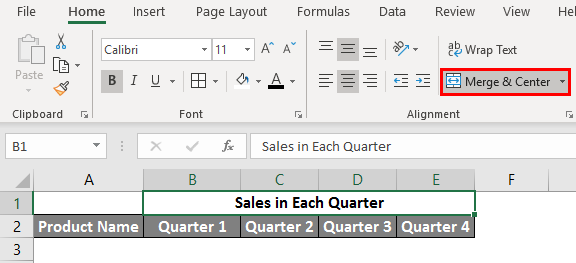
Step 4: Now create headers for Sales in each quarter in the first row by merging cells from B1 to E1. In row 2, give the product name and each quarter’s name.
Step 5: Write down all product names in column A.
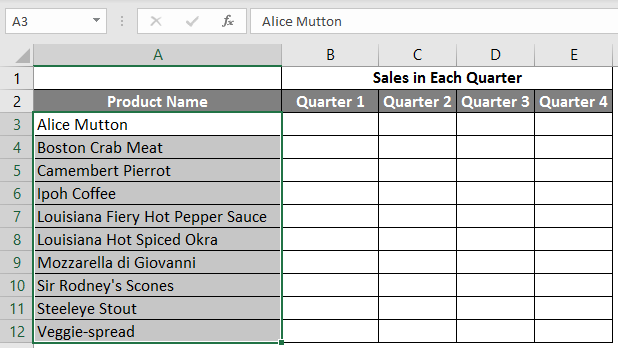
Step 6: Provide the sales data for each quarter before every product.
Step 7: In the next row, put one header for Grand Total and calculate each quarter’s total sales.
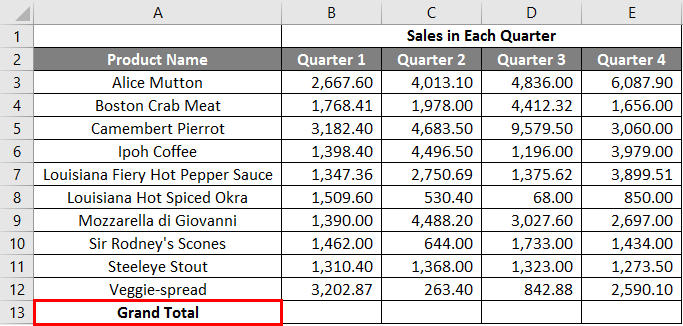
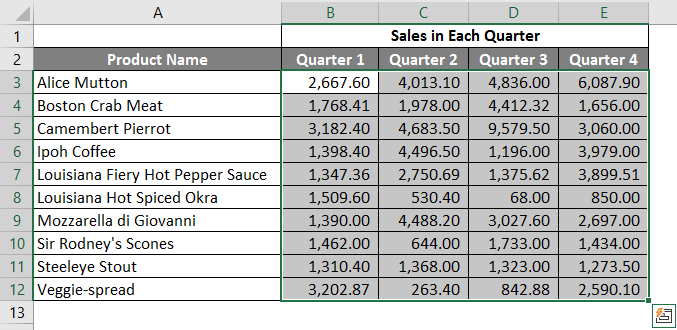
Step 8: Calculate the grand total for each quarter by summation >> apply in other cells in B13 to E13.
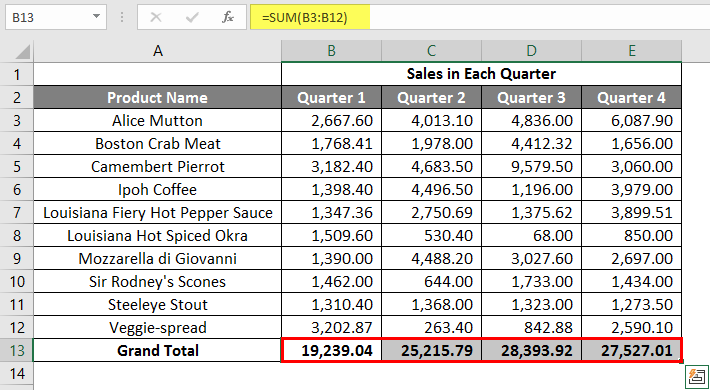
Step 9: Let’s convert the sales value into the ($) currency symbol.
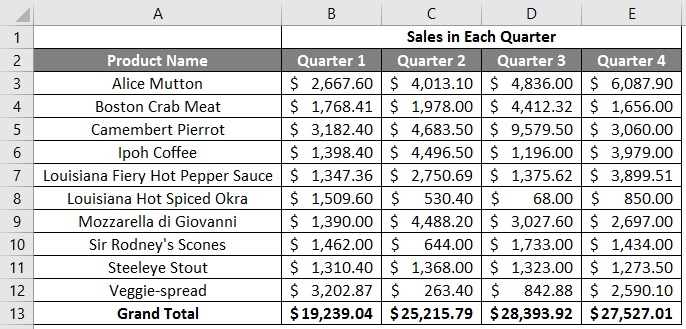
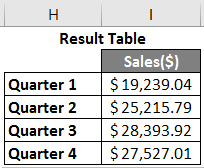
Step 10: Create a Result Table with each quarter’s total sales.
Plot the pie chart to represent the data to the client in a professional way that looks attractive. A user can change the look of the graph by just clicking on it.
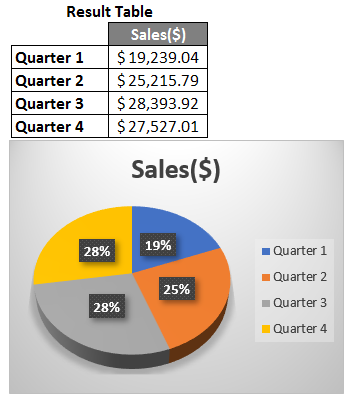
Summary of Example 2: As the user wants to create a spreadsheet to represent sales data to the client, it is done here.
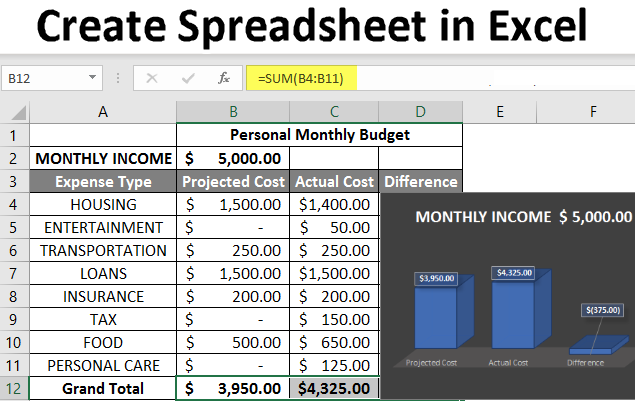
Example #3 – How to Create a Personal Monthly Budget Spreadsheet in Excel?
Let’s assume a user wants to create a spreadsheet to determine their monthly personal budget. For the year 2022, he has estimated costs and actual costs. He now wants to show his family this budget.
Let’s see how we can do this with the help of the spreadsheet.
Step 1: Open MS Excel.
Step 2: Go to Menu and select New >> Click on the Blank workbook to create a simple worksheet.
OR – Press Ctrl + N: To create a new spreadsheet.

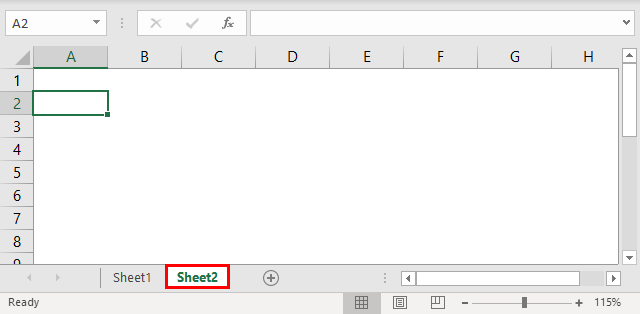
Step 3: Go to the spreadsheet work area, Sheet 2.
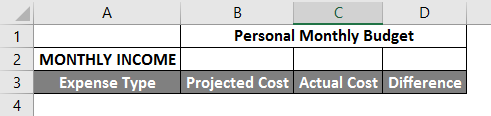
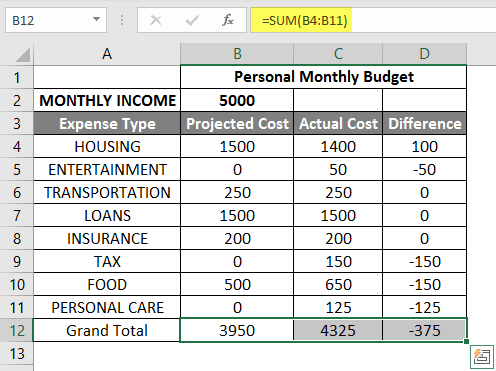
Step 4: Now create headers for Personal Monthly Budget in the first row by merging cells from B1 to D1. In row 2, give MONTHLY INCOME; in row 3, give Expense type, Projected Cost, Actual Cost, and Difference.
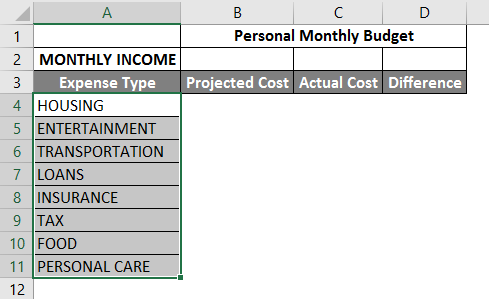
Step 5: Write down all the expenses in column A.
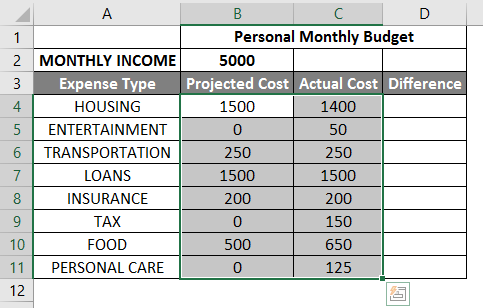
Step 6: Now, provide the monthly income, Projected cost, and Actual Cost data for each expense type.
Step 7: In the next row, put one header for Grand Total and calculate the total and difference from the project to the actual cost.
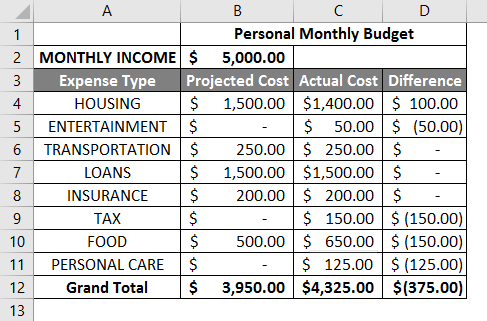
Step 8: Now highlight the header and add boundaries using toolbar graphics. >> The cost and income value in $, so make it by currency symbol.
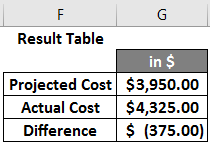
Step 9: Create a Result Table with each quarter’s total sales.
Step 10: Plot the pie chart to represent the data for the family. A user can choose one which he likes.
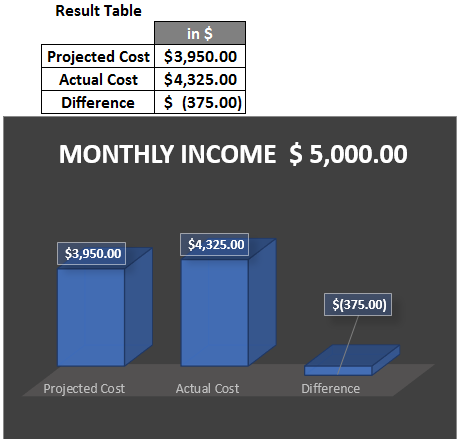
Summary of Example 3: As the user wanted to create a spreadsheet to represent monthly budget data to the family, we have created the same here. The close bracket shows in the data for the negative value.
Things to Remember
- A spreadsheet is a grid-based file designed to manage or perform any calculation on personal or business data.
- It is available in MS Office as well as Office 365.
- The workbook is the Excel lingo for ‘spreadsheet.’ MS Excel uses this term to emphasize that a single workbook can contain multiple worksheets.
How to add data in a spreadsheet Video
Recommended Articles
This article is a comprehensive guide to creating Spreadsheets in Excel. Here we have discussed how to create a Spreadsheet in Excel, examples, and a downloadable Excel template. You may also look at the following articles to learn more –
- Excel Spreadsheet Formulas
- Group Worksheets In Excel
- Excel Spreadsheet Examples
- Worksheets in Excel