
You can automatically add diagram content, including shapes and metadata, into a Word document by using the Export to Word feature. Then use the document as the basis for process guidelines and operation manuals. For example:
-
A support specialist has a service request process map with details about departments, owners, and task schedules. She creates an operating manual with the Word document.
-
A recruiter has an organization chart with shape metadata, such as current headcounts, open positions, and team budgets. He sends an ad hoc report using the Word document to management.
-
A business analyst updates a process diagram, based on imported data, that has KPIs, such as cost, duration, and status, depicted as data graphics. Each month, she uploads the Word document to OneDrive to share with stakeholders.

Note: This feature is only available to users with Visio Plan 2. If you’re not sure what version of Visio you’re using, click File > Account > About Visio. If you are an IT professional managing the Microsoft 365 update process, check out the channel releases page to learn which updates are provided in each channel.
Export the Visio diagram to a Word document
-
Make sure your diagram has shapes with text and some shapes have shape data.
-
If you have a multi-page diagram, select the page you want. This feature exports only one page at a time.
-
On the Process tab, in the Export group, select Word.
You can also export to a Word document by clicking File > Export > Create Word Document > Create Document.
-
If you want, customize the Word document from the Export to Word pane.
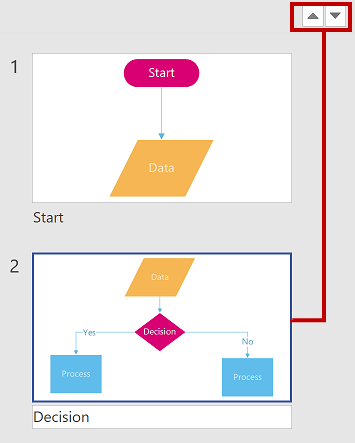
Preview
Tab-
To exclude a shape and its metadata from the Word document, right click the snippet and then select Exclude from output.
-
To reorder a snippet, select it, and then select the up and down arrows. A snippet is a portion of a diagram that is targeted for exporting to a document.

Note: When you select a snippet in the Preview tab, the shape is highlighted in the diagram. When you select a snippet on the diagram, the snippet is highlighted in the Preview tab.
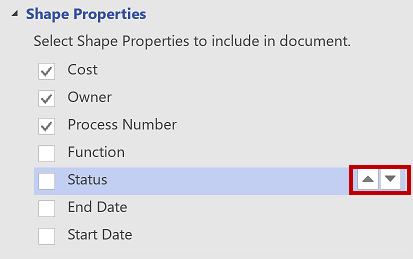
Settings
Tab-
Shape Properties
-
To change the order in which the properties appear in the Word document, select the property and then select the up and down arrows.
-
To add a blank table row in the Word document for each empty property, select Include blank properties.
-
To export hyperlinks in the shape properties to the Word document, select Hyperlinks.
For more information, see Add data to shapes.
-
-
Shape Exclusion
-
To add shape connectors to the Word document, clear Exclude connectors.
-
To document shapes with no shape text, clear Exclude shapes without shape text.
-
To include data graphics with the snippets, clear Exclude Data graphic.
For more information, see Data graphics, an overview.
-
-
Snippet Transparency
-
To emphasize a shape in a snippet, set the transparency level higher for its connections and connected shapes.
-
-
-
At the top of the Export to Word pane, select Export.
Results The Word document is created. You can modify it to fit your needs. At a minimum, we recommend the following:
-
To automatically update company name, title, and author information, select File > Info > Properties, select the down arrow next to Properties, select Advanced Properties, and then edit the corresponding information.
-
To update the Table of Contents, place the insertion point under Contents, and then select Update Table.
For more information, see Create a table of contents in Word.
Feedback or bugs?
Tell us how to improve the feature! Email us your feedback on Visio process documents in Word.
See also
Create a PowerPoint presentation from Visio
Need more help?
A flowchart or flow chart usually shows steps of the task, process, or workflow.
Microsoft Word provides many predefined SmartArt templates that you can use to make a flowchart,
including visually appealing basic flowchart templates with pictures. However, if you have a
process with a tangled flow or you need a custom layout, you can build a complex flowchart
in Word using rectangular, diamond, round, and other box types.

Managers, system analysts, programmers, and engineers adopted flowcharts as a mean of
communication for describing:
- Document workflows
- Data flows
- System operation flows
- Algorithms
No wonder that building blocks and rules of flow charts were standardized by the American
National Standards Institute (ANSI) and International Organization for Standards (ISO)
more than 50 years ago. The current standard defines the drawing direction from top to
bottom and left to right and specific symbols for different types of entities, actions,
etc. E.g.:
You can find all these shapes and other useful visual elements in the Shapes
dropdown list on the Insert tab of Microsoft Word.
The flowchart above is «cross-functional» and defines the responsibility zones of
different business units.
To create a diagram like the one above, follow the next steps (we recommend to check the
tip how to easily organize shapes in
Word,
which demonstrates easy tricks to simplify the drawing routine):
Add the drawing canvas
The drawing canvas is an essential element for the flow chart that you need to add before
adding the flow shapes because of flowchart connectors. You can add flowcharts connectors
only between the shapes within the drawing canvas:
1. On the Insert tab, in the Illustrations group, click
Shapes:

2. On the Shapes list, in the bottom, choose New Drawing
Canvas:

Word adds the new drawing canvas to your flow chart:

Draw the flowchart blocks
3. On the Shapes list, in the Flowchart group,
select the block you want to add:

4. To add text to the selected shape, just double-click in it and enter
the text.
Connect the flowchart blocks by connectors
5. To connect shapes, do the following:
- On the Insert tab, in the Illustrations group, click in the Shapes list and
then select one of the connectors in the Lines group:
- Select the beginning point on the border of the first shape (source) and the ending
point on the edge of the second shape (target):

For more customizations of shapes and connectors, see
how to change format of
diagram shapes in Word
and
how to change flowchart shapes
or
how to change connector
type for flowchart.
Top-to-down flowcharts are perfect for the Portrait page orientation in Microsoft word. For
the Landscape page orientation or the PowerPoint presentation, the preferred layout is
left-to-right. Sometimes left-to-right flow diagrams with delimited borders of organization unit
activities are called Swimlane diagrams or Swimlane flowcharts.
See also this tip in French:
Comment créer un organigramme des opérations dans Word.
A diagram is worth a thousand words, especially if you’re trying to explain a process. And if you know how to make a flowchart in Word, you don’t need a different diagram-creation tool. You can make the flowchart right inside Microsoft Word, no programming or design skills required.


A flowchart is a graphical representation of a series of steps or actions. It’s most effective for depicting a process, data flow, workflow, or decision steps. In a flowchart, each shape holds a meaning. The most basic ones are:
- Oval (or pill shape). Start or end of the process.
- Rectangle. Action or sub-process.
- Diamond. Decision point.
- Parallelogram. Either an input needed for the process, or an output that goes into the next step.
Other shapes are used in flowcharts for very specific applications like data flow diagrams. But the above basic flowchart symbols should be enough for the most common charts. Whether you need just the basics or specialized shapes, you can find them in Word.
In this tutorial, I walk you step-by-step through how to make a flowchart in Microsoft Word using basic shapes. Word offers two ways to create a flowchart. Use the method that lets you make the flowchart you envision.
Note: For this tutorial, I used Microsoft Word for Mac version 16. If you’re using a different version of the application, the interface and steps may be different.
Method One: Create a Flowchart in Word With Shapes
The first way to create a flowchart in Word is by inserting shapes in your document. Here’s what to do:
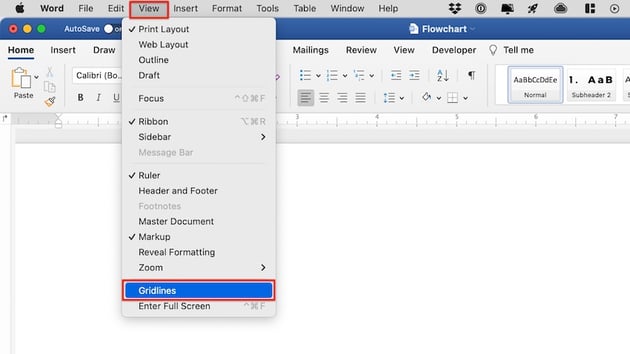
1. Display Gridlines
Before getting started, make sure to switch on gridlines. This will make it much easier for you to create a nice-looking flowchart. Aside from showing you guide lines, when gridlines are on, shapes and lines snap to regular spaces, making it easy to align elements.
To switch on the gridlines, go to View > Gridlines.


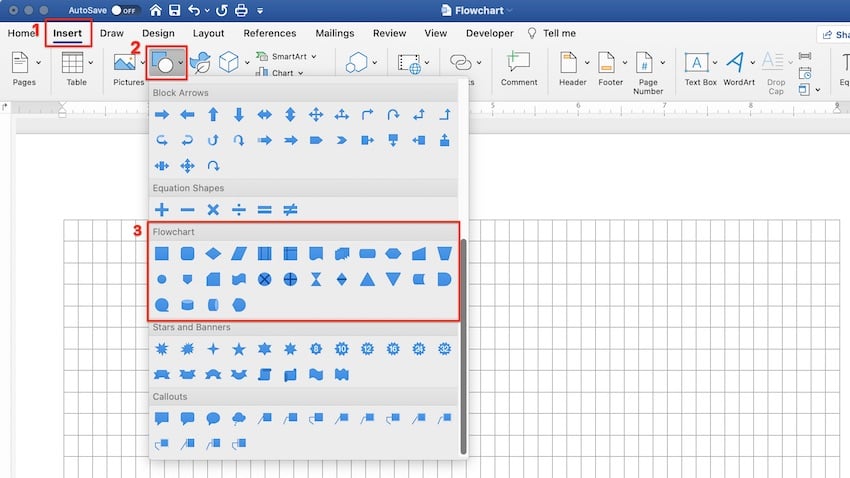
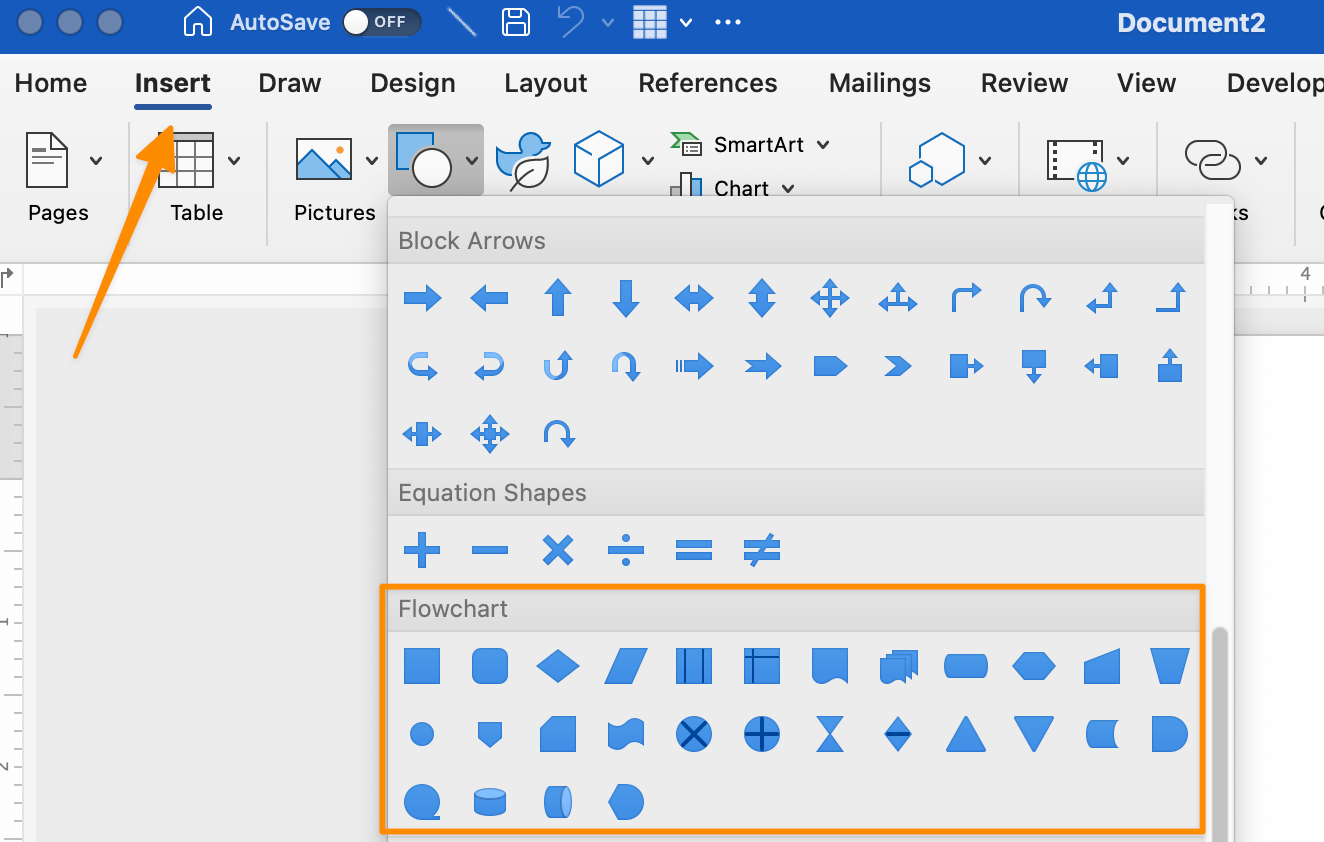
2. Create the Flowchart Shapes
Now you’re ready to start inserting shapes. Go to Insert > Shapes. The shapes menu appears. Scroll down to the Flowchart shapes. If you hover over any shape, a tip-tool appears, letting you know what the shape means. Click on the shape you wish to use.


The cursor turns into a crosshair. Click and drag the crosshair to create the shape to the size you want.


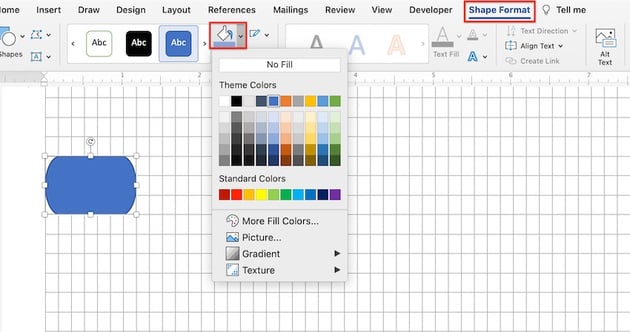
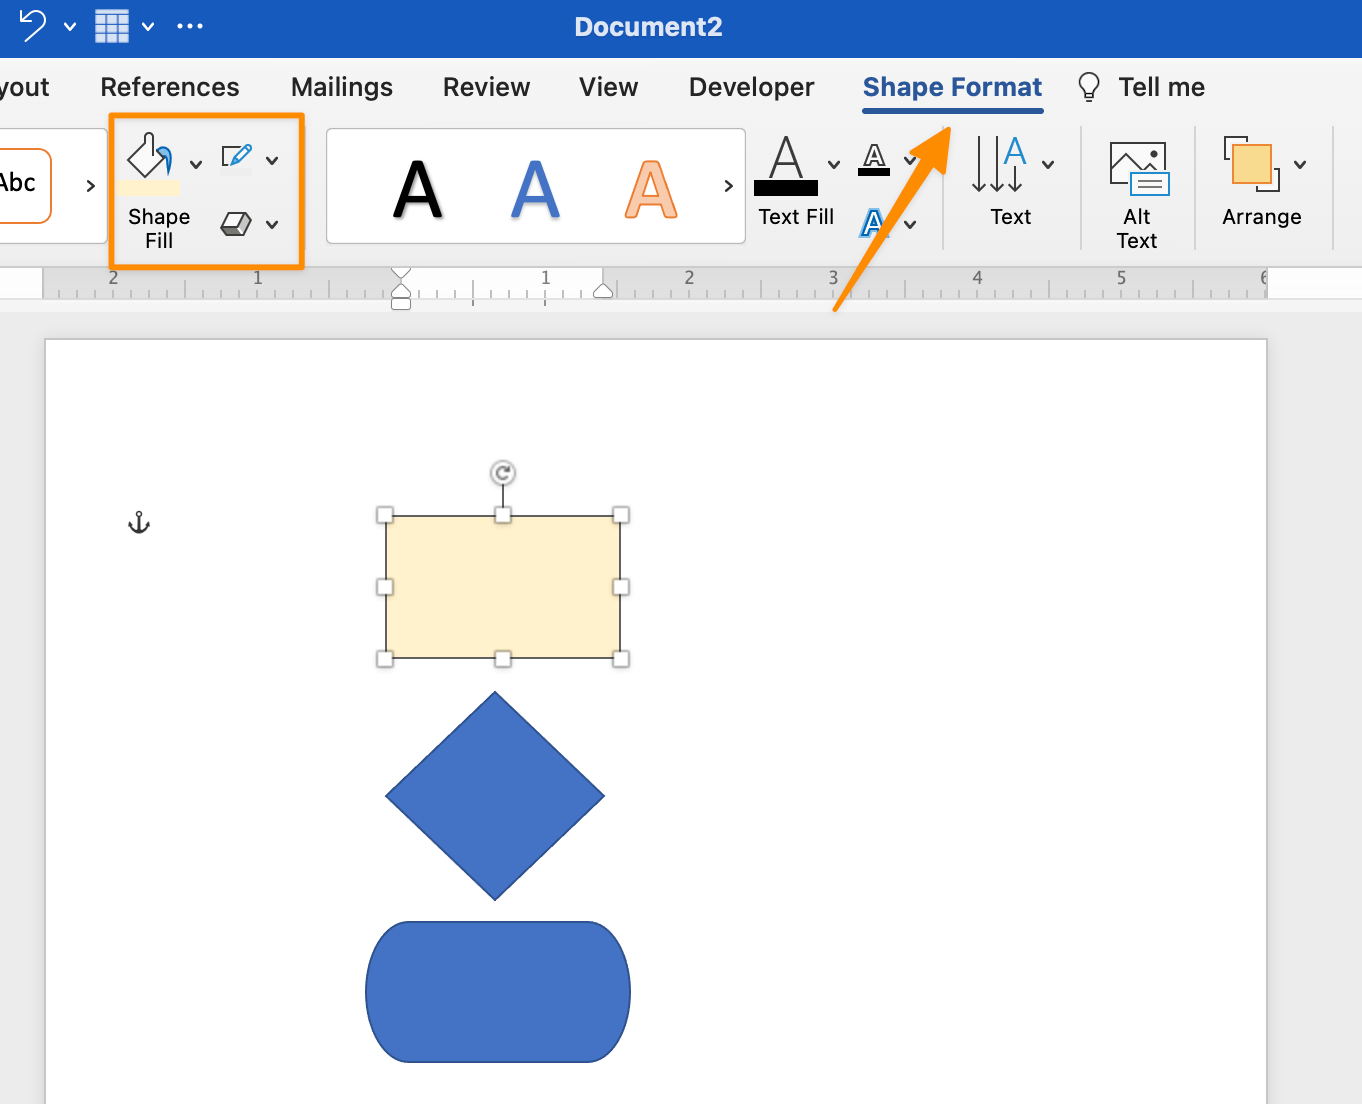
3. Format the Flowchart Shapes
Use the options on the Shape Format ribbon to format the shape’s fill color, border, and other attributes.


4. Add text inside the flowchart shapes.
To add text inside a flowchart shape, first select the shape. Then, start typing. The text will appear inside the selected shape.


5. Format the Text
If you wish to format the text inside a shape, select the shape. Under the Home tab, use the formatting options to select the font, font size, and other attributes.


Repeat the previous steps to create all the shapes you need for your flowchart. Use the gridlines to arrange them on your document.


6. Add the Flowchart Connectors
Next, you’re going to want to connect the shapes with lines or arrows.
To insert an arrow, go to Insert > Lines. The lines menu opens. Click on the line you wish to use.


Under the Shape Format tab, use the options to format the connector.
![]()
![]()
![]()
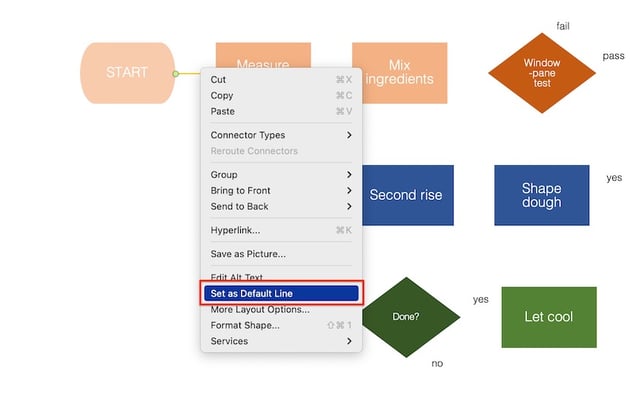
When the line is formatted as you like, set it as a default line. That way Word will use the same formatting settings for the next lines you create, and you won’t have to keep formatting each one.
To set a line as the default line, right-click on it, then select Set as Default Line.


Repeat until you’ve inserted, formatted, and arranged all the connectors you need.
4. Insert More Text
You may find that you need text outside of the shapes in your flowchart.
To add text, go to Insert > Text Box. Click and drag the cursor where you wish to place the text box. Type the text inside the box.


Next, format the text. With the text box selected, click on the Home tab. Use the formatting options on the ribbon to format the text.


When your flowchart is complete, switch off the Gridlines, and enjoy your creation!


Method Two: Create a Flowchart in Word With SmartArt
Another way to create flowcharts in MS Word is by using SmartArt. It’s a pre-designed visual template in Word that lets you quickly make charts and diagrams. You can format SmartArt—up to a certain extent—and personalize them with your own information.
To create a Microsoft SmartArt flowchart, follow these steps:
1. Insert a New SmartArt
Go to Insert > SmartArt > Process. The Process menu pops up.


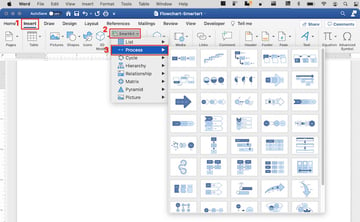
Choose the SmartArt that’s most suitable for the flowchart you wish to create and click on it.
2. Format the SmartArt Flowchart
Under the SmartArt Design tab, use the tools on the ribbon to format the various elements of the SmartArt.
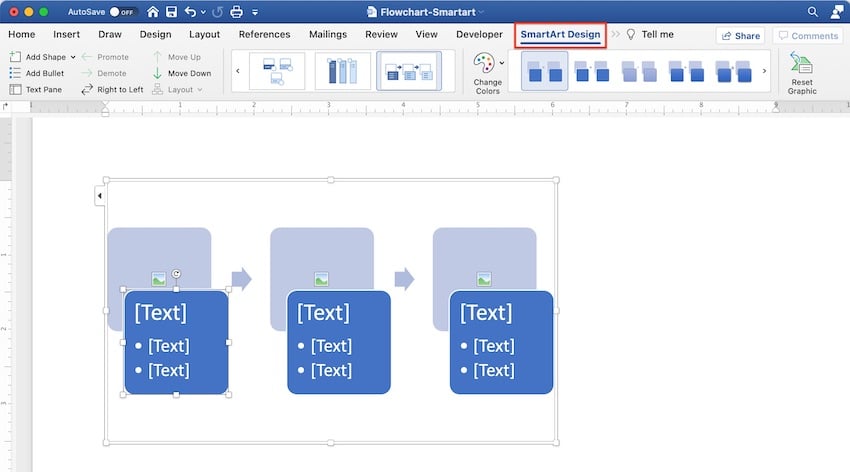


Explore the special effects menu to see ways you can spice up your chart.

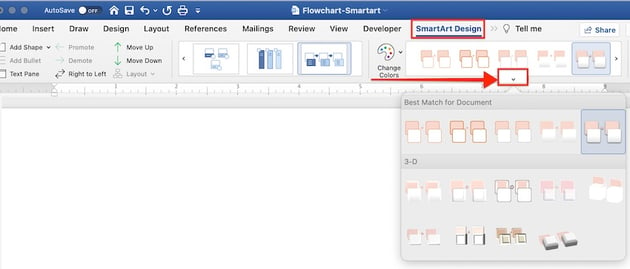

At any point, you can also change the style of your Microsoft SmartArt flowchart. First, select the SmartArt. Under the SmartArt Design tab, open the styles menu. Click on a different style you wish to apply.


3. Add Steps
You’ll probably need to add steps to your process SmartArt. To do this, make sure you’re on the SmartArt Design tab. Click on the Add Shape dropdown menu and choose from one of two options:
- Add Shape After. Adds a step at the end of the current SmartArt.
- Add Shape Before. Adds a step at the beginning.


Tip: You can add steps at any point in your workflow. But I suggest you add all the steps you think you’ll need before you add your text.
4. Add Your Text
To add your text, click on a text box—it’ll have a placeholder that says “Text”—and type your own text. Under the SmartArt Design tab, you can also click on the Text Pane button to add and edit text through the Text Pane.


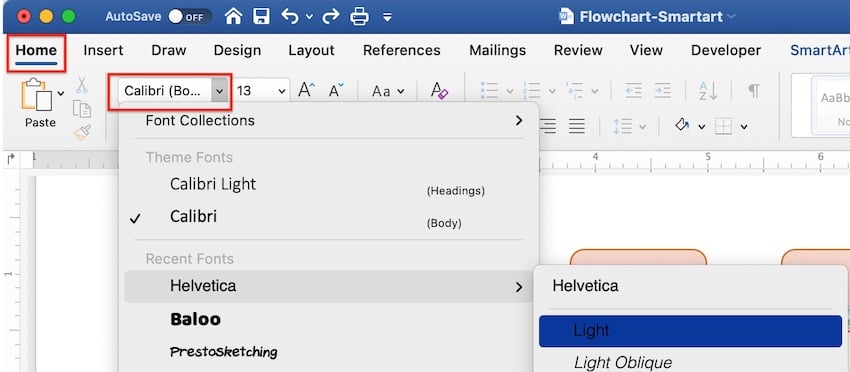
You can also format the text inside the SmartArt. First, select the text box, then click on the Home tab. Use the formatting options to change the font, font size, and etc.


5. Add Images
If the SmartArt flowchart style you created includes pictures, now’s the time to add your custom images.
Click on the image icon. This launches your document finder. Click on the image file you want to add, then click Insert.

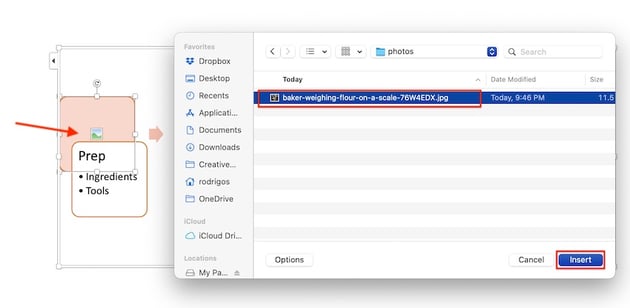

Tip: Make sure your image has the correct proportions for the image placeholder in the SmartArt. If the placeholder is square, edit your image to be a square before inserting it. Otherwise, it may get cropped awkwardly.
Repeat the steps above to complete your Microsoft SmartArt flowchart.


Shapes vs. SmartArt: What’s the Best Way to Create a Flowchart in Word?
Now that know how to create a flowchart in Word using two methods, you may be wondering, which is the better way: shapes or SmartArt?
Each has its advantages and disadvantages.
Use shapes to create a flowchart if:
-
You want complete control over how your flowchart looks. It’s simply easier to control the different elements of a flowchart that’s built from scratch using shapes and lines or arrows as connectors.
-
You want to use symbolic flowchart shapes. Word shapes include both the basic shapes and special flowchart shapes.
-
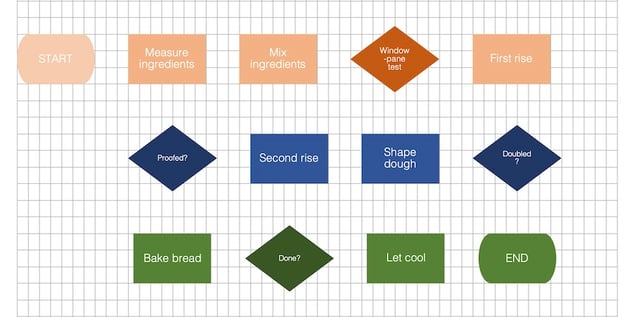
You’ve got a complicated flowchart. If you’re trying to create a flowchart with split steps (like the bread making flowchart I made with charts), then you’re better off using shapes.
Consider using SmartArt to make a flowchart if:
-
You want a creatively designed chart quickly. SmartArt process diagrams are pre-made by designers to look great with minimal fuss.
-
You don’t need traditional flowchart shapes. Most Microsoft SmartArt flowcharts use only basic shapes and other elements that are chosen more for aesthetic purposes.
-
Your flowchart has only a few and simple steps. SmartArt charts lend themselves best to straightforward processes.
5 Flowchart Making Tips
Microsoft Word gives you two convenient ways to make MS Word flowchart diagrams. To get the best results, keep these tips in mind:
1. Plan It Out
Have a clear vision for what you want your flowchart you look like. Sketch it out with pen and paper and know exactly what text and images you’re going to use.
2. Make the Design Elements Consistent
Use a consistent style among the shapes and connectors in your flowchart. For example, use the same one or two fonts for the text.
3. Fit the Entire Chart on One Page
For the greatest legibility, make sure your chart fits all on one page. You may have to change the document’s orientation from portrait to landscape to accommodate a long or wide flowchart.
4. Don’t Count on People Knowing What Flowchart Shapes Mean
As mentioned above, shapes have specific meanings when used in flowcharts. But your readers may not know what those are. Make sure your flowchart makes sense even if this is the case. It’s also a good idea to include a legend or symbol key to let your readers know what the various shapes stand for.
5. Follow the Conventional Reading Direction
In the English language, readers read from left to right and top to bottom. If your flowchart is more than one level long, continue the second level on the left side of the page. (Of course, if your document is in a language that’s read from right to left, bottom to top, then you’d follow that direction for your flowchart as well.)
Streamline Your Workflow With Microsoft Word Templates
Another way to streamline your workflow is with a Word template.
Templates may include a Microsoft Word flowchart or other diagrams. Even if that’s not the case, starting with a Microsoft Word flowchart template is still an easy way to create a professionally-designed document.


With a template for Word, all the major design decisions have already been made for you by a professional. All you’ve got to do is to customize it with your branding colors, images, and text.


One excellent source of Word templates is Envato Elements. In this creative marketplace you’ll find templates for various kinds of documents such as this resume/CV template, which includes infographics.


An Elements subscription gives you access to much more than high-quality Word templates. For one low, fixed price per month, you get unlimited downloads of the creative components you need to make your document look its best, such as fonts, photos, graphics, and icons.
And if you create other types of materials, like videos and websites, then you’ll also benefit from unlimited downloads of stock videos, music, sound effects, and presentation templates.
Create Your Own Flowcharts in Microsoft Word
Now you know how to make an easy flowchart in Microsoft Word. For complete control, build your flowchart with shapes and lines. For a fast and artistic look, use SmartArt. Either way, a well-constructed flowchart will make your document more effective at showing a process, workflow, or data flow.
You can also use Word templates to streamline your workflow. For the best quality and value, get Word templates and other creative resources from Envato Elements. Your subscription brings to your fingertips millions of creative assets to help you communicate effectively.
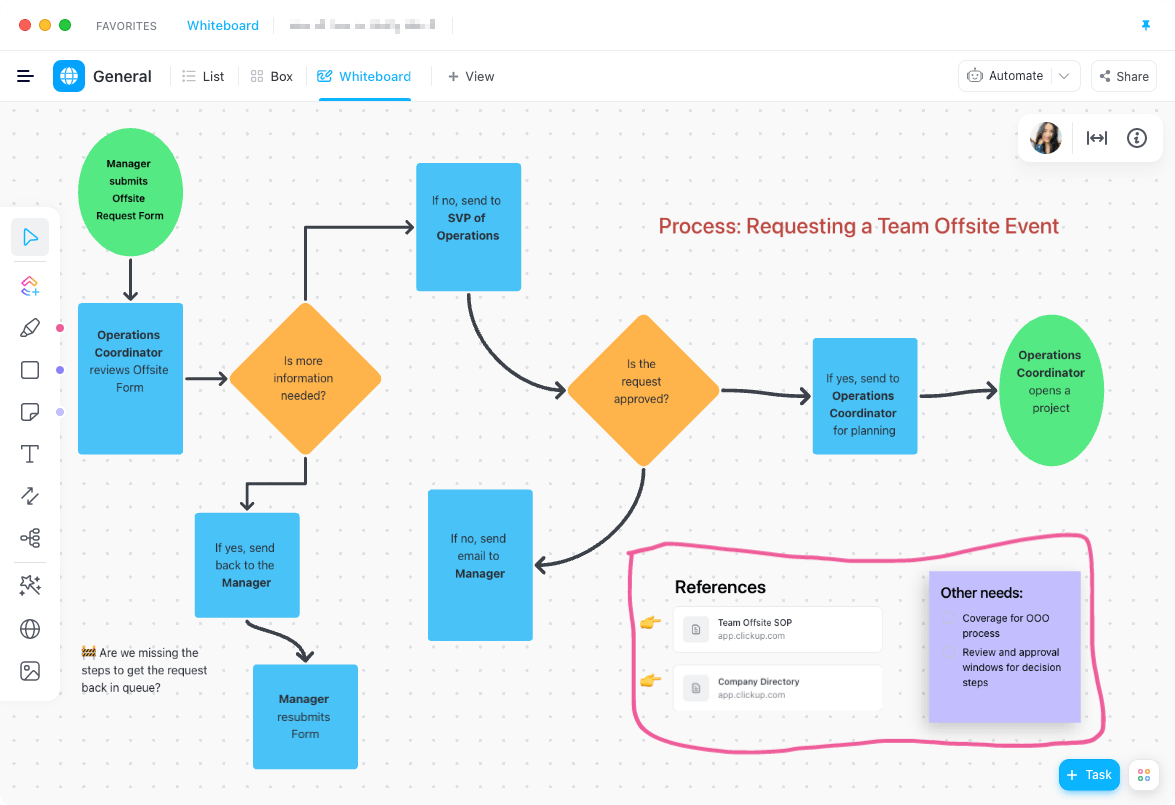
Flowcharts are designed to produce actionable information for any workflow, process, or decision-making procedure. Yet, we spend most of our time creating abandoned flowcharts instead of using them as interactive workflow diagrams.
If you’re strapped for time and want to get the ideas circling in your head down quickly, use the free Introduction to Whiteboards template by ClickUp to add content to the pre-built Flow Chart.
You’ll have a flowchart ready in half the time it takes to build one in Microsoft Word!
How to Make a Flowchart in Word
How to Make a Flowchart in Word: Prep for Success
In this tutorial, we use Microsoft Excel for Mac Version 16.60. The steps and features may look different if you’re on another version.
There are two ways to create a flowchart in Word (and we’ll cover them both)!
1. Using a pre-built SmartArt process graphic
2. Building a flowchart illustration from scratch
Before you start adding your content and shapes, write out your process in a list from start to finish. This will help you move faster later through the build process because you’ll already have the exact number of steps and placeholders.
Unless you’re using a whiteboard tool like ClickUp, please don’t attempt to coordinate the steps and build your flowchart symbols at the same time! You’ll be lost in the menu bar correcting mistakes. Microsoft Word is not built to work at the speed of thought.
Here’s what a simple process list would look like to submit a team offsite request:
1. Manager submits Offsite Request Form (start)
2. Operations Coordinator reviews Offsite Form (process)
3. SVP of Operations approves the Offsite Request Form (process)
4. Operations Coordinator opens a project (end)
Because you’ve outlined each step of the process, you’re off to a great start! If you prefer using a pre-built SmartArt graphic, follow the next steps below.
Version 1: Building a Flowchart in Word With a SmartArt Graphic
Step 1. Add a SmartArt graphic
First, change the page layout to give more room left to right for the flowchart. Go to the Layout tab > Orientation > and select Landscape.
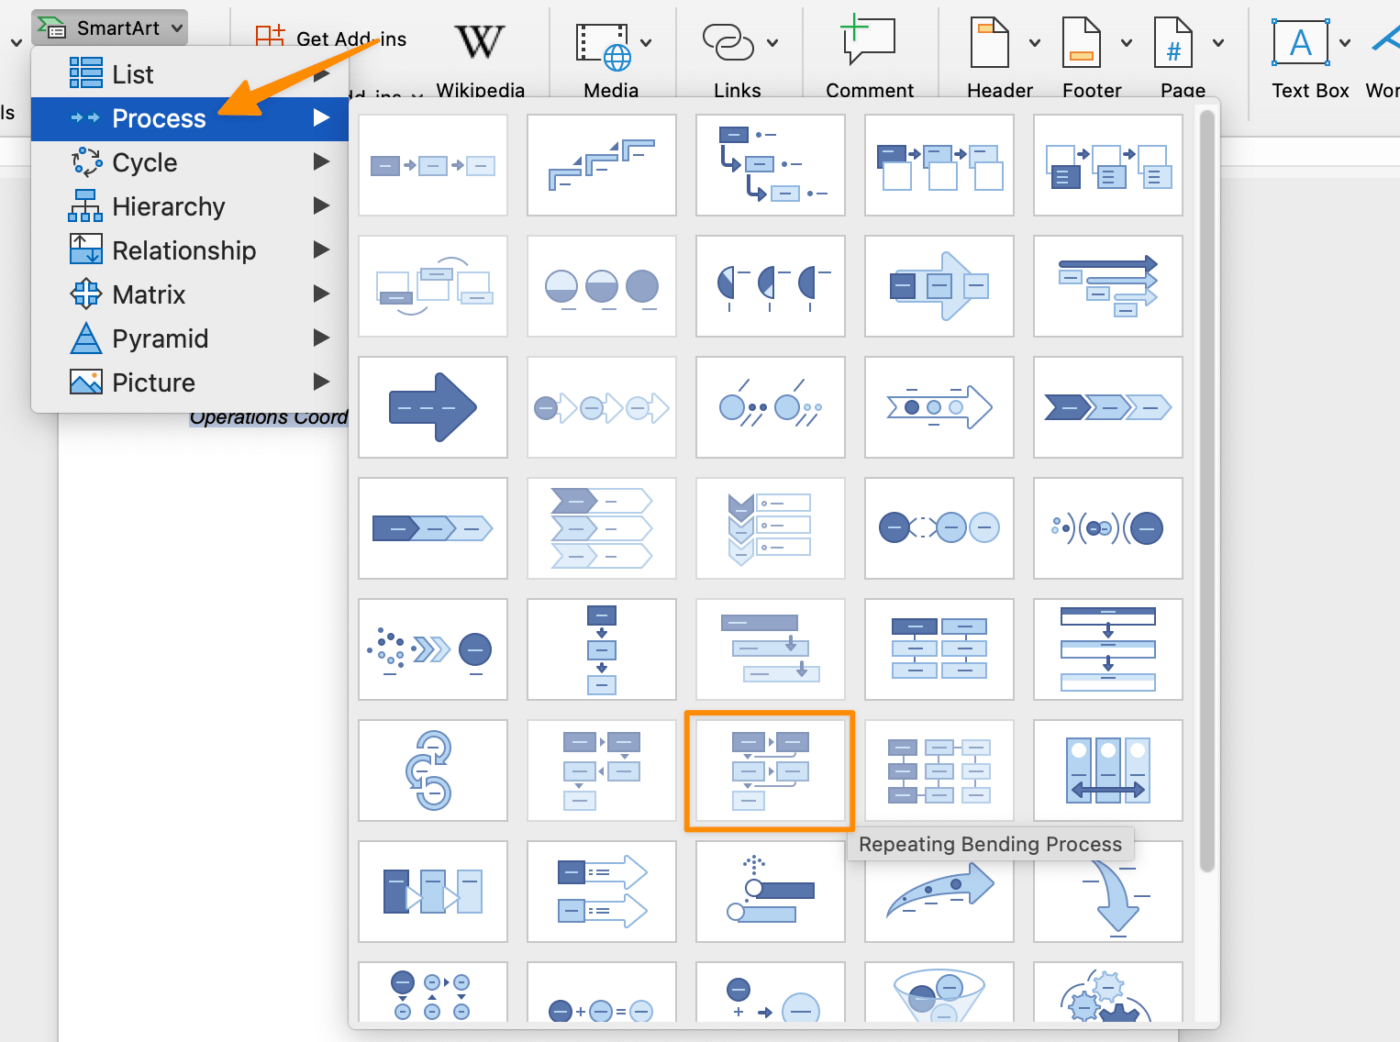
Then, copy your process list and go to the Insert tab > SmartArt > Process, and select the chart of your choice. (Our example is using the Repeating Bending Process process chart.)
Step 2. Paste your process list in the Text Pane window
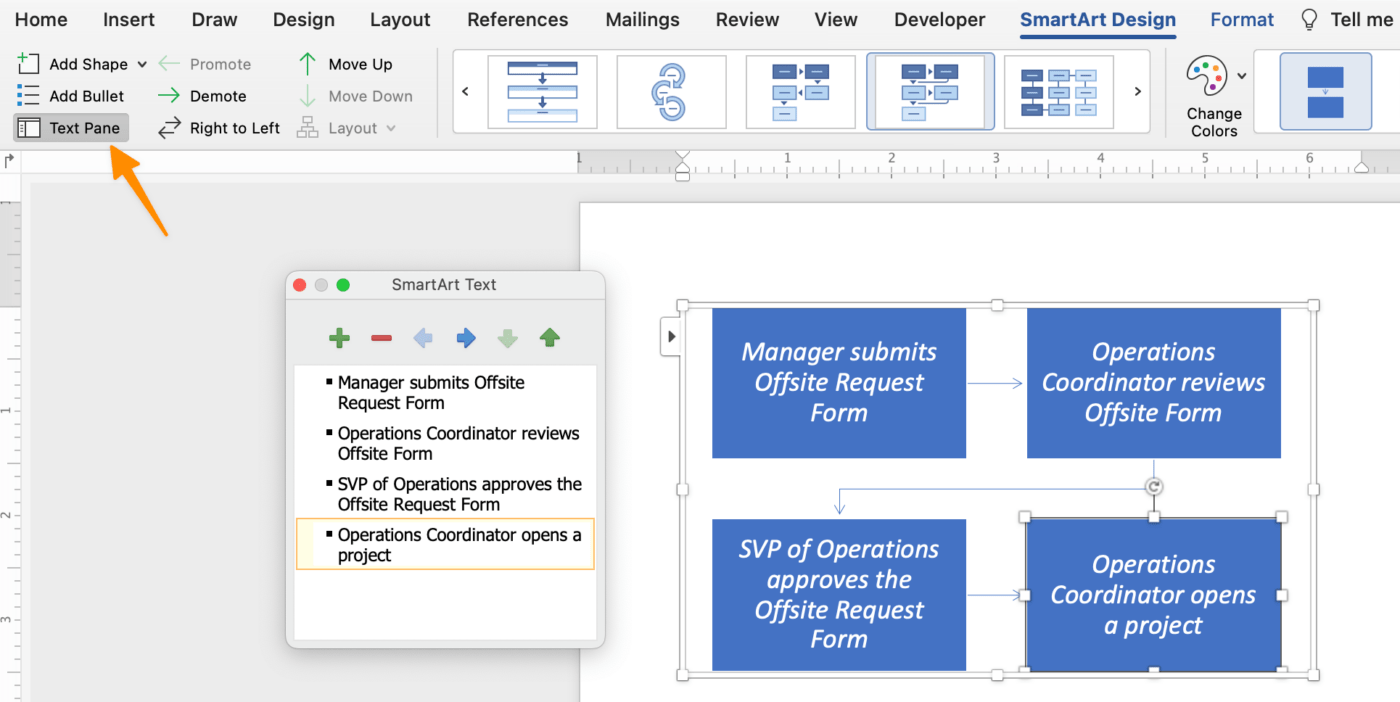
After you click on the process chart, it will appear in your Word document. Paste the process list you copied into the Text Pane window. If you don’t see the Text Pane window, make sure the SmartArt graphic is highlighted. Then go to the SmartArt Design tab at the top and click Text Pane at the far left.
Step 3. Format your flowchart
Use the SmartArt Design tab to change the color, update the flowchart symbol styles, and add more shapes to complete your graphic! If the SmartArt Design tab isn’t showing on your menu bar, double-check the flowchart is highlighted.
And that’s how you build a flowchart with SmartArt!
Version 2: Building a Flowchart in Word With Basic Symbols
Step 1. Add shapes for each process step
Go to the Insert tab > Shapes > Flowchart > select a shape > click anywhere in your document to add.
Tip: Here’s a quick table of the different flowchart symbols to use for powerful visualization:
| Shape Styles | Functions | How to Add |
|---|---|---|
| Oval | Terminal: the start point and end point of a flowchart | Insert tab > Shapes > Flowchart > Terminator |
| Rectangle | Process: represents a single step in the process | Insert tab > Shapes > Flowchart > Process |
| Diamond | Decision: represents a decision action | Insert tab > Shapes > Flowchart > Decision |
| Arrow | Arrow: shows the relationship by connecting shapes | Insert tab > Shapes > Flowchart > Arrow |
Step 2. Customize your shapes
Typically, editing the shape’s color and size happens at the end. But because it takes multiple clicks to add shapes in Word, you should format your ideal shapes and use the copy and paste feature to duplicate them.
Go to the Shape Format tab, and the menu bar will adjust to show all the changes you can make to the shapes. Once you have your perfect shape, copy and paste it as many times as you need!
Step 3. Add text inside each flowchart symbol
We want to add text inside the shapes, so let’s make them bigger! Select one of the shapes > hold the Command or Shift key > select the other shapes > go to a shape’s corner and drag to expand. Click on a shape and begin typing in each step until all the shapes are filled with text.
Step 4. Add the arrows to connect each process step
We’re almost there! With your shapes in place, it’s time to connect the sequence of events. Go to the Insert tab > Shapes > Lines > and click the Arrow.
Tip: You can customize the arrow’s shape and color under the Shape Format tab! Make sure the arrow is selected first to make any changes. Then, copy and paste the arrow to add it again for your other process steps.
Whew. All that work inside Microsoft Word didn’t leave much time and energy for what comes after the flowchart—taking action towards progress.
If you’re looking to upgrade your tools and software for a powerful visual platform to create, test, edit, and collaborate with your team, try ClickUp!
- How to Make a Calendar in Word
- How to Make a Timeline in Word
- How to Make a Mind Map in Word
- How to Create a Fillable Form in Word
- How to Make a Gantt Chart in Word
- What is a Process Map?
Build Interactive Flowcharts in Minutes With ClickUp
No code or design experience required!
The majority of your time spent in Word is formatting. And while formatting is important for visual balance and presentation, it won’t matter if no one—including you—uses the flowchart to move the needle in the process or project.
Microsoft Word is a powerful software program for creating almost anything. But it’s just not efficient in a modern workplace where remote and in-office collaboration has its challenges and benefits.
And chances are, your team members won’t volunteer their time to co-create a flowchart in Word. The software has too many options and steps to achieve one purpose.
What your tasks and team members need is an all-in-one productivity platform to organize ideas and work.
A suite of designer-approved templates to boost productivity and collaboration.
A zoomable canvas to bring ideas and views to life.
If you’ve ever been curious about whiteboard software or ClickUp, we hope you take advantage of our free Whiteboards and test drive the platform with your next project or idea!

ClickUp Whiteboards will be your favorite drawing canvas to rapidly develop flowcharts and frameworks. All the shapes you need are semi-customized to relieve you from creating each object from the ground up. Use Whiteboards for presentations, team brainstorming workshops, or solo projects!
With Whiteboards, you also have the option to save your flowchart as an image and drop it into a document or email. It’s easy! Here’s how it works:
1. Create your flowchart in a ClickUp Whiteboard
2. Right-click the image
3. Select Save Image As
Drop it into your file, and you’re good to go! If you want to see Whiteboards in action, check out our guide below!

Flowcharts are helpful tools for visualizing a process or workflow. They’re incredibly easy to make but powerfully effective when applied to a complex task. While Microsoft Word isn’t known as a graphic design tool, it is possible to make a flowchart in Word.
An even better way to create flowcharts for your projects, whether they will stand on their own or be imported into a Word doc is to use Venngage’s Flowchart Maker. Our flowchart maker allows you to drag and drop steps in a process, quickly update colors and fonts and more.
With a paid plan, Venngage users can download their flowchart design as a PNG that they can easily upload to their Word document. But you can start creating one right now for free—no design experience required.
You’re looking for ways to make a flowchart in Word though, so let’s take a look at how you can make a flowchart in Microsoft Word and some reasons you might want to reconsider that plan.
Click to jump ahead:
- How to create a flowchart in Microsoft Word
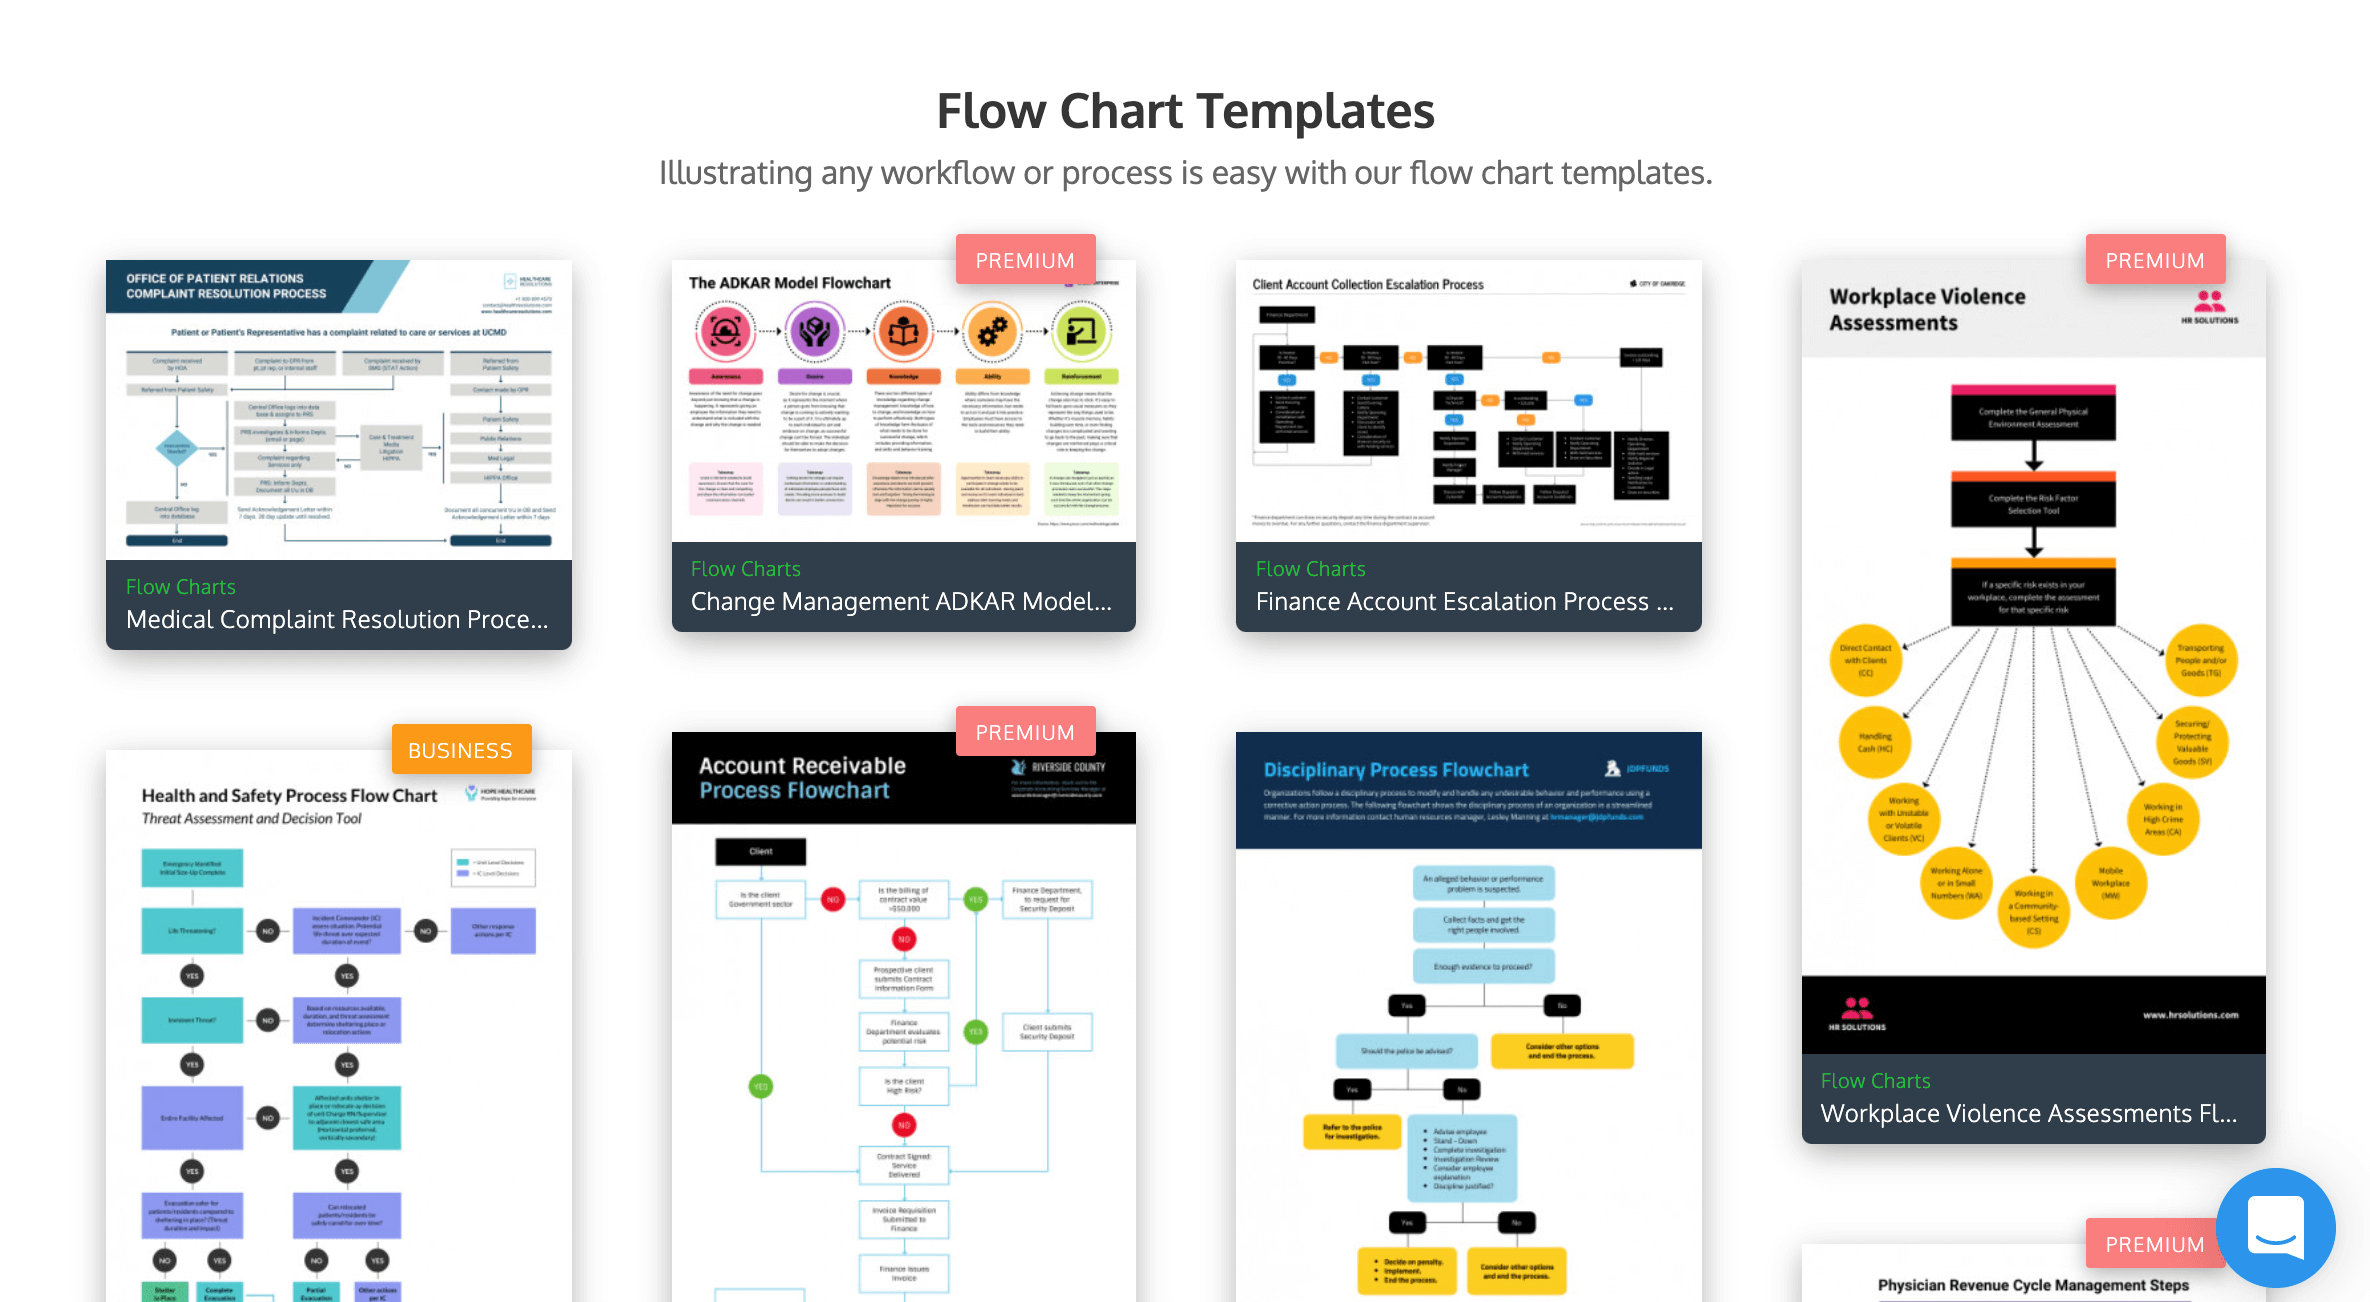
- Flowchart templates for Microsoft Word
- How to create a Microsoft Word flowchart in Venngage
How to create a flowchart in Microsoft Word
When creating a flowchart in Microsoft Word, you have a couple of options.
- You can draw the flowchart manually, inserting shapes, text boxes, images and more.
- Or you can use the onboard SmartArt graphics the program comes with.
Going the manual route is the best way to make sure you get exactly what you want, but it’s much more time-consuming, both to build and to make changes.
Using Word’s built-in SmartArt may save you some time, but the available SmartArt graphics may be limiting creatively.
Let’s check out how it works using both methods and what the finished product might look like.
- Manual flowchart in Word
- SmartArt flowchart in Word
Manual flowchart in Word
For most flowcharts used for decision-making, manually creating the image in Word is the only method. We’ll look at what’s possible with SmartArt in a moment, but it’s important to note that Word’s built-in graphics include only process charts.
We’re going to create this simple flowchart (inspired by a Venngage template):

Manually created flowchart in Word
Step 1. Create a new document and insert the title
In this case, we chose a design theme that included a visually impactful title treatment. There aren’t a ton of great options the program comes with—this means in order to create a high-impact title, you’ll need to have a well-developed design sense.
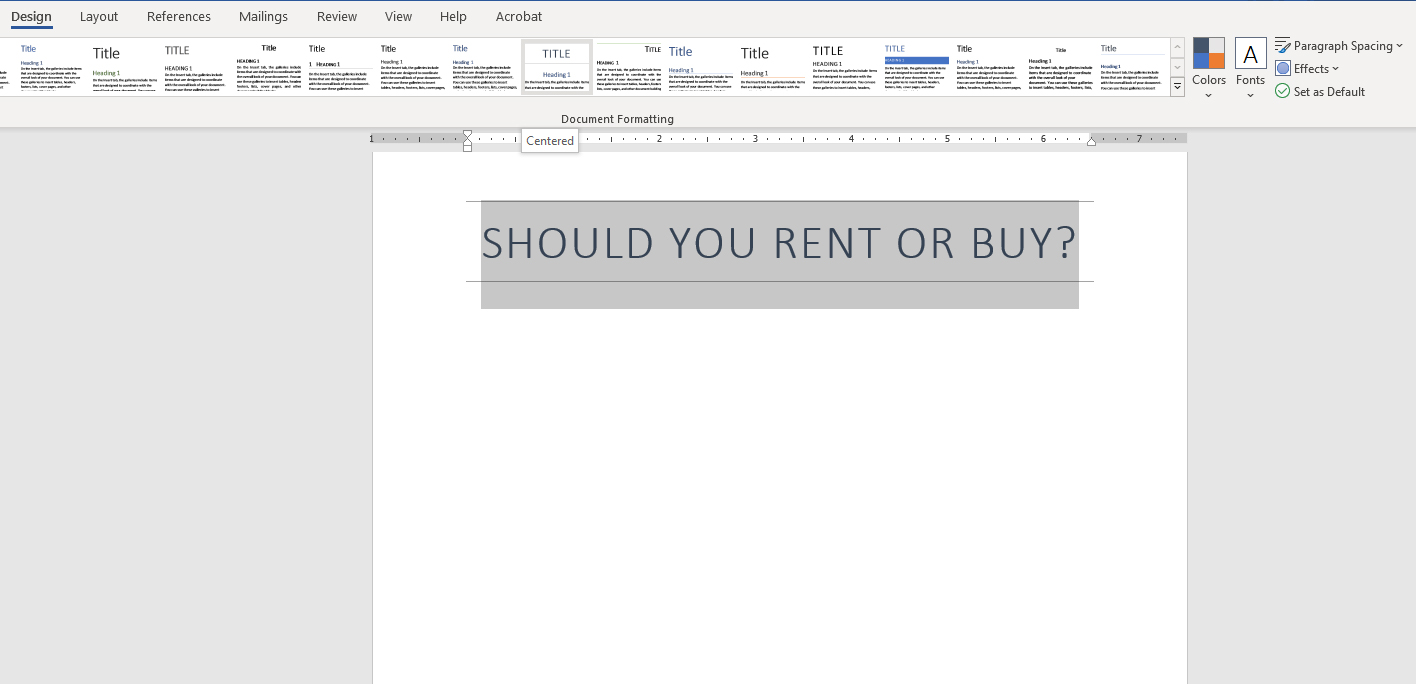
Step 1: Write and style the title
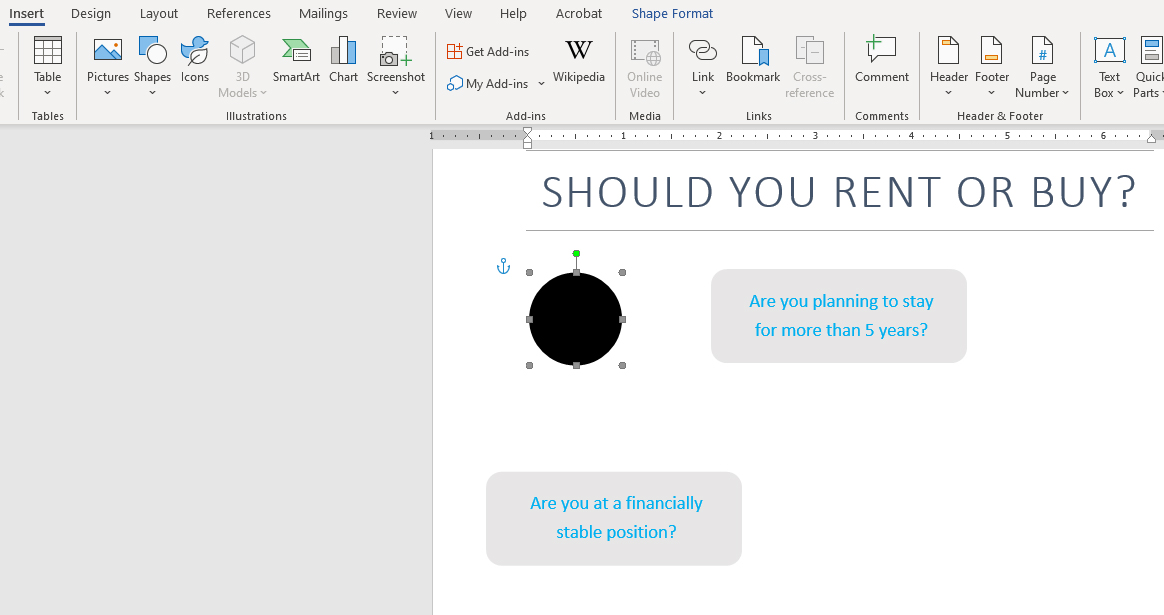
Step 2. Draw rectangular shapes
Under the “Insert” tab, select the shapes dropdown and draw some rounded rectangles in the general areas where our question points will go.
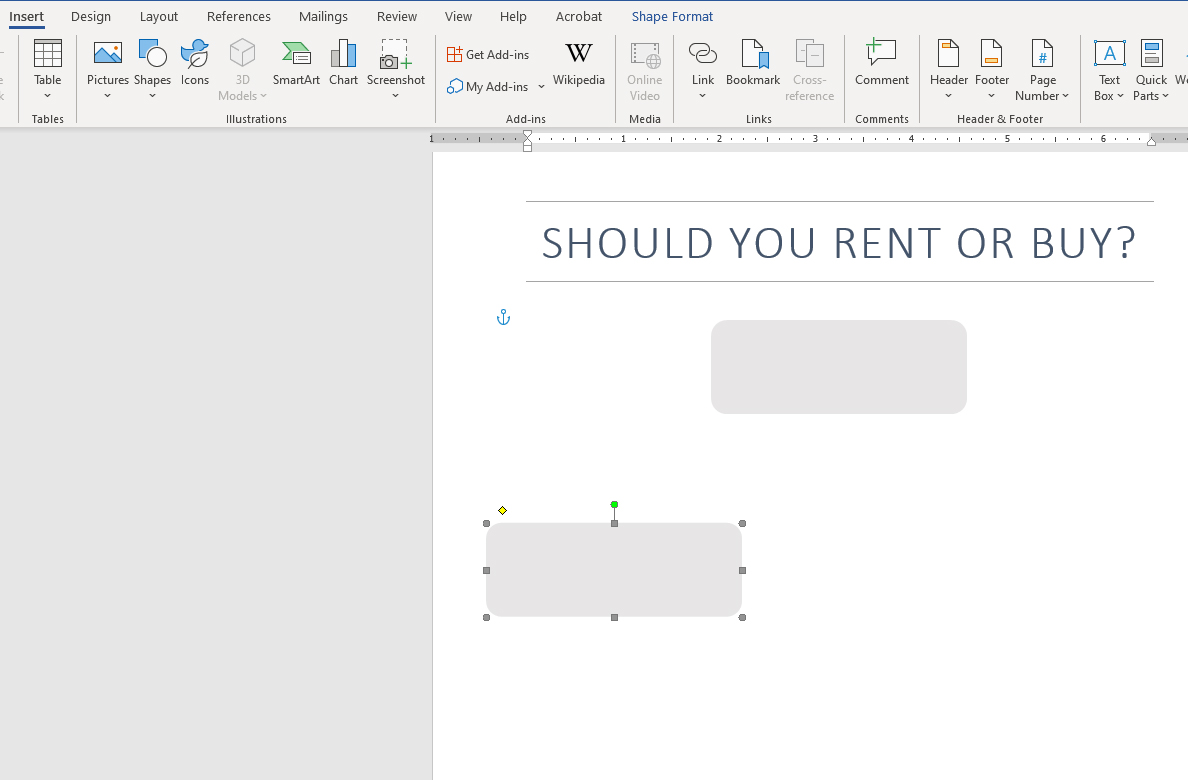
Step 2: Draw a bunch of boxes
Even with copying and pasting shapes rather than drawing each new one, this step is time-consuming. It would be even more time-consuming with a longer flowchart.
Unless you are using templates that override the style, shapes will default to having a fill and an outline, even text boxes, which we’ll get to in a moment.
Step 3. Draw text boxes for each question
Every rectangle we drew needed a text box for the question, so we drew one and then copied and pasted it into each new box. We also added boxes for the two possible end results, rent or buy.
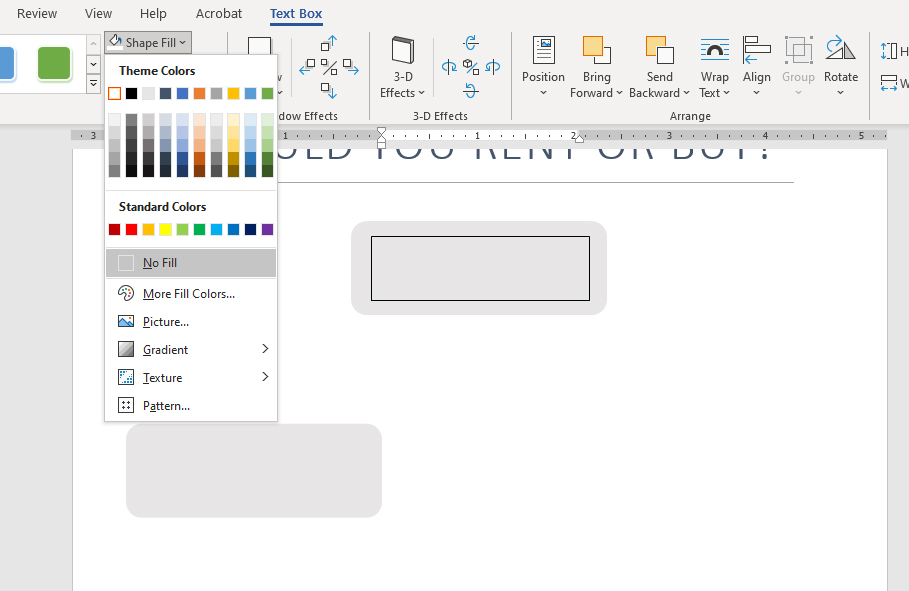
Step 3: Add text boxes
Step 4. Add content for each question
We then typed in all the content. But some boxes were too small while others were too large. Resize and style using the shape/text format tab, whichever is applicable.
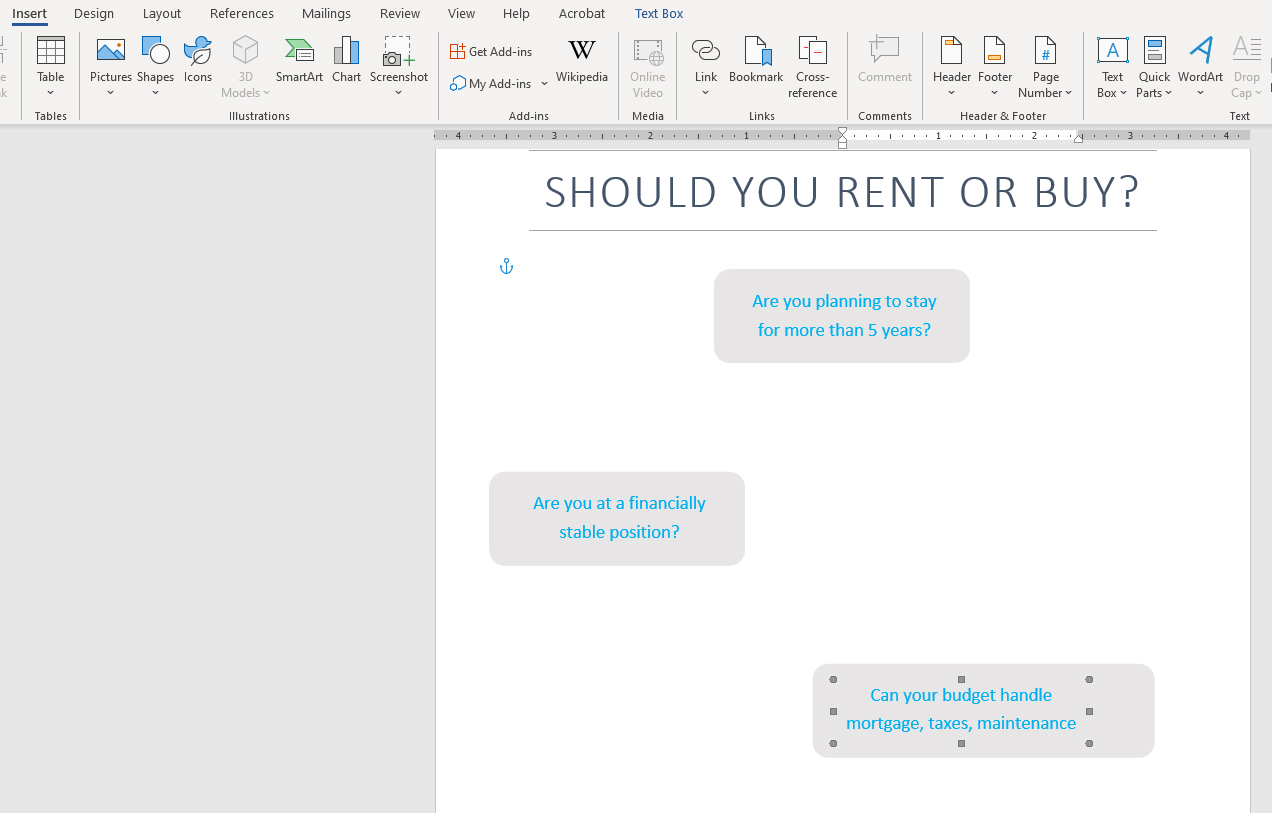
Step 4: Write the text for the questions
Step 5. Draw circle shapes
Place circles for yes/no answers in their logical places to create the flowchart result.
Step 5: Add circles for decision points
Step 6. Draw text boxes for each answer
In this case, it was easier to create two complete circle/answer combinations, then copy and paste where applicable since the size of the circle won’t change. In flowcharts that don’t follow a yes/no flow, that will be more difficult.
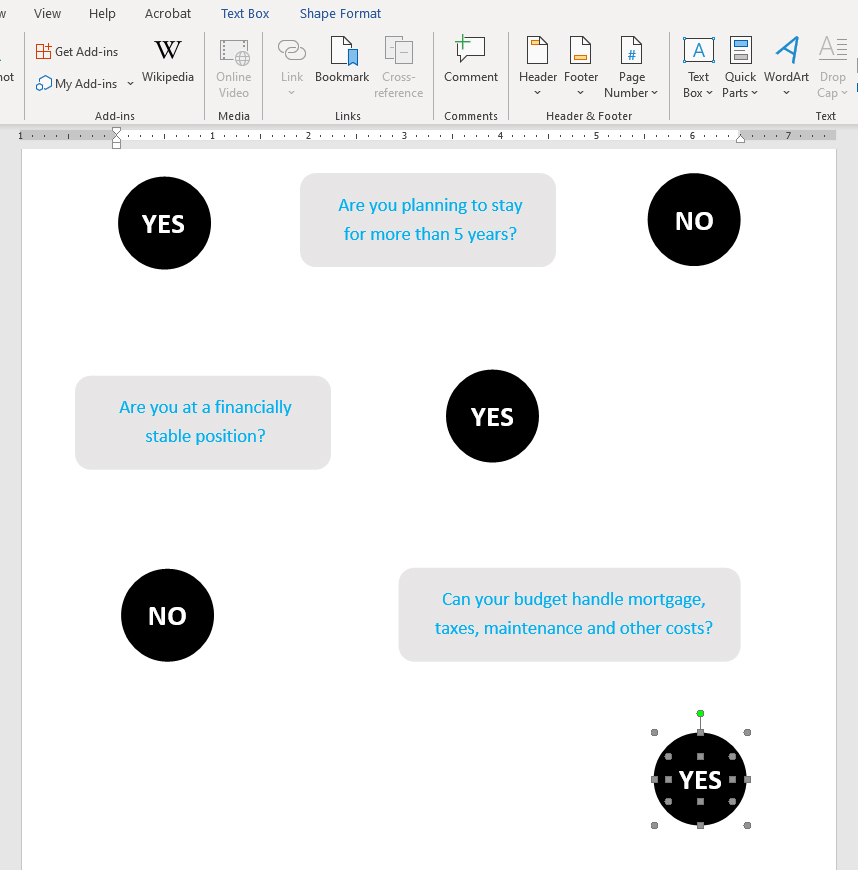
Step 6: Add answer text
Step 7. Insert arrow shapes
Connect the questions with their logical answers using arrows.
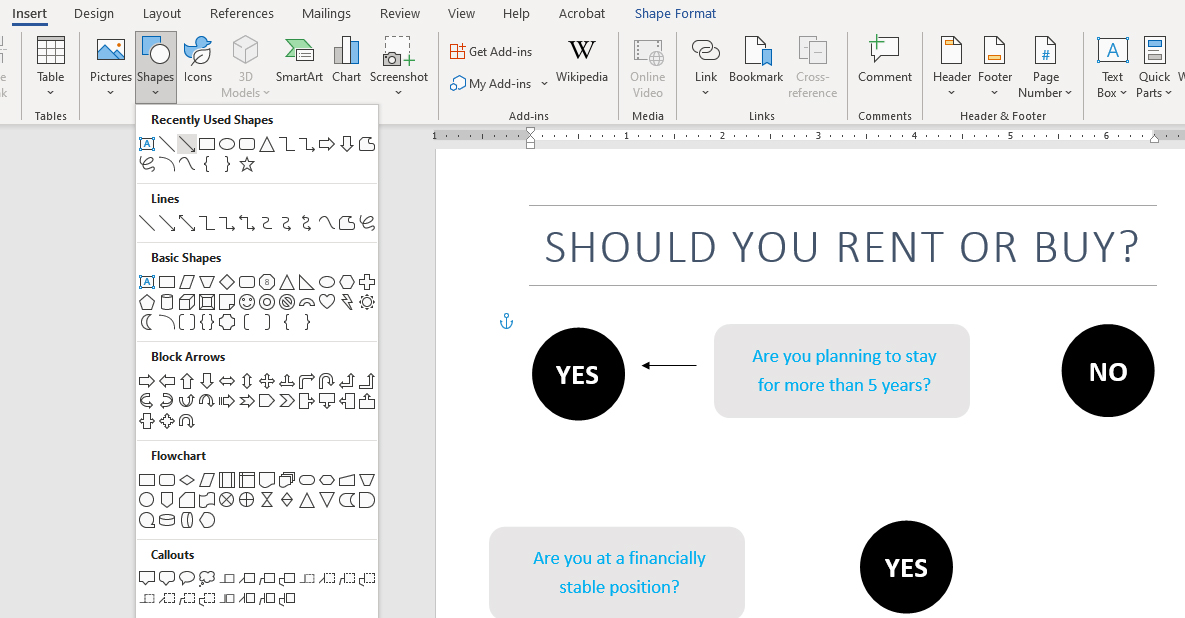
Step 7: Add arrow shapes, a whole bunch of them
Step 8. Insert icons
Without some visuals other than rectangles, circles and arrows, the flowchart would feel quite plain. So we added a house icon. Under “Insert” > “Icons”, search the word “house” and pick one of the available options.
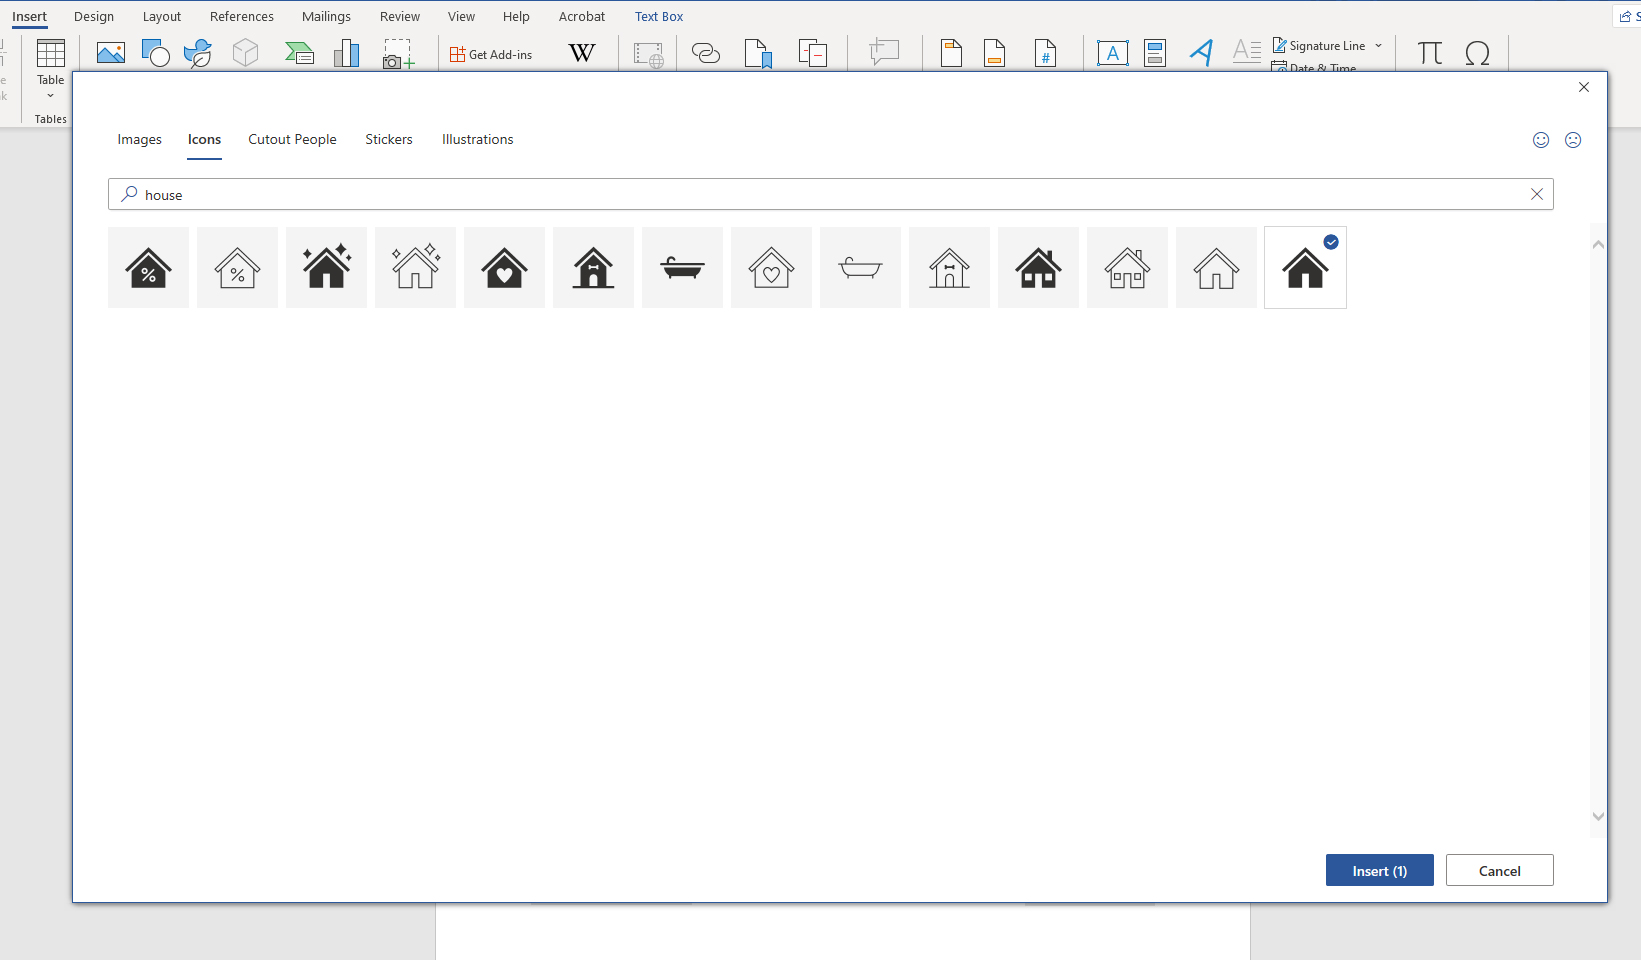
Step 8: Add decoration with house icon
This window shows all the house icons available; there’s not much. And two of them are bathtubs.
Step 9. Size and recolor icon
Set the icon not to wrap around text, resize and move it to the bottom of the page. Change the color under the format tab.
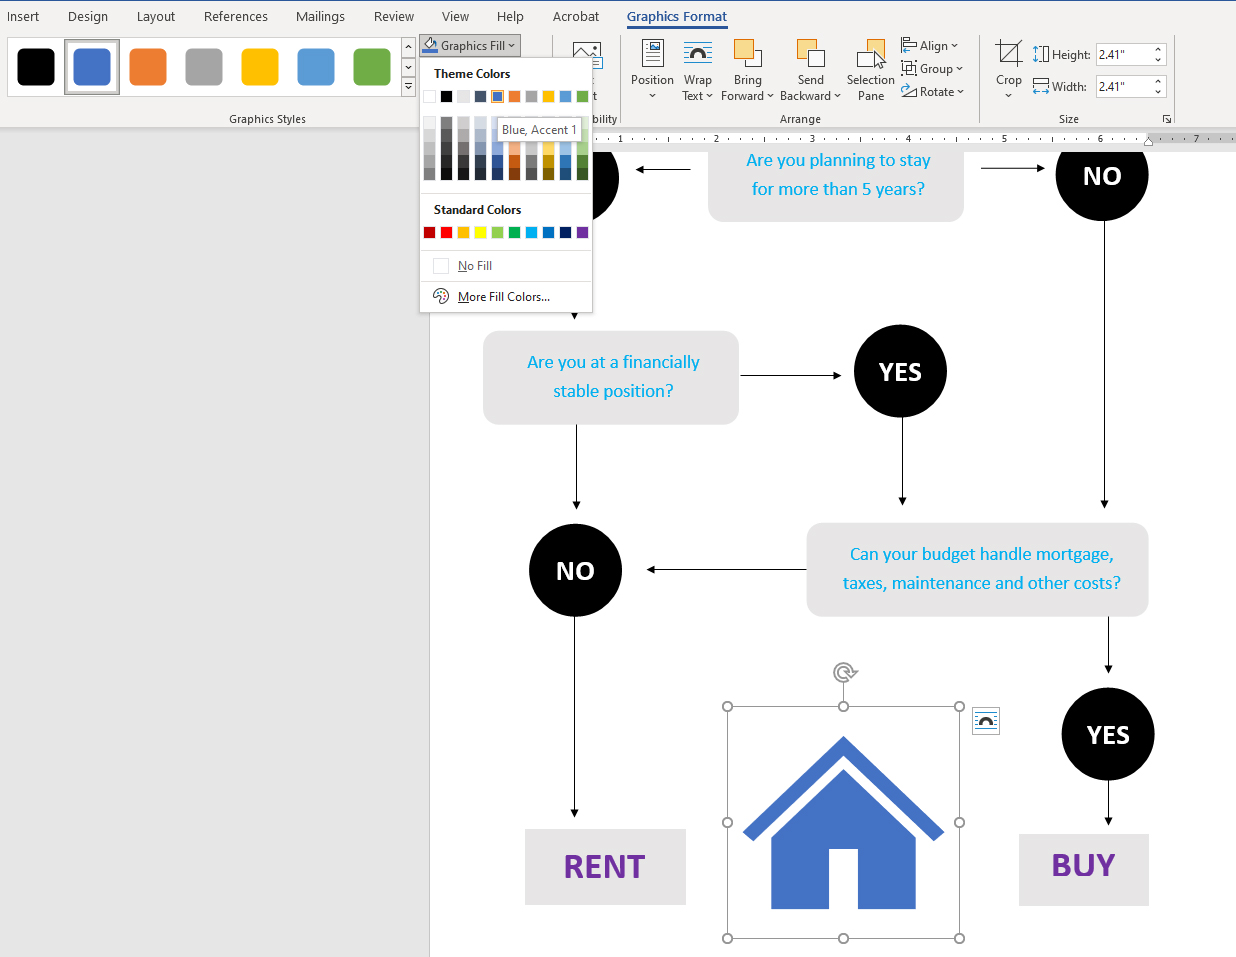
Step 9: Size and change icon color
Step 10: Make tweaks until you perfect the design
In this case, we moved some of the connecting arrows around to make sure the alignment made sense. Not that it’s perfect, but within the limitations of the size of a Word page, the flow works and all content is legible.

Step 10: Make tweaks
Make sure you also group all the design elements when you’re done designing to prevent them from moving around if you add new content.
Finished product: It’ll do in a pinch
Manually created flowchart in Word
This is a highly simplified series of steps. In reality, what looks like 10 steps is really at least 35 or 40. That’s because even if you copy and paste elements, you still have to make tons of manual tweaks to make it work.
In addition to taking way too many steps, Word is difficult to navigate as a design tool. That’s because it wasn’t developed for graphic design.
SmartArt flowchart in Word
We actually weren’t able to replicate this exact flowchart using the SmartArt options in Word. However, we’ll show you the closest we could get and detail the steps required to get there.
Step 1: Insert the title and pick a SmartArt graphic
There are no flowcharts in the SmartArt menu, but we scrolled through to find the one we thought would fit best. This was easier said than done, as we loaded our content into one SmartArt graphic we thought would work and it didn’t make sense.
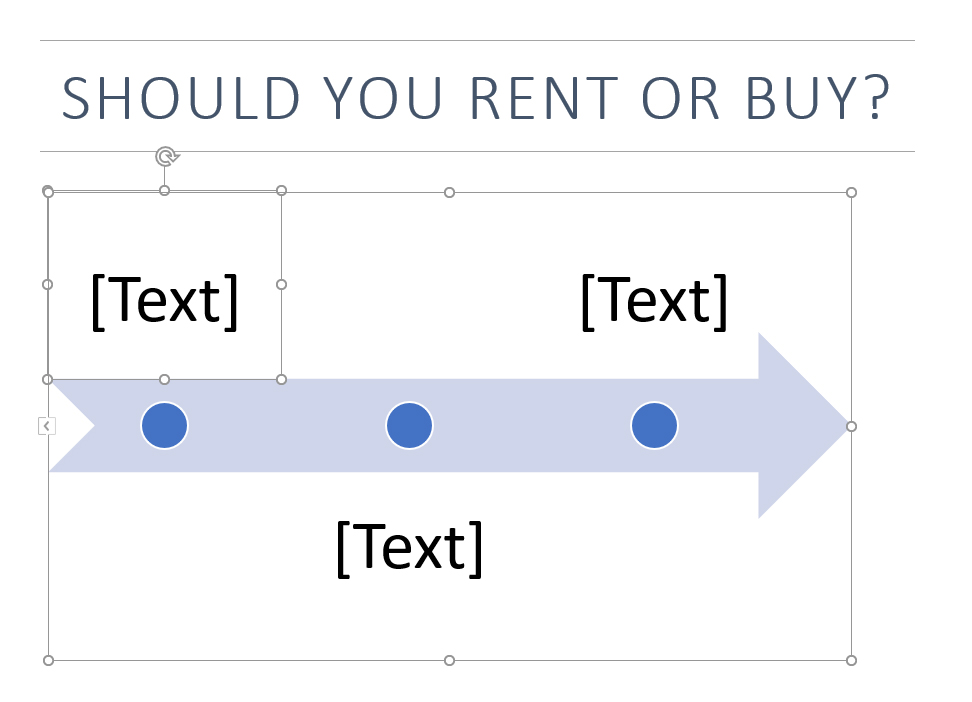
Step 1: Try a SmartArt graphic
At this point, we realized this exact flowchart can’t be recreated using SmartArt and that we would have to boil down the flowchart to just the questions and disregard the answers.
Step 2: Add the content
You can either do this by selecting the individual Text boxes or you can use the Text Pane under the SmartArt graphic menu. That’s the easiest way. While it’s definitely easier than adding individual text boxes, writing the content just reveals how much Word falls short in this area.
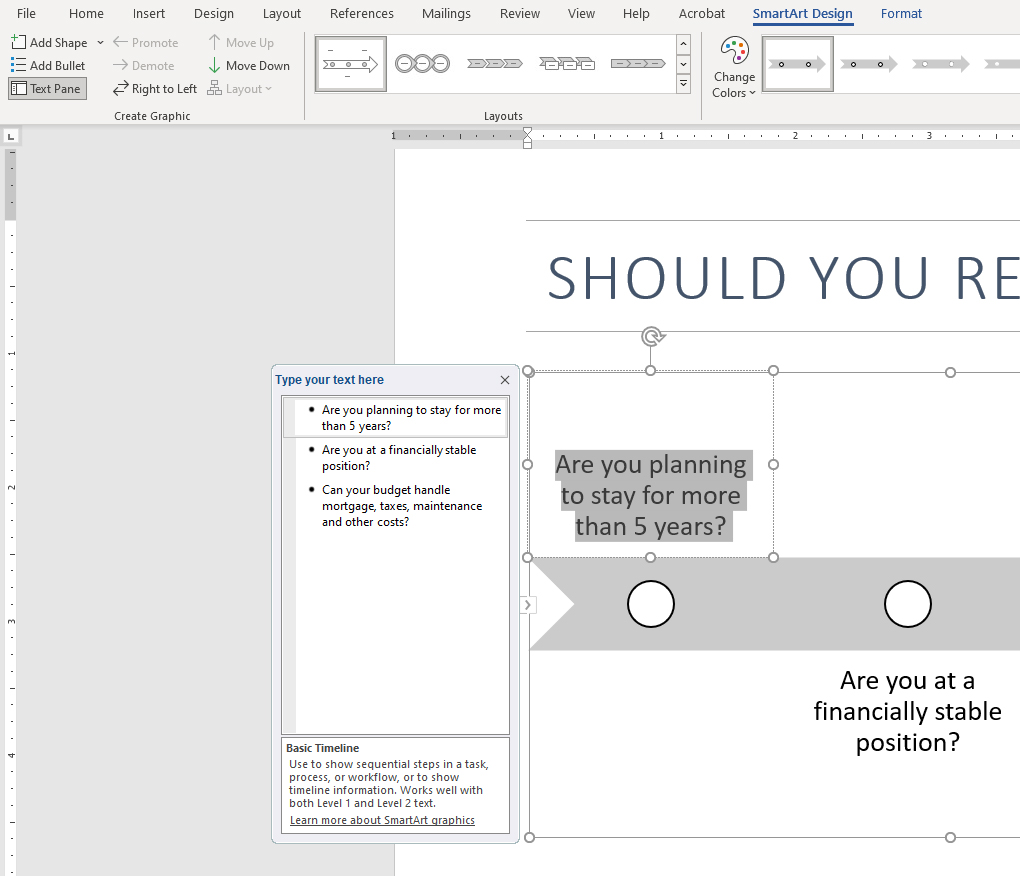
Step 2: Add content
Step 3: Go through more options
After we finished tweaking all of our content, we decided to go through some other options to make sure what we had was the best version we could get. This is by far the best aspect of using SmartArt. You can see immediately how your content adjusts.

Flowchart SmartArt options
Step 4: Change colors and style as desired
You can’t easily do as much tweaking as if you make the flowchart manually, but the SmartArt menu allows you to change some color themes.
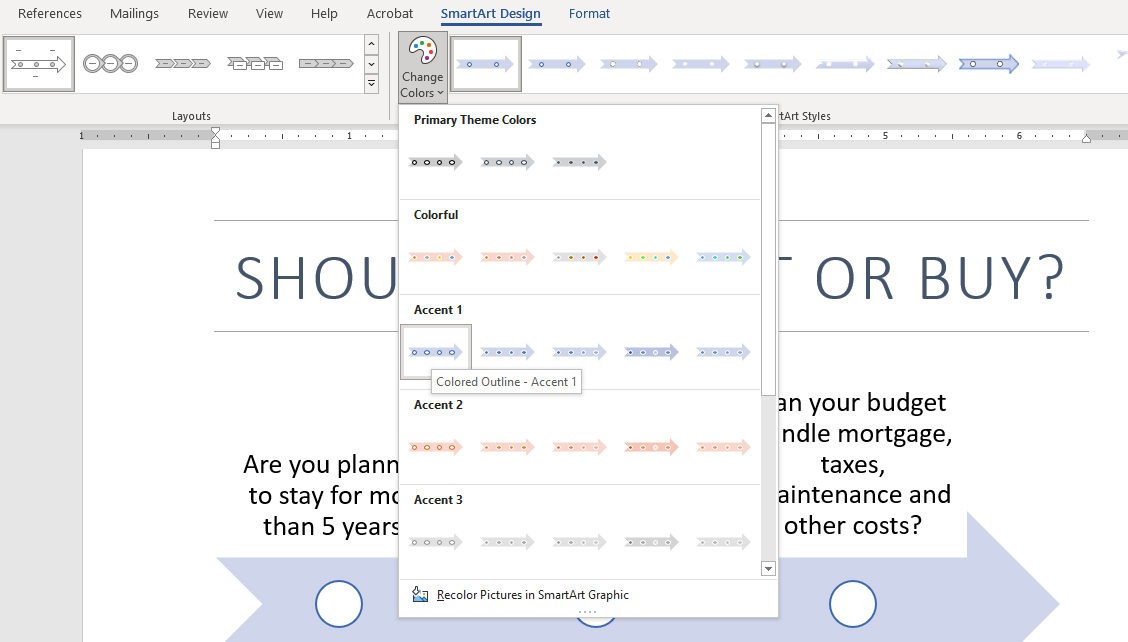
Step 4: Change colors
Finished product: Not really a flowchart

Flowchart using SmartArt in Word
This really is just a series of questions, which is what a flowchart is when you really boil it down. But removing the flowchart visual completely removes its visual impact and efficiency.
A better way: Flowchart for Word using Venngage

For comparison’s sake, here’s what the same flowchart looks like after being created in Venngage’s flowchart maker. Even if we’d spent three to four times as long tinkering with the flowcharts in Word, they would never look like this.
If you’re looking for SmartArt-like functionality that lets you automatically add, resize and move content around, check out Venngage’s new smart templates.
Return to Table of Contents
Flowchart templates for Microsoft Word
Of course, making a flowchart directly on a blank Word page is just one option.
With Venngage for Business, your team can collaborate to create an effective, engaging, on-brand flowchart that you can export as a PNG and paste into a Word document.
Let’s look at some flowchart templates that would be great additions to a project proposal, contract or Word-based report.
Process map template
Use a process map template in your Word doc for explaining processes or workflows. Remember that Word documents default to having about 6.5 by 9 inches of space on each page, so change your document setup if you need more than that.

This simple flowchart illustrates the steps needed to complete a computer troubleshooting process. Its bright, gradient color palette is an excellent match for companies with a modern style.

While many flowcharts are organized with the familiar branches and nodes, they also come in a top-to-bottom organization like this process map template. Explain the flow of work expected of your team with this process map.

Onboard new employees with a process map template like this one.
Process flow chart template
Process flow chart templates can be used to visualize the steps required to complete a task or assignment. They are especially helpful for complicated processes, which is why many computer programmers use them.

Process flow charts can get quite complicated. While this example has a large amount of content, it never becomes too difficult for the reader to understand.

Process flow charts sometimes splinter off in multiple directions, but not always. This example shows how a range of outcomes is possible based on a few common steps in the beginning.

Particularly when you’re creating them for Microsoft Word, process flow charts are best served by appearing on a single screen. That sometimes means making them snake around the page. If necessary, be sure to add beginning and ending notes like in this example.

Customize this process flow chart to add branches and nodes that apply to every possible outcome.
Related: 20+ Flow Chart Templates, Design Tips and Examples
Workflow diagram template
Workflow diagram templates can be used in your Word documents to help readers visualize the actions that will take place over the course of a project or one specific workflow within that project.

New employees need to download a great deal of information quickly. That’s why workflow diagram templates are helpful. They can also help train existing employees on new procedures. When updating this for your Word doc, be mindful of the dimensions.

Workflow diagrams often omit the branching aspect of traditional flowcharts. This is useful for situations where you need to visualize a process but the reader doesn’t make any choices along the way.

Workflow diagrams can also help team members see at a glance what tasks should happen during which phases of a process. In this example, the tasks are divided into clear sections. This could be especially useful if different members of the team handle different sections.
Process flow template
Process flow templates can be updated for each new project, and by taking advantage of the orientation of the two examples below, you can make sure they’ll fit nicely in your Word document.

Process flow templates are useful not only for learning the steps needed in a workflow but also for understanding how they relate to each other.

Train customer service representatives using a process flow template like the one above.
Related: 21+ Flowchart Examples to Organize Projects and Improve Processes
Yes/no flowchart template
Yes/no flowcharts are perhaps the most immediately recognizable, and they’re among the most difficult to make using Word’s native tools. But these alternatives would be simple and quick additions to your Word documents.

Yes/no flow charts may be immediately recognizable, but that doesn’t mean they all look the same. Not only does this example align with the yes/no format, but it also adds color-coding to distinguish which teams are responsible for what tasks.

Forgive us for getting a bit meta, but yes/no flowcharts are such useful tools that we made one explaining what flowcharts even are.

So far, we’ve focused mostly on flowcharts that have utility for internal organizational purposes, but they can also be used by marketing teams to create engaging content.
Editable flow chart template
For leaders, project managers and others in organizations, having editable flow chart templates is critical. They can’t afford to waste time. Depending on your needs, consider the editable flow chart templates below.

Consider using an editable flow chart template like this one for processes that repeat over and over again. Once you’ve downloaded our template, you can always go back and edit your design.

Update this editable flow chart to help team members troubleshoot problems they commonly have, whether with computer systems, customers or even coworkers.
Organizational flow chart template
Organizational flow charts can help team members understand how they fit into the business, as well as explaining new procedures or processes.
Clarify the structure of a project or a new process by creating an organizational flow chart like this list-based example:

Or explain your company’s new procedure/process like this Online Sales Procedure process flowchart:

Return to Table of Contents
How to create a Microsoft Word flowchart in Venngage
Making a Microsoft Word flowchart in Venngage is incredibly simple, and it’s even easier thanks to the new smart diagram editor.
Step 1: Sign up for a free Venngage account
You can sign up with your email, Gmail or Facebook account.

Step 2: Select a flowchart template from our templates library
Aside from the ones we’ve shared above, we also offer hundreds of others that are easy to edit even if you have no design skills.
Step 3: Start editing your flowchart with our smart diagram editor
Most of our templates are created with the simple drag-and-drop editor that lets you design in minutes, even if you have no design skills.
We’re also rolling out new smart templates with the smart diagram editor which makes it easy for you to add new nodes/branches to your flowcharts.
You can add, edit, delete or drag nodes, texts, icons around in one click, and the node will automatically adjust to whatever content you add to it as well.

Step 4: Liven up your flowchart with icons, illustrations and branding elements
We offer over 40,000 icons and illustrations for you to visualize any information you want on your flowchart.
If you upgrade to a Business account, you can enjoy My Brand Kit—the one-click branding kit that lets you upload your logo and apply brand colors and fonts to any design.

Step 5: Share a public link for free or upgrade to download
Once you upgrade, you can download your flowchart as a PNG file that you can insert to your Word document. After you’ve downloaded, feel free to go back and make edits any time.
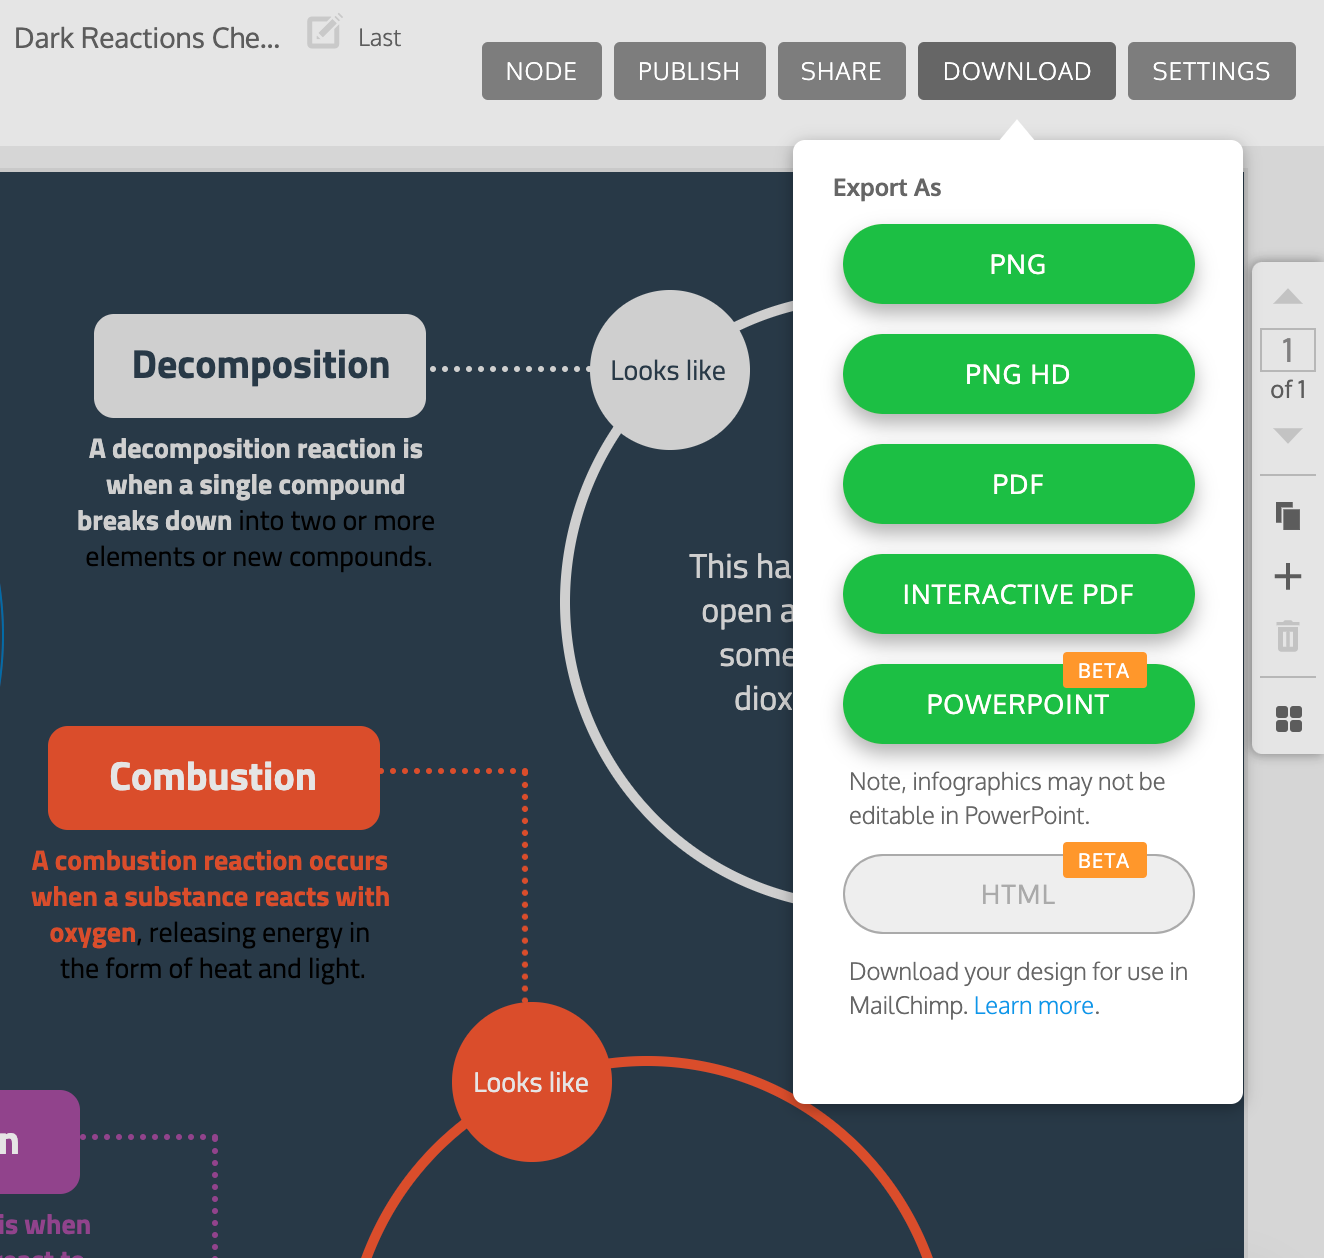
You can also export your flowchart in PDF, Interactive PDF or PowerPoint format—if you want to use it for your presentation.
Return to Table of Contents
In summary: Create stunning, engaging flowcharts for your Microsoft Word proposals, contracts and reports
Instead of creating a flowchart in Word, beef up your visual impact by creating an image in Venngage’s Flowchart Maker and using it to supercharge the visuals in your Word document.
You can start creating one for free right now and see how easy it is to make a flowchart with Venngage’s drag-and-drop editor—no design experience required.
Create a block diagram
- Click the File tab.
- Click New, under templates, or categories, click General, and then double-click Block Diagram.
- From the Blocks and Blocks Raised stencils, drag shapes onto the drawing page.
- To add text to a shape, select the shape and then type.
Contents
- 1 How do you create a block diagram?
- 2 How do you create a diagram in Word?
- 3 How do I create a block chart in Excel?
- 4 How do I make a block diagram in Visio?
- 5 What are the three basic components of a block diagram?
- 6 How do I make a block diagram in latex?
- 7 Can I Draw on Microsoft Word?
- 8 How do you Draw shapes in Word?
- 9 What is the difference between block diagram and flow chart?
- 10 Is Microsoft Visio free?
- 11 How do I create a workflow diagram in Visio?
- 12 What is a block diagram explain the steps involved in the preparation of block diagrams?
- 13 How do you turn a transfer function into a block diagram?
- 14 How many types of block diagrams are there?
- 15 How do you make a graph in LaTeX?
- 16 How do you make an arrow diagram in LaTeX?
- 17 What are block diagrams used for?
- 18 Why can’t I draw on word?
- 19 How do you turn on draw in Word?
- 20 How do you draw on Microsoft Word 365?
How do you create a block diagram?
Block Diagram: Best Practices
- Identify the system. Determine the system to be illustrated.
- Create and label the diagram. Add a symbol for each component of the system, connecting them with arrows to indicate flow.
- Indicate input and output.
- Verify accuracy.
How do you create a diagram in Word?
To create a diagram in a document
- Position the cursor in the document where you want to insert the diagram.
- Do either of the following to open the Choose a SmartArt Graphic dialog box:
- In the left pane, select a type of diagram.
- Click OK to insert the selected diagram at the cursor.
How do I create a block chart in Excel?
To access Excel’s shape library, go to the insert tab and click “Shapes.” A gallery will appear with a variety of basic shapes including lines, arrows, and geometric shapes. Scroll down to find the flowchart section. Click the flowchart shape you want to add, then drag the shape to size on the Excel sheet.
How do I make a block diagram in Visio?
1. How to Create a Block Diagram in Visio
- Step 1: Download and Install Visio App.
- Step 2: Create the Block Diagram.
- Step 3: Connect the Blocks.
- Step 4: Preview and Save.
- Step 1: Sign up first then login.
- Step 2: Choose the Block Diagram Option.
- Step 3: Drag the Shapes.
- Step 4: Connect the Block Diagrams.
What are the three basic components of a block diagram?
Basic Elements of Block Diagram. The basic elements of a block diagram are a block, the summing point and the take-off point. Let us consider the block diagram of a closed loop control system as shown in the following figure to identify these elements.
How do I make a block diagram in latex?
The code for such example is given below:
- documentclass[tikz, border=5mm]{standalone}
- usetikzlibrary{positioning, fit, calc}
- tikzset{block/. style={draw, thick, text width=2cm ,minimum height=1. 3cm, align=center},
- line/. style={ -latex}
- }
- begin{document}
- begin{tikzpicture}
- node[block] (a) {A};
Can I Draw on Microsoft Word?
You can draw freely in Microsoft Word using the “Draw” feature whether you have Word for Mac or Windows. You can also insert customizable shapes into your document, or draw using the “Scribble” feature. The process of drawing in Word varies based on which version of Word and device you’re using.
How do you Draw shapes in Word?
How to draw in Word
- In the ‘Insert tab,’ click the ‘Shapes’ button, and in the drop-down menu select ‘Scribble’
- Click and hold down your mouse to draw the shape you want.
- Release the mouse when you’ve finished drawing.
- Go to the ‘Shape Format’ tab to edit your shape.
What is the difference between block diagram and flow chart?
It is all about the definition. Data Flow Diagram (DFD) has a very well defined notation and semantic. In the other hand, any diagram made from blocks can be called Block Diagram. You can call a DFD as Block Diagram, but not otherwise.
Is Microsoft Visio free?
Is Microsoft Visio Free? No, Microsoft Visio is not a free tool. It comes with monthly or annual subscription plans as well as one-time software purchase for standard and professional versions licensed for 1 PC.
How do I create a workflow diagram in Visio?
Create a flowchart
- Click the File tab.
- Click New, click Flowchart, and then under Available Templates, click Basic Flowchart.
- Click Create.
- For each step in the process that you are documenting, drag a flowchart shape onto your drawing.
- Connect the flowchart shapes in either of the following ways.
What is a block diagram explain the steps involved in the preparation of block diagrams?
A block diagram uses blocks and lines to show the related functions of parts of an electric circuit or system. Such a diagram shows the normal order of progression of the signal through a circuit. A system is an assembly of parts (components) connected together to perform a stated function.
How do you turn a transfer function into a block diagram?
Transfer Functions in Block Diagrams
- Transform each equation in to the Laplace domain.
- Find the transfer function between the specified variables.
- Define the time constant and the gain for each transfer function in terms of the parameters given.
How many types of block diagrams are there?
There are ten types of Flowcharts. Using the Flowcharts solution from the Diagrams area of ConceptDraw Solution Park you can easy and quickly design the Flowchart of any of these types.
How do you make a graph in LaTeX?
The code to create a simple node graph is given below:
- documentclass{article}
- usepackage{tikz}
- begin{document}
- begin{tikzpicture}
- [scale=. 9,auto=center,every node/.
- node (a1) at (1,2) {1};
- node (a2) at (2,5) {2}; % These all are the points where we want to locate the vertices.
- node (a3) at (3,7) {3};
How do you make an arrow diagram in LaTeX?
Notice the use of “phi” in the example below. “〈label text〉”〈label options〉. Both 〈label text〉 and 〈label options〉 need to be enclosed in curly braces if they contain commas. The example above also showcases one of the possible ways to pass special options to a TikZ matrix node.
What are block diagrams used for?
Block diagrams are used heavily in engineering and design of diagrams for electronics, hardware, software and processes. Most commonly, they represent concepts and systems in a higher level, less detailed overview. The diagrams are useful for troubleshooting technical issues.
Why can’t I draw on word?
In Word, you must be in Print layout to draw with ink. If the Draw tab is grayed out so that you can’t select a pen, go the View tab and select Print Layout. Tap again to open the menu of Thickness and Color options for the pen.
How do you turn on draw in Word?
Right-click the Ribbon and select Customize the Ribbon. Check the box next to Draw, then click OK. The Draw tab will now be available in the Ribbon.
How do you draw on Microsoft Word 365?
Click in your document where you want to create the drawing. On the Insert tab, in the Illustrations group, click Shapes.
Add a drawing to a document
- Insert a shape.
- Change a shape.
- Add text to a shape.
- Group selected shapes.
- Draw in the document.
- Adjust the size of the shapes.
On a recent consulting job, I had a client asked me if I
could recommend a good, easy-to-use, and affordable diagramming software
application other than Microsoft Visio.
He then went on to say that he only needed the basics for his project and
couldn’t justify the cost of a copy of Visio nor could he afford the amount of
time that it would take to get up and running with Visio.
After giving it a bit of thought, I recommended that he just
use Microsoft Word. His puzzled stare immediately clued me in
that he had no idea that Word could do basic diagramming.
After I spent some time acquainting him with Word’s
diagramming features, which include the ability to create Cycle, Radial,
Pyramid, Venn, and Target diagrams as well as the more standard flow and
organizational charts, he was quickly creating the diagrams that he needed for
his project. The fact that my client wasn’t aware of Word’s diagramming
features reminded me that most of the folks who use Word only take advantage of
a small fraction of all the features that are packed into Word and that Visio,
while it is the most recognizable, isn’t the only diagramming tool you have at
your disposal.
In this document, I’ll introduce you to Word’s basic
diagramming features and explain how to use them to create great diagrams.
Along the way, I’ll create an example.
Prerequisites
The diagramming
features that I’ll describe in this article are only available in Word XP and
Word 2003. Keep in mind, that the other applications in both the Office XP and
Office 2003 suites also provide the same diagramming features. However, since
Word is probably the most commonly used application, and in this case, the more
appropriate application, I’ll use Word to demonstrate the diagramming features.
More specifically, I’ll be using Word 2003 for my examples and screen shots.
Getting started
To get started, launch Word and create a new document. Then,
pull down the Insert menu and select the Diagram command. When you do so,
you’ll see the Diagram Gallery dialog box, as shown in Figure A.
|
Figure A: |
 |
| The Diagram Gallery displays the six basic diagrams that you can create with Word’s diagramming feature. |
As you can see, the Diagram Gallery contains six diagram
types. Each of these diagram types is described in Table A.
Table A: The Diagram Gallery contains six diagram types
|
Diagram Type |
Description |
|
Organizational Chart |
Use this to illustrate |
|
Cycle Diagram |
Use this to illustrate a |
|
Radial Diagram |
Use this to illustrate |
|
Pyramid Diagram |
Use this to illustrate |
|
Venn Diagram |
Use this to illustrate |
|
Target Diagram |
Use this to illustrate |
Looking over the diagram work area
Once you select a diagram type, a template will appear in
your document, as shown in Figure B,
which is ready for you to begin customizing to your specific needs. However,
before we actually create a diagram, let’s take a few moments to look around
the work area.
|
Figure B: |
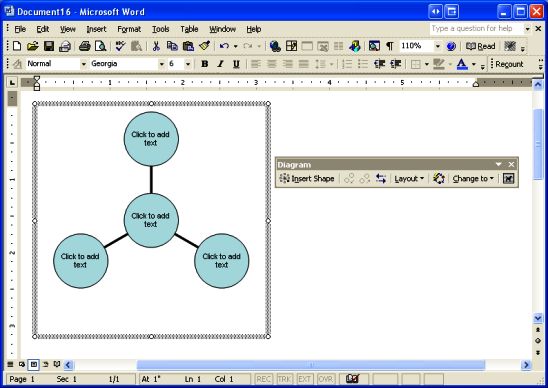 |
| Once you insert a diagram into your document, you’ll see the work area and the Diagram toolbar. |
Looking at the diagram itself, you’ll see that it has a
border around it that defines the work area. This border will disappear once
you select anything outside the work and it will not print. You’ll notice that
there are eight sizing handles, represented by circles, around the border that
you can use, via a click and drag operation, to resize the entire diagram.
The Diagram toolbar, which only appears when the work area
is selected, provides you with a host of configuration and design tools. As you
can see in Figure B, the first item
on the toolbar is the Insert Shape
button, which when clicked automatically places an appropriate element type to
the diagram. For example, if you’re creating a Radial diagram, the Insert Shape
button will add an additional circle to the diagram. (While I’m on the topic,
to delete a shape, simply select the element and press [Delete].)
The next two buttons on the toolbar, Move Shape Backward and Move
Shape Forward, allows you to move individual elements around within the
diagram. For example, if you’re creating a Pyramid diagram, you can use these
buttons to move individual elements up and down the pyramid.
The Reverse Diagram
button allows you to reorient the entire diagram at once. For example, if
you’re creating a Cycle diagram, in which the arrows point to the right by
default, clicking the Reverse Diagram button will reorient the diagram so that
the arrows point to the left.
Next up we have the Layout
drop-down menu, as shown in Figure C.
The Fit Diagram to Contents command
automatically tightens the border around the diagram without resizing the
diagram itself while the Expand Diagram
command automatically add space, at preset intervals, between the border and
the diagram without resizing the diagram. The Resize Diagram command adds resizing handles to the border that
allow you to manually change the border spacing, via a click and drag
operation, without resizing the diagram. The fourth command on the Layout menu
is actually a toggle switch labeled AutoLayout,
which is a setting that must be enabled in order to use the Insert Shape, AutoFormat and Change To
features. However, if the AutoLayout
setting is disabled when you select any of these three features, a dialog box
will prompt you to enable it.
|
Figure C: |
 |
| The Layout drop-down menu allows you to alter the spacing between the diagram and the border. |
When you click the AutoFormat
button, you’ll see the Diagram Style Gallery dialog box, as shown in Figure D, and can select from a variety
of theme-like styles. Typically, you’ll use feature once you’ve completed your
diagram and want to spice it up.
|
Figure D: |
 |
| Word provides a variety of theme-like styles that you can use to change the appearance of your diagram. |
The Change To
drop-down menu allows you to reformat a diagram using one of four other diagram
types—Organization Chart isn’t included. For example, if you’ve created a
Radial diagram and then want to see how it would look as a Target diagram,
you’d just click the Change To
drop-down menu, as shown in Figure E,
and select Target. When you do, your diagram, along with all its text, is
instantly converted.
|
Figure E: |
 |
| Using the selections on the Change To drop-down menu allows you to easily experiment with the various diagrams. |
Like elsewhere in Word, the Text Wrapping drop-down menu provides you with eight ways to
configure how you want to wrap text around your diagram. This comes in handy if
you’re planning on embedding your diagram in the middle of a report.
Note: Organizational charts
As I mentioned, the Change
To drop-down dialog box doesn’t contain an option for converting a diagram
to an Organizational Chart. The reason is being that an
Organizational Chart is a completely different type of diagram. In fact, when
you select Organizational Chart from the Diagram Gallery dialog box, you’ll see
the same work area, but a different toolbar titled Organizational Chart. This
toolbar contains options that are similar to those on the Diagram toolbar, but
the controls are specific to an organization chart. In order to stay focused on
Word’s new diagramming features, I won’t cover Organizational Charts in this
article.
Creating a Diagram
Now that you have a good idea of how to use Word’s
diagramming features, let’s take a look at the process of creating an example
diagram. As I work through this example, I’ll describe a set of techniques that
you can use in Word as you go about creating your own diagrams.
Let’s suppose that you’ve been asked to create a document
detailing all the brands associated with the parent company. In order to instantly
convey the number of brands associated with the parent company you decide to
use a Radial diagram. For the sake of a real world example, let’s use CNET
Networks as our example parent company and create a Radial diagram that shows
the company’s 18 brands.
To begin, launch Word and open a new document. In order to
get the most out of the available document space when you create such a large
diagram, you’ll need to first prepare the page. To do so, pull down the File
menu and select the Page Setup command. On the Margins tab of the Page Setup
dialog box, select the Landscape orientation, set the Top, Bottom, Left, and
Right Margins to 0.25 and click OK
When you return to the document, click the Center alignment
button on the toolbar. Now, access the Diagram Gallery dialog box as described
earlier, select the Radial diagram type, and click OK.
By default, the Radial diagram template displays a central
element surrounded by three nodes. Since you need to have a total of 18 nodes,
you’ll need to click the Insert Shape button 15 times. As you do, you’ll notice
that Word automatically scales the size of the diagram work area to fit the
page. In order to better work with the diagram as a whole at this stage in the
process, click the Zoom box on the Standard toolbar and set the factor to 40%.
Now, use the sizing handles to resize the diagram to fit the entire page, as
shown in Figure F.
|
Figure F: |
 |
| By zooming in, you’ll be able see the entire image as you resize and format diagram. |
Then next thing that you’ll want to do while you have the
diagram in this configuration is set the font and font size in each of the
nodes. To do so, hold down [Shift] as you successively click each node. Then,
set the font and font size on the Formatting toolbar. In this particular
diagram, I’ll use Arial Narrow and 12 pt. You can then Zoom back out to 100%
and begin entering text in the nodes.
As you begin entering text, you can alter positioning and
size as you see fit. In the case of my example, there were so many nodes and
some of the names were quite long, so I went to the Diagram Style Gallery and
selected the Square Shadows style, which provides a bit more room for text. I
then centered the text in each of the squares. The end result is a very nice
diagram that clearly illustrates the number of brands in the CNET stable, as
shown in Figure G.
|
Figure G: |
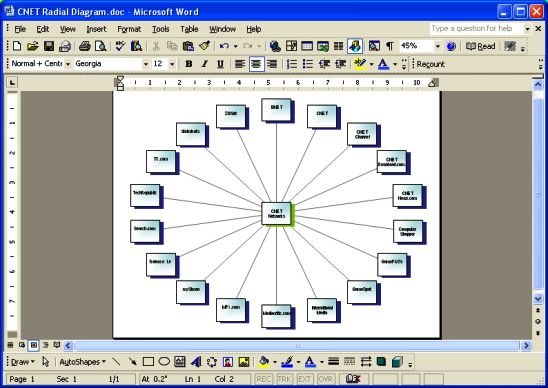 |
| By switching to the Square Shadows style and tweaking the text layout a bit, I’ve created a very nice looking diagram. |
Conclusion
The next time you need to create a basic diagram, remember
that Word XP and Word 2003 provide excellent diagramming features. Keep in mind
that it may take a little bit of time to get used to creating diagrams in Word,
but it’s actually very easy once you get a handle on the process. To help you
get started, you can look at the CNET Radial Diagram.doc file which includes
the Radial diagram that I created for this article’s example.
HelpDesk

ConceptDraw PRO allows you to easily create business process diagrams and then add them to a MS Word document.
HelpDesk
How to Add a Block Diagram to a MS Word ™ Document Using ConceptDraw PRO

Block diagram consists from graphic blocks. Blocks are connected by lines or arrows. Block diagrams are used to show the relationship between parts of some systems. It can be used for the development of new systems or to improve existing ones. The structure of block diagram gives a high-level overview of the major components of the system, as well as the important relationships. Using the block diagrams, you can more effectively present the business data contained in your MS Word documents. ConceptDraw PRO allows you to easily create block diagrams and then insert them into a MS Word document.
Basic Flowchart Symbols and Meaning

Flowchart Symbols and Meaning — Provides a visual representation of basic flowchart symbols and their proposed use in professional workflow diagram, standard process flow diagram and communicating the structure of a well-developed web site, as well as their correlation in developing on-line instructional projects. See flowchart’s symbols by specifics of process flow diagram symbols and workflow diagram symbols.

How to Build a Flowchart
HelpDesk
How to Add a Bubble Diagram to MS Word

A bubble diagram is used the same purpose as a scatter diagram, but in the case, if the data has three dimensions, each of that containing the set of values. A bubble chart is a diagram in which the data points are replaced with bubbles, and the size of the bubbles represents some additional dimension of the data. A bubble chart does not have the axis. The sizes of the bubbles are determined by the values in the third dimension. Any additional information about the entities beyond their three primary dimensions can be depicted by rendering bubbles in colors and patterns that are selected in a certain way. The legend containing the further information can be added to a bubble diagram. ConceptDraw PRO allows you to easily create various business management and marketing charts, including bubble diagrams and then add them to a MS Word document.
Process Flowchart

ConceptDraw is Professional business process mapping software for making process flow diagram, workflow diagram, general flowcharts and technical illustrations for business documents. It is includes rich examples, templates, process flowchart symbols. ConceptDraw flowchart maker allows you to easier create a process flowchart. Use a variety of drawing tools, smart connectors, flowchart symbols and shape libraries to create flowcharts of complex processes, process flow diagrams, procedures and information exchange.

How To Create a Process Flow Chart (business process modelling techniques)
HelpDesk
How to Add a Rack Diagram to MS Word Document

Rack Diagram depicts the structure of network equipment installation, and provides network administrator with the base to support electronic equipment, power, cooling, and cable management. ConceptDraw PRO allows you to easily create diagram that will help to detail the type of rack equipment that best fits your needs and then lets you to insert the scheme of rack configuration into the network documentation pack. ConceptDraw PRO allows you to easily create rack configuration diagrams and then insert them into a MS Word document.
HelpDesk
How to Convert a Mind Map into MS Word Document

Mind maps are often used for structuring ideas, planning and organizing of various documents. ConceptDraw MINDMAP allows you transfer a mind map to MS Word format using its export facilities. You can convert a mind map to a MS Word outline using the set of standard templates, or even your custom template. Thus, your mind map will be transformed into the proper document format. Using a custom MS Word template allows you apply your individual style to each document, being exported from ConceptDraw MINDMAP. You can use a mind mapping to capture ideas and structure information. Then making a quick conversion to MS Word and you finally obtain a clean and stylish document.
HelpDesk
How to Add a Cross-Functional Flowchart to MS Word

A cross-functional flowchart is a type of flowchart that can be helpful in understanding a complicated process flow. ConceptDraw PRO allows you to easily create cross-functional flowcharts and then insert them into a MS Word document.
Line Chart Template for Word

This sample was created in ConceptDraw PRO diagramming and vector drawing software using the Line Graphs Solution from Graphs and Charts area of ConceptDraw Solution Park.
This sample shows the Line Chart of annual percentage change. The Line Chart allows you to clearly see the changes of data over the time.
- How To Export Business Process Diagram To Word
- How To Export Flowchart To Word
- How To Export Network Diagram To Word
- Flowchart Software | How to Add a Business Process Diagram to a …
- How to Add a Business Process Diagram to a MS Word Document …
- Process Flowchart | Basic Flowchart Symbols and Meaning | Export …
- Business Processes Area | Business Process Flowchart Symbols …
- Process Flowchart | How to Add a Business Process Diagram to a …
- How To Convert a Business Process Diagram to Adobe PDF Using …
- Business Processes description with ConceptDraw PRO | How To …
- Process Flowchart | How to Add a Business Process Diagram to a …
- Idea To Export Flowchart
- Business Process Modeling Software for Mac | BPM Software …
- Process Flowchart | How To Convert a Business Process Diagram to …
- How to Add a Flowchart to a MS Word Document Using …
- How To Make a PowerPoint Presentation of a Business Process …
- Video Business Process Modeling With Conceptdraw
- Rapid UML | UML Class Diagram Tutorial | Business Process …
- Bar Chart Template for Word | Process Flowchart | Feature …
- Free Gantt Chart Template For Word
- ERD | Entity Relationship Diagrams, ERD Software for Mac and Win
- Flowchart | Basic Flowchart Symbols and Meaning
- Flowchart | Flowchart Design — Symbols, Shapes, Stencils and Icons
- Flowchart | Flow Chart Symbols
- Electrical | Electrical Drawing — Wiring and Circuits Schematics
- Flowchart | Common Flowchart Symbols
- Flowchart | Common Flowchart Symbols