
PowerPoint for Microsoft 365 PowerPoint 2021 PowerPoint 2019 PowerPoint 2016 PowerPoint 2013 PowerPoint 2010 More…Less
If you are using PowerPoint 2013 or a newer version, you can link data from a saved Excel worksheet to your PowerPoint presentation. That way, if data in the worksheet changes, you can easily update it in your PowerPoint presentation.
Link an entire Excel worksheet to PowerPoint
-
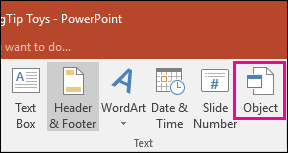
In PowerPoint, on the Insert tab, click or tap Object.

-
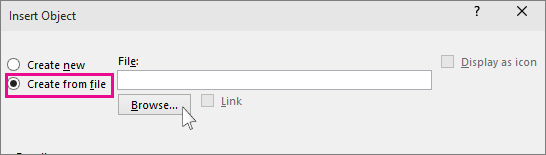
In the Insert Object dialog box, select Create from file.
-
Click or tap Browse, and in the Browse box, find the Excel workbook with the data you want to insert and link to.
-
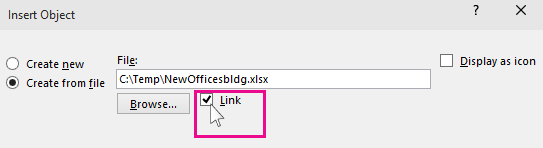
Before you close the Insert Object box, select Link, and click OK.
Important: The linked object in your presentation displays all the data from the active, top worksheet in the linked Excel workbook. When you save the Excel workbook, make sure the worksheet you want in your presentation is the one you see when you first open the workbook.
Link a section of data in Excel to PowerPoint
-
In Excel, open the saved workbook with the data you want to insert and link to.
-
Drag over the area of data you want to link to in PowerPoint, and on the Home tab, click or tap Copy.
-
In PowerPoint, click the slide where you want to paste the copied worksheet data.
-
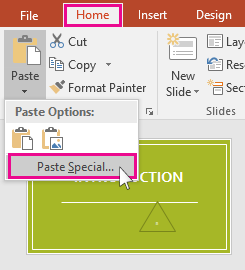
On the Home tab, click the arrow below Paste, and select Paste Special.
-
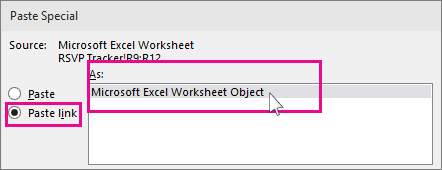
In the Paste Special box, click Paste link, and then, under As, select Microsoft Excel Worksheet Object.
Copy and paste (unlinked) Excel data in PowerPoint
In this case, the Excel data will not be linked to your PowerPoint presentation. You copy the data from an Excel worksheet and paste it into your presentation. The worksheet does not send automatic updates to PowerPoint.
-
In Excel, open the workbook with the data you want to copy.
-
Drag over the area of data you want to copy, and on the Home tab, click or tap Copy.
-
In PowerPoint, click the slide where you want to paste the copied worksheet data.
-
On the Home tab, in the Clipboard group, click the arrow below Paste.
-
Under Paste Options, pick one of the following. Move the mouse pointer over each Paste option to see a preview of what it would look like.
Use Destination Styles to copy the data as a PowerPoint table, using the format of the presentation
Keep Source Formatting to copy the Excel data as a PowerPoint table, using the format of the worksheet
Embed to copy the data as information that can be edited in Excel later
Picture to copy the data as a picture that can’t be edited in Excel
Keep Text Only to copy all the data as a single text box


See Also
Copy an Excel chart to another Office program
Insert a linked worksheet
To insert and link a saved Excel worksheet onto your PowerPoint slide, do the following:
Important: The linked object in your presentation displays all data from the active, top worksheet in the linked Excel workbook.
-
In PowerPoint 2010, on the Insert tab, in the Text group, click Object.
-
In the Insert Object dialog box, select Create from file.
-
Click Browse, and in the Browse dialog box, browse to and then select the Excel workbook that contains the information that you want to insert, and then click OK.
-
In the Insert Object dialog box, select Link and then click OK.
To edit a linked Excel worksheet, do one of the following:
-
To edit the data from within Excel, right-click the object on the slide, point to Linked Worksheet Object, and select Edit.
-
To update the data on the slide to match the data in the original Excel file, right-click the object on the slide, and click Update Link.
Insert a linked selection from a worksheet
To insert and link a selection of data from a saved Excel worksheet, do the following:
-
In Excel, open the workbook containing that data that you want to insert.
-
Select and copy the data that you want.
Keyboard shortcut You can press CTRL+C to copy the data.
-
In PowerPoint 2010, click the slide where you want to paste the copied worksheet data.
-
On the Home tab, in the Clipboard group, click the arrow below Paste, and select Paste Special.
-
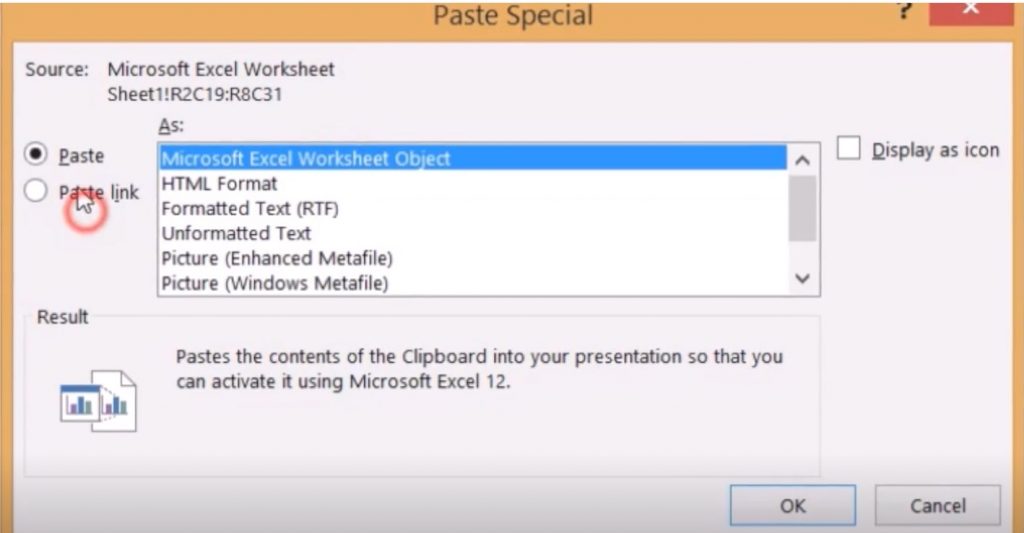
In the Paste Special dialog box, under As, select a Microsoft Excel Worksheet Object.
-
Select the Paste link check box and click OK.
To edit a selection of cells from a linked Excel worksheet, do one of the following:
-
To edit the data from within Excel, right-click the object on the slide, point to Linked Worksheet Object, and select Edit.
-
To update the data on the slide to match the data in the original Excel file, right-click the object on the slide, and click Update Link.
Copy a selection of cells onto a slide
To paste a copy a selection of Excel data onto your PowerPoint slide, do the following:
Note: Data copied and pasted onto a PowerPoint slide does not automatically update when the data is changed in the Excel workbook. To link the data on the PowerPoint slide to the original Excel data source, see the «Insert a linked selection from a worksheet» section immediately above.
-
In Excel, open the workbook that contains the information that you want to copy.
-
Select and copy the data that you want.
Keyboard shortcut You can press CTRL+C to copy the data.
-
In PowerPoint 2010, click the slide where you want to paste the copied worksheet data.
-
On the Home tab, in the Clipboard group, click the arrow below Paste.
-
Under Paste Options, do one of the following:
-
Select Keep Source Formatting if you want to copy the data as a PowerPoint table, but want it keep the appearance of the original Excel worksheet.
-
Select Use Destination Styles if you want to copy the data as a PowerPoint table, but want it to assume the appearance of the PowerPoint presentation.
-
Select Embed if you want to copy the data as information that can be edited in PowerPoint.
-
Select Picture if you want to copy the data as an un-editable picture.
-
Select Keep Text Only if you want to copy all the data as a single text box.
-
See Also
Import content from other applications
Copy an Excel chart to another Office program
Need more help?
Graphs and charts are a major part of almost any presentation deck design. Allowing to present data in a clear and convenient way, they are a must, especially when you’re dealing with data-driven stuff, either for school or for business. While some presentation-making tools allow you to create graphs to a certain degree, for a more professional approach, and especially if you need more complex graphs done fast, nothing would match Excel. The problem is though, Excel is not presentation software (obviously). So, you’ll have to somehow integrate it into your presentation and link Excel tables or data to PowerPoint. How to do it? Let’s find out together!
Why link Excel and PowerPoint?
As we already mentioned, Excel allows you to make graphs easily. However, another great feature is that you can actually make the data in your presentation dynamic. This means that updating the numbers in your Excel sheet would make the graphs implemented in the presentation updated as well. It’s a great feature to use for continuous presentations, such as monthly reports, powerpoint data visualization etc.
Another great feature is the ability to use multiple different graphs, derived from different sheets, bringing various sources of data together. While they won’t affect each other when you change some of the data, they would be stored in one place and even in one slide (that is if you could fit more than two graphs on one slide).
The first thing to know is that the Excel integration with presentation software is mostly limited to PowerPoint or Google Slides. Since both Excel and PowerPoint are Microsoft products, they are integrated quite well. So, there should be no problem with inserting an Excel sheet in PowerPoint or putting the graph from Excel into your slide. Actually, there are several methods of connecting your Excel and PowerPoint data
Method 1: Copy & Paste
Literally, just copy the graphs from the Excel sheet and paste them into your presentation. The graph would be pasted like an image (in the PNG format), and you can then adjust its height and width, as well as positioning on the slide, just like with any other picture. While really simple and quick, this method would strip the graph from some of the really important qualities. Most importantly, you won’t be able to automatically update data in it. However, you can paste it as an Excel file as well, giving the graph all of the functionality of an Excel file.
Method 2: Special Paste
This method involves a bit more complexity. It allows you to insert both charts and related graphs into your presentation. You can do it in Excel by selecting the Home tab, selecting Copy in the Clipboard group. In PowerPoint, choose the Home tab, select Special Paste, and choose the Paste Link in the submenu. This method allows you to put more data, and work both with the graph and the chart with the graph’s data.
However, keep in mind that the chart you have inserted is linked with a fixed number of cells in the Excel sheet. That means that if you want to add another variable or to expand the existing rows and columns, the data imported into PowerPoint won’t be updated, and an error message will be displayed. What is more, your data in PowerPoint will only be linked to the sheet from which you copied it. So, if you will make a copy and start to make changes to it, they will not be linked to PowerPoint.
Method 3: Data only
If for some reason, you just want to have only the numerical or text data copied from Excel, you can do that quite easily. While you won’t be truly embedding excel in PowerPoint, you can use this data to make the graphs inside a presentation software, using the graph creating tools available in PowerPoint. You can either copy the data as plain text or go with the embed Excel in the PowerPoint function so that the data in the presentation would upgrade along with the change you make in Excel.
While you can make graphs in PowerPoint as well, it’s better to do it in Excel though. So, this method might be useful mostly if you have a specific need to make a graph in PowerPoint. On the other hand, you can use it for the data that needs no graphic presentation. After all, Excel is a powerful counting tool and if you simply want to present a chart with your results, this method would definitely work great for you, saving your time by using Excel formulas.
Method 4: Linking to Excel files
This method allows you to put the links to the Excel files into the PowerPoint slide and basically make a PowerPoint link to Excel. When clicking on the link, it will send right into the spreadsheet. It’s a perfect way of storing large amounts of data, as it occupies less space on the slide, and reduces the file size of your presentation. You can link Excel to PowerPoint by choosing Link in the Insert menu. There, you can choose a file you need either from the computer storage or your cloud.
The main disadvantage to this method is that it might be quite confusing and inconvenient. It involves switching between the two apps, which usually takes up more time and complicates your presentation process. What is more, the links simply do not look good on the slide in most cases. However, for presenting really large projects with lots of graphics and complex Excel spreadsheets this method can be the only viable choice.
In conclusion
As you can see, there are several ways of PowerPoint link to Excel and your choice mainly depends on what kind of Excel integration you want. For the most part, simply posting the graph as a picture or as an Excel file should do the trick, though, in some more specific cases, stuff like links to Excel can help as well. We really hope that this article provided some valuable insights on Excel and PowerPoint integration!
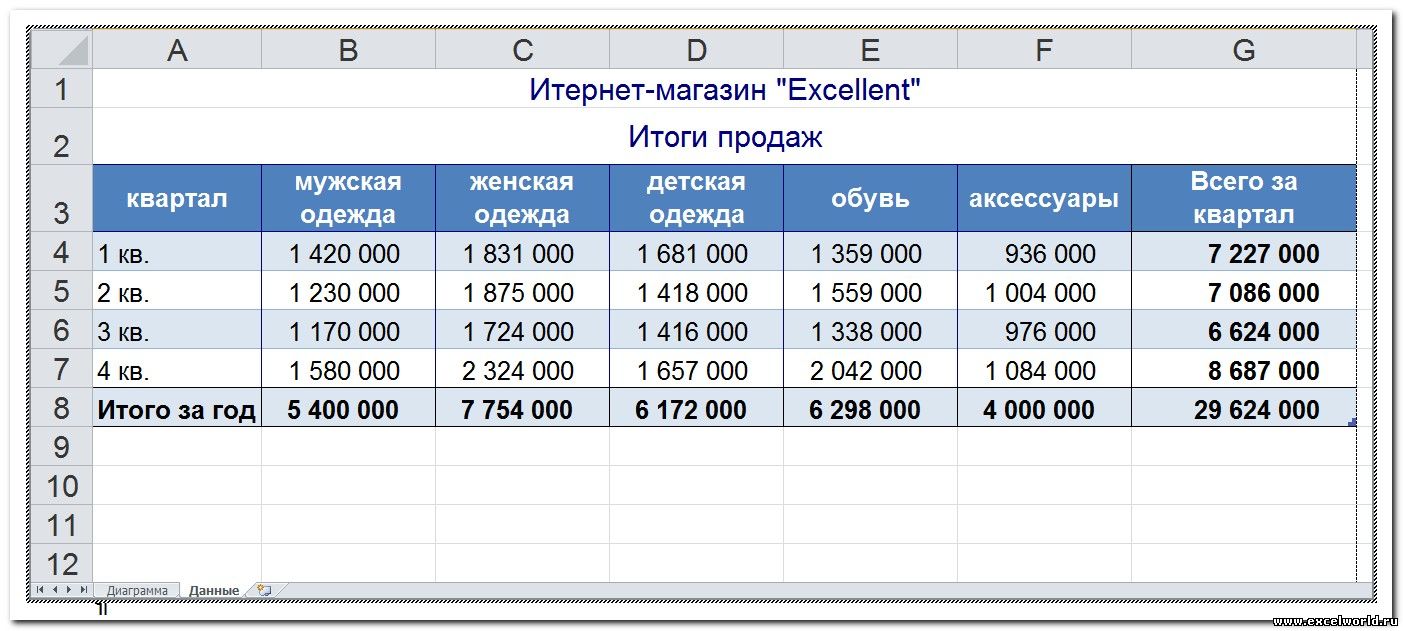
Любая презентация выглядит эффектнее и нагляднее, если в ней присутствуют такие элементы как таблицы и диаграммы. Но встроенные инструменты PowerPoint не имеют таких возможностей и не так удобны, как аналогичные инструменты Excel. Поэтому важно уметь вставить в слайды таблицы и диаграммы, созданные в Excel.
Сделать это можно с помощью внедрения или связывания.
Прежде всего нужно понимать, в чём различие между «связыванием» и «внедрением».
Если нам не требуется (а иногда и нежелательно) обновлять в презентации таблицу или диаграмму, полученную из Excel, то используем внедрение. При этом на слайд помещается статическая копия данных, т.е. внедрённый объект становится частью презентации и уже никак не связан с источником данных. Размер файла презентации при этом, естественно, увеличивается.
Если же нам нужно поддерживать данные, полученные из Excel, в актуальном состоянии, следует использовать связывание. При этом на слайд помещается ссылка на объект Excel, соответственно, при изменении исходной таблицы или диаграммы данные на слайде также изменятся.
Рассмотрим разные способы связывания и внедрения.
1. ЧЕРЕЗ БУФЕР ОБМЕНА
Все мы знаем, что работа с буфером обмена осуществляется с помощью команд Копировать/Вставить. Но следует отметить, что в презентациях действие команды Вставить различается для таблиц и диаграмм.
Если Вы в файле Excel выделили таблицу, выполнили команду Копировать, перешли на слайд и дали команду Вставить, то таблица вставится как таблица PowerPoint с возможностью редактирования средствами PowerPoint, но по умолчанию связь с источником установлена не будет. То есть произойдёт внедрение.
Если же Вы все те же действия выполните с диаграммой, то диаграмма вставится как диаграмма PowerPoint с возможностью редактирования средствами PowerPoint, и по умолчанию будет установлена связь с источником. То есть произойдёт связывание.
Если мы хотим изменить параметры вставки, принятые по умолчанию, нам придётся использовать Специальную вставку. Для этого выделяем на листе Excel диапазон ячеек или диаграмму, выполняем команду Копировать, переходим на слайд и даём команду Специальная вставка. Размещение этой команды зависит от версии PowerPoint.
В версиях до PowerPoint 2003 включительно она находится в меню Правка. Начиная с PowerPoint 2007 эту команду можно найти в раскрывающемся списке кнопки Вставить на вкладке Главная.
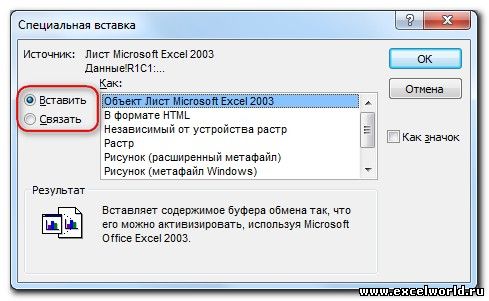
Диалоговое окно Специальная вставка выглядит следующим образом:
если вставляется таблица
если вставляется диаграмма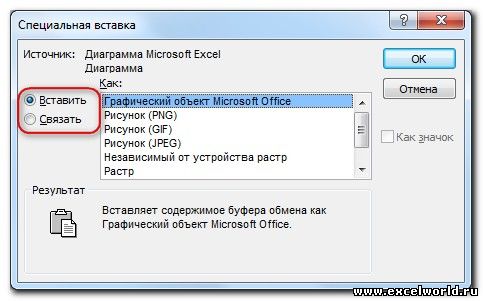
В обоих случаях в этом диалоговом окне можно установить переключатель Вставить/Связать, а также выбрать формат вставляемого объекта.
Кроме того, начиная с PowerPoint 2010 в контекстном меню присутствует команда Параметры вставки, с помощью которой можно выбрать варианты внедрения или связывания.
При вставке таблиц доступны только варианты внедрения

А при вставке диаграмм — как внедрения, так и связывания
2. СОЗДАНИЕ НОВОГО ОБЪЕКТА
Чтобы создать на слайде таблицу или диаграмму средствами Excel, на вкладке Вставка в группе Текст нажимаем кнопку Объект,

для версий старше PowerPoint 2007 выполняем команду меню Вставка — Объект
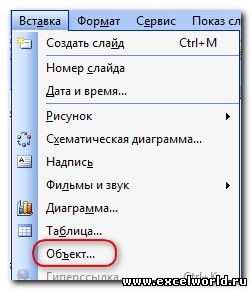
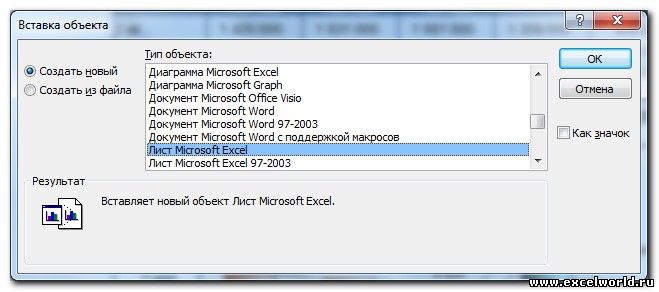
и в раскрывшемся диалоговом окне ищем в списке строчку Лист Microsoft Excel и нажимаем ОК
После этого на странице документа мы видим фрагмент листа Excel, а также ленту с вкладками (или меню) Excel.
Тот же результат получится, если на вкладке Вставка раскрыть список под кнопкой Таблица и выбрать вариант Таблица Excel.

Таким образом, мы можем внедрить таблицу Excel и работать с ней, используя все возможности этой программы, прямо на слайде.
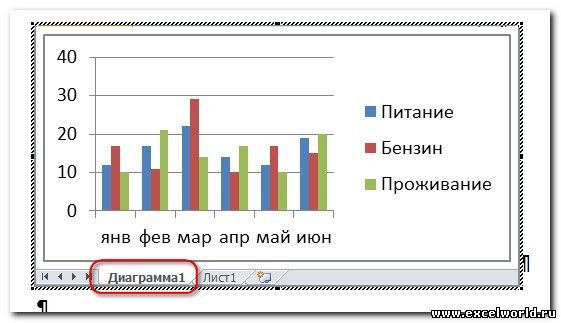
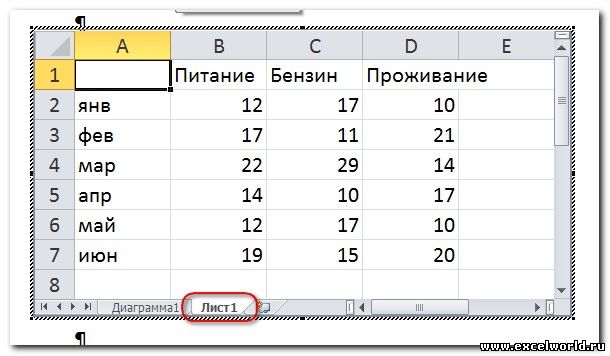
Если мы хотим создать внедрённую диаграмму, то в диалоговом окне Вставка объекта на вкладке Создание выбираем строчку Диаграмма Microsoft Excel. В этом случае будет создан не один лист Excel, а два: на первом будет пример диаграммы, а на втором — исходные данные для неё, которые следует заменить своими исходными данными.
После того как таблица/диаграмма создана, щелчок мыши вне рамки объекта возвращает нас в документ. Если требуется вернуться к редактированию объекта, достаточно сделать по нему двойной щелчок мышкой.
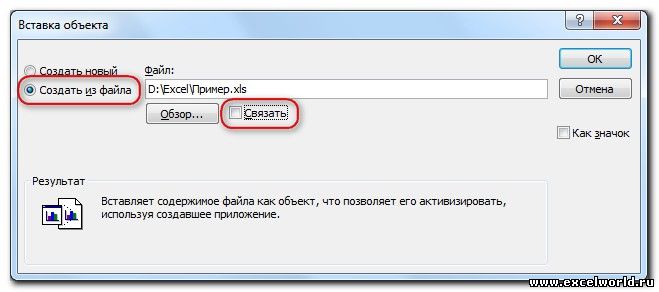
3. СОЗДАНИЕ ОБЪЕКТА ИЗ ФАЙЛА
Для этого на вкладке Вставка в группе Текст нажимаем кнопку Объект и в раскрывшемся диалоговом окне ставим переключатель Создать из файла. С помощью кнопки Обзор находим в Проводнике нужный файл Excel. При этом обращаем внимание на флажок Связать. Если он не установлен, то произойдет внедрение таблицы или диаграммы на слайд, если же флажок установить, то будет связывание. Нажимаем ОК.
На слайд вставляется лист, который был активен при последнем сохранении книги.
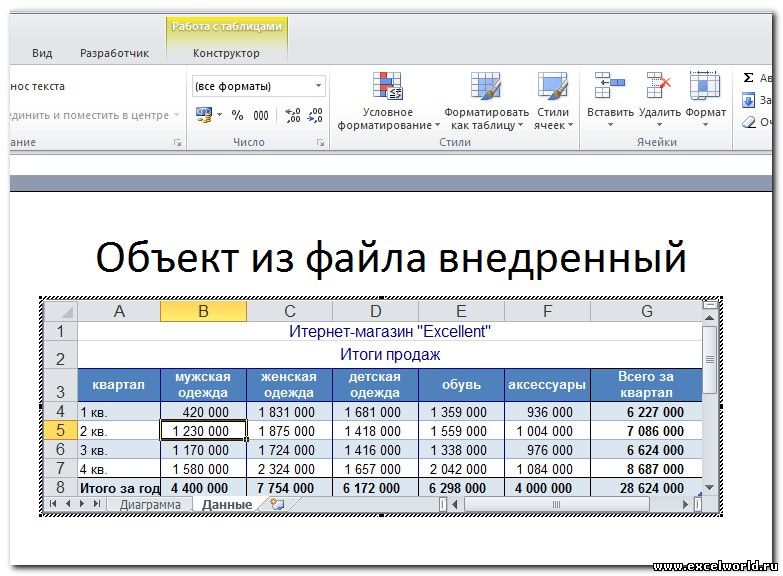
Пожалуй, стоит несколько подробнее остановиться на различиях «в поведении» внедрённых и связанных таблиц и диаграмм, созданных из файла.
Если объект внедрён, т.е. связь с источником не установлена, то двойной щелчок мыши по объекту приведёт к переходу в режим редактирования. При этом лента (меню) PowerPoint заменится на ленту (меню) Excel со всеми инструментами, но сам внедрённый объект мы будем видеть на слайде в характерной штриховой рамке.
Если же таблица или диаграмма связана с источником, то при двойном щелчке мышкой для редактирования откроется файл-источник в отдельном окне Excel.
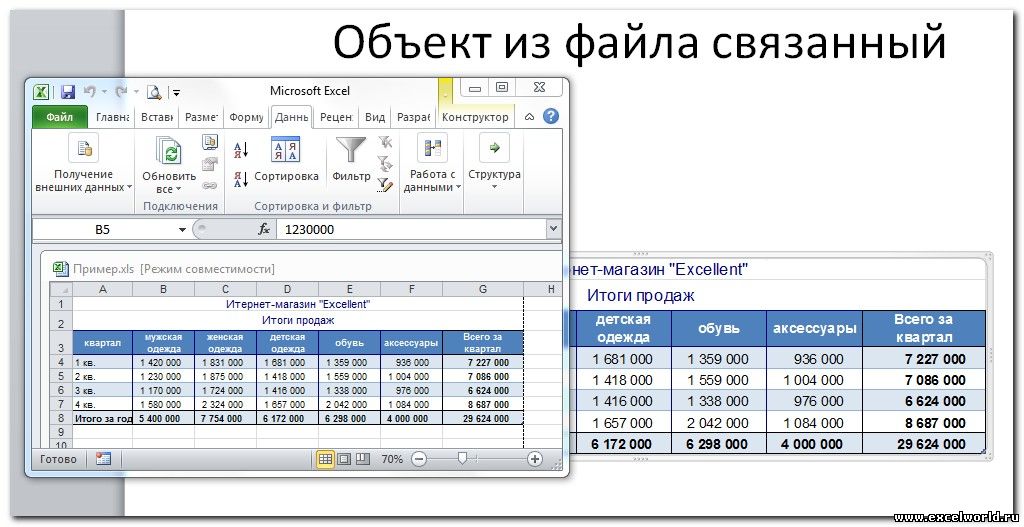
После изменений, внесенных в файл-источник, мы его сохраняем, и тогда эти изменения отражаются на слайде в связанной таблице или диаграмме.
Изначально PowerPoint подгоняет размеры вставляемой таблицы или диаграммы таким образом, чтобы они полностью разместились на слайде. Из-за этого большие таблицы могут быть настолько уменьшены, что окажутся нечитаемыми. Если мы хотим, например, чтобы на слайде отобразилась часть таблицы, то следует научиться изменять размеры отображаемого объекта. Размерами внедрённого объекта управляют с помощью размерных маркеров по углам и по серединам сторон рамки выделения. Кроме того, такие же размерные маркеры доступны, если войти в режим редактирования внедренного объекта.
В чём отличие? Если Вы перемещаете размерные маркеры, находясь в режиме редактирования внедренного объекта, то Вы увеличиваете/уменьшаете количество видимых строк/столбцов.
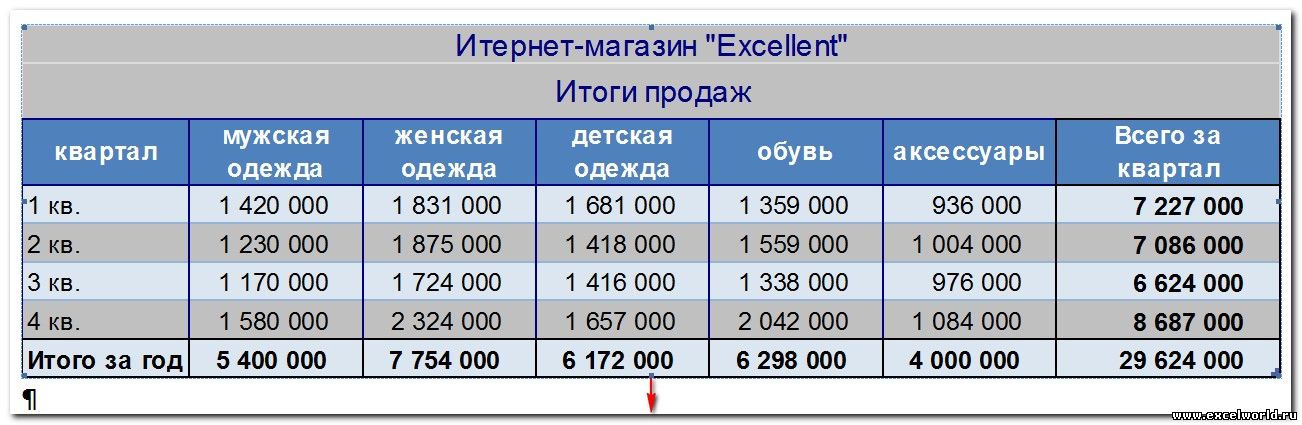
Было
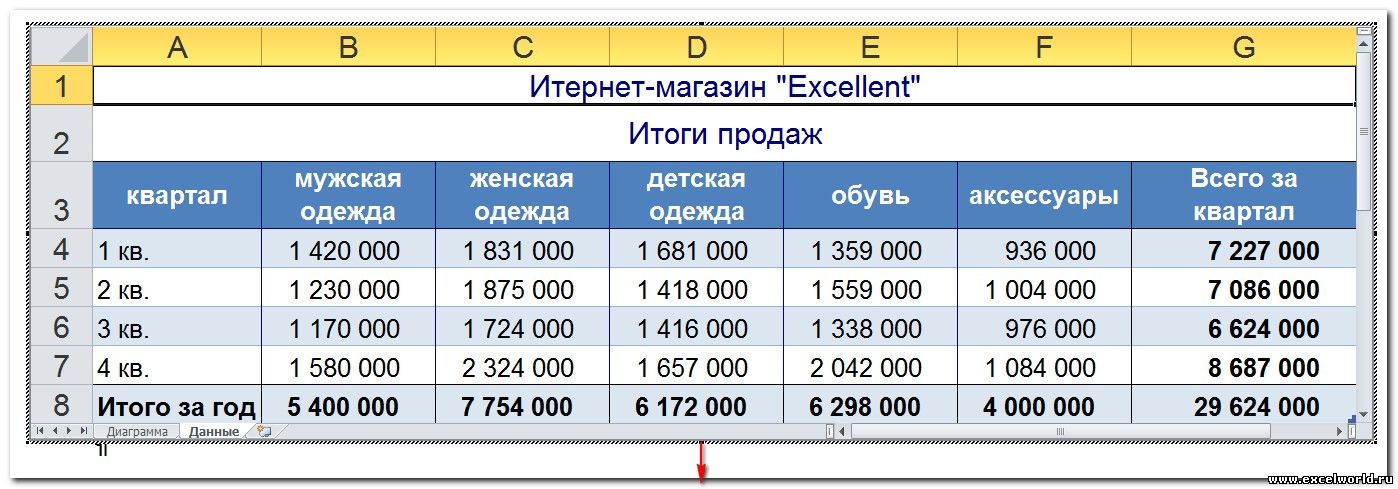
Стало
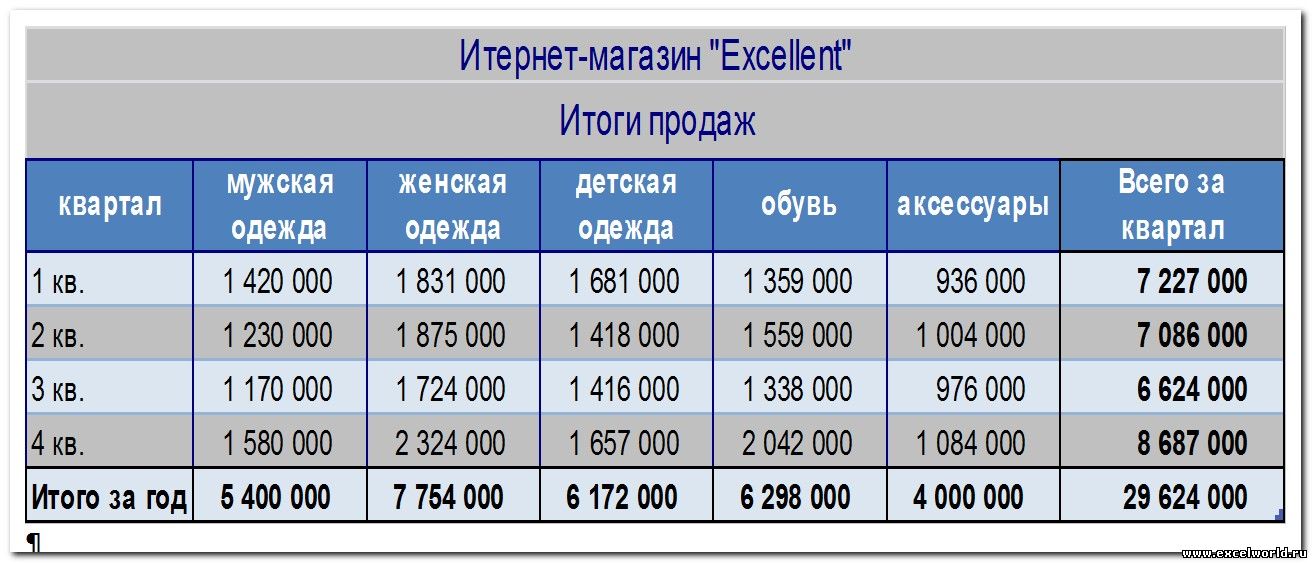
Если же Вы ту же самую операцию делаете, не входя в режим редактирования, то Вы просто растягиваете/сжимаете рисунок.
Было
Стало
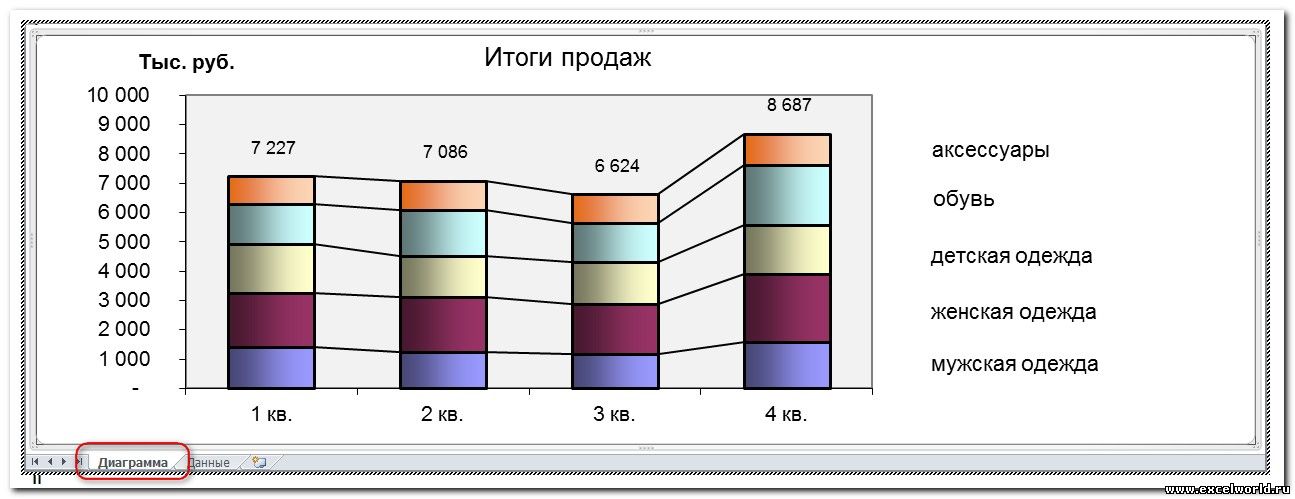
Совет. Если Вы планируете внедрять диаграмму в документ, то лучше расположить её на отдельном листе.
При открытии файла со связанными таблицами или диаграммами появляется диалоговое окно с предложением обновить связи.

Если вы не уверены в надёжности источника связанных файлов, нажмите Отмена.
Если выбран вариант Обновить связи, то данные в презентации обновятся в соответствии с последними изменениями в книге Excel.
Чтобы установленная связь работала, требуется, чтобы файл с электронной таблицей не переименовывался и не перемещался. Если всё же такое произошло, то чтобы заново прописать путь к источнику, можно воспользоваться диалоговым окном Связи.
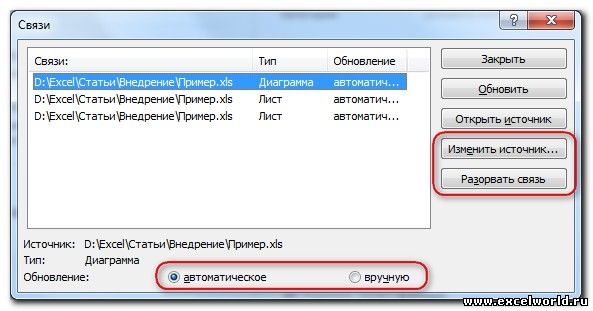
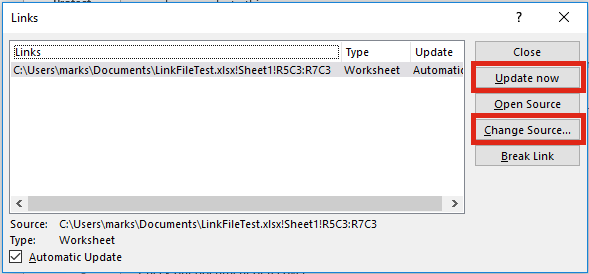
Как видим, в этом диалоговом окне есть возможность Изменить источник, а также Разорвать связь, если таковая больше не требуется. Кроме того, здесь же можно выбрать способ обновления связи: автоматически или вручную.
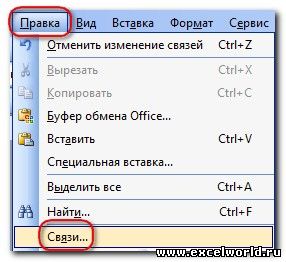
В версии до PowerPoint 2007 это диалоговое окно открывается при выполнении команды меню Правка — Связи.
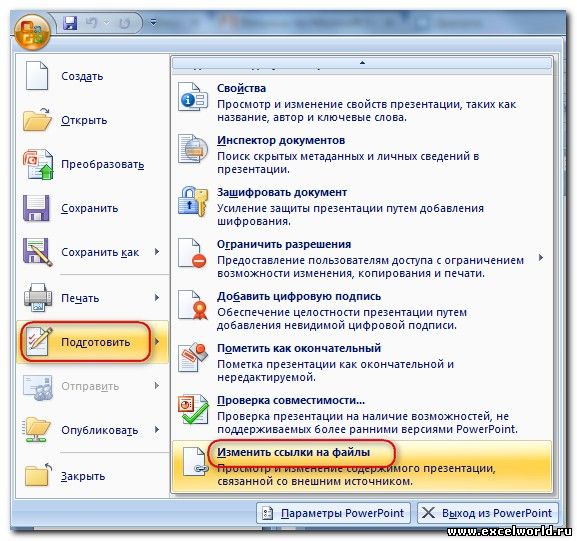
В PowerPoint 2007 его можно открыть, нажав кнопку Office и выбрав команду Подготовить — Изменить ссылки на файлы.
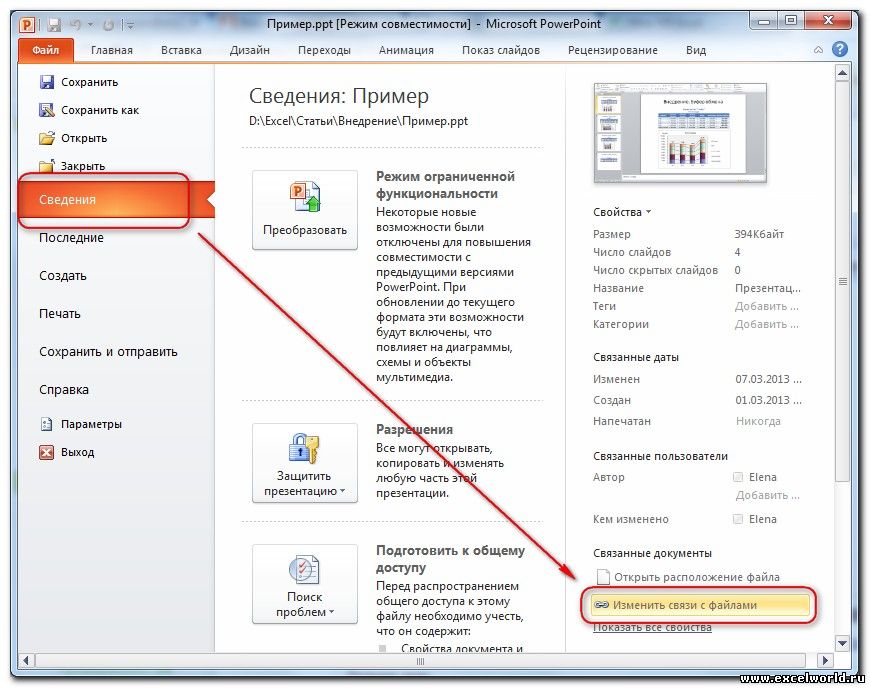
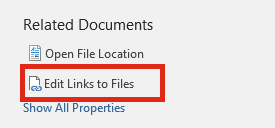
Начиная с PowerPoint 2010 для этого выбираем вкладку Файл — Сведения — Связанные документы — Изменить связи с файлами.
ПРИМЕРЫ

Get our FREE VBA eBook of the 30 most useful Excel VBA macros.
Automate Excel so that you can save time and stop doing the jobs a trained monkey could do.
Claim your free eBook

If you regularly create PowerPoint presentations that include information from Excel, you will know how frustrating it can be. Having to re-copy and re-paste the information every time a change is made in the original Excel documents. Have you come across the feature which enables you to link your Excel workbook directly into your PowerPoint presentation? When you use this feature, the presentation changes automatically each time your workbook changes. This is what we will be covering in this post.
Linking an Excel document to a PowerPoint presentation
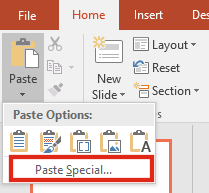
The process of linking an Excel document to a PowerPoint presentation is pretty straightforward. Simply copy a range from Excel (Home -> Copy in the Ribbon, or Ctrl+C as a shortcut). Then, in PowerPoint click Home -> Paste -> Paste Special . . .
From the Paste Special window select Paste link, click Microsoft Excel Worksheet Object, then click OK.
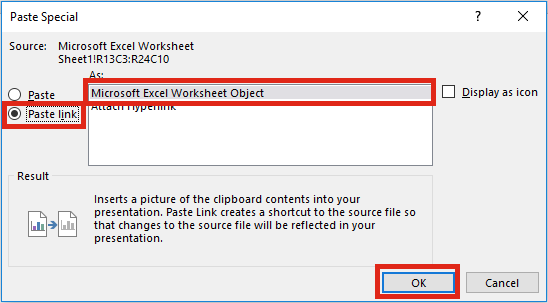
The pasted image will now be linked to Excel. If the Excel file and PowerPoint presentation are both open any changes will update automatically.
Update and edit links
Once the links are created in the presentation, you may need to update them at a future point. If the Excel file is not open it is possible to update links using the following methods.
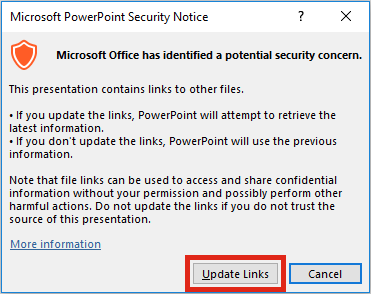
Updating when opening the presentation
When opening a presentation, PowerPoint will ask if you wish to update the links. Just click the Update Links button and the presentation will be updated with the latest information.
Updating on demand
If you just want to update a single linked image you can right-click the image, then select Update Link from the menu.
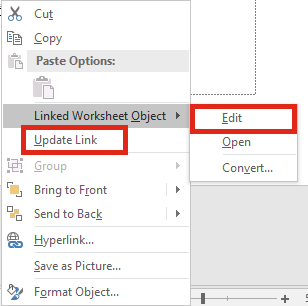
This menu also gives you the option to Edit the link to the original document.
Update with the “edit links” option
On the ribbon click File -> Info -> Edit Links to Files (it’s in the bottom right corner).
The Links window will open, which provides you with various options to update, edit and break links.
My top tips
If you link Excel files to PowerPoint presentations often, you will soon find it doesn’t always behave how you might expect. Here are my top tips to get the best results:
- Use named ranges. Adding rows and columns in a worksheet will not change the link reference in PowerPoint. For example, if PowerPoint is linked to Cell A1, then you inserted a new column at the start, Cell A1 would become Cell B1. But, PowerPoint still references Cell A1. This would now be the wrong cell. A named range helps to ensure the correct range is displayed in the presentation.
- PowerPoint updates links one at a time. If you have 100 links to the same Excel workbook it will open the same Excel workbook 100 times, which can be very time consuming. If you open the Excel document first the updating process is much faster.
- PowerPoint will not know if you change the name or file path of a linked file (see point 4 below for the exception). You need to ensure the most up-to-date version of the Excel file always has the same file name and file path, so that PowerPoint can find it.
- The fastest method of changing the source of an Excel file is to have both the Excel and linked PowerPoint files open. Then save the Excel file with a new path or file name. In this circumstance, PowerPoint will update the reference to the file.

About the author
Hey, I’m Mark, and I run Excel Off The Grid.
My parents tell me that at the age of 7 I declared I was going to become a qualified accountant. I was either psychic or had no imagination, as that is exactly what happened. However, it wasn’t until I was 35 that my journey really began.
In 2015, I started a new job, for which I was regularly working after 10pm. As a result, I rarely saw my children during the week. So, I started searching for the secrets to automating Excel. I discovered that by building a small number of simple tools, I could combine them together in different ways to automate nearly all my regular tasks. This meant I could work less hours (and I got pay raises!). Today, I teach these techniques to other professionals in our training program so they too can spend less time at work (and more time with their children and doing the things they love).
Do you need help adapting this post to your needs?
I’m guessing the examples in this post don’t exactly match your situation. We all use Excel differently, so it’s impossible to write a post that will meet everybody’s needs. By taking the time to understand the techniques and principles in this post (and elsewhere on this site), you should be able to adapt it to your needs.
But, if you’re still struggling you should:
- Read other blogs, or watch YouTube videos on the same topic. You will benefit much more by discovering your own solutions.
- Ask the ‘Excel Ninja’ in your office. It’s amazing what things other people know.
- Ask a question in a forum like Mr Excel, or the Microsoft Answers Community. Remember, the people on these forums are generally giving their time for free. So take care to craft your question, make sure it’s clear and concise. List all the things you’ve tried, and provide screenshots, code segments and example workbooks.
- Use Excel Rescue, who are my consultancy partner. They help by providing solutions to smaller Excel problems.
What next?
Don’t go yet, there is plenty more to learn on Excel Off The Grid. Check out the latest posts:
Why do we need to link Excel to PowerPoint?
Excel and PowerPoint are often used in conjunction with one another to produce financial reports, audit reports, due diligence reports, pitchbooks, investment memorandum, portfolio reviews, and more.
When it comes to budgeting and long-range planning tools, Microsoft Excel continues to dominate; it’s frequently used by accounting and finance professionals at businesses of all sizes.
> Discover 8 Ways to Make Beautiful Financial Charts in Excel
PowerPoint is the most popular choice when it comes to presenting these results. More often than not, people will copy and paste tables and charts from Excel and then add analysis within PowerPoint.
However, when data changes in Excel (for example when you receive the new period’s figures from your ERP system), this means you’ll need to manually update all the tables and charts in PowerPoint whilst being as careful as possible not to make any mistakes. This is when individuals want to link their Excel data to PowerPoint.
If you’re one of those people, you’re in luck; we’ve asked our UpSlide consultants to explain the three different options for linking data between Excel and PowerPoint, to save you some time:
Option 1: Use normal paste options to link Excel data to PowerPoint
- Open the Excel workbook which has the chart you want.
- Select the chart.
- On the Home tab, in the Clipboard group, click Copy (or press Ctrl+C).
- Open the PowerPoint presentation, select the slide that you want to insert the chart into.
- On the Home tab click the arrow below Paste, and then do one of the following:
- If you want the chart to keep the same look and appearance as the Excel file, select Keep Source Formatting & Link Data.
- If you want the chart to use the look and appearance of the PowerPoint presentation, select Use Destination Theme & Link Data.

How to update your data in PowerPoint:
- Scenario 1: PowerPoint and Excel are open and you have just created the link. Any changes on the Excel are automatically changed in your presentation.
- Scenario 2: Your Excel file (saved or not) is open and you have opened your PowerPoint presentation.
Right click on the chart and select “Edit Data” or “Edit Data in Excel”
Note: Do the same if PowerPoint is already open and you have just opened your modified Excel file.
- Scenario 3: Your Excel file is closed:
> “Edit Data” will open the linked data on a basic spreadsheet to allow you to make changes to the input. Changes made here will be saved to that Excel spreadsheet and it will have an impact on your source file. The interface is also limited.
> “Edit Data in Excel” will open the source file.
Limitations for normal Paste options
If you move the Excel file to another folder while the PowerPoint file is closed, the link between the chart in the PowerPoint presentation and the data in the Excel spreadsheet will break.
Likewise, if you duplicate your Excel file, the link will be broken with the new version. Also note that the update is not available when pasting tables.
Option 2: Use Special Paste to link Excel to PowerPoint
- Open the Excel workbook that has the chart that you want.
- Select the chart.
- On the Home tab, in the Clipboard group, click Copy (or press Ctrl+C).
- Open the PowerPoint presentation, select the slide you want to insert the chart into.
- On the Home tab click the arrow below Paste, and then click Special Paste.
- Select Paste Link.
- Select “Microsoft Excel Worksheet Object” or “Microsoft Excel chart Object” if it is a chart.

How to update your data in PowerPoint:
- Scenario 1: PowerPoint and Excel are open and you have just created the link: Any changes on the Excel spreadsheet are automatically made on your presentation.
- Scenario 2: Excel file (saved or not) is open or closed and you open your PowerPoint presentation:
You are asked if you want to “Update the links” or not.
Note: The above process works exactly the same for tables.
Limitations for Special Paste Options
The range of cells pasted into PowerPoint corresponds to a fixed field (example: B2; D10) in the Excel sheet. It means that when you add columns or lines to your tables (example: B2; F15) in Excel, the linked table in your presentation will not extend but will keep the same range of cells (B2; D10) hence providing you with the wrong data.
When you go to re-open your PowerPoint presentation, you are asked to update the links. This scenario can happen…

- If the Excel source file is already open, your presentation will be updated.
- If the Excel source file is not open, it will force the update to occur (this takes some time, even with a small amount of data).
- If the Excel source file has been renamed, it will not update your presentation.
- If you move the Excel source file, the link will not be able to update as it won’t be able to find the file in the original location.
Note: While working on PowerPoint and Excel, if your PowerPoint presentation remains open and you close the Excel file and rename it just after, you will be able to open the Excel source file directly from PowerPoint and update your data. But if you close your PowerPoint presentation while renaming your Excel file, once you open it again you won’t be able to access the Excel source file.
Why the native Excel to PowerPoint Link is restrictive for financial controlling or reporting:
Imagine you are working on a monthly report (May for example), and you duplicate your Excel file and your PowerPoint presentation to update them with the new figures for June. The PowerPoint presentation for June remains linked to the Excel source file of May. You won’t be able to update your presentation with the duplicated Excel file.
> Get to know our Top 3 Productivity Tips to become an Excel Champion
Option 3: Use the UpSlide Excel to PowerPoint Link
As you can see, there are many problems with using the native options when linking Excel to PowerPoint, which is why many people prefer to stick with copy and paste. But manually checking that every figure and comment has been updated properly, plus resizing and aligning tables and charts takes a great deal of time and energy, and opens up the opportunity for errors to occur. So, how can you link PowerPoint to Excel for dynamic data updates?
UpSlide is specifically designed to automatically link Excel and PowerPoint. The link enables you to populate PowerPoint from your Excel data and, if you later change the data, you can update your PowerPoint or Word document with the click of a button.

Without UpSlide, how long does it take to update a 200 page report? A whole day perhaps? With UpSlide’s fast, robust and flexible Excel to PowerPoint link, it can be done in a few seconds.
Benefits of UpSlide’s Excel to PowerPoint Link
- Export Excel tables or charts to PowerPoint or Word with a single click.
- Update your tables and charts with new values, by simply clicking ‘update’. Choose to update one object at a time, or all at once.
- Automatically resize your tables and charts to fit the space. If the Excel data changes, just click once and your document will be updated.
- Rename, move or work on several versions of the Excel source file and still update the linked Excel parts of your documents.
- Export your source data as an enhanced metafile, keeping the file size under control to create size optimized presentations.
- Find the source easily and see when the last update occurred and by whom, all within PowerPoint. UpSlide will know which source is the most recent and should be used for the update.

With UpSlide, be assured that file sizes are kept 10x lighter than with the native paste.
Let’s see in this example. (Presentation weight: Based on 100 simple charts and 100 simple tables).

Evidently, UpSlide’s benefits are numerous, including boosting productivity and ensuring data safety. Discover how UpSlide users in Investment Banking save on average 7hrs/month/user with UpSlide’s main features:

We’re also constantly developing and improving our link to ensure that we can help our users work better in Microsoft Office. We’ve recently introduced four new advanced options, created based on user feedback, to improve your control over how the link works. > Find out more
How to link Power BI to PowerPoint
Do you find yourself creating more reports in Power BI nowadays? Or, are you considering making the transition to Power BI company-wide?
Our Power BI to PowerPoint Link will enable you to leverage your Power BI reports to tell more inspiring stories with your data.
.
We hope you found this useful. Do let us know what you think in the comments!